Abstract
Recently, environmental problems due to livestock odor have emerged in Korea, and technologies to solve these problems are being developed. This study developed a livestock odor monitoring system using ICT technology and an ammonia sensor. This system consists of a sensor, communication equipment, server, database management system (DBMS), and user operating program. The requirements for each component were presented and applied to the system. The livestock odor monitoring system is divided into Livestock Odor Management System (LOMS) and Livestock Odor Control System (LOCS). LOMS comprises a sensor that can measure ammonia in livestock farms or treatment facilities and communication equipment that transmits and receives data. LOCS consists of a server that can receive data and a program to check real-time data. This system will be used for trend analysis using livestock odor data and to plan to reduce livestock odor in the future.
1. Introduction
With the development of large-scale intensive farms in the livestock industry, interest in odor emission has significantly increased [1,2,3]. While the number of domestic pig farms decreased from 539,403 in 1983 to 6181 in 2020, pigs increased from 3,649,000 to 11,365,000 [4]. Livestock odors are characterized by lower concentrations, more complex structures, and more uneven distribution than industrial odors [5,6]. In particular, the livestock industry is limited and shrinking by the livestock odor due to increasing the awareness of a clean environment [7,8,9,10]. The characterization and monitoring technology for odor emission from livestock farms is still lacking. Therefore, it is necessary to overcome the limitations of odor emission and promote the development of the livestock industry by monitoring the sources, types, and control in livestock farms [11].
Odors from livestock farms contain many compounds such as ammonia, hydrogen sulfide, volatile fatty acids (VFAs), and p-cresol [12]. Ammonia is the most common odorous compound on livestock farms [13]. The livestock manure is decomposed at the composting site by artificially controlling the moisture and ventilation system and spraying microorganisms [14]. The livestock manure contains a large amount of organic matter, which is quickly decomposed and turns into an odor. Therefore, the concentration of odor compounds collected during composting is usually higher than the other sources. In the composting process, the temperature moves on a periodic rapid rise at first and then gradually lowers with the change in the concentration of the odor compounds. The concentration of odor compounds remains relatively low at the low-temperature period, while large amounts of ammonia and organosulfur compounds are released from the compost at high temperatures [11,15].
Methods of livestock odor measurement can be classified into sensory analysis and individual odorant analysis. The sensory analysis method uses the human sense of smell to quantify odor pollution with a numerical or literal description based on the corresponding human olfaction to odor gas. Practical and effective analysis methods include odor intensity, concentration, hedonics, and descriptors. Individual chemicals that are odorous should be analyzed quantitatively and qualitatively for further impact assessment of the potential risk of odors to humans, the environment, and biology after sensory evaluation to confirm odor composition’s variety and environmental influence using commonly applied analytical methods for acids, aromatic compounds, aldehydes, ketones, sulfurous compounds, and esters. This analysis is complicated and depends on various instruments [15,16].
With the recent increase in environmental awareness of livestock odor, studies on odor monitoring are increasing. Electronic nose (e-nose) systems have recently emerged as technologies for evaluating livestock odor, and quantitative verification studies have been mainly conducted. E-nose is an alternative technology that provides advantages such as quantitative analysis, fast measurement, high sensitivity and reproducibility, and objective odor identification without prejudice. An e-nose system was proposed for odor management in poultry farms, and the reproducibility was confirmed to be highly correlated with odor and ammonia [17]. In other studies, the verification of VOC concentration using e-nose was performed, and it is suggested as an effective method for detecting and classifying volatile gases in livestock farms [18]. In addition, through monitoring and modeling of hydrogen sulfide mainly generated in livestock farms, gas diffusion was analyzed to control the hydrogen sulfide concentration in ppb units [19].
In this research, to monitor the livestock odor, a USN (Ubiquitous Sensor Network)-based livestock odor monitoring system that can automatically and remotely monitor livestock odors is established as a service related to the livestock industry using IT and sensors. Through this system, managing the real-time livestock environment and developing the livestock industry was purposed by establishing a system capable of measuring and monitoring the livestock environment and alarming the breeding environment through the collected data.
2. Materials and Methods
The livestock odor monitoring system consists of the Livestock Odor Management System (LOMS) comprising the sensor unit that measures odor on a farm, the device of data communicating and a the Livestock Odor Control System (LOCS) comprising the server and program that can check and collect data. The system’s main components include sensors, communication equipment, servers, database management systems (DBMS), and user operation programs. Following is a description of the system using the requirements of each component.
2.1. Sensors
The ammonia measurement sensor mainly used in LOMS is an electrochemical sensor MIX8415 (Mixsen, Shenzhen, China). Since LOMS varies from company to company, there is a possibility that different sensors may be used, but measurement ranges and error ranges are used within the range that complies with the following. The measurement range is 0–100 ppm, and the error range is limited to within 5%. The test gas conditions were performed at 20 ± 2 °C and 65 ± 5% RH, and the baseline range was −4 ppm to 4 ppm.
Before the sensor is installed in the livestock farm, the certification organization must verify the sensor’s accuracy. The verification procedure is as follows. Fix the calibration sensor to the standard gas measuring tank and install it. After injecting standard gas, the stabilized sensor value is measured for 1 min. After removing residual gas by injecting blank gas into the measurement tank, inject the same standard gas again to measure the stabilized value. This operation is repeated five times for each standard gas. Measurement accuracy is calculated by comparing the standard gas concentration with the sensor value for each repetition. The test room is maintained at a temperature of 20 ± 1 °C and an atmospheric pressure of 1013.25 hPa ± 2%. For standard gas, concentrations of 25 ppm, 50 ppm, 75 ppm, and 100 ppm are used.
The electrochemical sensor detects the concentration of the gas by measuring the amounts of electrons (current) generated when the target gas reacts to oxidation or reduction by the built-in electrode. In order to improve the selectivity of the target gas, the filter that physically absorbs or chemically reacts with the interfering gas is usually inserted into the sensor [11,20]. Therefore, the electrochemical sensor is known to have excellent selectivity to ammonia gas and is mainly used in the domestic livestock industry.
The electrochemical gas sensor for ammonia detecting, which has a good selectivity to the gas component and small power consumption, can be miniaturized by the size of the sensor [21,22]. The reaction time (T90) is less than 50 seconds, and the resolution is 0.5 ppm based on 50 ppm, which is 1% of the measured value. However, in a low-temperature environment of less than –10 °C, the detection rate of gas concentration is significantly reduced, and exposure to high concentrations is shortened.
The sensor collecting the environmental information measures the temperature and humidity in the livestock house and transmits it to the remote monitoring and control system. The amount of ventilation information by the control box installed on the exhaust fan is also recognized and transmitted. The humidity measurement range is 0~100%, the tolerance of the temperature sensor is ±0.5 °C, and the humidity sensor is ±0.5% (10~90%). The fan operation rate in the pig house can be checked in units of 0–100%, and the flow rate according to the operation amount of the ventilation fan must be transmitted in CMM units.
As a result of operating the electrochemical sensor for detecting ammonia, the lifespan is about two years, and the correction period is supposed to be every six months. A gas meter; 25, 50, 100 ppm of a standard gas; the gas pressure regulator, and the calibration cap are prepared for calibration to improve the sensor’s accuracy. DC 24V is supplied to the sensor, and then the injection cap is coupled with the sensor before gas injection. The zero is corrected by injecting a standard gas in the atmospheric state. The concentration value of each standard gas is input into the sensor and then injected into the standard gas. The standard gas is injected for 5 min, and the gas pressure regulator is adjusted to complete the calibration.
2.2. Data Communication Equipment
The data communication equipment for short-range or long-distance is used to transmit the collected measurement data to the control system server. The data communication equipment transmits the odor (ammonia) data measured by the sensor and the environmental data measured by the environmental information collection device to the server for the livestock odor control system. The short-range wireless communication device converts a signal measured by the sensor into a digital signal (or digital signal processing). It is responsible for the primary quality inspection of data, visual synchronization, and data transmission or reception. It communicates from the sensor, the data collection device, and the data transmission device to the farm PC through relay nodes and gateways. The measuring data should be transmitted to the LOCS of the Livestock Environmental Management Institute (LEMI) using the Internet network of farm PCs. The relay node is installed inside or outside the pig house to act as the data transmission device, so it is essential to waterproof. When the relay node is installed in wireless communication, Zigbee communication has a transmission/reception distance of 500 m or more and a frequency range of 2.405 to 2.480 GHz. The operating temperature is possible at −20 °C to 60 °C, and Bluetooth or Wi-Fi can be used. The gateway is the same as the relay node of a data collection device, and in the case of a mobile communication network, the transmission distance must be from 11 km to 15 km. Additionally, the frequency range is from 1.4 MHz and 180 kHz. The long-distance wireless communication equipment transmits the data measured by the sensors to farm display equipment and livestock odor control system of the LEMI.
The measuring data should be shown on the display equipment using the mobile or the wired networks, but monthly communication fees should be explained to the management in advance. The relay node is installed inside or outside the pig house to act as the data transmission device, so it is essential to waterproof. The mobile networks should have a transmission distance from 11 km to 15 km and frequency ranges of 1.4 MHz and 180 kHz.
All components comply with the communication protocol because the data must be transmitted to the LOCS. The communication protocol items can be classified into ‘the livestock odor control server approach’, ‘the method of data parameter transmission’, and ‘the configuration of transmission data’. The livestock odor control server approach contains a URL address, which means the LOCS server receives the data from the data transmission device. The method of data parameter transmission, which means the method of sensor list and value, is the POST type. Since the data area transmits parameters, there is no limit to the length of the parameters that can be transmitted, and the sensor list can be expanded. There is an advantage that data is not exposed because the data is included in the HTTP Header portion and then transmitted. The configuration of transmission data is defined as ‘farm & sensor & value’. In this regard, ‘&’ is a separator for distinguishing between a farm, a sensor, and a value. ‘Farm’ is entered as a code promised by the webserver with the data transmission device to distinguish each farm. ‘Sensor’ forms the ‘sensor name@sensor key’ classified as the sensor name and key information on the sensor list. ‘Value’ is expressed to fit the eight items of the result measured by the sensor. The six items are divided into ‘NH3’, ‘Signal1’, ‘Signal2’, ‘NH3 Alarm’, ‘Power Alarm’, and ‘Sensor Alarm’. From ‘NH3’ to ‘Signal2’, it is a float type and represents each measured value. From the NH3 alarm to the sensor alarm, ‘0’ means OK, ‘1’ means alarm, and ‘−1’ means ‘Do not care.’ ‘–1’ is displayed when there is a problem with communication with the sensor or when an item is not collected. For example, when the server receives the message “http://ilemoms.or.kr/insertSensorOu.do?FARM=2106004002&SENSOR=01-NH3@01-NH3&VALUE=5.7,10.3,12.2,0,1,0”, the value was detected by the 01-NH3 sensor at Farm Code 2106004002, as ‘5.7,10.3,12.2,0,1,0’ which means that the complex odor, ammonia 5.7 ppm, Signal1 10.3, Signal2 12.2, NH3, sensor OK, and power alarm generated.
2.3. Server
The server of LOCS consists of DB, APP, Web, and Storage, and is also implemented in the LEMI. The APP and DB prepared the server and backup separated by the web server in the DMZ area. As each manufacturer manufactures the odor measuring equipment differently, compatibility with the LOCS must be accessible. All participating companies have utilized data transmission or reception methods differently, so the server was not XML-based but web-based Open APIs. The demand for Open API-based development stems from the increase in smartphone applications, which provides Open API services on large portal sites because it is easy to access services from users connected to various networks [23]. Accordingly, it has the advantage of expanding, maintaining, and repairing servers that are divided individually from the perspective of the management agency, which aims to install more than 400 ICT mechanical devices. The monitoring server program consists of electronic circuits and programs capable of remembering and correcting correction values of each sensor to deliver them to the communication device with amplifying the results. Values measured by each sensor are transmitted to the communication and the display devices through serial communication in the case of a wired device. In the case of long-distance, it is designed to transmit the data through short-range or long-distance wireless communication devices (IoT).
The management server required information in the livestock house collected from the monitoring management device to be stored in a database, and the OS was based on Linux (Version: RedHat 7.0, Ubuntu, London, UK). In order to run PC-based user operation programs, the monitoring devices using Java-based JEUS (Version: 7.0, Tmax Soft, Gyunggi, Korea) allowed real-time information to be checked through the management server [24].
2.4. DBMS
A database refers to a set of data systematically classified and organized in a storage device to be used in various tasks by an organization. It manages various data such as farms, sensors, installation environments, and companies in charge, and uses users’ functions by providing only the necessary data [25]. The DBMS separates the area of use and management, and also serves to be utilized when a user or program requests the necessary data. The database is implemented to store the environmental information using Tibero. Tibero is a database management system developed in Korea that minimizes data loss by sharing resources on a thread unit. In addition, it is evaluated as having good compatibility with Oracle, MySQL, and DB2 [26].
2.5. User Operation Program
The PC-based user operation program is configured in a web method suitable for real-time monitoring of environmental information accumulated in the management server’s database by period/hour. The data exchange with the management server was developed using the Hypertext Transfer Protocol (HTTP)-based Simple Object Access Protocol (SOAP). In addition, the location of farms and facilities equipped with ICT equipment is to be displayed on the map of the system. The system was configured to analyze the geographical conditions of the farm, weather, and fine dust information by linking GIS information, not just bringing in the map information.
3. Results and Discussion
The composition of the livestock odor monitoring system can be divided into the LOMS and the LOCS. The LOMS, ICT equipment for measuring livestock odor, mainly consists of the sensor (i.e., electrochemical sensor for detecting ammonia and sensor for detecting temperature and humidity), and communication equipment transmitted data to the server. The LOCS is a system that consists of monitoring data transmitted to a server. In this server, data is stored, and a user operation program can use real-time verification and management (Figure 1).
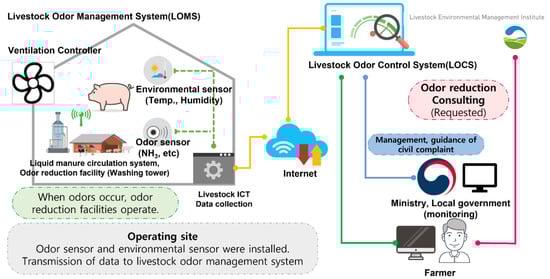
Figure 1.
Schematic of livestock odor monitoring system. Livestock odor monitoring systems can be divided into LOMS and LOCS. LOMS can be measured by attaching a sensor where ammonia is generated, such as livestock farms. LOCS refers to a system that can receive and check measured data and link the two systems using Internet communication equipment.
3.1. LOMS
The LOMS is odor measurement equipment composed of sensors installed on farms, including a sensor detection unit for detecting ammonia, a control unit for operating sensors, a communication unit for transmitting measured data to a central monitoring system, and an enclosure for protecting the device.
The odor measurement equipment, a significant device of the LOMS, was commercialized and produced by private businesses. When selecting a gas sensor, an odor management system generally considers sensitivity, selectivity, stability, reproducibility, and response time depending on concentration, temperature, humidity, and pressure. When a livestock odor measurement market is formed, the product is configured to be selected by the user [27,28,29].
The control unit is a circuit device for amplifying the measurement’s result of the sensor and transmitting the amplified measurement’s result to the communication device, and includes an electronic circuit and program capable of performing a function of remembering and correcting correction values of each sensor. The control unit is designed to minimize power noise, such as a wireless communication module and a data collection device. In addition, the measured sensor values are designed to be transmitted through serial communication in the case of a wired communication device and a display device, and data may be transmitted through short-range wireless communication or mobile network communication if the distance is long. In order to prevent electrical accidents, the connection and wiring of the system control unit must be concealed, or a blocking system must be built-in.
The communication device unit processes the sensor measurement value measured from the real-time odor meter and the control device unit and transmits it to the livestock odor control system. The communication device unit allows the transmission to livestock odor control system servers, farm computers, and smartphones through short-range wireless communication or communication methods using mobile communication networks. When using wireless short-range and long-distance communication, a wired Internet network previously installed in the management is used. A mobile communication network or a wired network should be used when using long-distance wireless communication. However, the contents of monthly communication fees should be explained to the management in advance. The format and communication protocol of the transmission data are transmitted accordingly to suit the control system and server. The communication reception rate should be maintained at least at 99%. The LOMS is shown in Figure 2.
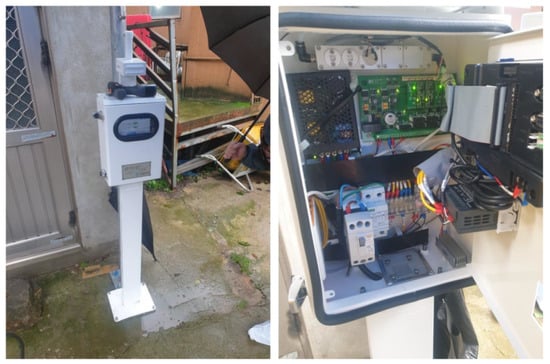
Figure 2.
The outside and inside of livestock odor management system. The sensor case (outside) must protect the inside, and the inside is composed of a measurement sensor, modules, communication equipment, and power terminal.
Fourteen private companies are participating in establishing LOMS, and 265 farms and treatment facilities were installed. Table 1 shows the accuracy measurement results of each company’s sensors before the sensors are installed on the livestock farm. There are 2 to 4 points for measurement in each location. Moreover, this system is generally installed at the border of the farm or pig house. Ammonia data is generated every 30 min from the measuring equipment and transmitted to the server. Table 2 shows the number of installations by region (provinces) and company.

Table 1.
Accuracy measurement results of ammonia sensor.
Table 2.
The number of installations and data by regions (province) and companies.
3.2. LOCS
The LOCS is a system that stores and manages data transmitted from the livestock odor management system in a server. The main functions of the livestock odor control system include a monitoring function to manage data, a sensor information function to manage sensors, a statistical analysis function to analyze and manage data, and other management functions. The purpose of the monitoring function is to provide data transmission volume for each measurement point, real-time monitoring of transmitted data, real-time monitoring status for each stinky substance, expand additional data utilization such as additional sensors and separate measurements, and provide separate screens for farmers, public officials, and managers. For real-time monitoring of data transmission and transmission data for each measurement point, it is implemented to determine the automation classification function for measured odorous substances, updating them in real-time, and the coding design and communication method for odorous substances. For the real-time monitoring status function according to odor substances by branch, the odor status by branch was intuitively displayed on the monitoring screen. Five-step items were classified according to the degree of odor. In order to provide scalability in utilizing additional data such as additional sensors and separate measured values, expandable communication standards and display item expansion functions were implemented. In order to provide separate screens for farmers, public officials, and managers, separate display screens and status for each login authority were provided (Figure 3).
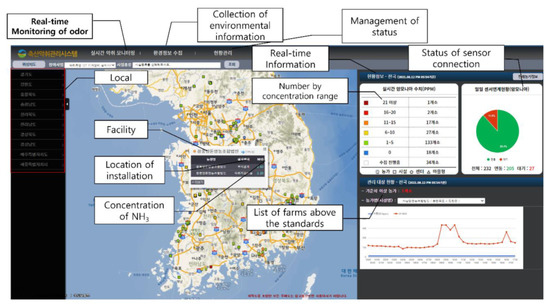
Figure 3.
The main page of the livestock odor control system. The location where the sensor is installed and the real-time ammonia level through GIS can be checked, and also the ammonia generation trends of the farm can be confirmed.
The sensor information function is implemented to identify sensor information by month, region, farm, and installation location by setting detailed search conditions. The modified screen of the logged-in user information was added through the simplification mode. The memo function allows users to input memos for each login subject, thereby implementing the memo function at the bottom of the sensor information. The statistical analysis function is designed to help manage the livestock environment through statistical analysis of livestock odor and environmental data and aims to improve user functions by securing convenience in management and analysis by setting regional representative values and providing report functions for inquired data. An Excel download function was added for statistical analysis of livestock odor and environmental data. The livestock statistics list could confirm the highest, average, and lowest values for the number of animals and breeding area items. However, the environmental information outside the barn is forecast data linked to the Korea Meteorological Administration’s local forecast because it is hard to handle each farm’s environmental information capacity. The function of immediately checking statistical graphs such as odor graphs according to temperature and odor graphs according to the number of breeding heads was constructed. In order to set and manage regional representative values, the function of setting the national ammonia representative values by farm, city, county, city, and province was implemented and set the maximum value of ammonia values in the farm every 30 min. In order to provide a report function for the inquired data, an Excel download function was provided for data that satisfies the conditions of each region, time point, and farm (Figure 4).
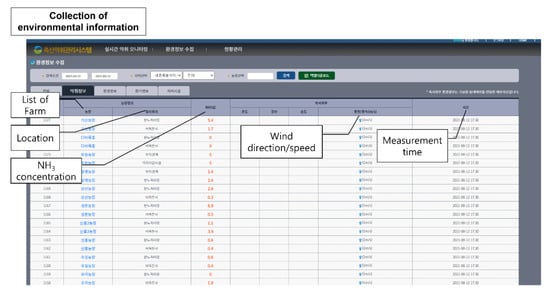
Figure 4.
The web page collects environmental information in the livestock odor control system. The ammonia concentration and the environmental information for each branch can be checked.
As for other management functions, data can be checked daily and weekly by adding a period setting range expansion function, and farm information, ammonia, and in/outside data sections were set to expand the convenience of using statistical analysis. In addition, date conditions and installation location conditions were displayed on the left side of the screen (Figure 5).
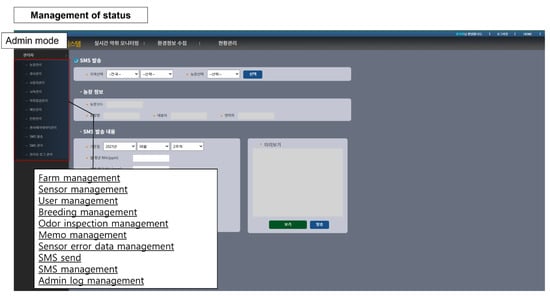
Figure 5.
The web page of management of status in the livestock odor control system (i.e., farm, sensor, user, breeding, odor inspection, memo, sensor error data, SMS send, and admin login information).
3.3. Cost of the System
This section will discuss the construction cost of LOMS and LOCS. Costs of LOMS include the server (including maintenance, operation) and program construction. Costs of LOCS consist of hardware related to sensor installation, such as sensors and data communication modules. The cost of LOMS construction can be divided into server construction, server maintenance, and server storage costs. Initial costs of server and program construction are about USD 340,000, annual maintenance costs about USD 70,000, and server storage costs about USD 20,000 per year. Program construction costs vary depending on the function. Ammonia sensors cost USD 400 to 600 per unit, and replacement costs are required every two years. In addition, additional management costs such as sensor calibration are incurred. The price of sensor units installed on farms such as data communication modules and enclosures, including sensor costs and data communication costs considering replacement, is USD 10,000 per unit.
4. Conclusions
The livestock odor monitoring system is a system that can measure and monitor odors and ammonia generated in livestock farms. Using this system, the farm manager can directly check the ammonia generated to help with livestock environment management. In addition, this system can be used to reduce or prevent the occurrence of odors in specific areas or individual livestock farms where many complaints about odors occur. Through overall monitoring, the degree of odor reduction can be identified, and it can help improve the level of odor reduction activities of livestock farmers. This system is being used to achieve the two objectives of improving the income structure of livestock farms and improving the livestock environment. In particular, if the system is installed in more than 400 livestock farms in the future, it is expected that data on various livestock environments will be accumulated. The system described in this study has limitations in efficiently using the real-time monitoring function of ammonia. The results collected in this system are mainly used to select farms with high ammonia concentrations and to identify problems by visiting the site. In addition, if the measured value is abnormal, the manager visits the site to check the error of the sensor or equipment. The customarily collected data are reported to the government as figures representing the livestock environment. This system was built with the support of the government to manage the odor of livestock farms. LOMS was built at the cost of $340,000 and an additional $90,000 per year for server management costs. The cost of LOCS installed in the farm is about $10,000 per unit, and the maintenance cost of the sensor is additionally incurred. In the future, a more effective operation can be expected if the detection sensor for other substances which cause odor (i.e., sulfur compounds, VOC) is expanded and an analysis function to predict odor generation is added.
Author Contributions
Conceptualization, S.U.Y.; methodology, S.U.Y.; validation, S.M.C. and J.H.L.; formal analysis, S.U.Y.; investigation, S.U.Y.; resources, S.U.Y. and S.M.C.; data curation, S.M.C.; writing—original draft preparation, S.U.Y.; writing—review and editing, J.H.L.; visualization, S.U.Y.; supervision, J.H.L.; project administration, J.H.L.; funding acquisition, J.H.L. All authors have read and agreed to the published version of the manuscript.
Funding
This work was supported by the Korea Institute of Planning and Evaluation for Technology in Food, Agriculture, and Forestry (IPET) through “Livestock Industrialization Technology Development Program,” funded by the Ministry of Agriculture, Food and Rural Affairs (MAFRA) (321091-03-1-HD030).
Conflicts of Interest
The authors declare no conflict of interest.
References
- Van der Heyden, C.; Brusselman, E.; Volcke, E.; Demeyer, P. Continuous measurements of ammonia, nitrous oxide and me-thane from air scrubbers at pig housing facilities. J. Environ. Manag. 2016, 181, 163–171. [Google Scholar] [CrossRef] [PubMed]
- Rappert, S.; Müller, R. Odor compounds in waste gas emissions from agricultural operations and food industries. Waste Manag. 2005, 25, 887–907. [Google Scholar] [CrossRef] [PubMed]
- Post, P.M.; Hogerwerf, L.; Bokkers, E.A.; Baumann, B.; Fischer, P.; Rutledge-Jonker, S.; Hilderink, H.; Hollander, A.; Hoogsteen, M.J.; Liebman, A.; et al. Effects of Dutch livestock production on human health and the environment. Sci. Total Environ. 2020, 737, 139702. [Google Scholar] [CrossRef] [PubMed]
- Statistics Korea, Changes in the Structure of the Livestock Industry through Statistics. Available online: http://kostat.go.kr/assist/synap/preview/skin/miri.html?fn=b5a051833517505231001117&rs=/assist/synap/preview (accessed on 12 October 2021).
- Mahin, T. Comparison of different approaches used to regulate odours around the world. Water Sci. Technol. 2001, 44, 87–102. [Google Scholar] [CrossRef]
- Both, R. Directive on odour in ambient air: An established system of odour measurement and odour regulation in Germany. Water Sci. Technol. 2001, 44, 119–126. [Google Scholar] [CrossRef]
- Deiber, G.; Boudaud, J.; Pourtier, L. Odour studies and health risk assessment two complementary approaches in response to residents’ complaints. Wit. Trans. Ecol. Environ. 2007, 1, 449–453. [Google Scholar]
- Dentoni, L.; Capelli, L.; Sironi, S.; Guillot, J.M.; Rossi, A.N. Comparison of different approaches for odour impact assessment: Dispersion modelling (CALPUFF) vs field inspection (CEN/TC 264). Water Sci. Technol. 2013, 68, 1731–1738. [Google Scholar] [CrossRef]
- Wang, C.; Xi, J.; Hu, H.; Kang, I. Effects of design parameters on performance and cost analysis of combined ultraviolet-biofilter systems treating gaseous chlorobenzene based on mathematical modeling. Front. Environ. Sci. Eng. 2012, 6, 588–594. [Google Scholar] [CrossRef]
- Hanajima, D.; Kuroda, K.; Morishita, K.; Fujita, J.; Maeda, K.; Morioka, R. Key odor components responsible for the impact on olfactory sense during swine feces composting. Bioresour. Technol. 2010, 101, 2306–2310. [Google Scholar] [CrossRef]
- Blazy, V.; de Guardia, A.; Benoist, J.C.; Daumoin, M.; Guiziou, F.; Lemasle, M.; Wolbert, D.; Barrington, S. Correlation of chemical composition and odor concentration for emissions from pig slaughterhouse sludge composting and storage. Chem. Eng. J. 2015, 276, 398–409. [Google Scholar] [CrossRef]
- Wang, C.; Han, F.; Jia, P.; Zhu, Q.; Tong, Z.; Lin, T.; Wang, C.; Liu, Z.; Peng, Z.; Wang, G.; et al. Emissions, measurement, and control of odor in livestock farms: A review. Sci. Total Environ. 2021, 776, 145735. [Google Scholar] [CrossRef]
- Stetter, R.; Penrose, R.; Yao, S. Sensors, chemical sensors, electrochemical sensors, and ECS. J. Electrochem. Soc. 2003, 150, S11–S16. [Google Scholar] [CrossRef]
- Kamp, J.N.; Sørensen, L.L.; Hansen, M.J.; Nyord, T.; Feilberg, A. Low-Cost Fluorescence Sensor for Ammonia Measurement in Livestock Houses. Sensors 2021, 21, 1701. [Google Scholar] [CrossRef] [PubMed]
- Smeets, M.A.M.; Bulsing, P.J.; van Rooden, S.; Steinmann, R.; Alexander de Ru, J.; Ogink, N.W.M.; van Thriel, C.; Dalton, P.H. Odor and Irritation Thresholds for Ammonia: A Comparison between Static and Dynamic Olfactometry. Chem. Senses 2007, 32, 11–20. [Google Scholar] [CrossRef] [PubMed] [Green Version]
- Al-Dalali, S.; Zheng, F.; Sun, B.; Chen, F. Comparison of aroma profiles of traditional and modern Zhenjiang aromatic vine-gars and their changes during the vinegar aging by SPME-GC-MS and GC-O. Food Anal. Methods 2019, 12, 544–557. [Google Scholar] [CrossRef]
- Aunsa-Ard, W.; Pobkrut, T.; Kerdcharoen, T.; Prombaingoen, N.; Kijpreedaborisuthi, O. Electronic Nose for Monitoring of Livestock Farm Odors (Poultry Farms). In Proceedings of the 2021 13th International Conference on Knowledge and Smart Technology (KST), Chonburi, Thailand, 21–24 January 2021; pp. 176–180. [Google Scholar] [CrossRef]
- Weng, X.; Kong, C.; Jin, H.; Chen, D.; Li, C.; Li, Y.; Ren, L.; Xiao, Y.; Chang, Z. Detection of Volatile Organic Compounds (VOCs) in Livestock Houses Based on Electronic Nose. Appl. Sci. 2021, 11, 2337. [Google Scholar] [CrossRef]
- Akter, S.; Cortus, E.L. Comparison of Hydrogen Sulfide Concentrations and Odor Annoyance Frequency Predictions Downwind from Livestock Facilities. Atmosphere 2020, 11, 249. [Google Scholar] [CrossRef] [Green Version]
- Kwak, D.; Lei, Y.; Maric, R. Ammonia gas sensors: A comprehensive review. Talanta 2019, 204, 713–730. [Google Scholar] [CrossRef] [PubMed]
- Sekhar, K.; Wignes, F. Trace detection of research department explosive (RDX) using electrochemical gas sensor. Sens. Actua-tors B Chem. 2016, 227, 185–190. [Google Scholar] [CrossRef] [Green Version]
- Wieser, C.; Helmbold, A.; Gülzow, E. A new technique for two-dimensional current distribution measurements in electro-chemical cells. J. Appl. Electrochem. 2000, 30, 803–807. [Google Scholar] [CrossRef]
- Choi, M.; Jeong, Y.; Park, J. Improving Performance through REST Open API Grouping for Wireless Sensor Network. Int. J. Distrib. Sens. Netw. 2013, 9, 958241. [Google Scholar] [CrossRef] [Green Version]
- Thaker, T. ESP8266 based implementation of wireless sensor network with Linux based webserver. In Proceedings of the 2016 Symposium on Colossal Data Analysis and Networking (CDAN), Indore, India, 18–19 March 2016; pp. 1–5. [Google Scholar] [CrossRef]
- Frank, A. Requirements for a database management system for a GIS. Photogramm. Eng. Remote Sens. 1988, 54, 1557–1564. [Google Scholar]
- Relational Database Management System. Available online: http://www.tmaxsoft.com/products/tibero/ (accessed on 20 October 2021).
- Beatriceveena, V.; Murthy, A.; Prabhu, E.; Gnanasekar, I. Wide range hydrogen sensing behavior of a silver delafossite: Per-formance towards long term stability, repeatability and selectivity. Int. J. Hydrog. 2021, 46, 2824–2834. [Google Scholar] [CrossRef]
- Kannan, S.; Steinebach, H.; Rieth, L.; Solzbacher, F. Selectivity, stability and repeatability of In2O3 thin films towards NOx at high temperatures (≥500 °C). Sens. Actuators B Chem. 2010, 148, 126–134. [Google Scholar] [CrossRef]
- Huang, W.D.; Cao, H.; Deb, S.; Chiao, M.; Chiao, J.C. A flexible pH sensor based on the iridium oxide sensing film. Sens. Actuators A Phys. 2011, 169, 1–11. [Google Scholar] [CrossRef]
Publisher’s Note: MDPI stays neutral with regard to jurisdictional claims in published maps and institutional affiliations. |
© 2021 by the authors. Licensee MDPI, Basel, Switzerland. This article is an open access article distributed under the terms and conditions of the Creative Commons Attribution (CC BY) license (https://creativecommons.org/licenses/by/4.0/).