Article

An Agile AI and IoT-Augmented Smart Farming: A Cost-Effective Cognitive Weather Station

1
NEST Research Group, LRI Lab, ENSEM, Hassan II University of Casablanca, Casablanca 20000, Morocco
2
Department of Computer Science, University of Quebec at Montreal (UQAM), Montreal, QC H2L 2C4, Canada
*
Author to whom correspondence should be addressed.
Agriculture 2022, 12(1), 35; https://doi.org/10.3390/agriculture12010035
Submission received: 13 October 2021 / Revised: 22 December 2021 / Accepted: 22 December 2021 / Published: 29 December 2021
(This article belongs to the Special Issue Internet and Computers for Agriculture)

Abstract

:
Internet of Things (IoT) can be seen as the electricity of 21st century. It has been reshaping human life daily during the last decade, with various applications in several critical domains such as agriculture. Smart farming is a real-world application in which Internet of Things (IoT) technologies like agro-weather stations can have a direct impact on humans by enhancing crop quality, supporting sustainable agriculture, and eventually generating steady growth. Meanwhile, most agro-weather solutions are neither customized nor affordable for small farmers within developing countries. Furthermore, due to the outdoor challenges, it is often a challenge to develop and deploy low-cost yet robust systems. Robustness, which is determined by several factors, including energy consumption, portability, interoperability, and system’s ease of use. In this paper, we present an agile AI-Powered IoT-based low-cost platform for cognitive monitoring for smart farming. The hybrid Multi-Agent and the fully containerized system continuously surveys multiple agriculture parameters such as temperature, humidity, and pressure to provide end-users with real-time environmental data and AI-based forecasts. The surveyed data is ensured through several heterogeneous nodes deployed within the base station and in the open sensing area. The collected data is transmitted to the local server for pre-processing and the cloud server for backup. The system backbone communication is based on heterogeneous protocols such as MQTT, NRF24L01, and WiFi for radio communication. We also set up a user-friendly web-based graphical user interface (GUI) to support different user profiles. The overall platform design follows an agile approach to be easy to deploy, accessible to maintain, and continuously modernized.

1. Introduction

1.1. Smart Farming

Nowadays, the traditional crop management practices remain insufficient to follow the persistent global needs for food. This challenge is mainly driven by the exponential population growth, climate change, and bad agriculture practices. The UN estimates that by 2050, the world population will stand between 9.4 and 10.1 billion. The population numbers will continue rising through the years, and it will reach between 9.4 and 12.7 billion by 2100 [1]. Thus, food production is expected to grow by 70% by 2100 to meet the population’s expansion [2]. Meanwhile, the impact of climate change, is putting productive lands and production under tremendous stress [3], with yearly damages expected to range between 0.1 and 1.0 percent of the gross world product by 2100 [4]. Furthermore, farmers’ mismanagement of crops and the extensive exploitation of resources often lead to soil deterioration through acidification, erosion, and heavy metals pollution [5,6]. Thus, farmers must use different resources such as fertilizers, water, and nutrients in a very optimized way for sustainable food production [7]. Therefore, smart farming presents a tremendous opportunity for farmers to overcome agricultural challenges and protect the environment. Smart farming is described as the application of information and communication technology (ICT) to the agriculture industry in order to improve crop management efficiency. The idea behind this concept consists of combining the most relevant trends in monitoring technologies with the best field practices to assist farmers to overcome the agriculture challenges [8].
Internet of Things (IoT) based systems for smart farming are considered to be the backbone of the fourth industrial revolution. It consists of the implementation of IoT-based systems for continuous monitoring and data analysis. Different heterogeneous sensor nodes are deployed across yields for key environmental processes’ monitoring. Sensor nodes that communicate continuously using wireless sensor networks (WSN) technology to overcome various geographical constraints that wired technologies have in topographic features such as deserts, mountains, rivers, valleys, and lakes. The wireless sensor network is the skeleton for an IoT-based system. It is based on a set of wirelessly connected nodes for network establishment as presented in Figure 1. The wireless nodes are the front gate elements for environmental sensing, data collection, and it can even play the role of the actuator through activities automation such as pumps control, irrigation, etc. However, sensor nodes with limited size and resources, such as power supplies, CPUs, and memory, require an additional optimization layer for optimum efficiency [9,10,11]. Therefore, techniques such as wireless network clustering, as investigated in our work in [12], can improve considerably the network’s energetic performance through the creation of sub-networks and multi-hope communication to limit distances between remote IoT nodes and base stations. Thus, avoiding energy dissipation in long distances. Additionally, the usage of light communication protocols dedicated for IoT sensor nodes, and decentralization where operations that consume the system’s resources are not performed on the sensor node’s level but the BS level side are part of the optimization approaches that enhance different performance.
Undoubtedly, IoT-based solutions for smart farming are tremendously requested by large facilities. However, the penetration of such solutions within small farms is considered limited, especially in the developing economies [13]. This limitation is mainly due to the expensive costs, the complications of maintenance, and the overall performance of different solutions and services. Moreover, the lack of technological knowledge presents a barrier for IoT adoption among farmers [14]. Nevertheless, many researchers around the globe are continuously developing low-cost systems for small farmers, different solutions were gathered in detailed reviews such as [15,16,17,18,19]. In [20], the authors present a low-cost-based agro-ecological management system for smart farming in India. The system performance was tested using the OMnet++ simulation tool. OMnet++ which stands for Objective Modular Network Testbed in C++, is a framework and library based on C++ language. The framework is allowing researchers to create and simulate wireless networks’ communication. In Egypt, the authors of [21] present an agriculture monitoring system based on IoT and artificial intelligence (AI) for decision making. The implemented expert system enables the proposed framework to mimic the ability of a human expert to make decisions on plant diseases. In [22], the authors present a real-time monitoring system for farmers, the “Expert Advisory System” is developed to improve the crop productivity in Uzbekistan. This is can be achieved based not only on the provided environment’s data that supports farmers for their expert judgment (weather status, plant’s diseases, etc.), but also to evaluate precisely the soil needs for healthy plants and therefore good crop and better natural resources’ preservation. The simulation was conducted using Contiki Simulator. In [23], the authors proposed an IoT-based low-cost system for smart irrigation. The system is based on MQTT, HTTP, and Neural Network (NN) for intelligent decision-making. Another low-cost prototype has been presented in [24] in which authors have created a user-friendly system for smart farming. In South Korea, the authors of [25] proposed an adaptive network mechanism for a reliable smart farming system. The technique feature is based on the ability to choose suitable transmission protocols based on the network condition. The system implements Long Range Wide Area Network (LoRa-WAN) and IEEE protocols for transmission. As a smart farming system, the framework allows having a salable transmission system to scale out the platform performance in large farms. Using such as transmission approach will guarantee continuous communication between sensor nodes and the base station. Therefore, it will provide a continuous hands on the farm and its environmental parameters such as humidity, temperature, etc. Additionally the paper investigates some metrics such as latency and data reliability for the system’s validation. The authors of [26] presented an experimental analysis of energy harvesting for IoT devices, as well as a comparison of various wireless technologies for agriculture systems in Canada. IEEE 801.11 g, IEEE 802.15.4, and LoRaWAN protocols are also being investigated. In [27], an IoT system has been proposed for precise ecological monitoring in agriculture domains. The proposed platform is based on different views for different end-users. According to the authors, the architecture is open for an extra layer of protocols and it can be implemented on different servers and cloud-based architectures. In Turkey, an architectural approach based on Farm Management Information System (FMIS) has been introduced in [28]. In [29], the authors proposed an energy-efficient weather station, the system focused on the algorithm optimization to deal with the energy consumption dilemma such as devices high power’s consumption in data sending, data receiving, wireless communication, energy dissipation in different bands within different ranges, etc. Thus, the algorithm focused on the optimization in data transmission through the deployment of asynchronous algorithms that is based on measurement threshold and sleep mode approach. The station considers measurement data is ready when the anemometer’s rotations are reaching a certain value. Thus, if no rotation is detected the BS puts the system in sleep mode for 500 ms. When data is ready, the transmission module doesn’t send the measurement of wind speed unless if it is greater than a predefined threshold. According to the authors, the optimized algorithm had the potential to optimize the energy consumption of the station by more than 60%. In Tunisia, the authors of [30] proposed a low-cost monitoring system for smart farming based on IoT and Unmanned Aerial Vehicles (UAVs). The proposed platform relies on a set of under and above-ground environmental sensors.
To the best of our knowledge, current monitoring systems focus on providing systems to the researchers’ community, rather than providing customized solutions to farmers for their crops management on a real-time basis. The proposed solutions do not address the energy consumption dilemma since most papers focus on technologies comparisons rather than hardware and software enhancement. Current platforms principally rely on light communication protocols to control the energy consumption issue and improve network lifetime. Additionally, the studied solutions in this article rely on very basic approaches when handling the operation and maintenance (OAM) of different components and services. In addition, current systems don’t answer the security dilemma. Some of the most common challenges in IoT are presented in Table S1 (see Supplementary Materials). Additionally, different authors propose low-cost solutions without breaking down the proposed systems’ costs into the cost of investments and the cost of operations. Thus, to overcome some of the challenging issues that the IoT-based systems have, this paper focuses on designing and implementing a sophisticated yet low-cost meteorological system for smart farming. The system is mainly designed based on open-sources software and platforms. The system design takes into consideration the algorithmic optimization in data acquisition, system security, and data presentation. The algorithm design is implemented to overcome the energy consumption dilemma, and it is oriented to improve the end-user experience.

1.2. Rationale of the SW and HW Architecture of the Proposed Method

When targeting deployment of agile systems, we should always put in the heart of our approach the continuous integration and continuous deployment CI/CD philosophy. Thus, in this work, we use the latest technological advancement with new conceptual ideas to deliver an added value. Unlike virtualization which consumes resources, is slow to run, and doesn’t offer isolation between virtual machines (VMs), the containerization technology takes the software design to a new level thanks to the resources’ optimization, high level of isolation, and high speed. Therefore, we build a fully containerized base station based on the open-source containerization platform (Docker). All services within the base station are presented as containers to facilitate the operation and maintenance of the base station’s software components such as database, MQTT broker, etc. Deploying software on top of Docker will allow us to have features such as interoperability, ease of use, scalability, and high performance. Meanwhile, performance can’t be achieved only by using the good software infrastructure (Docker) but also using a highly adequate technology adapted for the exact use case (i.e., weather monitoring). Consequently, classical databases cannot grant high performance. Hence, the time series databases (TSDB) are considered to be the most powerful databases to deal with massive monitoring data. In our work, we use InfluxDB as one of the best current TSDBs. Meantime, when using low-cost hardware, we should avoid pushing the usage of the BS’ available resources to the maximum when we can outsource some of the heavy activities, therefore we use Google Colaboratory (Colab) free computing resources to train our models and offload our base station for other tasks. Once a set of predefined amounts of measurement is recorded, the Debian distribution which is a Linux-based Operating System (OS) within the BS initiates a cronjob to export data into Google Drive, at that point Colab recover the data and start training the prediction’s model. When the model is ready, Tensorflow generates “tflite” and store it back into Google Drive. The model is then sent back to the BS for internal usage within the local webserver. We chose to deploy the open-source LAMP (Linux Apache MySQL PHP) server within our BS. Security is also a challenge in modern systems due to the high exposure to the internet. Thus, in our system, we use different techniques to ensure the system’s security and data privacy. Adoption of a separated cloud server that can only receive data from the base station is very important. The idea is to allow third-party users to consult the dashboard on a cloud server without being able to connect to the local server. Connection to a local server is only dedicated to researchers and engineers through VPN tunnels based on a pre-generated license.

1.3. Objectives and Hypotheses

In the course of pursuing our main objective to build an agile, low-cost, and AI-powered meteorological station, we address the following hypotheses by implementing the corresponding item as described against the bullet points below.
  • The different trained models, within the proposed platform, support the generation of AI-based information to assist different end-users roles such as farmers, researchers, and engineers.
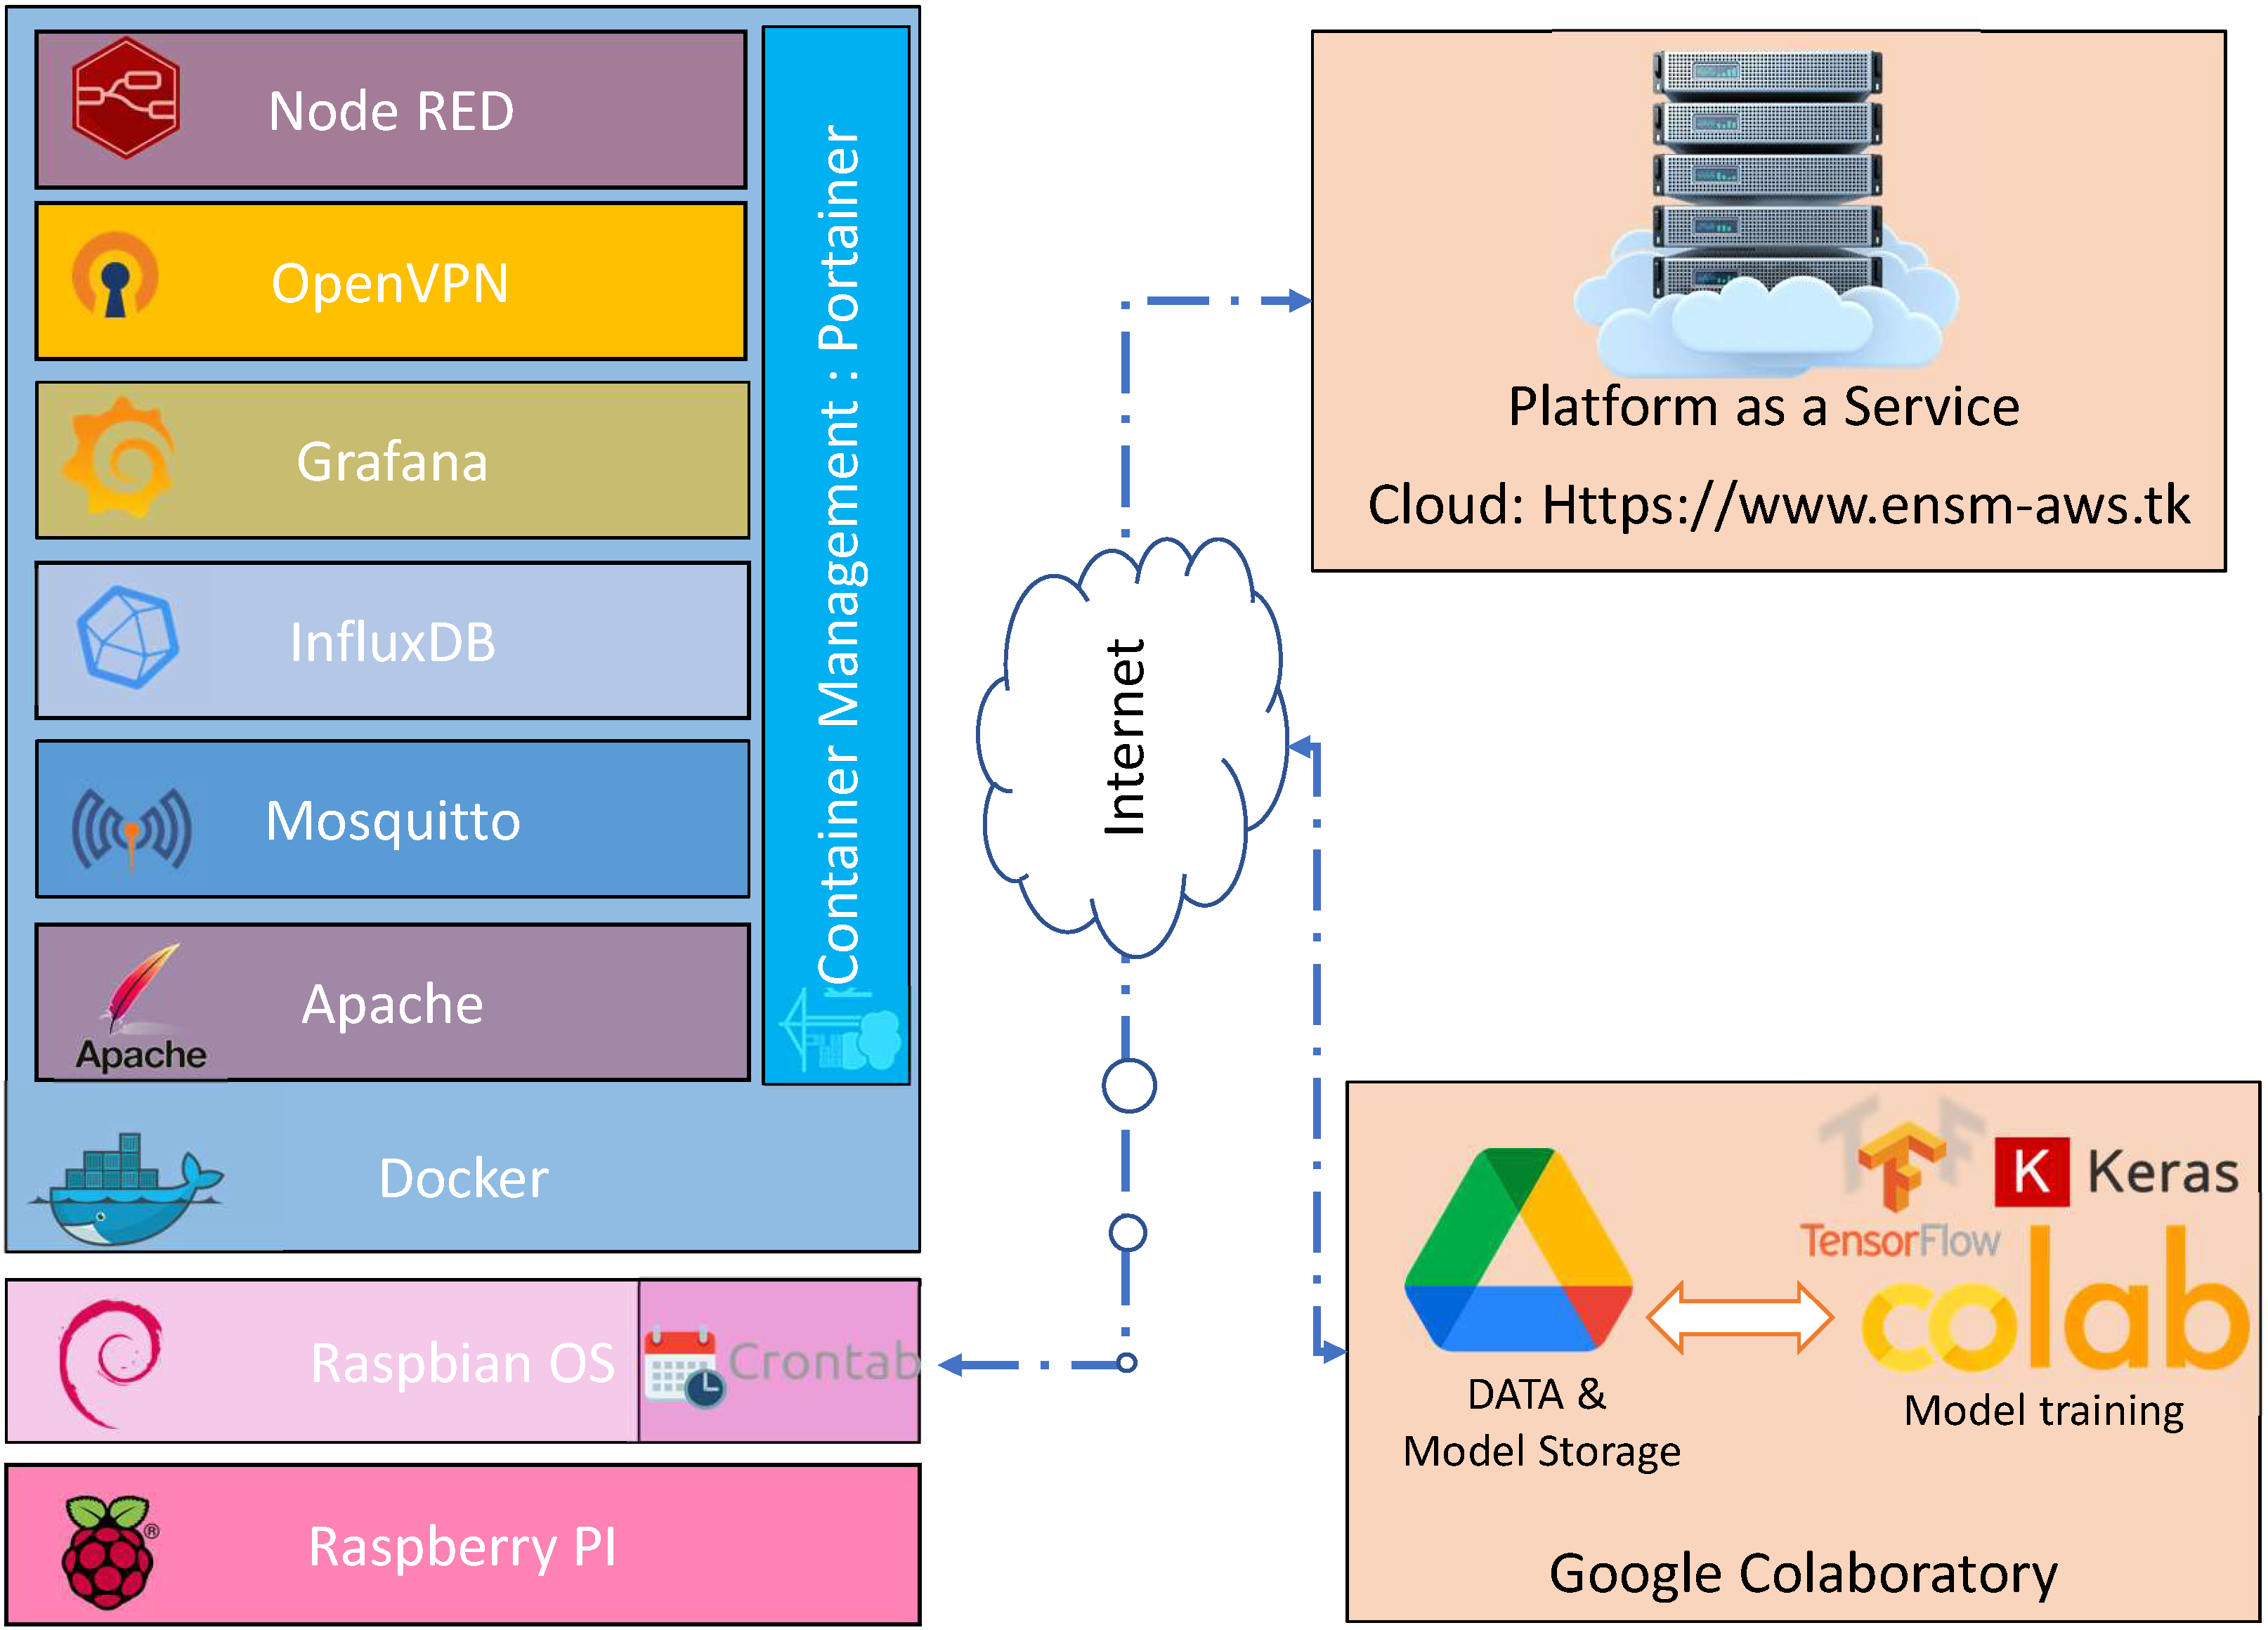
  • The proposed architecture is mainly based on open-source technologies to serve the low-cost philosophy adopted in this paper. The open-source environments chosen to allow us to customize source codes and adapt them for our exact needs with minimal cost of use. Therefore, usage of Debian OS rather than Microsoft OS will allow us to modify easily the OS Kernel to optimize the performance of our station in terms of the boot, background processes, usage of command lines, and enhancing the CPU usage and speed which lead eventually to enhance energetic performance. Furthermore, the long-term goal of the system is to propose a flexible platform based on the layering approach to enable the system’s flexibility and continuous upgrade.
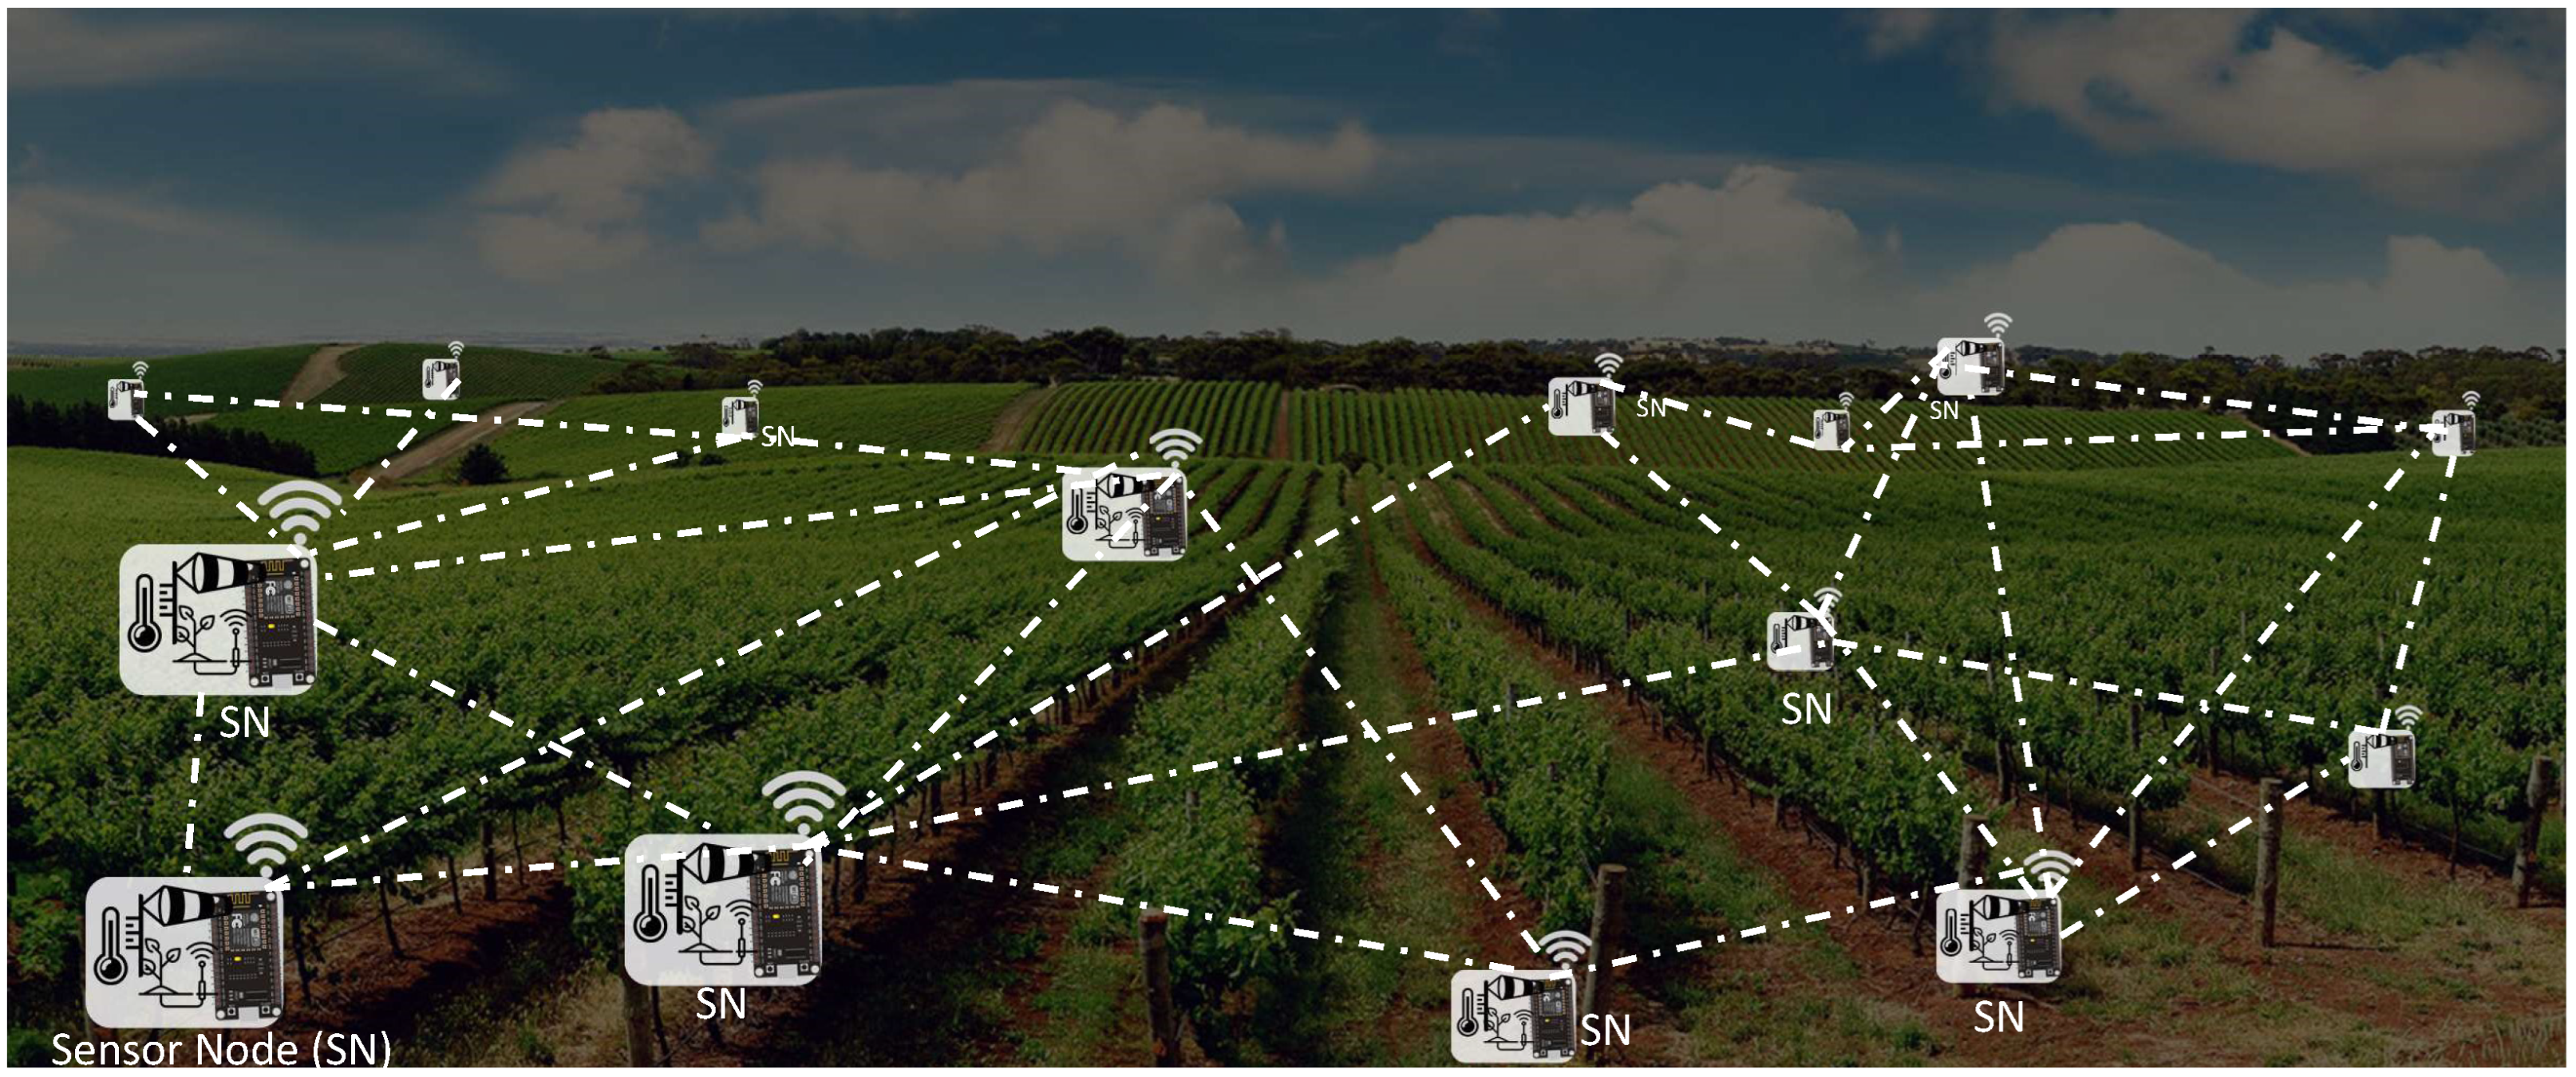
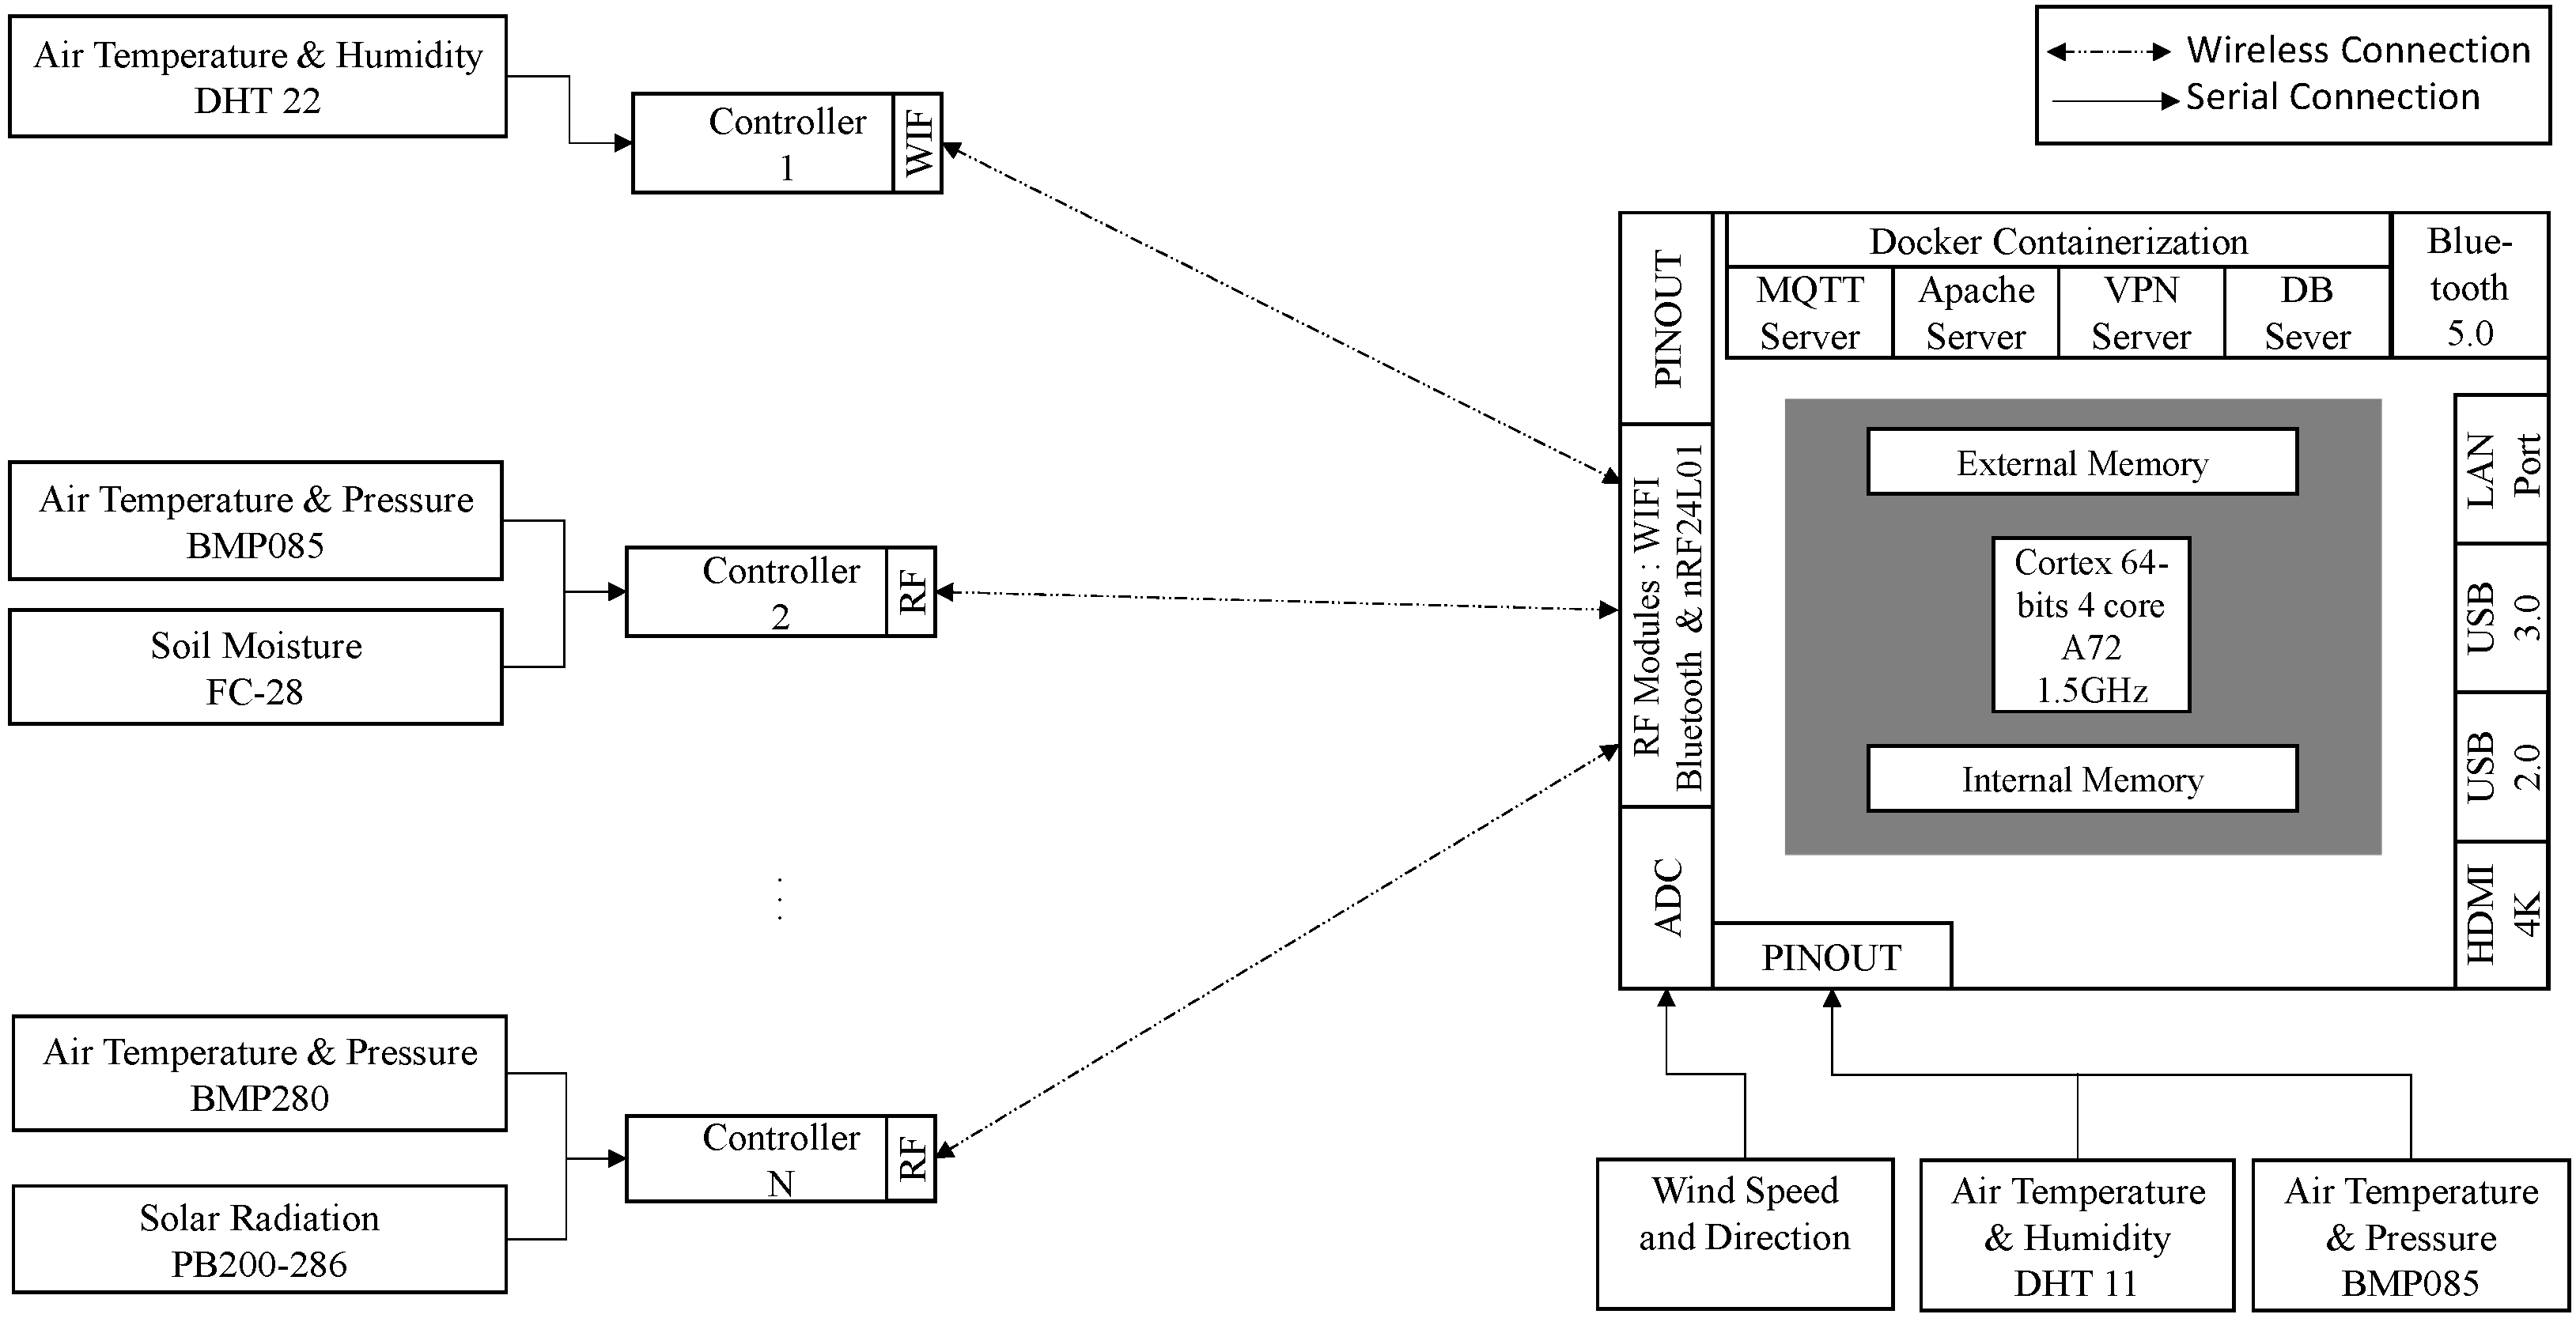
  • The system design follows a hybrid architecture that combines centralized and distributed techniques for devices’ connection which will lead to higher performance. The design enhances the system’s portability, scalability, interoperability, and compatibility with different technologies, protocols, and equipment’s vendors. The Hardware (HW) design is based on deploying heterogeneous nodes that are not dependable on the vendor of the components, the type of the sensors, or the end node performance. The proposed distributed agro-weather station plays a Base Station (BS) role that embeds different agents. The BS is connected to several heterogeneous wireless nodes. The nodes, including the BS, are equipped with different heterogeneous sensors to measure the field’s temperature and humidity, wind speed and direction, and atmospheric pressure. The network continuously monitors the field and provides insights and predictions through a local server implemented within the BS. Since energy efficiency is a crucial metric in IoT systems, our network ensures good energy efficiency management without impacting system performance.
  • The wireless nodes design which is based on standardized transmission protocols such as MQTT allows us to have good interoperability between nodes and different BS. This design approach is also done in order to fulfill the plug-and-play feature in this platform. Therefore, any wireless node within our system can be redeployed within other platforms as long as they follow the same protocol.
  • We design the Graphical User Interface (GUI) layer to ensure visibility, accessibility, ease of use, efficiency, and attractiveness. The software design ensures real-time and near-real-time data communication and processing between network sensors and the base station. The agro-weather station is AI-powered to support farmers and researchers with environment’s data trends and eventually allow them to make fact-based decisions such as when planting, spraying, and even harvesting. Within the BS, the AI is an agent that is connected to an external Google Collaboratory environment (Colab) which is a standalone hosted Jupyter notebook that provides free computing resources for background data analysis and modeling. Even though it is possible to bypass the usage of Colab and rely only on a local Jupyter netbook running on the local server, however, we should avoid consuming local BS resources on the training tasks and allocate these resources for other services such as sensing, wireless transmission, cronjob services, local web-server, etc. The Graphical User Interface (GUI) ensures utility and warranty and avoids complications whenever end users are connected, and data is consulted.
  • The system’s services such as remote access, web services, database updates, and telegram chat-bot are built on top as standalone agents. The multi-agent system (MAS) approach helps enhance the BS performance by creating scalable, reliable, efficient, and maintainable modular services. In addition, the MAS approach enables the stateless configuration of services. Therefore, services can be updated through a Start, Upgrade, and Stop (SUS) approach. The SUS approach allows instant execution of predefined scripts for each operation. The scripts are hosted in accessible repository under/usr/local/bin. The file system/usr/local/bin contains different scripts that normal users can access and use, this repository protects scripts from being modified when the system’s updates are planned or executed. Consequently, facilitating different modules’ operation, maintenance, and troubleshooting.
  • System security approach and design have been implemented in our platform. Access to the BS is ensured locally with user credentials or remotely through a secured VPN tunnel. We deploy OpenVPN within the BS. Meanwhile, because OpenVPN needs to follow an assigned IP address, while our system is connected to a public address, we can overcome this challenge by deploying a NoIP client within our BS that plays the role of a dynamic DNS pointing continuously to a static hostname such as “www.ensem-aws.tk” accessed on 13 April 2021. Different user roles are configured with different roles and privileges. Additionally, offline data snapshots of the OAM & Data dashboards are stored in the cloud and consulted separately.
  • The system building costs are essential in our platform’s design. Capital expenditures (Capex) and operating expenses (Opex) are the leading Key Performance Indicators (KPIs) taken into consideration for solution design and prototyping. Thus, the cost analysis is ensured to support presenting the system’s short-term and long-term benefits for different users.

2. Materials and Methods
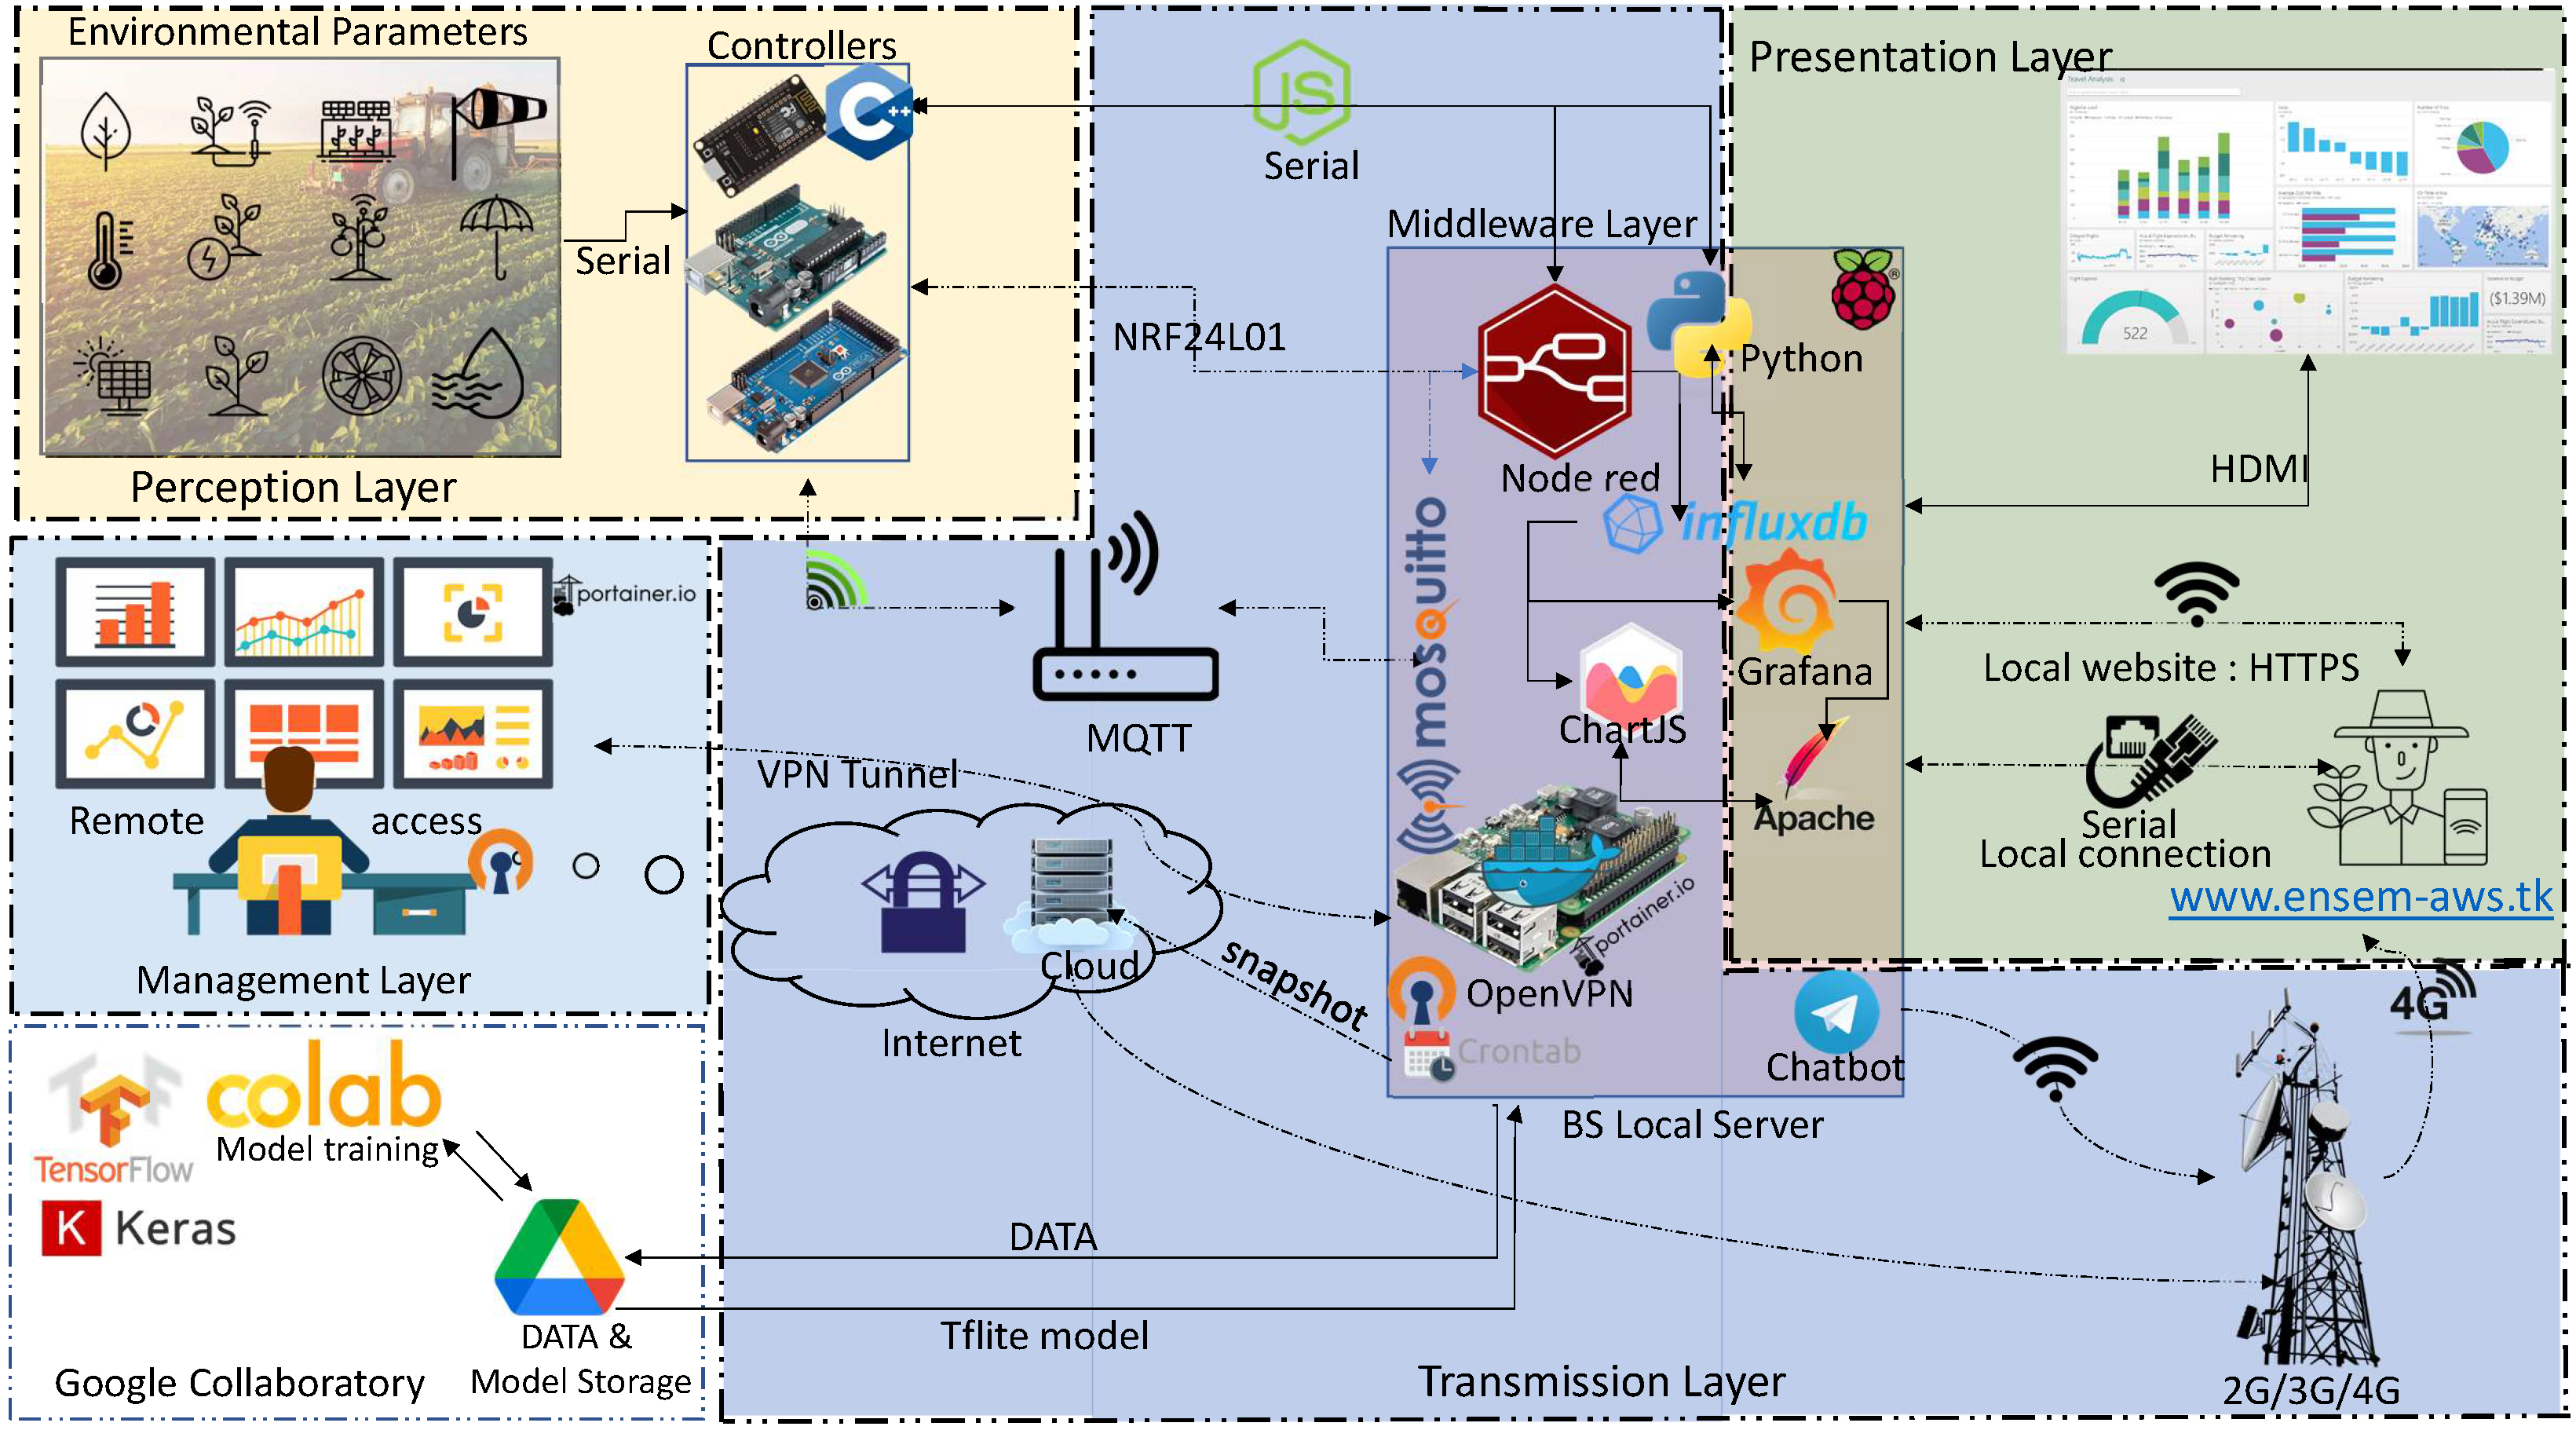
Many contributions have been proposed, and several works are continuously developing IoT-based systems for smart farming. Thus, we propose an agro-weather station (AWS) designed to serve farmers and researchers at once. The system is developed to provide real-time data and AI-based insights for different end-users. The logical architecture illustrated in Figure 2 is based on a multi-layer approach. The system can be seen as a natural evolution and implementation of our previous work in [31]. The proposed system’s high-level design (HLD) is decomposed into four main layers: the perception layer, the transmission layer, the presentation layer, and the management layer. The main role of the perception layer is sensing and collecting data through the network’s deployed heterogeneous sensors. In addition, the perception layer contains different sensors to collect environmental parameters such as temperature, humidity, wind direction, and wind speed. Meanwhile, the transmission layer can be considered as the skeleton of our system. This layer connects the network’s dispersed sensors to the BS through different deployed protocols such as WIFI, NRF24L01, MQTT, etc. The presentation layer’s role is to ensure data collection, processing, and data transformation to trends and insight reports. The presentation layer is based on a graphical user-friendly GUI accessible through different devices such as laptops, mobiles, and tablets. Finally, the management layer is responsible for surveying the system and providing real-time status and alarms of different deployed nodes for reliable system management. In this section, we discuss the research methods in our system’s design. Moreover, we review the several opportunities and challenges that IoT-based systems present for smart farming use case.

2.1. System Design

To effectively implement our system, we adopt an agile methodology approach to develop and deliver the system throughout its different phases as presented in Supplementary Part II (see Supplementary Materials). The agile approach enables a collaborative environment in which different stakeholders such as farmers, researchers, and developers continuously improve the system through its different releases and iterations. The approach starts with the requirement collection phase. In this step, we gather the system requirements that should be implemented according to the stakeholders, such as data visualization, system maintenance, and intelligent-based insights. The requirements are then prioritized according to their relevance and timeline within the analysis phase. The design phase focuses on the hardware and software design approach in complete alignment with the system baseline, such as the low-cost strategy, the portability, the scalability, the interoperability, etc. The development phase consists of the system implementation, where the system is transformed from a design into a prototype. The release phase is the extensive operation and exploitation of the current prototype version for performance analysis. Finally, the monitor phase measures and tracks the system performance and identifies any potential problem or improvement for corrective actions. This last phase is conducted in a proactive way to allow the system’s continuous enhancement.
The design of the agro-weather station follows the multi-layer approach. Thus, in following, we discuss the various system’s layers:

2.1.1. Perception Layer [Back-End]

The perception or access layer is the lowest level of the proposed system model. It consists of a set of interconnected sensors within different nodes. The Perception layer’s primary role is to ensure data collection of different environmental parameters through physical sensors. The deployed sensors collect different agriculture data such as temperature, humidity, pressure, and solar radiation as depicted in Table 1. The standalone nodes are designed in hybrid mode. Nodes can either collect parameters locally and communicate with the BS through serial protocols such as I2C, UART or transmit the data to the BS wirelessly. The BS uses the data to build and continuously enhance the AI-based model for weather forecasting. A model that is fully based on the LSTM approach. The hybrid energy design of the nodes supports a hybrid power supply through solar energy or AC power. Meanwhile, to overcome the IoT devices’ power limitation, the integrated firmware supports different techniques to enhance the energy efficiency of nodes. The technique mainly involves deploying a change point detection algorithm with adaptive communication frequency with the BS [32]. Multiple environmental characteristics are consistent over time in agriculture, allowing the measurement frequency to be adjusted in response to parameter variation. In time-series data analysis, the change point is a critical component. It’s the point in time when a signal’s property (variance, mean, etc.) rapidly changes. The problem of detecting sudden changes in a time series is known as the change point detection [33]. In addition, different agents are deployed to follow the perception layer’s performance. Alerts are programmed to track different nodes’ energy performance and status. The nodes design takes into consideration several baselines such as:
  • Nodes portability: nodes are portable across the network without any physical or logical constraints.
  • Nodes scalability: the nodes can handle additional functions by deploying different sensors in any future nodes’ expansion or upgrade.
  • Nodes interoperability: the nodes can communicate with different BS based on different vendors without critical constraints.

2.1.2. Transmission Layer [Back-End]

The transmission layer is the skeleton of the network that ensures proper communication between its different elements. It focuses on the establishment of transparent and reliable end-to-end data transportation links. The layer transport either wirelessly or locally the nodes’ data from the perception layer to the presentation layer for eventual data formatting. Although wired communication is less energy-consuming than wireless communication, not limited by dedicated radio bandwidth, and it is more secured to remote network attacks. However, wireless communication is highly flexible and easy to deploy in vast areas. It also allows considerable agility in terms of deployment and maintenance with remote access from anywhere and anytime. Several standards and protocols are deployed in our proposed system in a full-duplex mode, such as WIFI (IEEE802.11), NRF24L01, and Bluetooth. Furthermore, the system is open-source, enabling its smooth upgrade and supporting new technologies such as the extension to wireless technologies 2G/3G/4G, Lora, LPWAN, Zigbee (IEEE802.15.4), and Sigfox. Comparison between these protocols is shown in Table 2.
The proposed system supports a connection-oriented transmission mode for reliable transmission or connection-less mode to enhance network connectivity. Wire communication is also deployed in our system architecture to present the different use cases and scenarios the system can handle regardless of data transmission medium.

2.1.3. Presentation Layer [Front-End]

The presentation layer is responsible for reports presentation through formatted data. The designed user-friendly GUI is compatible with different platforms such as tablets, phones, and laptops. The collected data support the creation and enhancement of the AI-based model for weather forecasting. The design of the presentation layer takes into consideration several vital metrics such as:
  • Data visibility: to ensure a high level of clarity that allows farmers and researchers to monitor, analyze and make smart in-depth decisions.
  • Data accessibility: to provide an open and accessible data format that different system’s agents can explore for different use cases such as modeling, training, evaluation performance, etc.
  • Ease of use: to ensure that different user roles can use our GUI comfortably. Thus, we make a baseline that different users should explore report overview in the 30s without compromising data quality.
  • System attractiveness: to create a dynamic and appealing GUI with an attractive and balanced design.
  • System alerts: to monitor the evolution of the critical parameters closely and provide timely alerts through different channels such as emails and telegram chat-bot.
Due to the energy limitations in different IoT nodes, we have chosen to rely on lightweight protocols within the presentation layer, such as the Hypertext Transfer Protocol (HTTP) and The Message-Queue Telemetry Transport (MQTT). HTTP is one of the most popular internet protocols for web messaging that runs over TCP protocol. It is based on request and response architecture [34]. MQTT is a lightweight bandwidth-efficient protocol designed specifically for IoT use cases [35].

2.1.4. Management Layer [Front-End]

The management layer is the central part of the agro-weather station. It provides real-time centralized data monitoring of the BS and different network elements. The layer continuously collects several critical parameters of the base station for an optimized system operation. The main parameters provided by this layer are the processor load, RAM usage, traffic behaviors, network performance, and overall station health checks. The collection of these parameters is done in the background. In addition, the layer allows the remote configuration and monitoring of different thresholds for alerts. The maintenance users can access the management layer through the developed GUI. The access to the GUI is done via an installed end-to-end VPN tunnel from external networks, or locally through the BS LAN port or any device within the same local network.

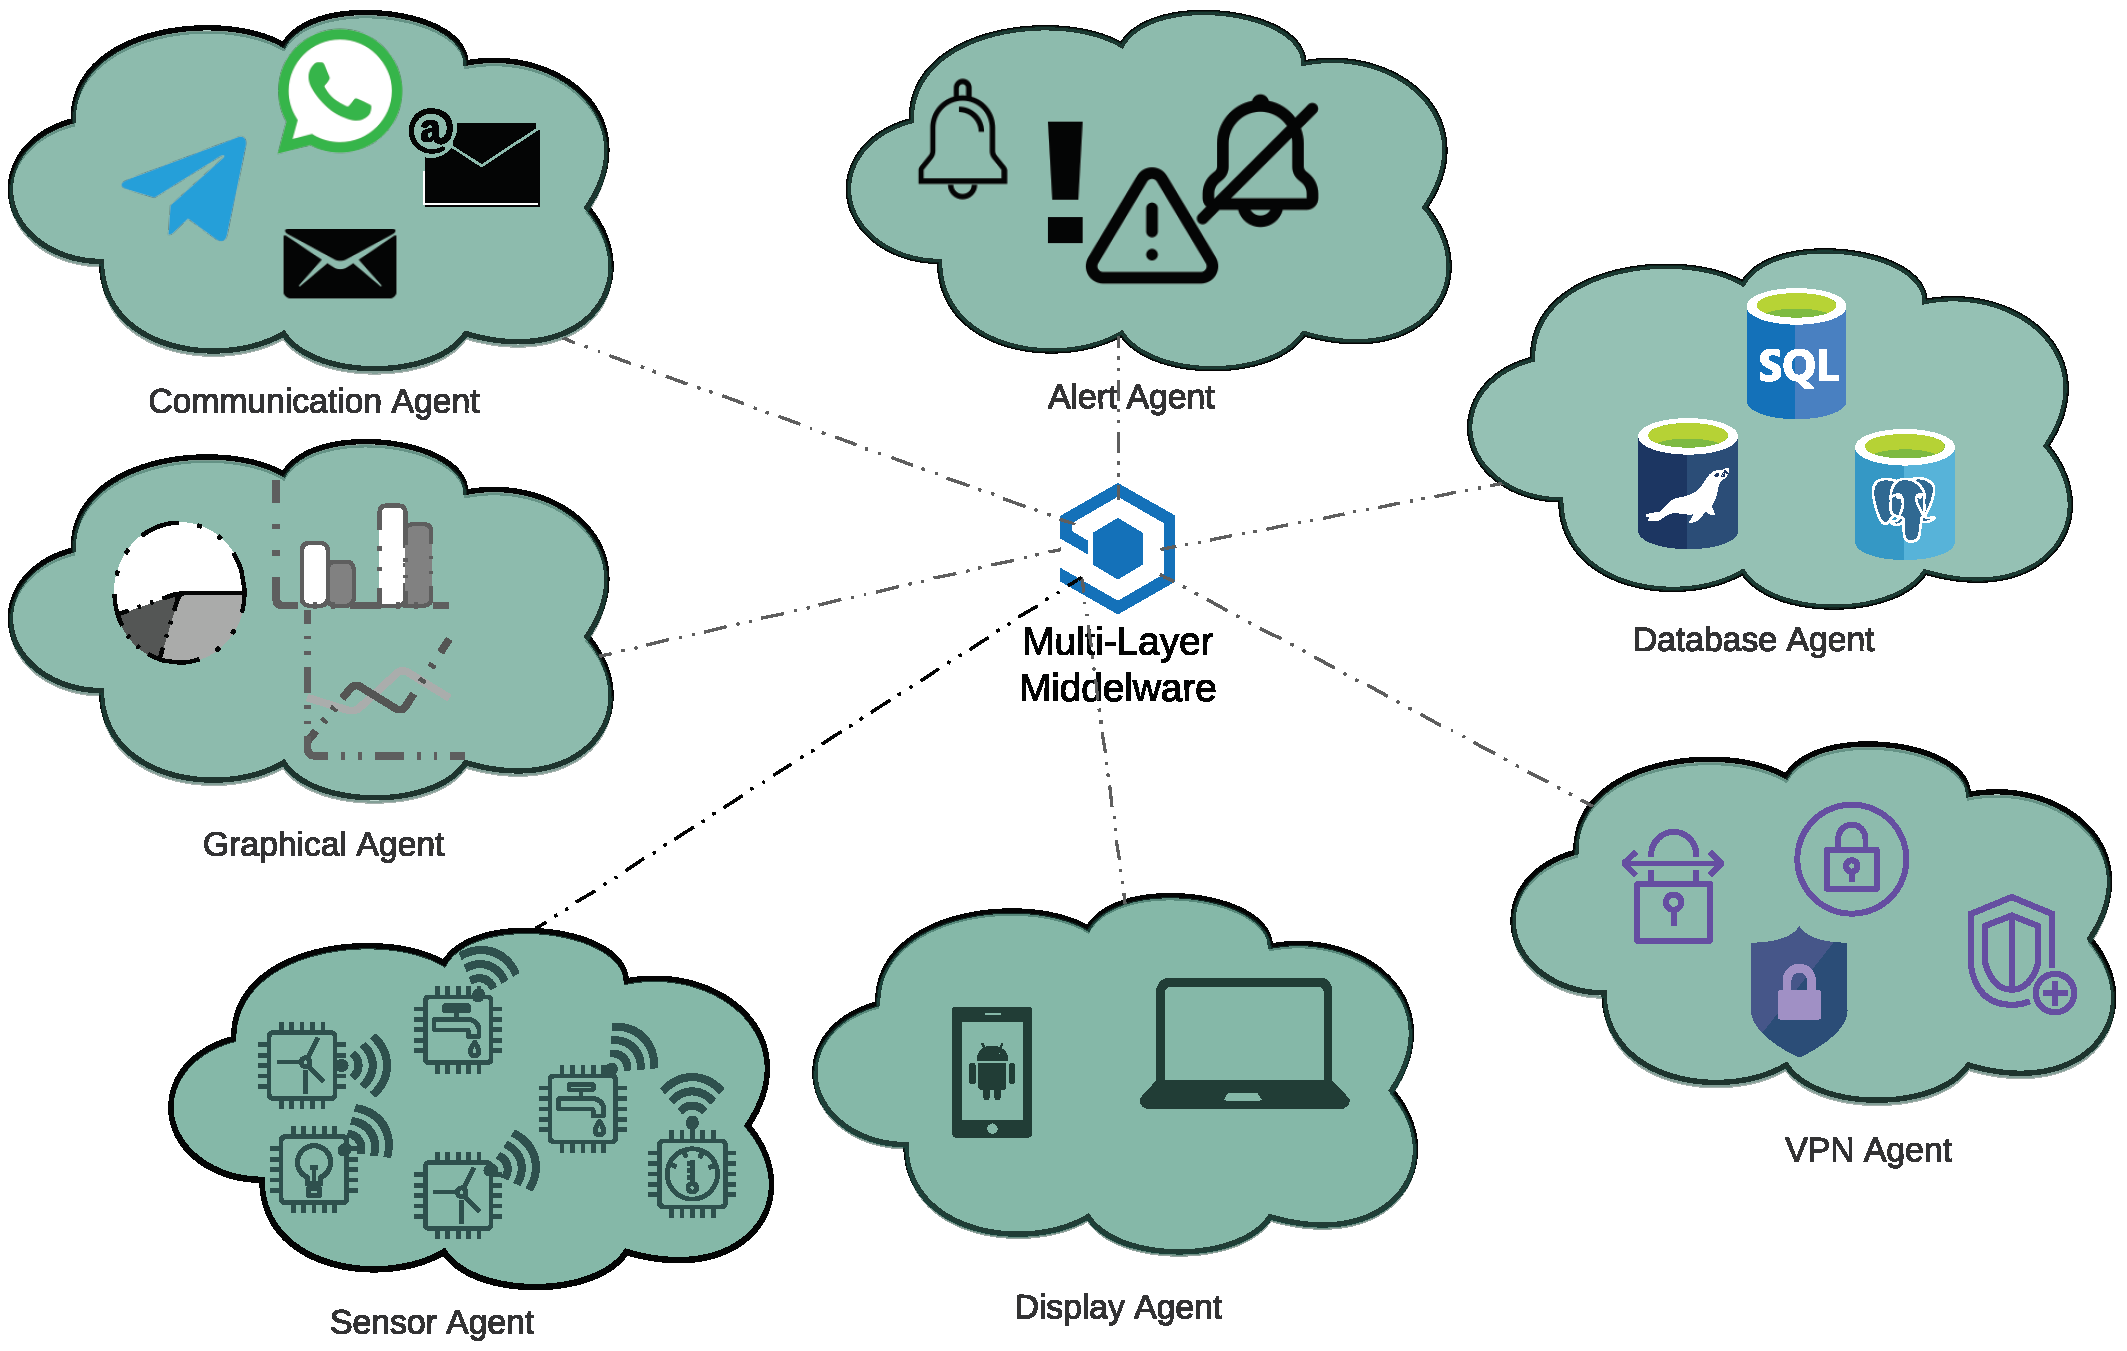
2.1.5. Middleware Layer [Back-End]

The middleware layer plays the role of the orchestrator entity within the base station, which allows it to create interfaces between:
  • The deployed agents that are part of the perception layer and its different heterogeneous sensors and components.
  • The presentation layer and its graphical presentation and reporting.
  • The transmission layer and its protocols.
  • The management layer and its operation and maintenance functionalities.
The middleware layer allows fast deployment of different perception layers’ elements. In addition, this layer contains the database for different parameters management, cloud computing for the data and eventual models training, and the decision-making entity as illustrated in Figure 3.
Since we have described the layers within the platform, we can present the mapping between these layers and main HW and SW functionalities. A holistic presentation is depicted in Table 3.

2.2. System Implementation

In the following, we focus on the end-to-end system design and implementation. For the agro-weather station design, the system is broken down into modules for a better-controlled approach.

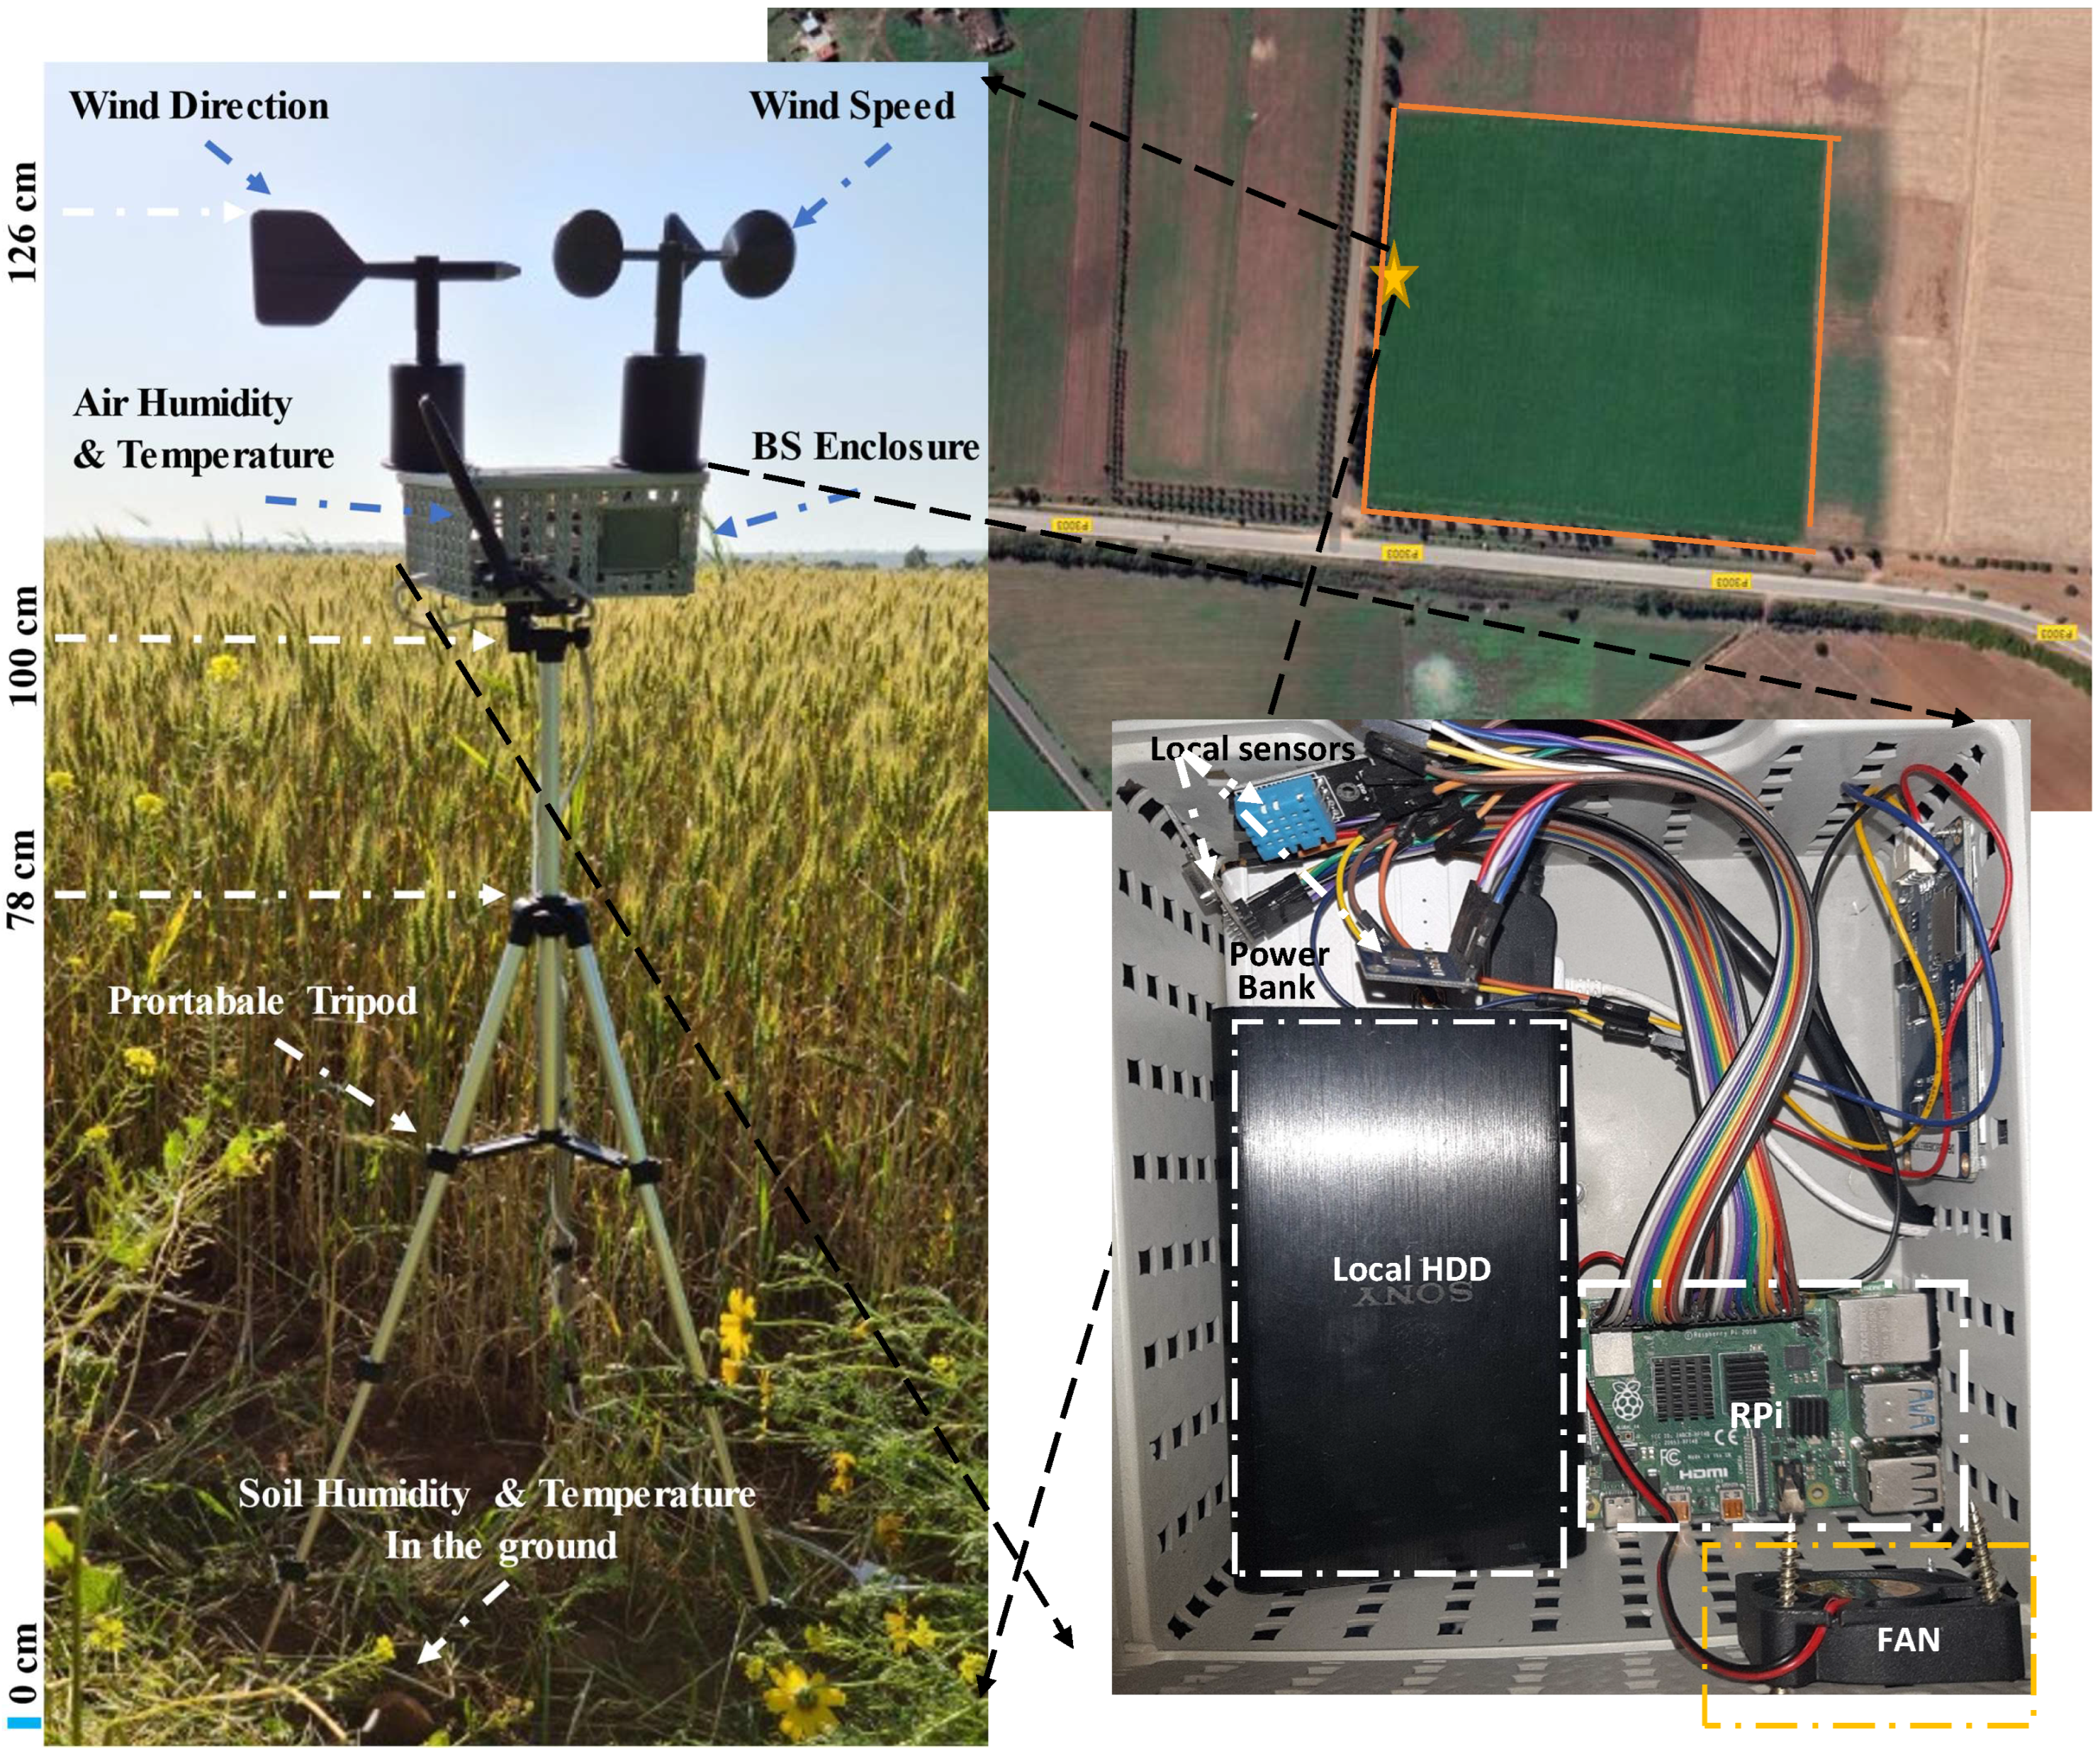
2.2.1. Hardware Design

In this section, we detail the different elements that constitute our agro-weather station as depicted in Figure 4. We address the different components such as the base station, the remote sensors, the microcontroller, the power supply, the radio frequency, and the cloud.
The base station: We use a raspberry pi 4 model B based on a Broadcom BCM2835 system-on-a-chip (SoC). The Soc is based on a quad-core 64-bit Advanced RISC Machines (ARM) Cortex-A72 processor running at 1.5 GHz and a 4 Gb LPDDR4 RAM. The Cortex-A72 processor is one of the high-performance and low-power processors that implement ARMv8 architectures. The BS supports 802.11 Wireless LAN, Bluetooth 5.0, 2 micro-HDMI displays up to 4K resolution, 1 Gigabit Ethernet port, and 28 GPIOs supporting UART, I2C, SPI protocols. The designed BS supports radio frequency communication through an external NRF24L01 chip configured as a master.
The remote sensors: We chose to have wireless deployed nodes that are based on the ATmega32U4 microcontroller unit (MCU). The nodes operate on a 5 V to 9 V power range. The high-performance Microchip microcontroller is an 8-bit AVR RSC-based that operates on a voltage range of 1.8 V to 5.5 V. The MCU combines a read-while-write 32 KB ISP Flash memory, a 1024 B EEPROM, 2 KB SRAM and 23 I/O. The MCU supports UART, SPI, and I2C. The MCU can operate under extreme weather condition that varies between −40 °C to 84 °C [36].
The designed node supports WiFi through an ESP8266 chip and radio frequency communication through the NRF 24L01. The MCU supports up to 126 RF channels with GFSK modulation, which allows a data rate up to 2 Mbps. When a high data rate is configured, the NRF24L01 allows the configuration of different saving techniques such as sleep mode and standby mode [37].
Sensors: To continuously survey meteorological data, keep the low architecture cost and align with the initial system specifications. We have chosen to deploy the sensors that respect the technical specification illustrated in Figure 4.
Capital expenses: To make the agro-weather station affordable for the end-users, the strategy of the design consists of relying on scalable open source components and migrating HW-based services to SW-based services whenever it is possible. The idea behind this migration is to lower our cost while keeping the same functionalities that HW offers. The migration can be seen in:
  • The deployment of Telegram Bot messaging services instead of cellular messaging for alert generation.
  • The use of remote accessible web-based services for data visualization instead of local screen. Tools such as Grafana and Chart.JS library.
However, even though the migration philosophy is prioritized, the end-to-end hardware architecture is fully open and supports any future upgrade or modernization. The entire system cost is given in Table S2 (see Supplementary Materials).
Operating expenses: While capital expenses are invested in the project startup to accommodate the solution, the Operating Expenses (Opex) represents the day-to-day expenses to run the platform. These expenses can be seen as the fixed costs that need to be ensured to operate the system. Since the system deployment will be a win-win relationship between farmers and researchers, who will be playing the role of system maintainers. The farmers will benefit from customized data for their crops and fields, while researchers will collect in-depth geographic-related environmental data for their uses. Data that can be explored to understand the study area. The OPEX related to the power consumption is negligible due to the minimal power usage and the low price of energy. In a country like Morocco, the KWh cost is less than $ 0.12 . In [38], authors present an in-depth analysis on different board models under different scenarios, study shows that the consumed power of an Arduino Uno board in single-byte transmission over Xbee S2B module is around 1.04 W using microwatt-meter. The power consumption of the Raspberry PI 4 B board in full load is around 7.6 W, while it is 2.25 W in idle mode. An extensive study has been done in [39] for a similar Raspberry board (PI 3 B+). The OPEX breakdown is provided in Table S3 (see Supplementary Materials).

2.2.2. Software Design

The system performance, agility, and security are among many metrics chosen to assess the scalability of our agro-weather station. Therefore, in this session, we address the system’s software design approach and methodology as they are critical components in the system’s operation.
System architecture: Since one of our goals is system interoperability, two architecture scenarios can be deployed—virtualization for hardware abstraction and containerization for system abstraction Figure 5. Virtualization consists of deploying virtual machines (VM) with a dedicated operating system (OS) within the base station. It is possible based on a physical allocation of hardware resources such as memory, storage, and network. However, the approach has many drawbacks on system scalability and performance due to the boot-up process, system speed, cost of implementation, system dependencies, software updates, networking overheads, and virtual machine size. Thus, to deliver the system in an agile methodology and minimize HW and SW resources, we chose the containerization scenario that performs the virtualization to the OS side and allows the ease of modules maintenance without compromising the continuous integration of services and modules. The authors in [40], provides a performance analysis of the two technologies based on the CPU performance, Disk I/O, and other metrics.
We chose to implement a containerization approach to separate the deployed software architecture from the hardware infrastructure. By adopting this approach, we were able to deliver the system quickly. Even though several open-source operating systems are customized to run on Raspberry Pi, such as kali Linux, Windows 10 IoT Core, Ubunto core, and Pidora. We chose to run over an optimized and stable Debian image called Raspbian. The Raspbian open-source operating system (OS) has multiple advantages, such as being very optimized to be run on Advanced RISC Machines (ARM), a family of Reduced Instruction Set Computing (RISC) architectures for computer processors that is extremely suitable for System on Chips (SoCs) such as Raspberry Pi. The OS is subject to continuous development, and it has a very active community for excellent support. All implemented services act as standalone services. Thus, the development and integration of different services can be done independently from technological bounds. The product development life cycle approach allows continuous improvement of the OS’ products and services through 4 main stages: OS’ introduction, OS’ growth, OS’ maturity, and OS’ decline.
Even though it is possible to create containers without a specific toolkit, however in our work we use Docker since it is a fully open-source containerization platform that allows mounting container’s image efficiently. Docker allows us to build, deploy, upgrade, and manage containers in a simple and straightforward commands’ approach command-line interface (CLI). Another important component deployed is the Portainer tool that allows the same tasks through a lightweight management Graphical User Interface. Portainer plays the role of self-service container manager, it allows managing all containers hosted within Docker and grants the privilege of registration of new containers such as OpenVPN, influxDB, etc. It also allows the quick setup of different containers functionalities such as making a container open or secure, public or private within a network which allows the interoperability, scalability, and ease of use in the Operation and Management of the local base station.
Data base: When developing scalable systems, the choice of the type of databases is very crucial for the end-to-end system design, especially in the back-end design, where real-time data storage and data retrieval are important. Several types of databases are used in data management, such as relational and time series. While traditional relational databases are fully supported by SQL and perform incredibly in displaying large datasets, it performs poorly regarding the history of the stored data. Thus, the time series databases (TSDB) such as the open-source InfluxDB are considered very scalable and efficient when handling time-series data [41]. In our system, we use a container-based image of influx DB for different time-series parameters. Dedicated agents ensure data storage of different wireless nodes in the database.
Local Web server: To manage local web-based content such as images, scripts, and HTML files and allow a local web-based interaction between BS and different web users, we have deployed a local web server based on the open-source Apache. The server serves different technologies such as HTML, CSS, HTTP, and PHP. The apache server hosts the complete version of the website and local applications and databases. When an automated script needs to be executed according to planning it is not the local webserver that does that but rather it is the OS that executes it. This can be needed when measurements need to be sent to the Colab server for model training, the Cronjob sends all measurements that are on InfluxDB to Google drive (updating an existing excel). Colab then gets the link from Google drive and recovers the data and runs the modeling. Once the model is obtained Colab is then converting it to “tflite” and storing it on Drive. The model then is sent back to BS to be used in the local server within the BS. The local server runs the “tflite” model from TensorFlow and embeds it within the local website as depicted in Figure 6.
MQTT Brocker: MQTT is an OASIS-recognized Internet of Things communications protocol. It’s built as a super-lightweight publish/subscribe messaging transport that is perfect for linking different IoT devices with minimal network resources. MQTT is now used in many industries, including automotive, manufacturing, telecommunications, etc. Within our base station, we deploy the open-source container-based broker named Mosquitto that runs MQTT 3.1.1 version. Once the sensor nodes (clients) are configured and pointing to the server broker, all clients can broadcast messages (publisher mode) or receive messages (subscriber mode). The communication is done without a direct point-to-point connection between publisher and subscriber. The configured client in our platform is an ESP32-based wireless sensor node. The broker doesn’t store the received data and sends it directly to the time-series database.
Configuration: Since the base station is based on Debian distribution, we can run our script using, literally, any programming language. However, to be consistent, we have chosen to configure components using either shell (SH), C/C++ language, Python, or Node-RED. All cronjob scripts for automation are created based on SH. Meanwhile, all remote nodes such as ESP32, Arduino micro, Arduino Uno, and ESP8266 are configured using C++ languages. Additionally, the scripting within the Bs such as remote connection with Google drive, Chatbot, local sensing is done based on Python. Finally, the interaction between the base station and Mosquitto, influxDB, external wireless nodes are done through Node-RED. Node-RED is a visual programming tool that was originally developed by IBM for connecting hardware devices, APIs, and web services as part of the Internet of Things. Node-RED includes a flow editor that is used to construct JavaScript functions in a web browser. Node-RED run-time is built on top of NODE.js.
Cloud: The data storage model in our architecture is based on a hybrid approach where local and cloud-based storage is implemented. Locally, the BS station stores data on the Hard Disk Drive (HDD) and SDCard. The process is also ensured through simultaneous use of the storage as a Service (STaaS) cloud computing model to transfer and backup the critical measurement data, such as Dropbox, Google Drive, and One Drive. The data backup process is ensured based on a pre-configured agent in a cronjob on the BS. The service is deployed to serve as backup to ensure any data restoration in case it is planned. The multiple data duplication strategies are designed to protect the system against data loss or corruption and ensure that the BS services’ availability is guaranteed.
We use the cloud also as a “Platform as a Service” (PaaS) to run our web-based server on which the website and different BS services are hosted. The could is being accessed remotely for a read-only mode. For security reasons we don’t allow real-time data consultation except through the VPN which requires pre-generated certificates. Meanwhile, other users may need to consult historic data, but still, they aren’t granted VPN access and they aren’t onsite to connect locally, for this reason, we have created a separate entity which is the cloud. The cloud hosts our website www.ensem-aws.tk which is an offline version of the local server deployed on the base station. The base station has unidirectional communication with the cloud which means only BS can push snapshots of the data (measurement and dashboards) but reversed communication is not allowed. Different service providers propose cloud services as public, private and hybrid solutions, providers such as Amazon Web service, Microsoft Azure, and Google cloud are the market’s leaders. In our work, we use Namecheap cloud services for the hosting, the choice is driven by the cost-effectiveness strategy. However, the created services are not related to any vendor, and migration between cloud services is easy with the right set-up (DNS configuration).
VPN access: One of the crucial metrics is the platform security and its immunity to external access and attacks such as Denial of Service attacks DOS or Distributed DOS (DDOS). Since the BS is a lightweight server that needs to be optimized for resource deployment and usage, we configure a virtual private network (VPN) for secure connection establishment. The VPN allows the creation of end-to-end private tunnels between clients and the server, allowing external users to access the BS through open yet dedicated ports. In our BS, we implemented OpenVPN, one of the robust open-source VPN servers that support Secure Socket Layer (SSL) and Transport Layer Security (TLS) protocols. The secured channels are established by creating a Full-tunnel where all clients’ traffic is directed through the VPN tunnel or the split tunnel where the only specified type of traffic is redirected. The tool supports IPv6 for the virtual private networks and can be executed over User Datagram Protocol (UDP) or Transmission Control Protocol (TCP). OpenVPN supports up to 500 VPN certificates generation and 100 tunnels connection at the same time. The certificates are deployed on the end user’s clients’ accounts.
GUI: The Graphical User Interface is deployed for a human-to-machine graphical environment. It is designed in a User-Centered Design (UCD) approach, where the end-users needs are prioritized, and restless re-adapting is applied. The GUI can be seen as a set of web services and applications hosted on an Apache webserver. The web application is organized into different sections with different dynamic pages such as the home page, login page, weather dashboard, BS maintenance dashboard, and contact page. The dashboards are customized to display different parameters within different time ranges. Data presentation is dynamic, and users can specify the time range and frequency of data updates such as 1 s, 5 s, and 10 min. GUI is mainly built on top of Grafana and Chart.JS library for the embedded part within the local website.

2.2.3. Neural Network Model

Weather forecasting or prediction can be seen as the application of various techniques to predict meteorological parameters. Many techniques are used in the literature by different researchers, such as Machine Learning and Deep Learning. Machine learning’s popularity comes from its ability to identify the most relevant features within an appropriate model. Various approaches are used, like Support Vector Machine (SVM), Artificial Neural Network (ANN), or Recurrent Neural Network (RNN). Since meteorological data is considered as a non-linear multidimensional time series problem [42] the adopted network model has to reflect the temporal features within the dataset [43]. Thus, the long-term and short-term model (LSTM), introduced by [44] is one of the best approaches to deal with weather forecasting. We use a Recurrent Neural Network System (RNN) that supports time series as inputs in our system.
The usage of LSTM in models building and training allows us to have greater accuracy. In our work, the trained LSTM model enables training and forecasting future data based on historical multi-variate time series (sequential data). A brief description of LSTM structure and workflow is given in Supplementary Part IV (see Supplementary Materials).

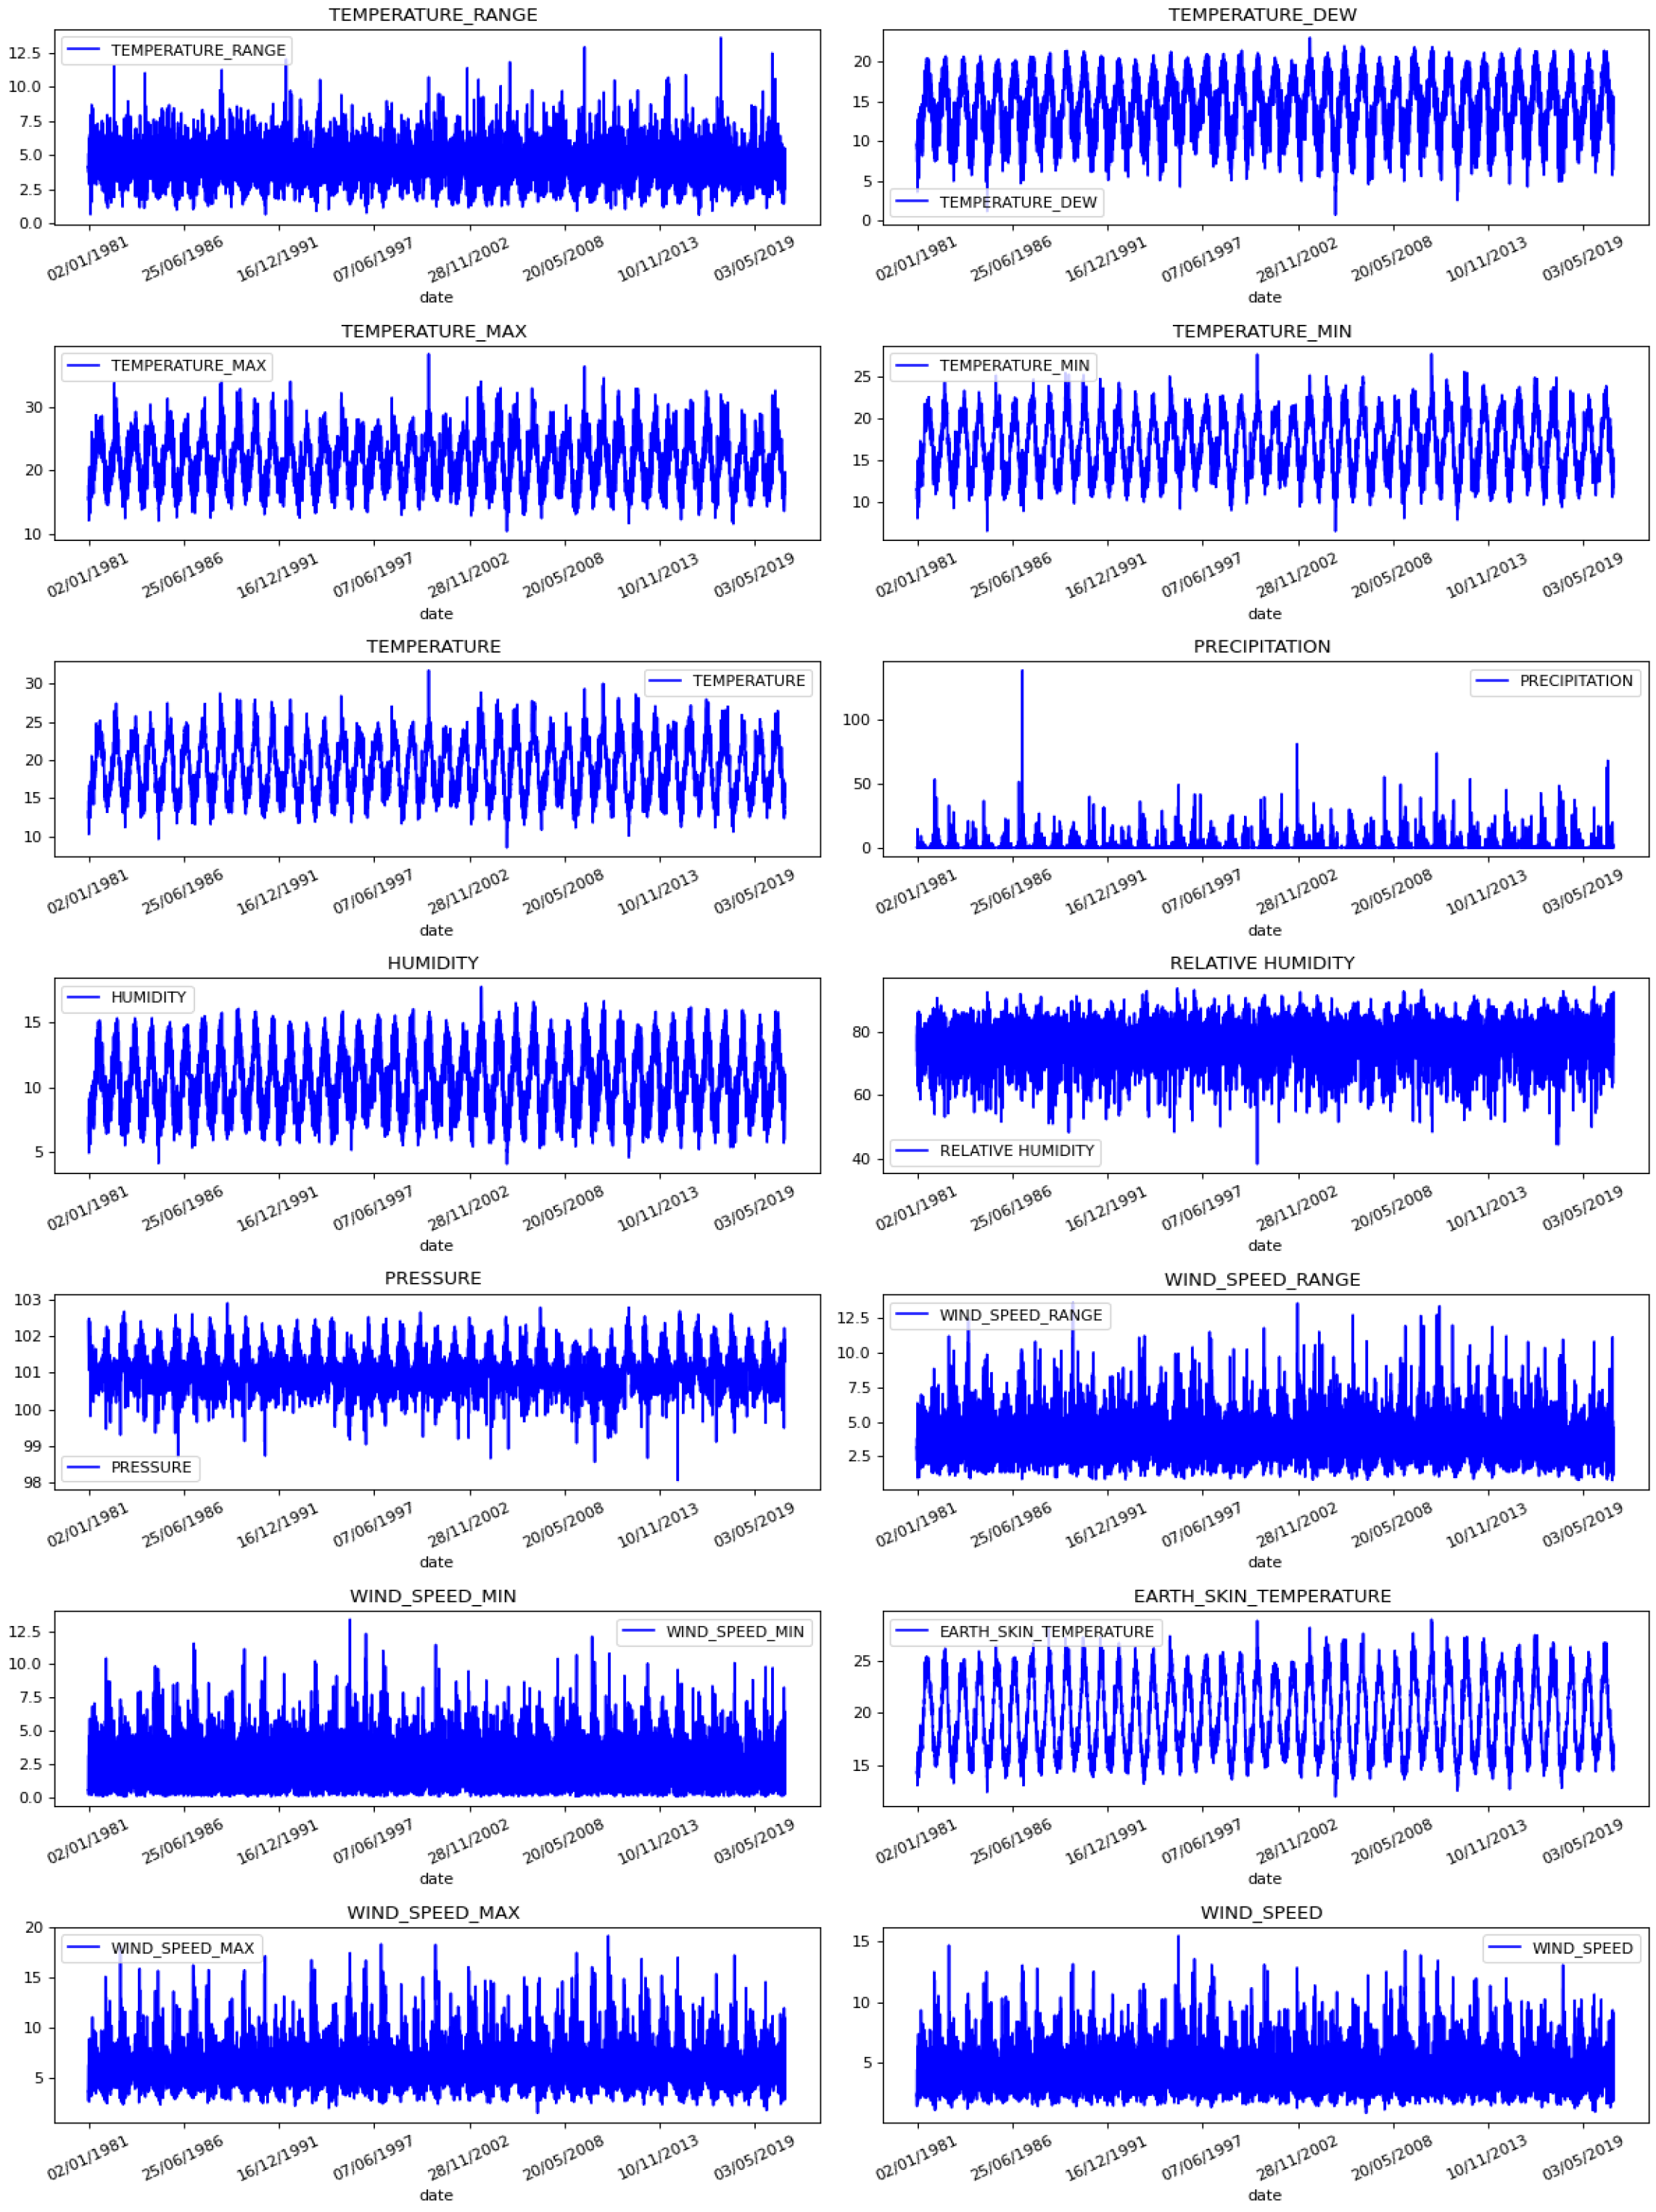
2.2.4. Dataset for Model Building

We collect multivariate weather data from the weather station of Mohammad V International Airport in the city of Casablanca, Morocco as presented in Figure 7.
The collected dataset includes different features such as minimum and maximum temperature, pressure, wind speed, and dew point. The dew point presents the temperature at which the air becomes saturated with moisture [45]. The summary of data features is presented in Table 4. However, to extract the most relevant features useful for model building, we use feature selection based on heatmap as one of the crucial concepts in machine learning. The feature selection will allow our model to reduce the overfitting, reduce the training time, and improve accuracy.
The collected data covers a daily measurement from the 1st of January 1981 till the 29th of January 2021 Figure 8. The dataset contains 14 features of 14.638 measurements.
After analyzing the multi-variate historical data, it was clear that the correlation between temperature (mean), Temperature range, Temperature dew, temperature max, and Temperature min is very high. Thus we only keep the temperature (mean) and delete other features to decrease the overfitting. Further details on the features’ correlation heatmap are illustrated in Supplementary Part V (see Supplementary Materials).

2.2.5. Model Accuracy

The model’s performance is assessed through the computation of different traditional statistical metrics such as the Mean Absolute Scaled Error (MASE) and the Root Mean Square Deviation (RMSE). Additionally, we use the index of agreement [46] to separate the RMSE into unsystematic and systematic components [47,48]:
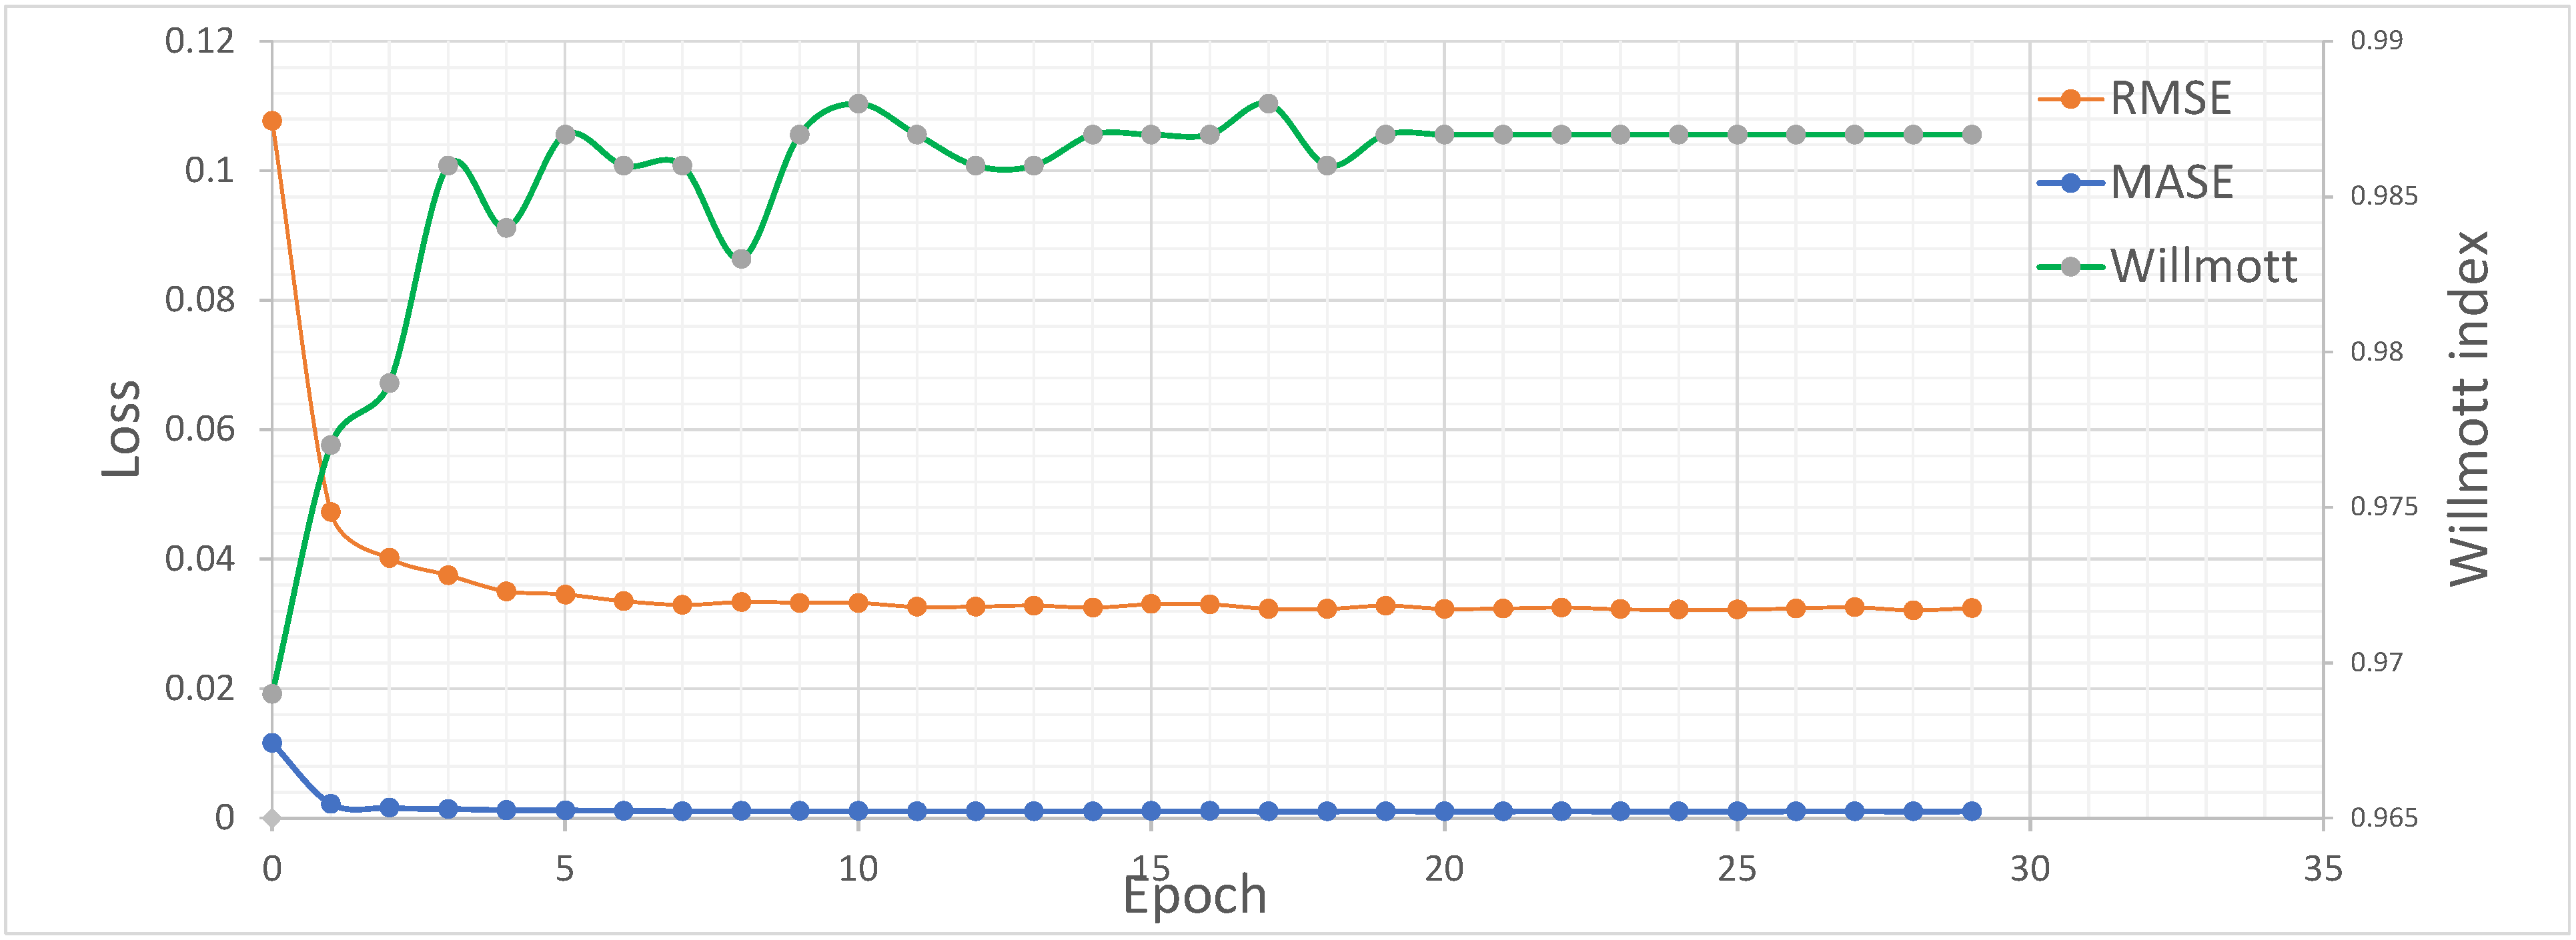
  • RMSE, MASE: The calculation of the Root Mean Square Deviation (RMSE) represents the square root of the average of squared errors. It is mainly computed to measure the deviation between the actual values and the prediction values to define the accuracy of different models. The MASE was proposed in [49] as an assessment technique to define the accuracy of forecasts in regression models. As a mean absolute approach, MASE uses the ratio of errors which is allowing it to be independent of the scale of the forecaster. The RMSE and the MASE can be calculated following the equations:
    RMSE = 1 n i = 1 n X ^ i X i 2
    MASE = i = 1 n X ^ i X i i = 1 n X i s X i
    where X ^ is the predicted value associated with the actual value X, and n is the size of the dataset. The larger the MASE and the RMSE mean, the enormous difference between the predicted and actual values, while the smaller the MASE and the RMSE mean, the closer the prediction values to the actual values.
  • Index of Agreement: The Willmott’s index of agreement [46], d i n d e x , measures the model’s relative accuracy in a range that varies from 0 to 1, with 0 indicating no agreement between the model predicted values and real observations and 1 indicating a perfect fit [50]. The index can be computed following the equation:
    d i n d e x = 1 i = 1 n X i X ^ 2 i = 1 n X ^ X ¯ + X i X ^ ¯ 2 , 0 d i n d e x 1
    where X is the real measured values associated to the predicted values X ^ , X ¯ is the average value of the measurements, and X ^ ¯ is the average value of the predicted measurements.

3. Results

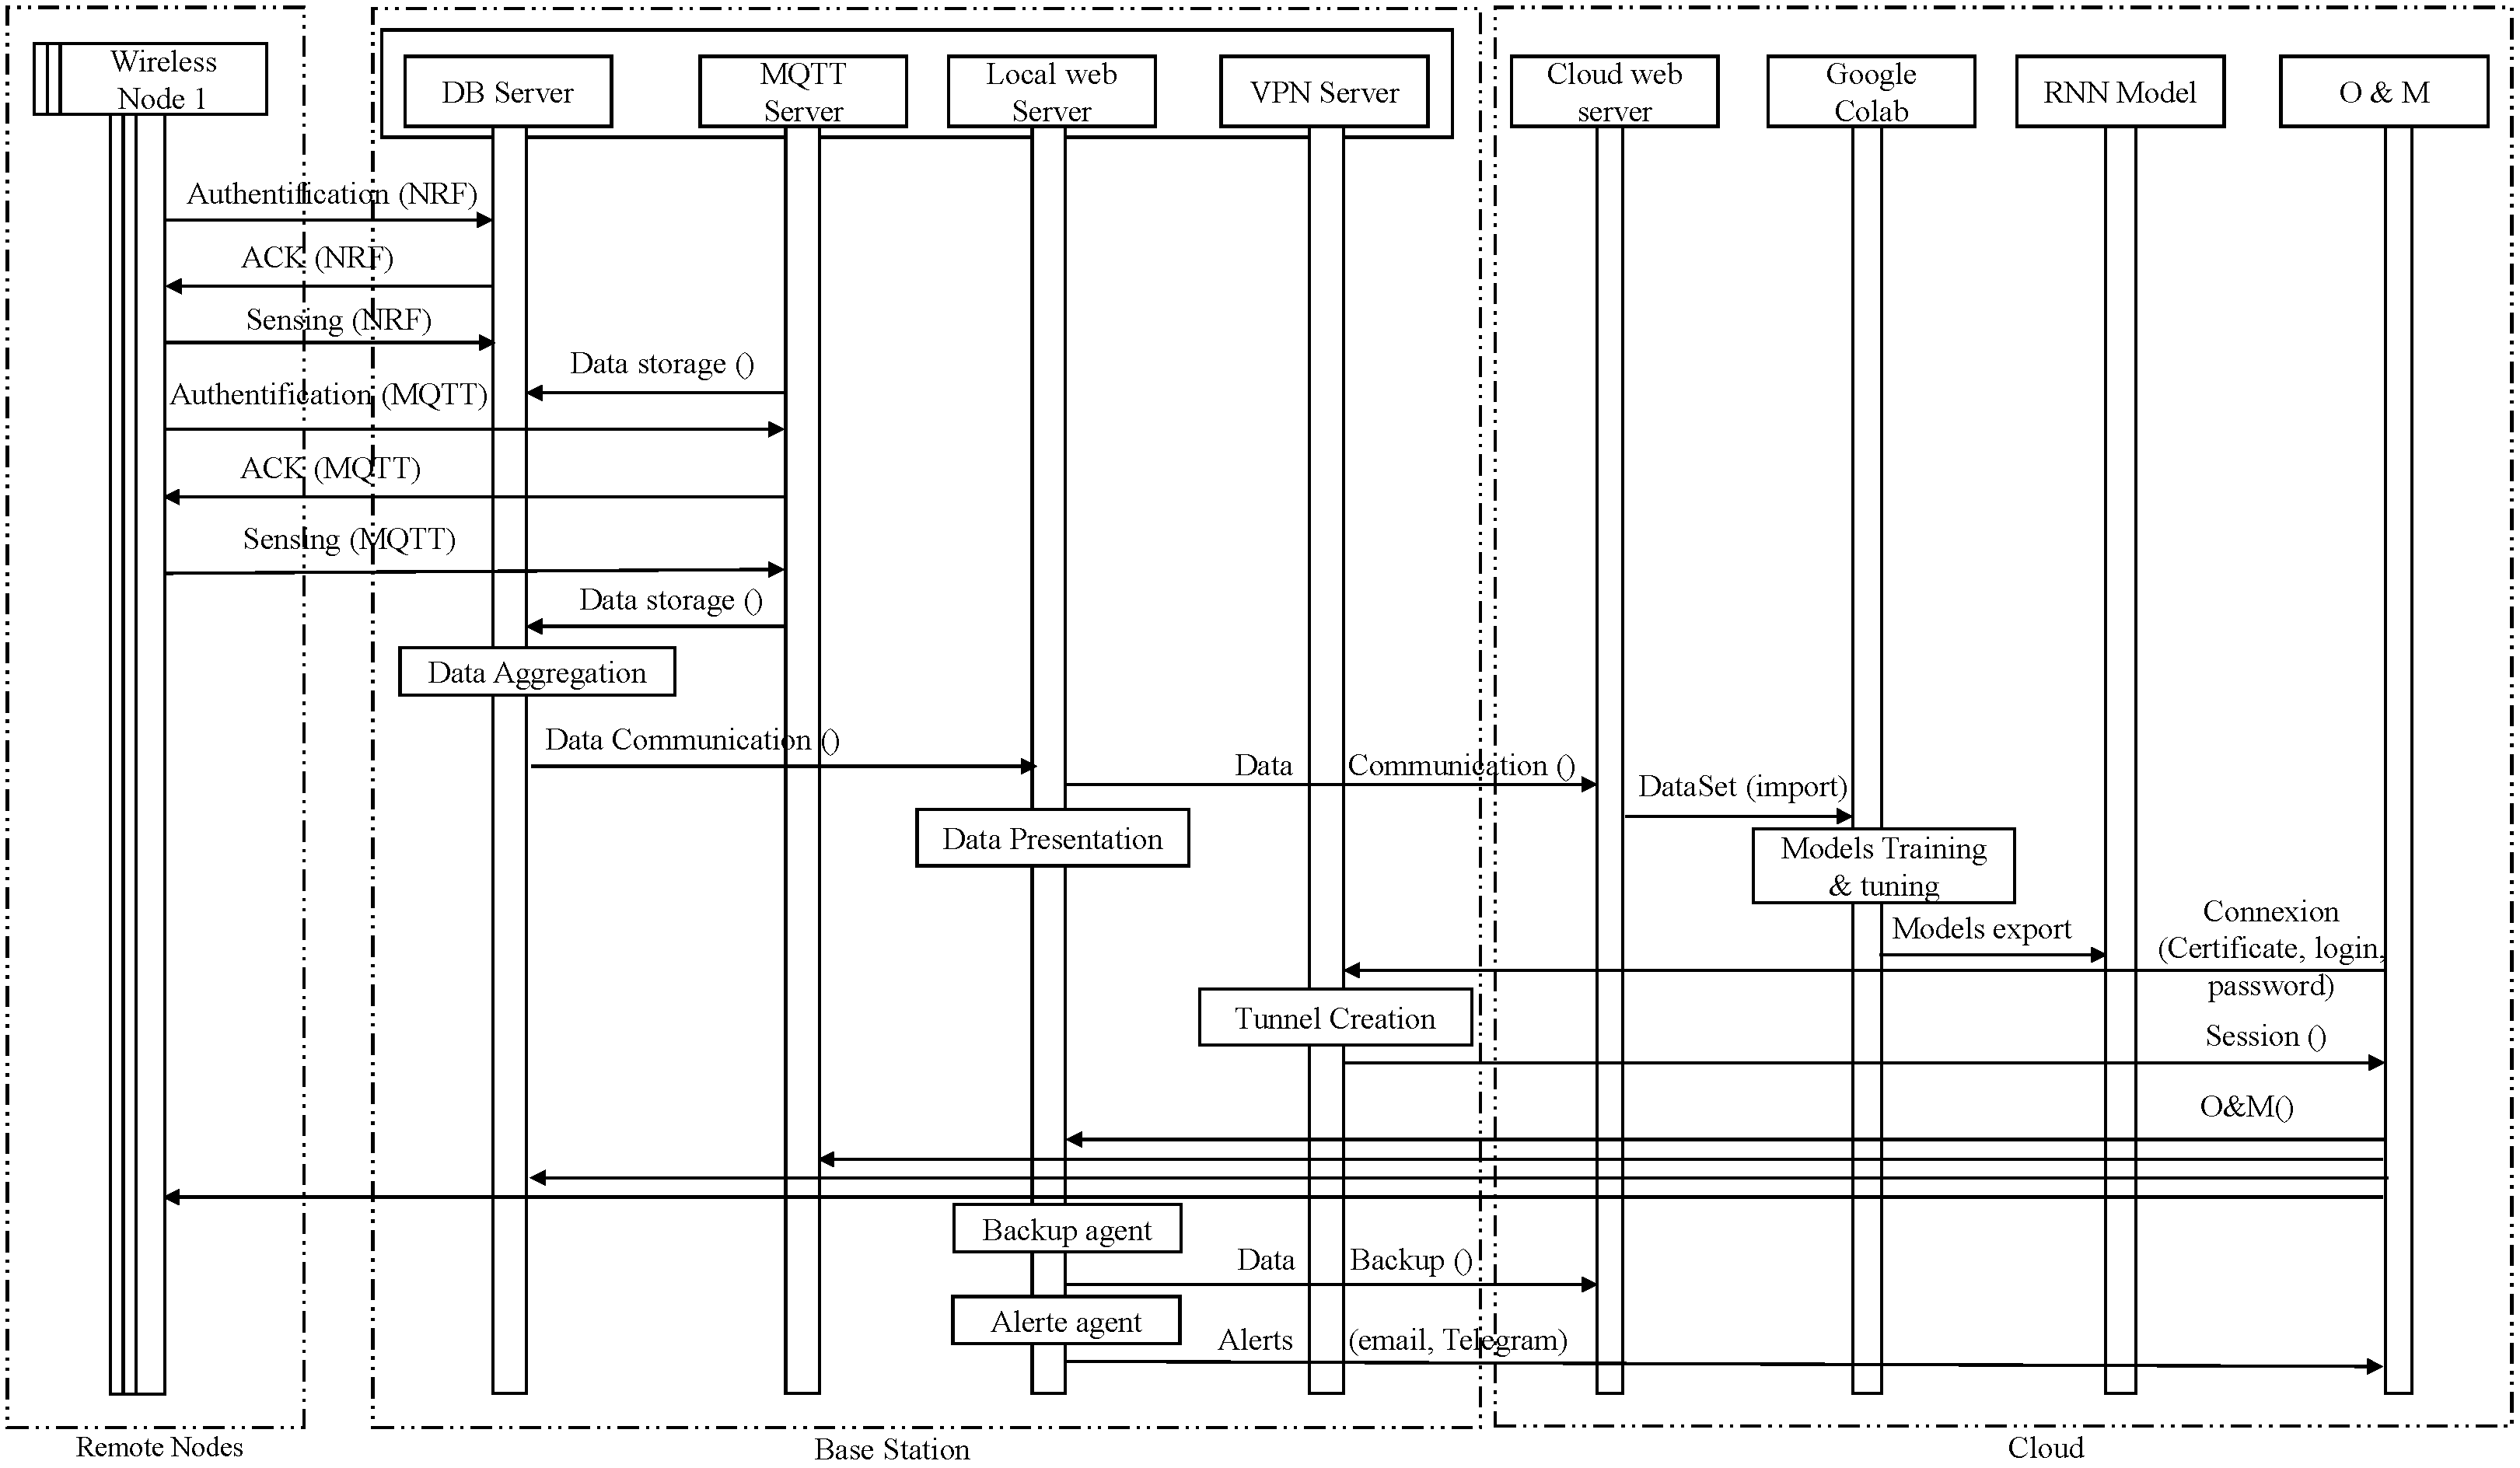
3.1. System Workflow

In agreement with our expectations, the overall system design acted to minimize the human need for agro-weather station programming or maintenance. Thus, platform allows remote supervision and efficient automation to address this need. The deployed node follows a plug-and-play approach, in which the BS listens continuously to old and detects any new nodes under MQTT or NRF24L01 networks. Once a new node has its pre-loaded firmware, it starts sensing and transmitting data to the BS. The BS receives the traffic and ensures data is stored locally to the InfluxDB database for eventual analysis. The aggregated traffic from NRF24L01 and MQTT networks is transferred to the cloud service based on a cronjob program’s automated script. The cronjob under the Raspbian operating system allows the execution of specific scripts in specific time and frequency ranges. The Local server ensures data presentation from the linked database and presents this data under dynamic web pages that are locally hosted. The data is also synchronized with the cloud-based server for open access. Alerts are configured for cognitive and context-aware monitoring. Several agents continuously monitor specific thresholds in a parallel way. Once a threshold is reached, system alerts are generated to the BS’ admin user in emails and telegram messages. Different user roles are created to allow different levels of data consulting from the dynamic website.
Furthermore, for Operation And Maintenance (OAM) purposes, remote access to the different BS functionalities and programs is ensured throughout the deployed VPN server and the installed clients on the end-users devices such as phones, tablets, and laptops. The pre-generated VPN profiles are mandatory to allow the VPN tunnels establishment. Additional certificates could be generated locally or remotely based on the GUI VPN manager. Additionally, the aggregated data is framed and added to the historically collected data from the international Mohammed V airport weather station. The concatenated file is hosted on a google drive service that is continuously linked to the Colab environment for model training and predictions. The end-to-end workflow is depicted in Figure 9.

3.2. Experimental Results

3.2.1. System’s Performance

For experimental purposes, we have tested our system in the laboratory and in the field. Different scenarios were applied to monitor the agro-weather station performance and behavior. We have also deployed the end-to-end portable system in an outdoor open wheat field for a real use case study Figure 10. The prototype has been operating for approximately 8 h in a 5-ha farm in Casablanca, Morocco for environment monitoring and continuous data collecting. Several scenarios were applied to test the BS security level, such as remote access using VPNs, on-site access through LAN network, and SSH access through WiFi. The BS monitored its different parameters for 8 h and provided through the designed GUI several clear Key Performance Indicators (KPIs) and data for end-users in an appealing dynamic interface as presented in Figure 11. The web-based GUI, based on Grafana, provides different dynamic figures and charts to reflect the BS’ behaviors in terms of different metrics. Each figure is included within a re-sizable block, giving specific users the right to change the specific time frame, resize the block, or even change the position of the entire element. The GUI allows the end-users to filter through a specific time range or configure dashboard updates’ frequency. It also allows the configuration of alerts based on predefined thresholds. The re-configurable dashboard was divided into multi sections for different purposes such as quick information, detailed health check, and network performance. The quick KPIs embed the critical data such as CPU and GPU temperature, CPU usage, RAM usage, and overview on threads and processes were accessible within the fixed 30 s as predefined in the initial baseline. A detailed health check section was created to support the operation and maintenance needs by presenting a detailed evolution of different parameters through time, metrics such as CPU load, Memory load, Processes, network usage, and network packets, furthermore network performance metrics such as load average, network errors, and network drops were introduced to assist maintenance users during troubleshooting or root cause analysis if any specified behavior. Other parameters such as Disk read/write load, time, and count was introduced to track the BS storage behavior. Since the dashboard is embedded within the local and the cloud-based website, it is compatible with different end-user devices such as phones (IOS, android) and laptops (Mac, Windows, Linux). The dashboard’s dynamicity and responsiveness make it adaptable with different screen sizes. It allows it to behave and perform like a desktop application.
During the experimentation phase, different agents were performing different activities and monitoring multiple metrics. Most of the station’s KPIs were below thresholds. The CPU temperature, GPU temperature was below 58 °C, while the CPU load was continuously under 75% (average of 45%) which allows the protection of the station resources. However, due to the operational multi-agents, the number of created processed was typically high reaching 300. The memory load was always under 2.8 Gb. Throughout the simulation, remote access using VPNs was tested several times which explains the multi-spikes in the network usage graph. Data were continuously transferred from the BS to local and external HDD which is tracked by the disk I/O requests and volume.
An offline version of the dashboard can also be consulted through the secured online portal https://ensem-aws.tk/ using the limited access credential login=“test” and password=“Azerty1+”, current snapshots are captured on 13th April 2021. The online portal contains an offline stored version of different parameters in a specific period. Synchronization can be done periodically through a synchronization agent in form of a cronjob.

3.2.2. System’s Security

The access to local nodes is limited by using credentials. However, it is known that remote accessibility is a crucial feature in any modern system especially with the emerging Covid-19 pandemic. In our system, remote access doesn’t only allow different users to avoid on-site presence to consult data, but it provides also access anytime, from anywhere using any device to connect remotely to the base station and its components. As a result, allowing enormous cost savings. Meanwhile, the remote access functionality comes always with security challenges and threats such as:
  • DDOS attacks.
  • Phishing attacks
  • Password sharing.
  • Vulnerable backups.
  • Leakage of information.
Therefore, a secured end-to-end connection is always required before any data consultation. To address this challenge an open-source low-cost VPN solution is implemented. Different certifications are generated per user profile. Once a user wants to connect from an external network, the client application connects to the server application to establish the end-to-end tunnel. In Figure 12 we can connect to our local private network from a public external network through the established tunnels. Once the VPN is activated, we can access any node within the network with IP address 192.168.x.x using only basic credentials.

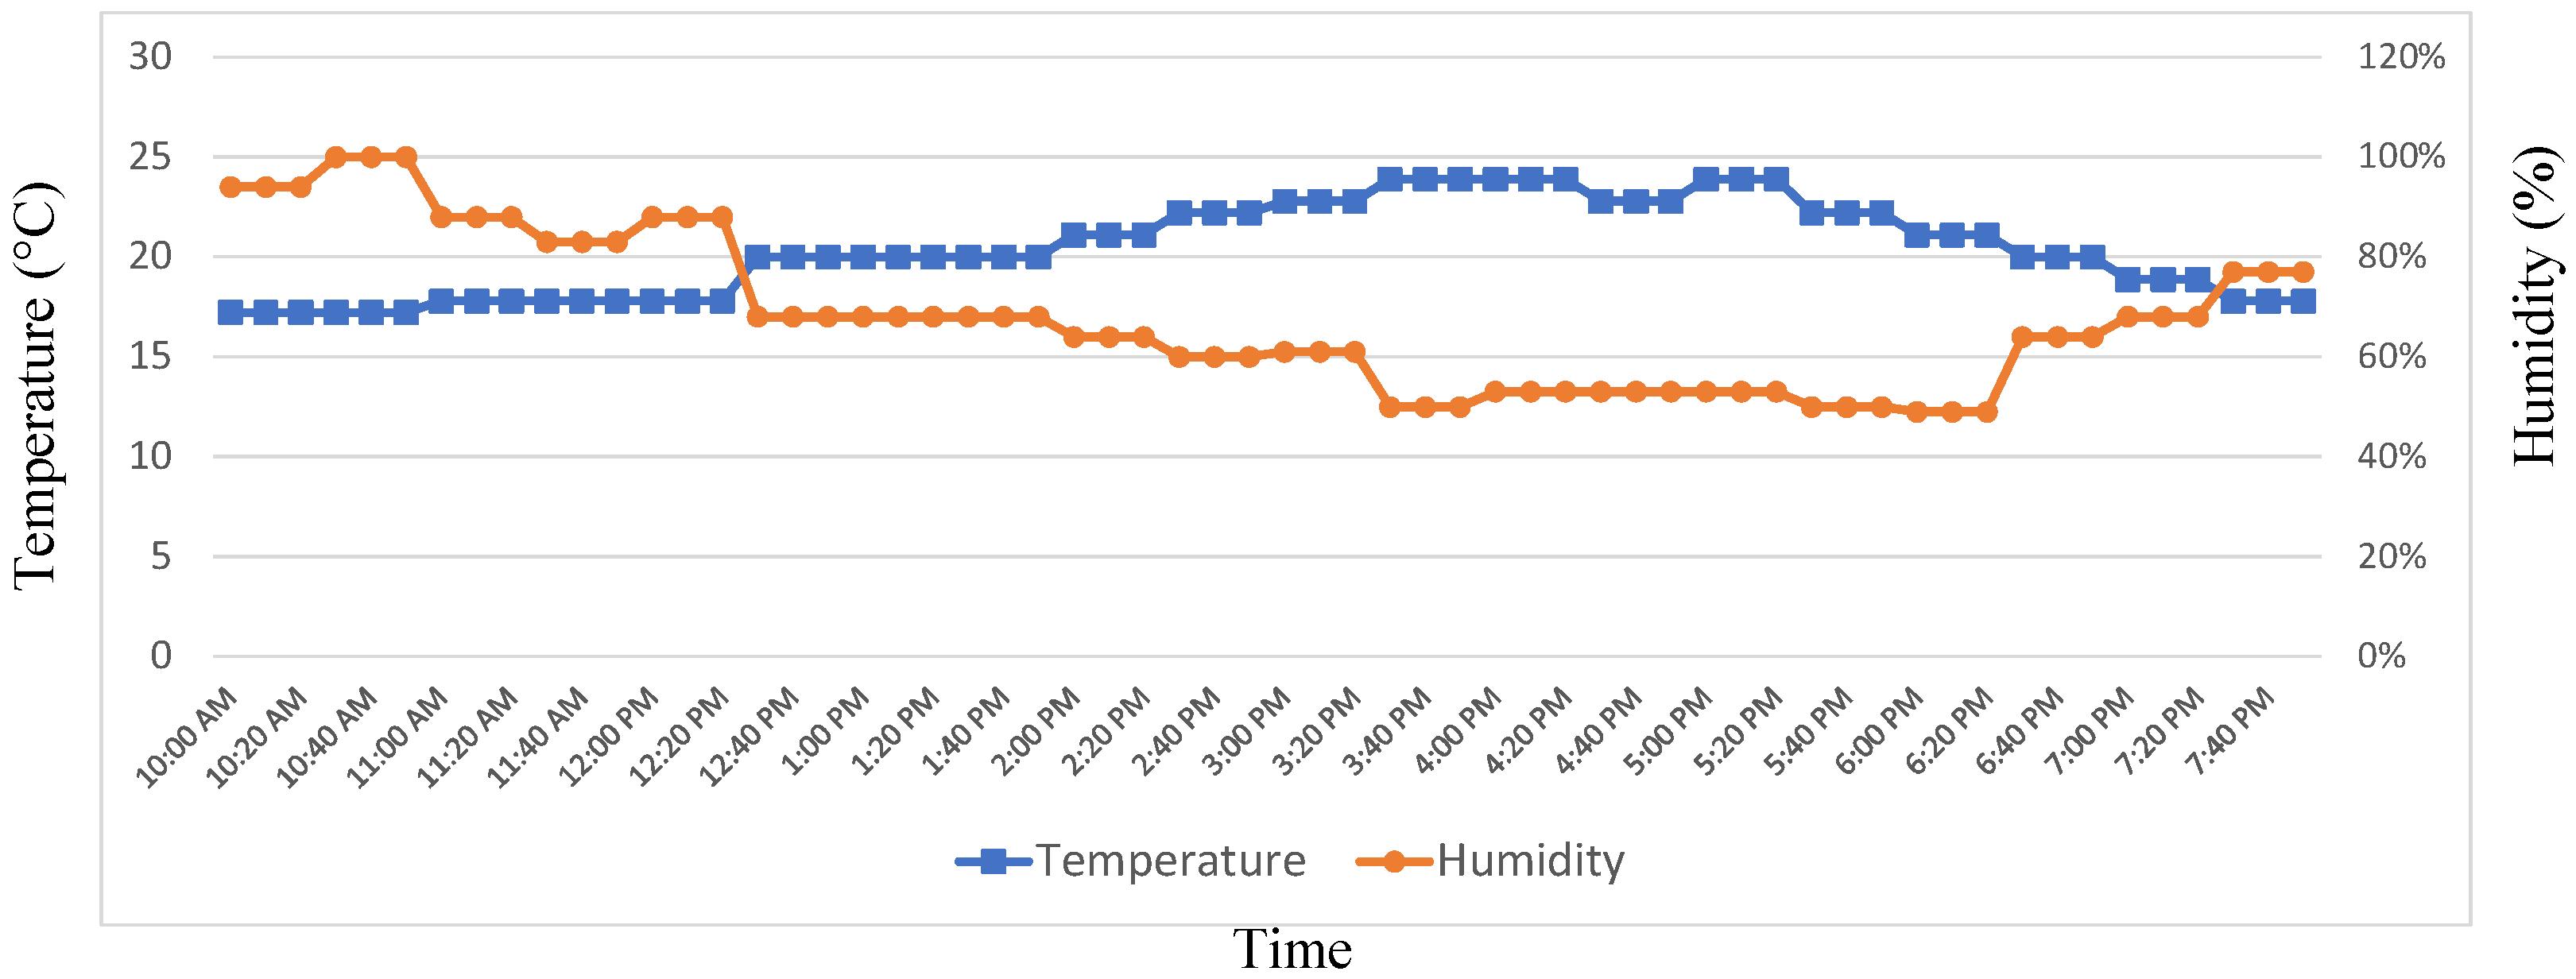
3.2.3. Weather Monitoring

The sensor nodes implemented within the farm collect continuous environmental data through the locally deployed sensors. The aggregated data is then forwarded in the form of JSON block to the base station. The Json block represents a series of JSON files in a specific time range. The data is transmitted via different transmission mediums (wired, wireless) and based on different protocols (NRF24L01, WIFI). The Figure 13 illustrates the plot of the temperature and the humidity recorded within 8h of environmental monitoring. From the readings, the temperature records show a continuous upward trend. The values continuously rise in a range between 15 °C and 25 °C. However, the humidity reading shows a continual downward trend. The humidity values decrease between 100% in the morning down to 40% in the evening. Even though the measurement reflects only 8 h of records, the extensive sensing through the year can be extremely useful for the farmers and researchers through the following:
  • Assist in understanding the various effects of temperature and humidity on plants and crop productivity.
  • Adapt the crop type (wheat, oats, potatoes, etc.) based on the period.
  • Select the seed quality based on the season.
  • Select and trigger automation action (e.g., irrigation) based on a set of parameters (e.g., temperature threshold).
  • Select the best time for proper soil preparation.
  • Prevent plants damaging by choosing the best timing (high humidity and temperature) to apply pesticides, since treatments should be applied in early to allow foliage to dry before reaching 29–32 °C [51]
Due to their significance as ecological controls, the wind speed and direction are very important metrics that should be considered by smart farming. The analyzed collected data can help farmers and researchers through:
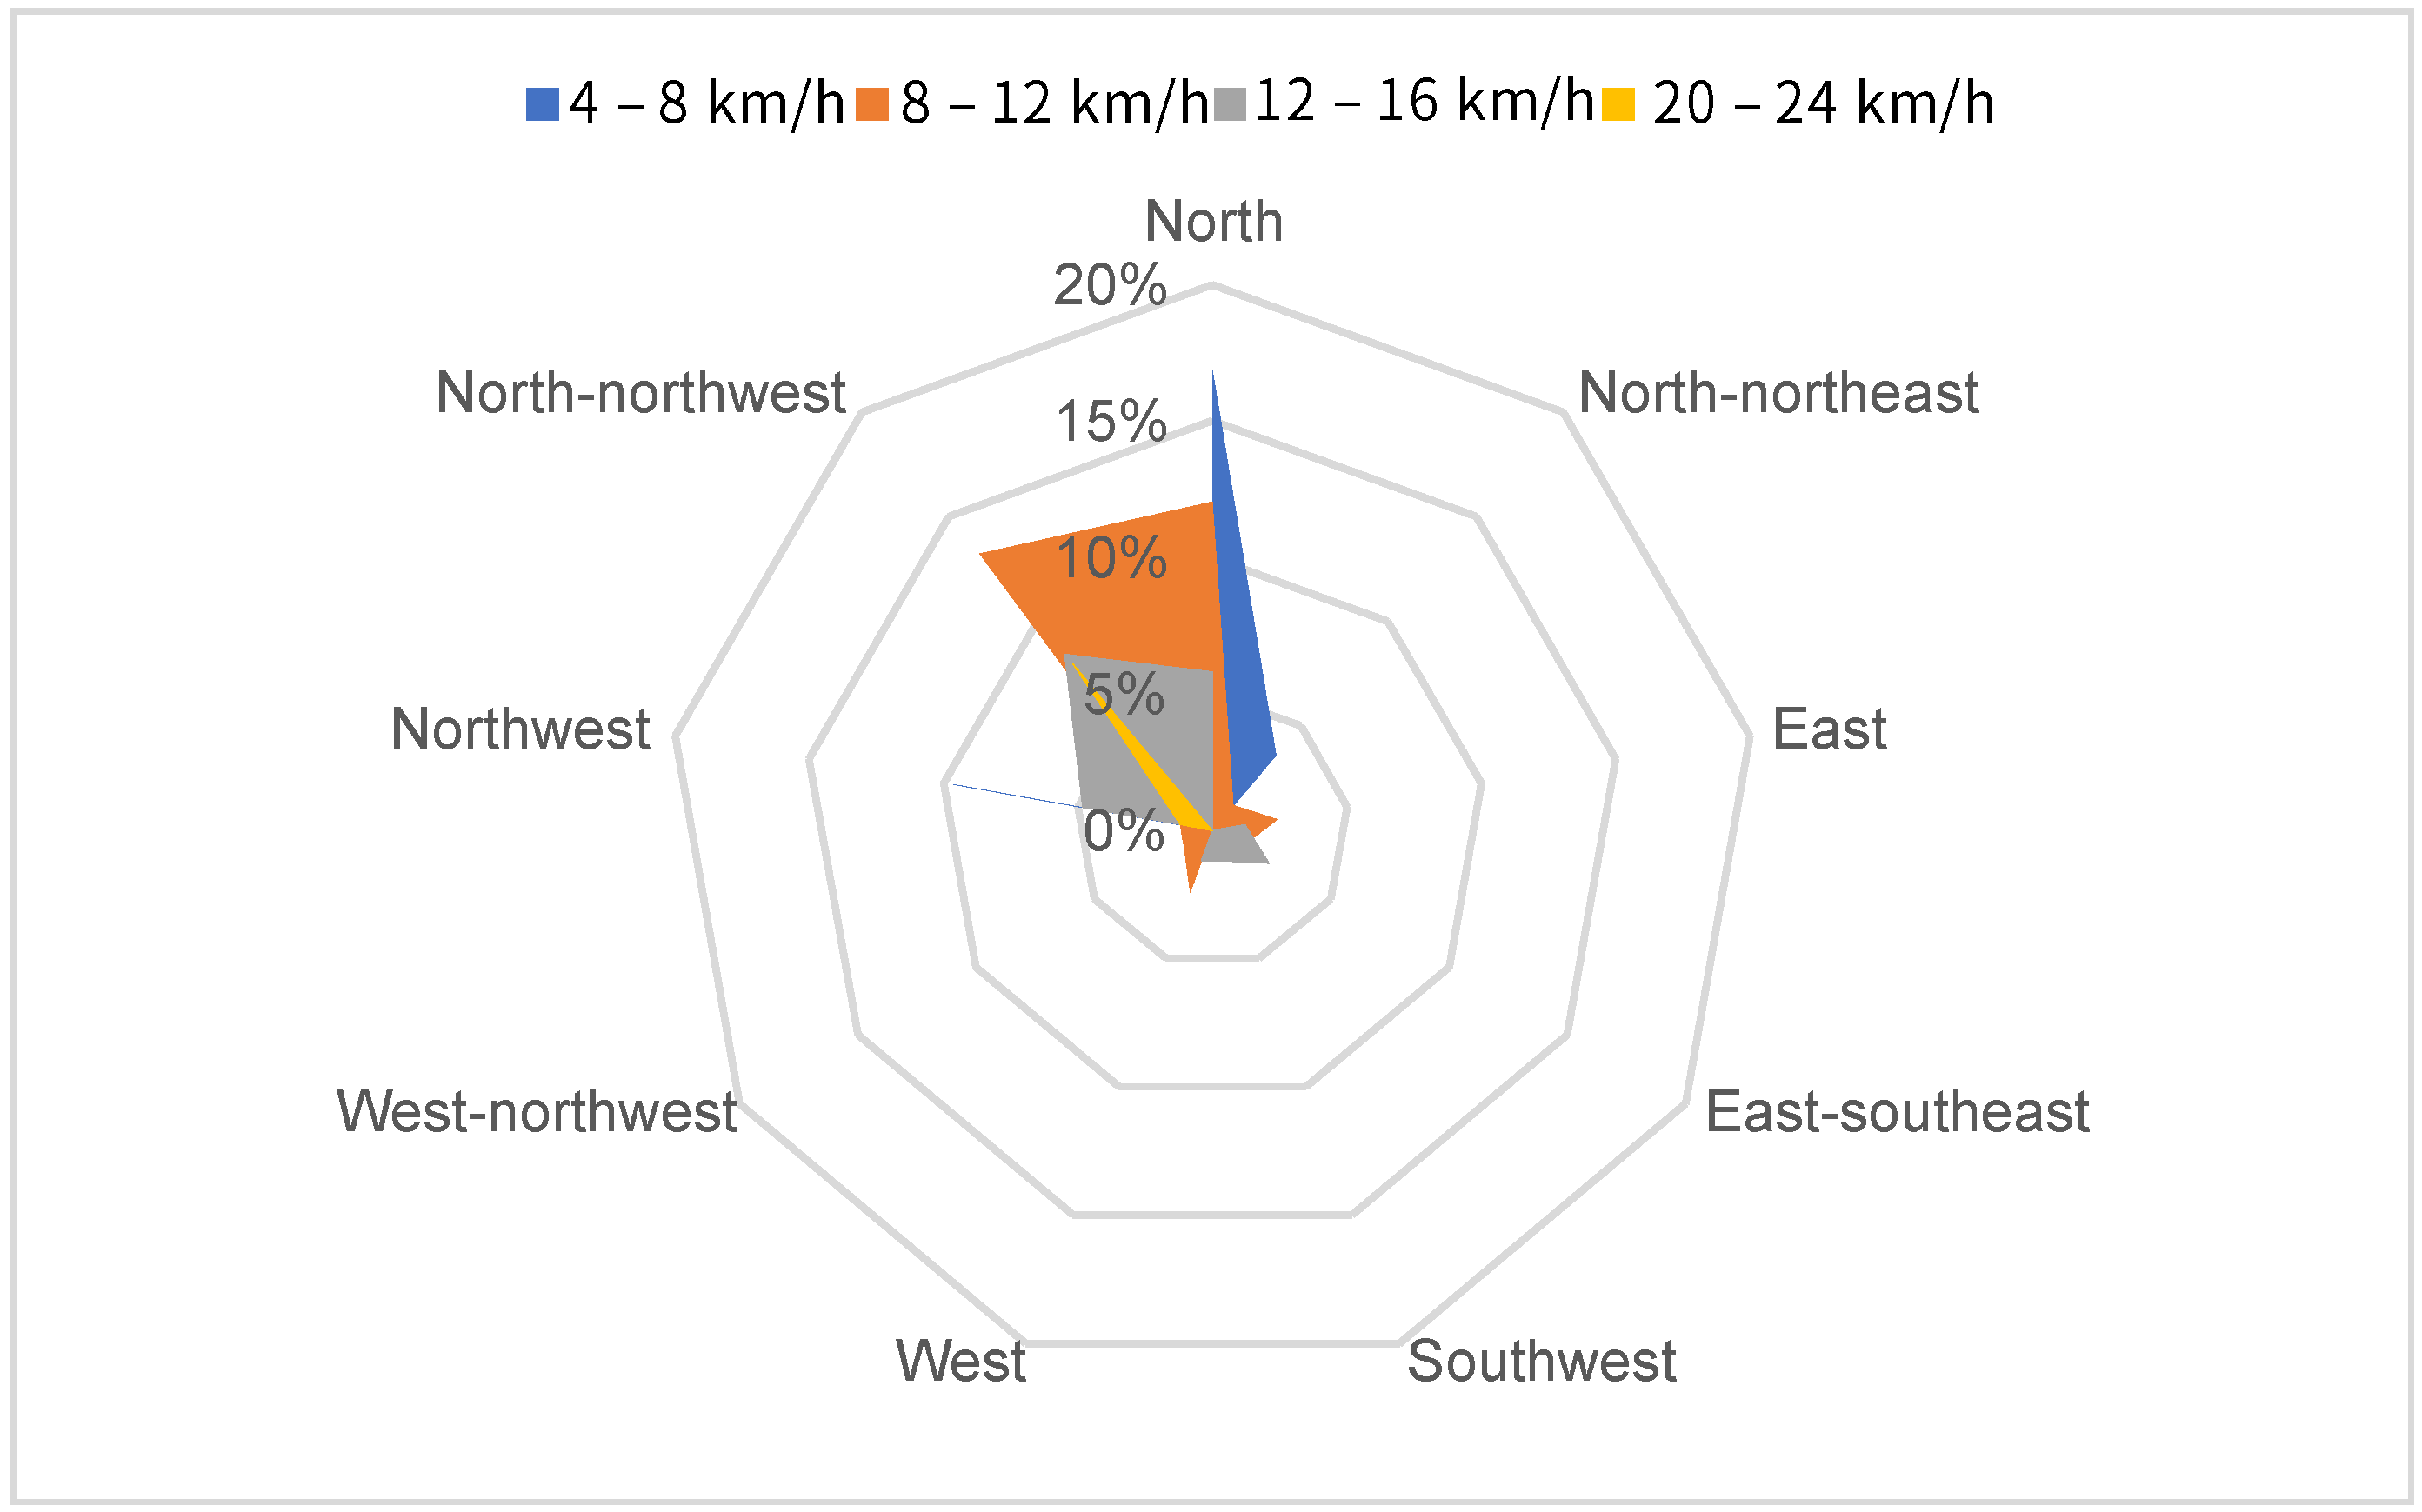
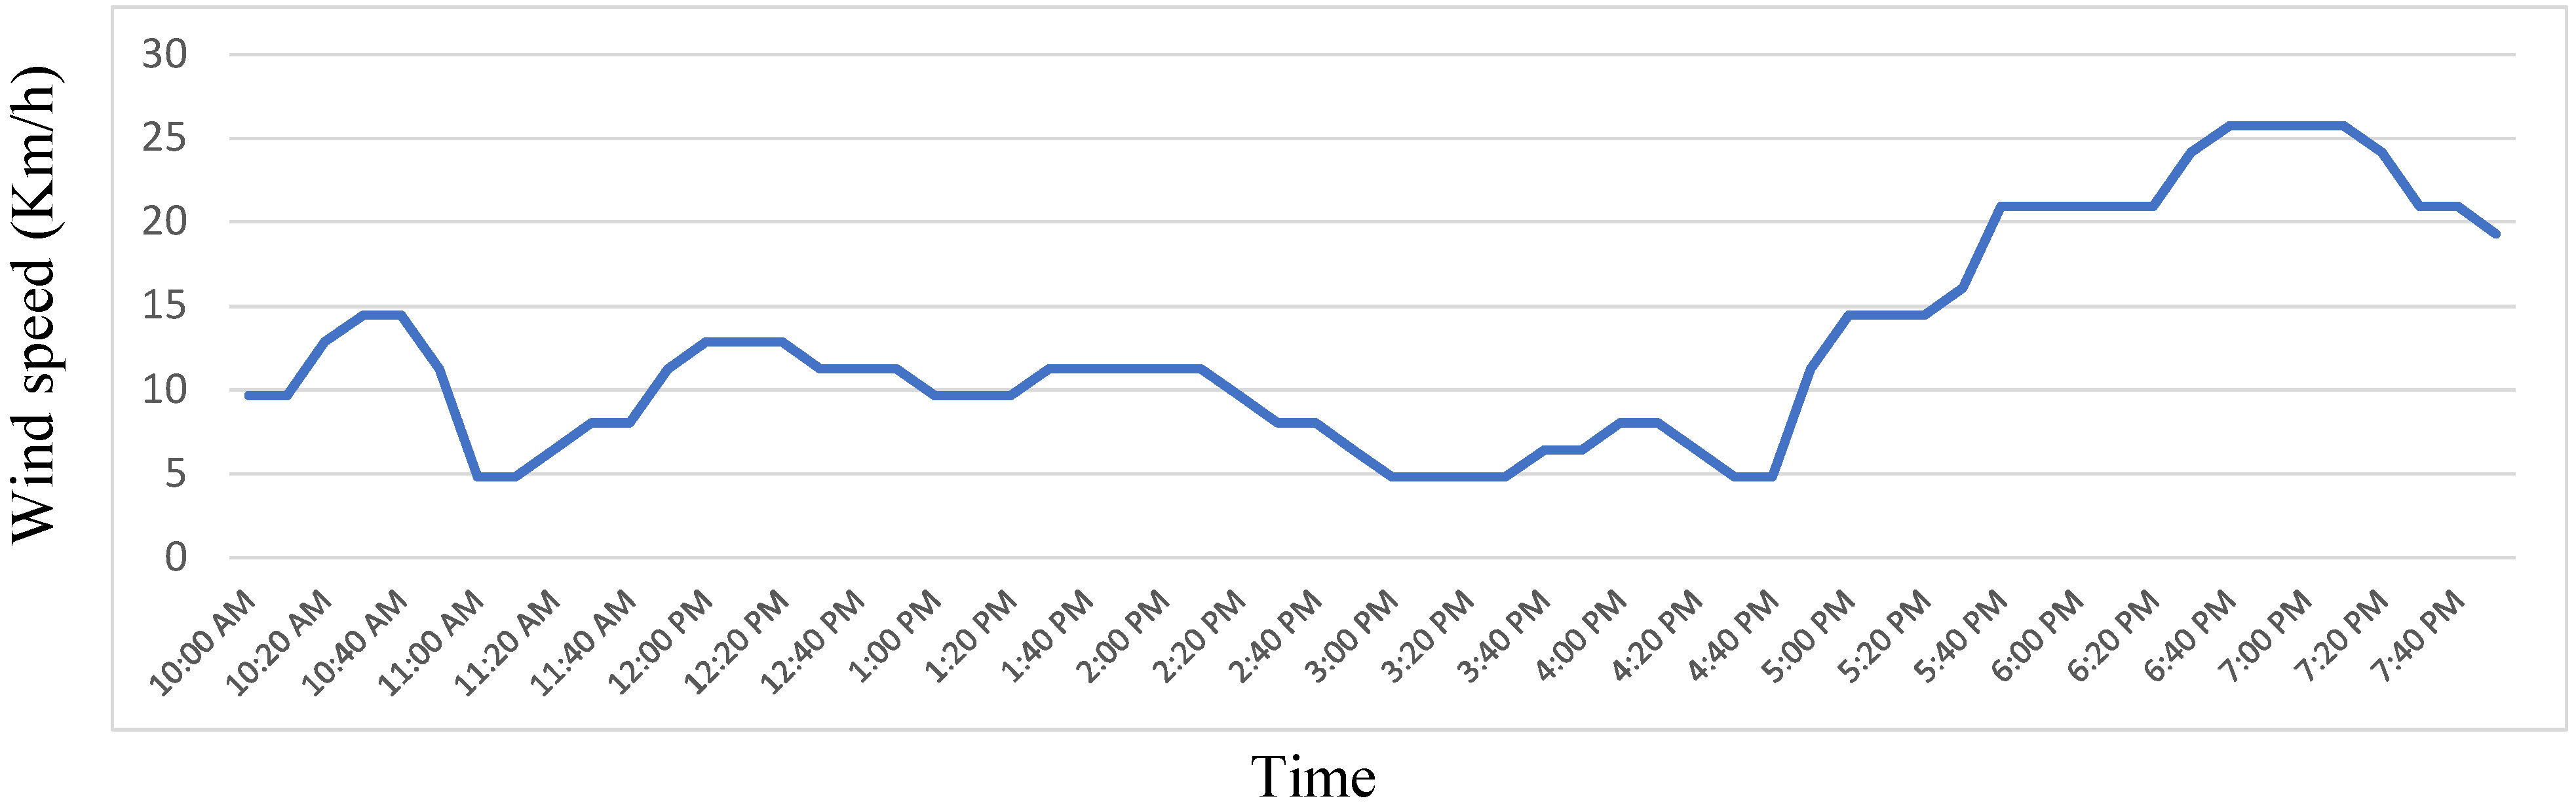
  • Lower production costs through the usage of the right wind turbines for electricity generation.
  • Increase crops profits.
  • Understand the impact of winds on plants and crop production (plants seeding, damaging, etc.)
  • Secure reliable data for implementation of customized ML algorithms for dedicated farming fields.
In Figure 14 we present the wind rose that illustrates the distribution of wind speed and wind direction in the monitoring period. Detailed wind speed readings are plotted in Figure 15. The plot shows that the dominant wind direction is between North-northwest and the North with 17% of 4 to 8 km/h and 10% of wind with speed between 8 and 12 km/h and 5% of wind in a range of 12 to 16 km/h.
To summarize, smart farming cannot be achieved if it is not supported by reliable data and automation of recurrent activities such as monitoring and control. Thus, to select and apply the best crop management practices, we should be able to understand the evolution and impact of the meteorological parameters on the plants and on the productivity of any studied field. The proposed agro-weather station in this paper doesn’t only allow different users to monitor their crops on a real-time basis but also decreases human activities and improves the adoption of new technologies in the agriculture field. Our tailored system allows real-time data that can support real-time decisions.

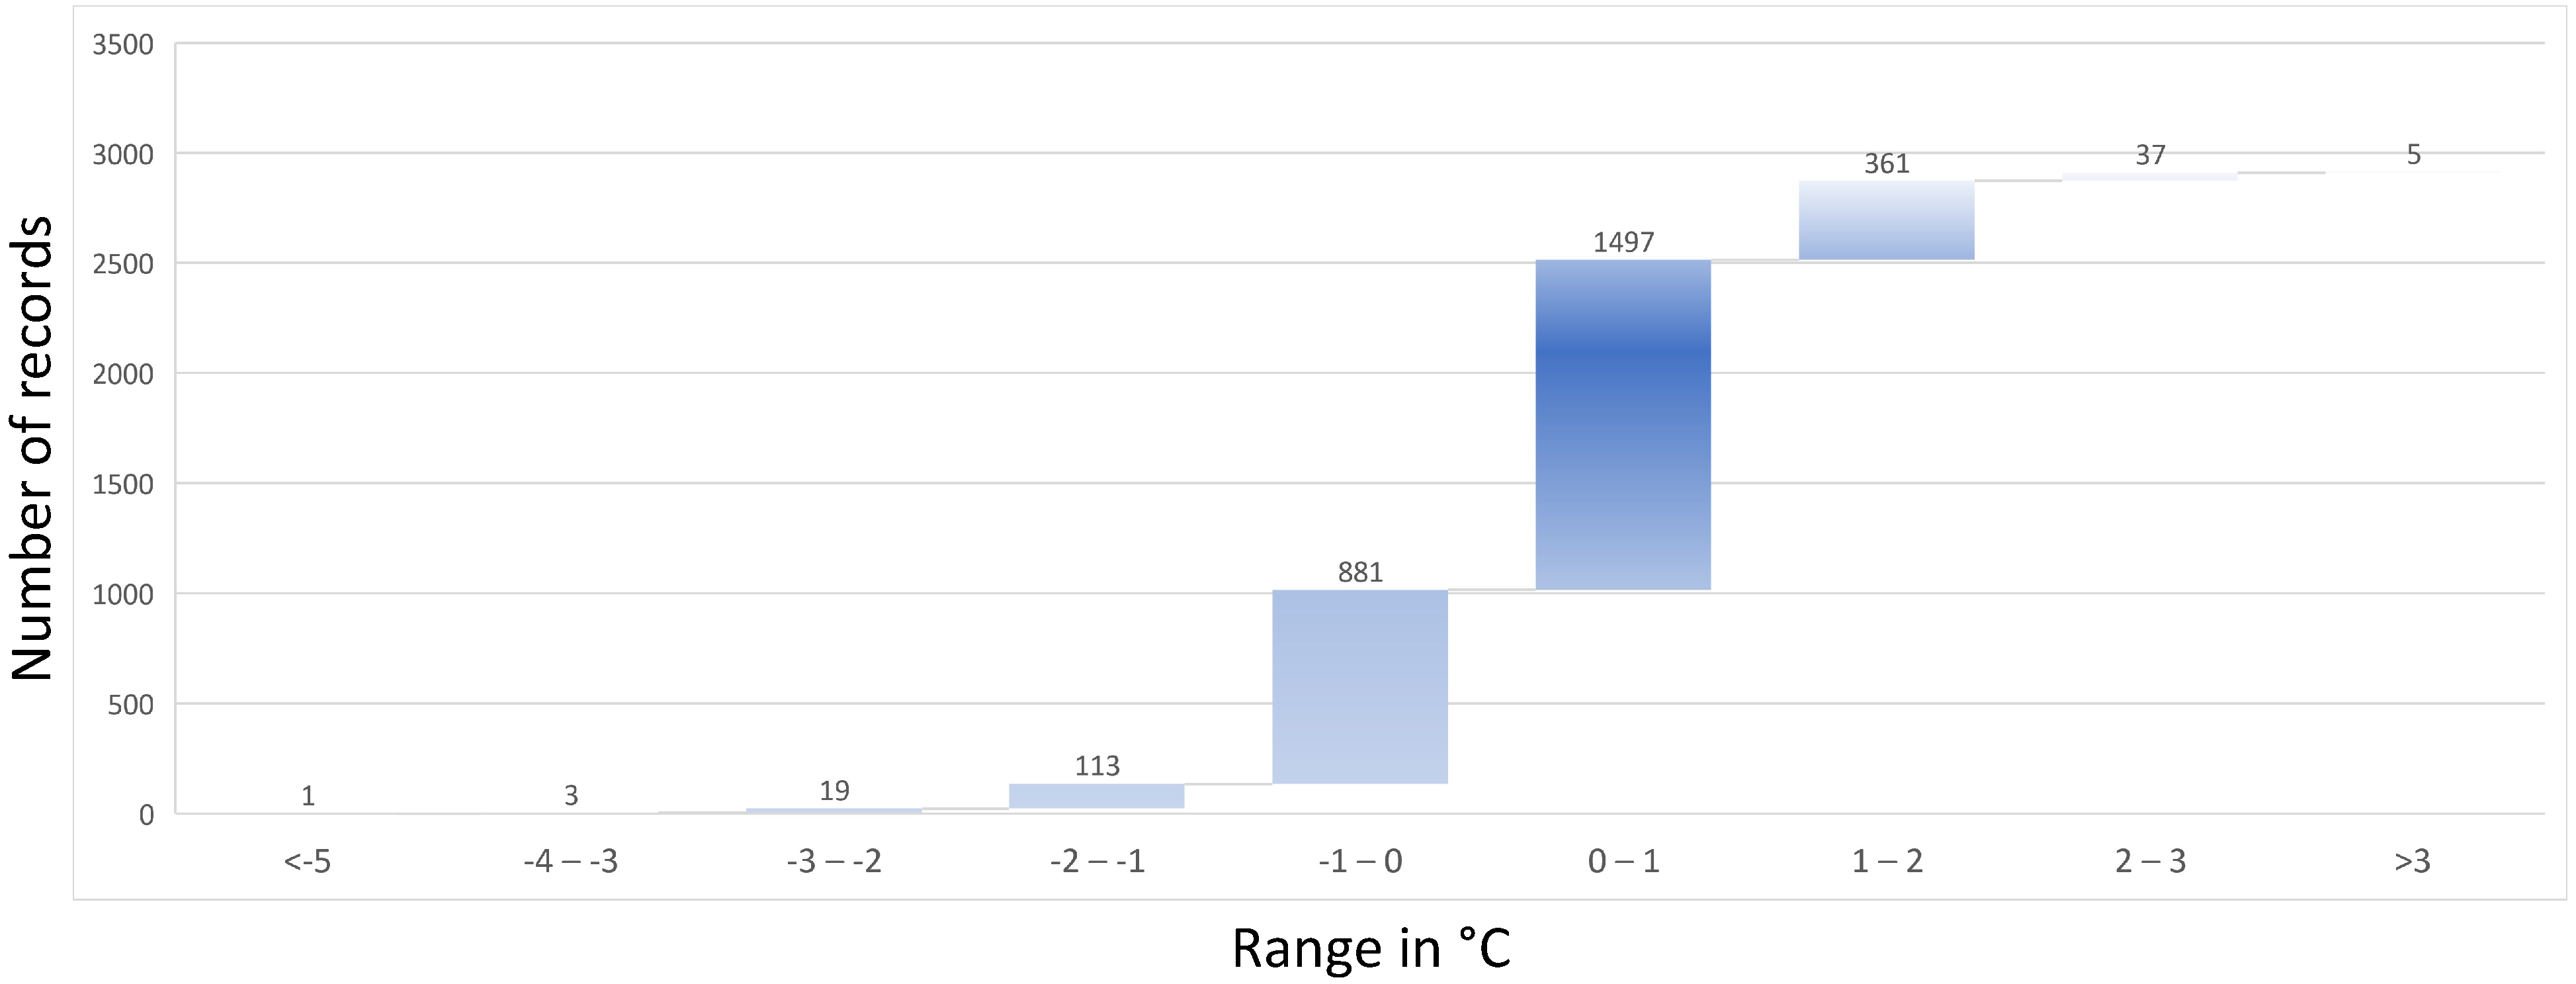
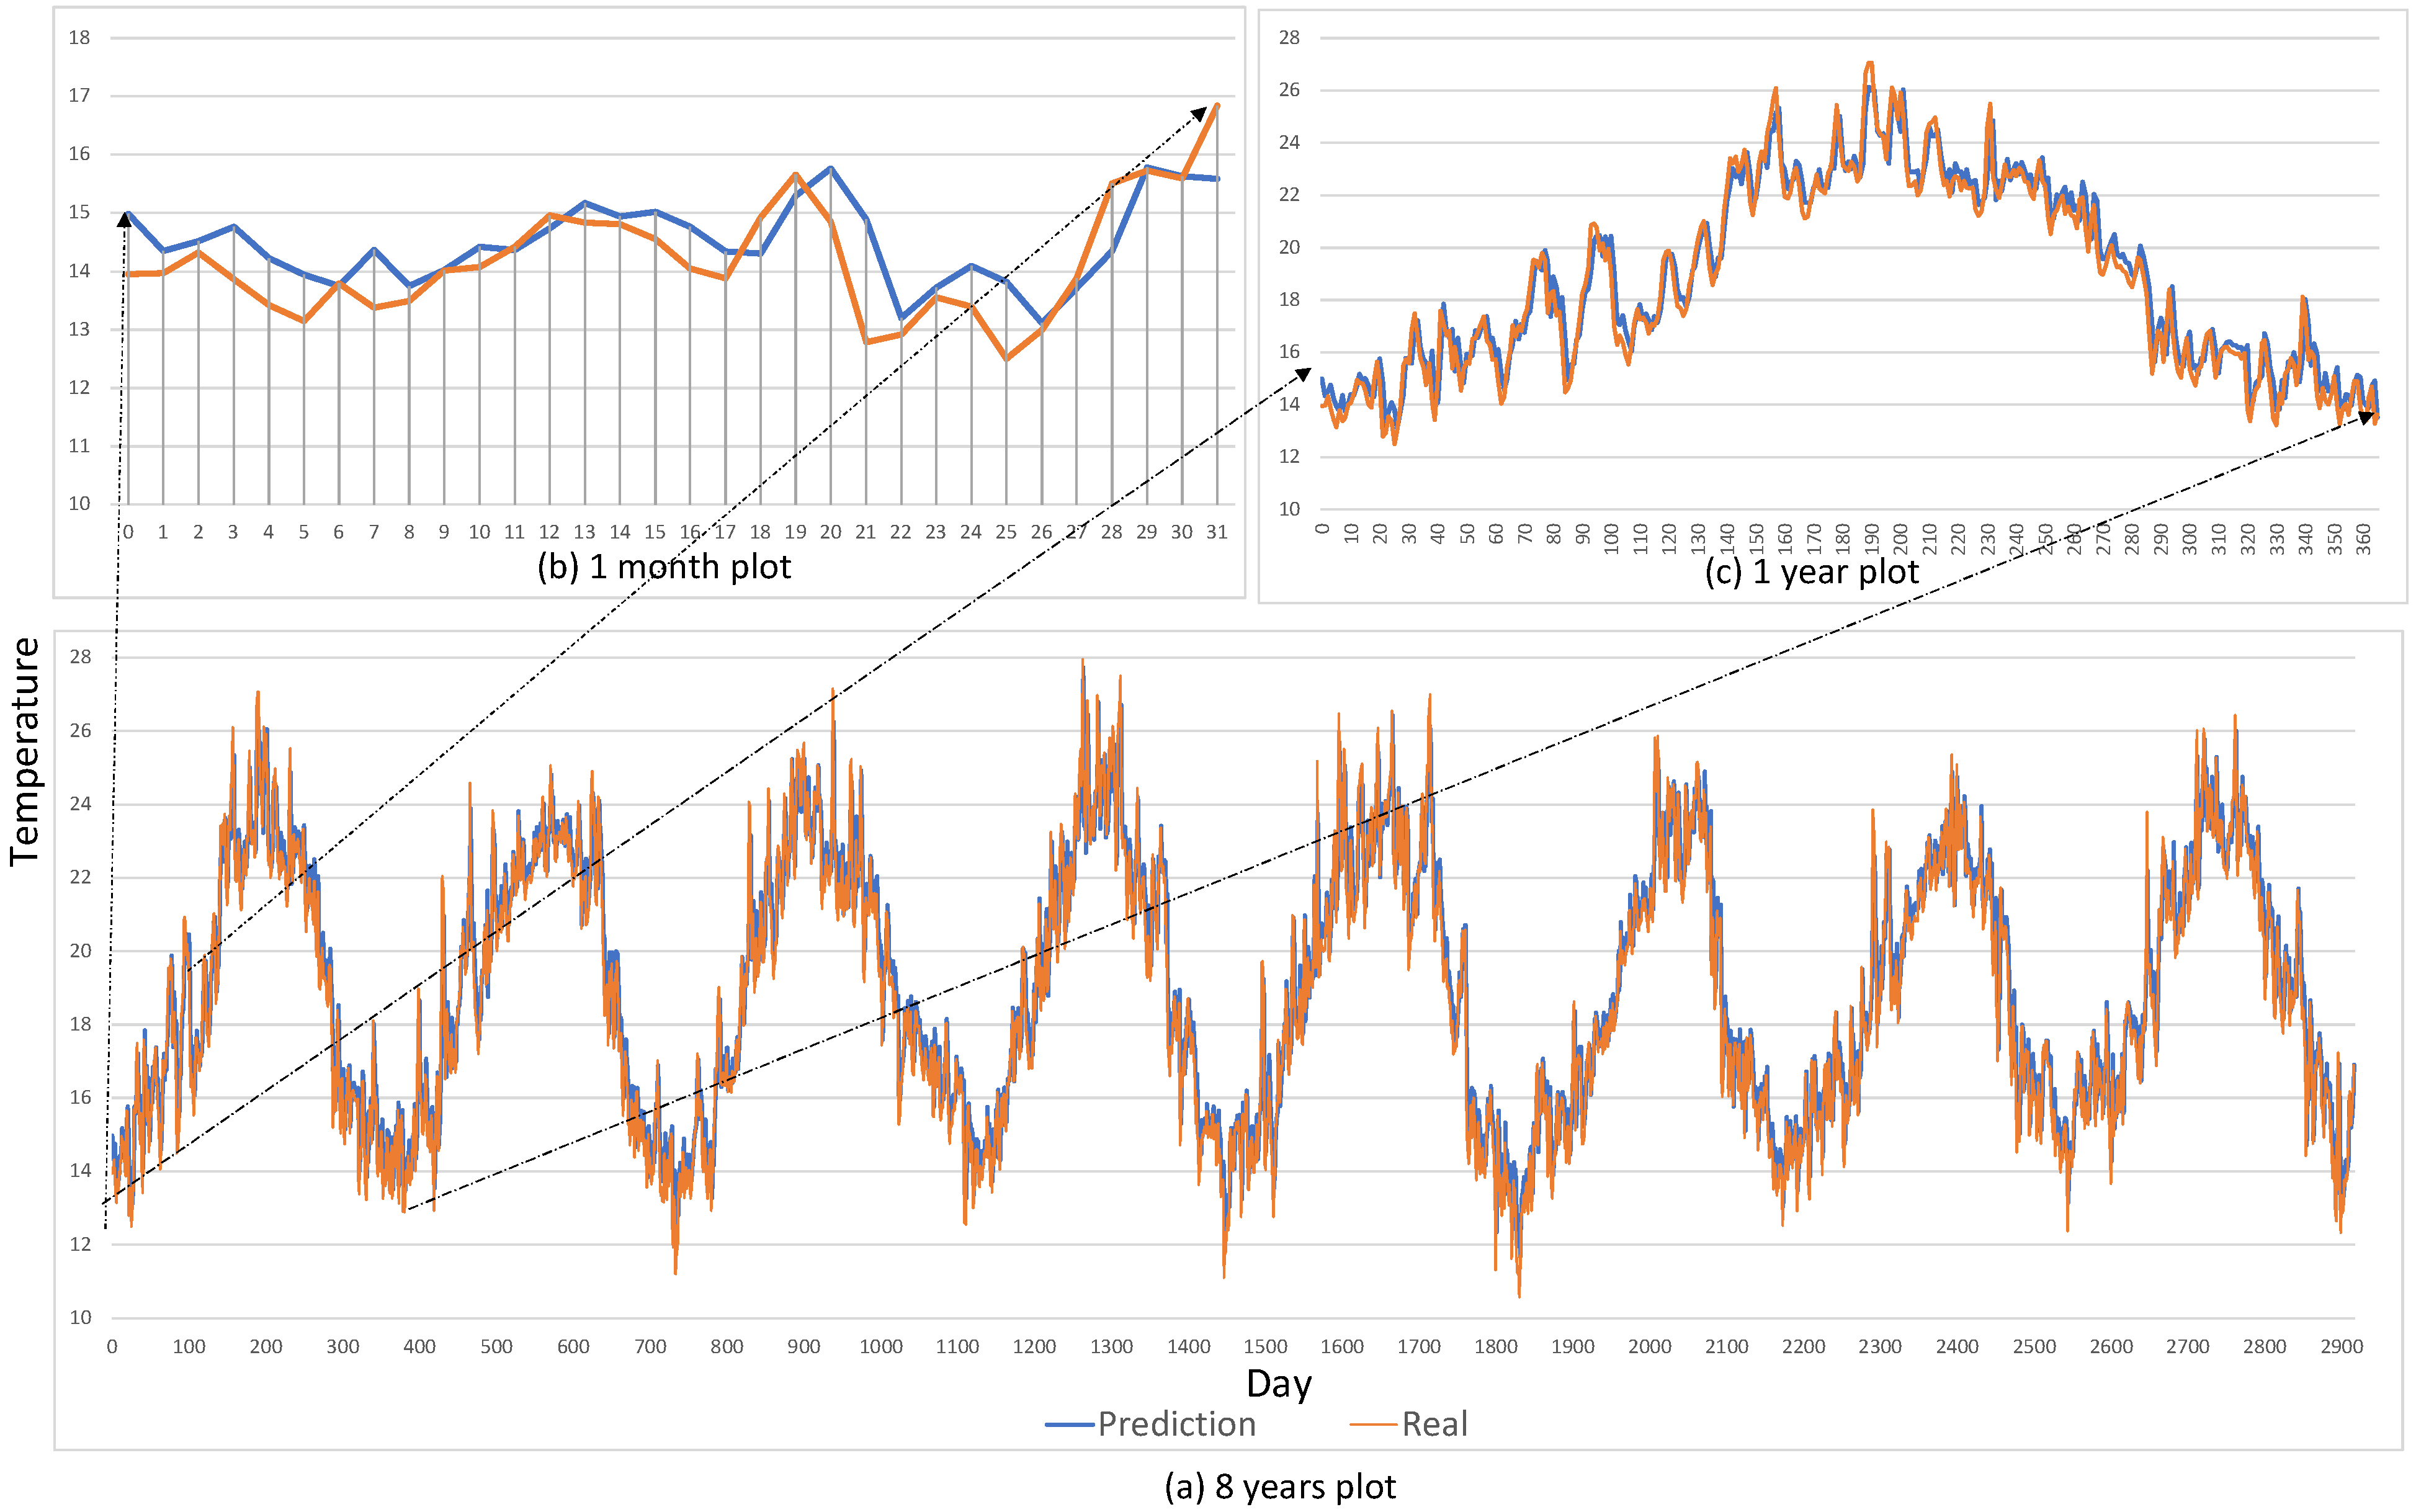
3.2.4. LSTM Model Implementation and Validation

To train our LSTM model we used the popular Python package named “Keras” which is embedded within TensorFlow. Applying the right hyperparameters is crucial for an optimized model before any learning process. Thus, an initial parameterization has been implemented and adjusted based on the model outcomes. The key optimized parameters were the number of hidden layers, the number of nodes within each layer, the number of epochs, and the learning rate.
The initial setup relies on the Mohammed V airport base station’s data to build a reliable LSTM based model for weather forecasting. However, after a predefined period, data from the local base station is used and concatenated with the historical data to keep the model updated with the latest measurement. Meanwhile, since our initial dataset analysis shows some missing and abnormal observations at different time slots, we proceed with data pre-processing through removing the entire daily record for missing data. However, we keep the abnormal measurements (outliers) to measure the robustness and performance of the model through its ability to provide a good prediction. For model building, the data is split into three subsets, 70% of data is reserved for the training, while 20% is dedicated for validation, and finally, 10% is for the testing.
In the implementation of our model, we used 2 hidden layers which have been enough to avoid unnecessary model complications while being able to detect complex features. The layers were powered up by 50 neurons in each. The learning batch size was tested using 5, 10, and 100 days, while the learning rate was initially set to 0.1. Meanwhile, for the loss function, we have chosen the mean squared error, while the used model’s optimizer is Adam. Additionally, we used sigmoid and tanh as the activation functions.
The simulations are performed on a cloud using the Colab platform from Google. The implemented algorithms used Tensorflow platform and Keras as main library to train and test the performance of our models.
After each round the RMSE, the MASE, and Willmott’s index are computed. The learning curve in Figure 16 presents the plot of the computed standard deviations against the number of the epoch. The model has been trained during 30 epochs, Even though the network was training itself in 30th epochs, it is clear that in our training process, the MASE and RMSE were minimal in the 5th epochs with a value of 0.0012 and 0.034 respectively, however Willmott’s index was around 0.987 with space of improving. The optimum values were in Epoch 10 with minimal MASE, RMSE, and Willmott’s with values of 0.0012, 0.0034, and 0.988 respectively. The MASE and RMSE minimum remain stable throughout the epochs, and Willmott’s index stabilizes at 0.987.
The Records’ deviation in Figure 17, and the real temperature versus predicted are plotted in Figure 18. The prediction of our LSTM model is plotted for 1 month, 1 year, and 8 years from April-2013 till April-2021. The prediction values are based on a trained model with 32 years of historical data, which possibly captures the ongoing effects of climate change. The visual comparison in Figure 18 shows that the LSTM model is performing well. The prediction trends follow almost the training trends in the overall plot with a mean of residual values over the 8 years around 0.59 °C. Further details on model validation are presented in Supplementary Part VI (see Supplementary Materials).

4. Discussion

4.1. Design Issues

Compared to any other field, IoT systems have different bottlenecks that aren’t only slowing down the adoption of such solutions but they are dragging more attention by scientific communities through several contributions. In [14,15] the authors describe the most common challenges in IoT solutions for agriculture. Challenges such as resources optimization, cost analysis, lack of knowledge of technology, quality of service, security, and networking. Below we address most of these challenges.

4.2. Comparison with Other Existing Systems

Even though various solutions have been presented under different research outputs. However, to the best of our knowledge, the current solutions suffer from different bottlenecks that impact not only the adoption of such platforms but also the massive penetration within small farms. Challenges that are linked to the systems’ cost, ease of use, automation capabilities, operation & maintenance, security, and even remote access and usage of artificial intelligence. We believe that there is no perfect system, and we are convinced that there is always a space for the system’s enhancement and adaptation to different use cases. In the following, we compare the results from similar works based on the most common challenges such as resources’ optimization, cost analysis, quality of services, networking challenges, artificial intelligence, operation and maintenance, remote accessibility, and security:
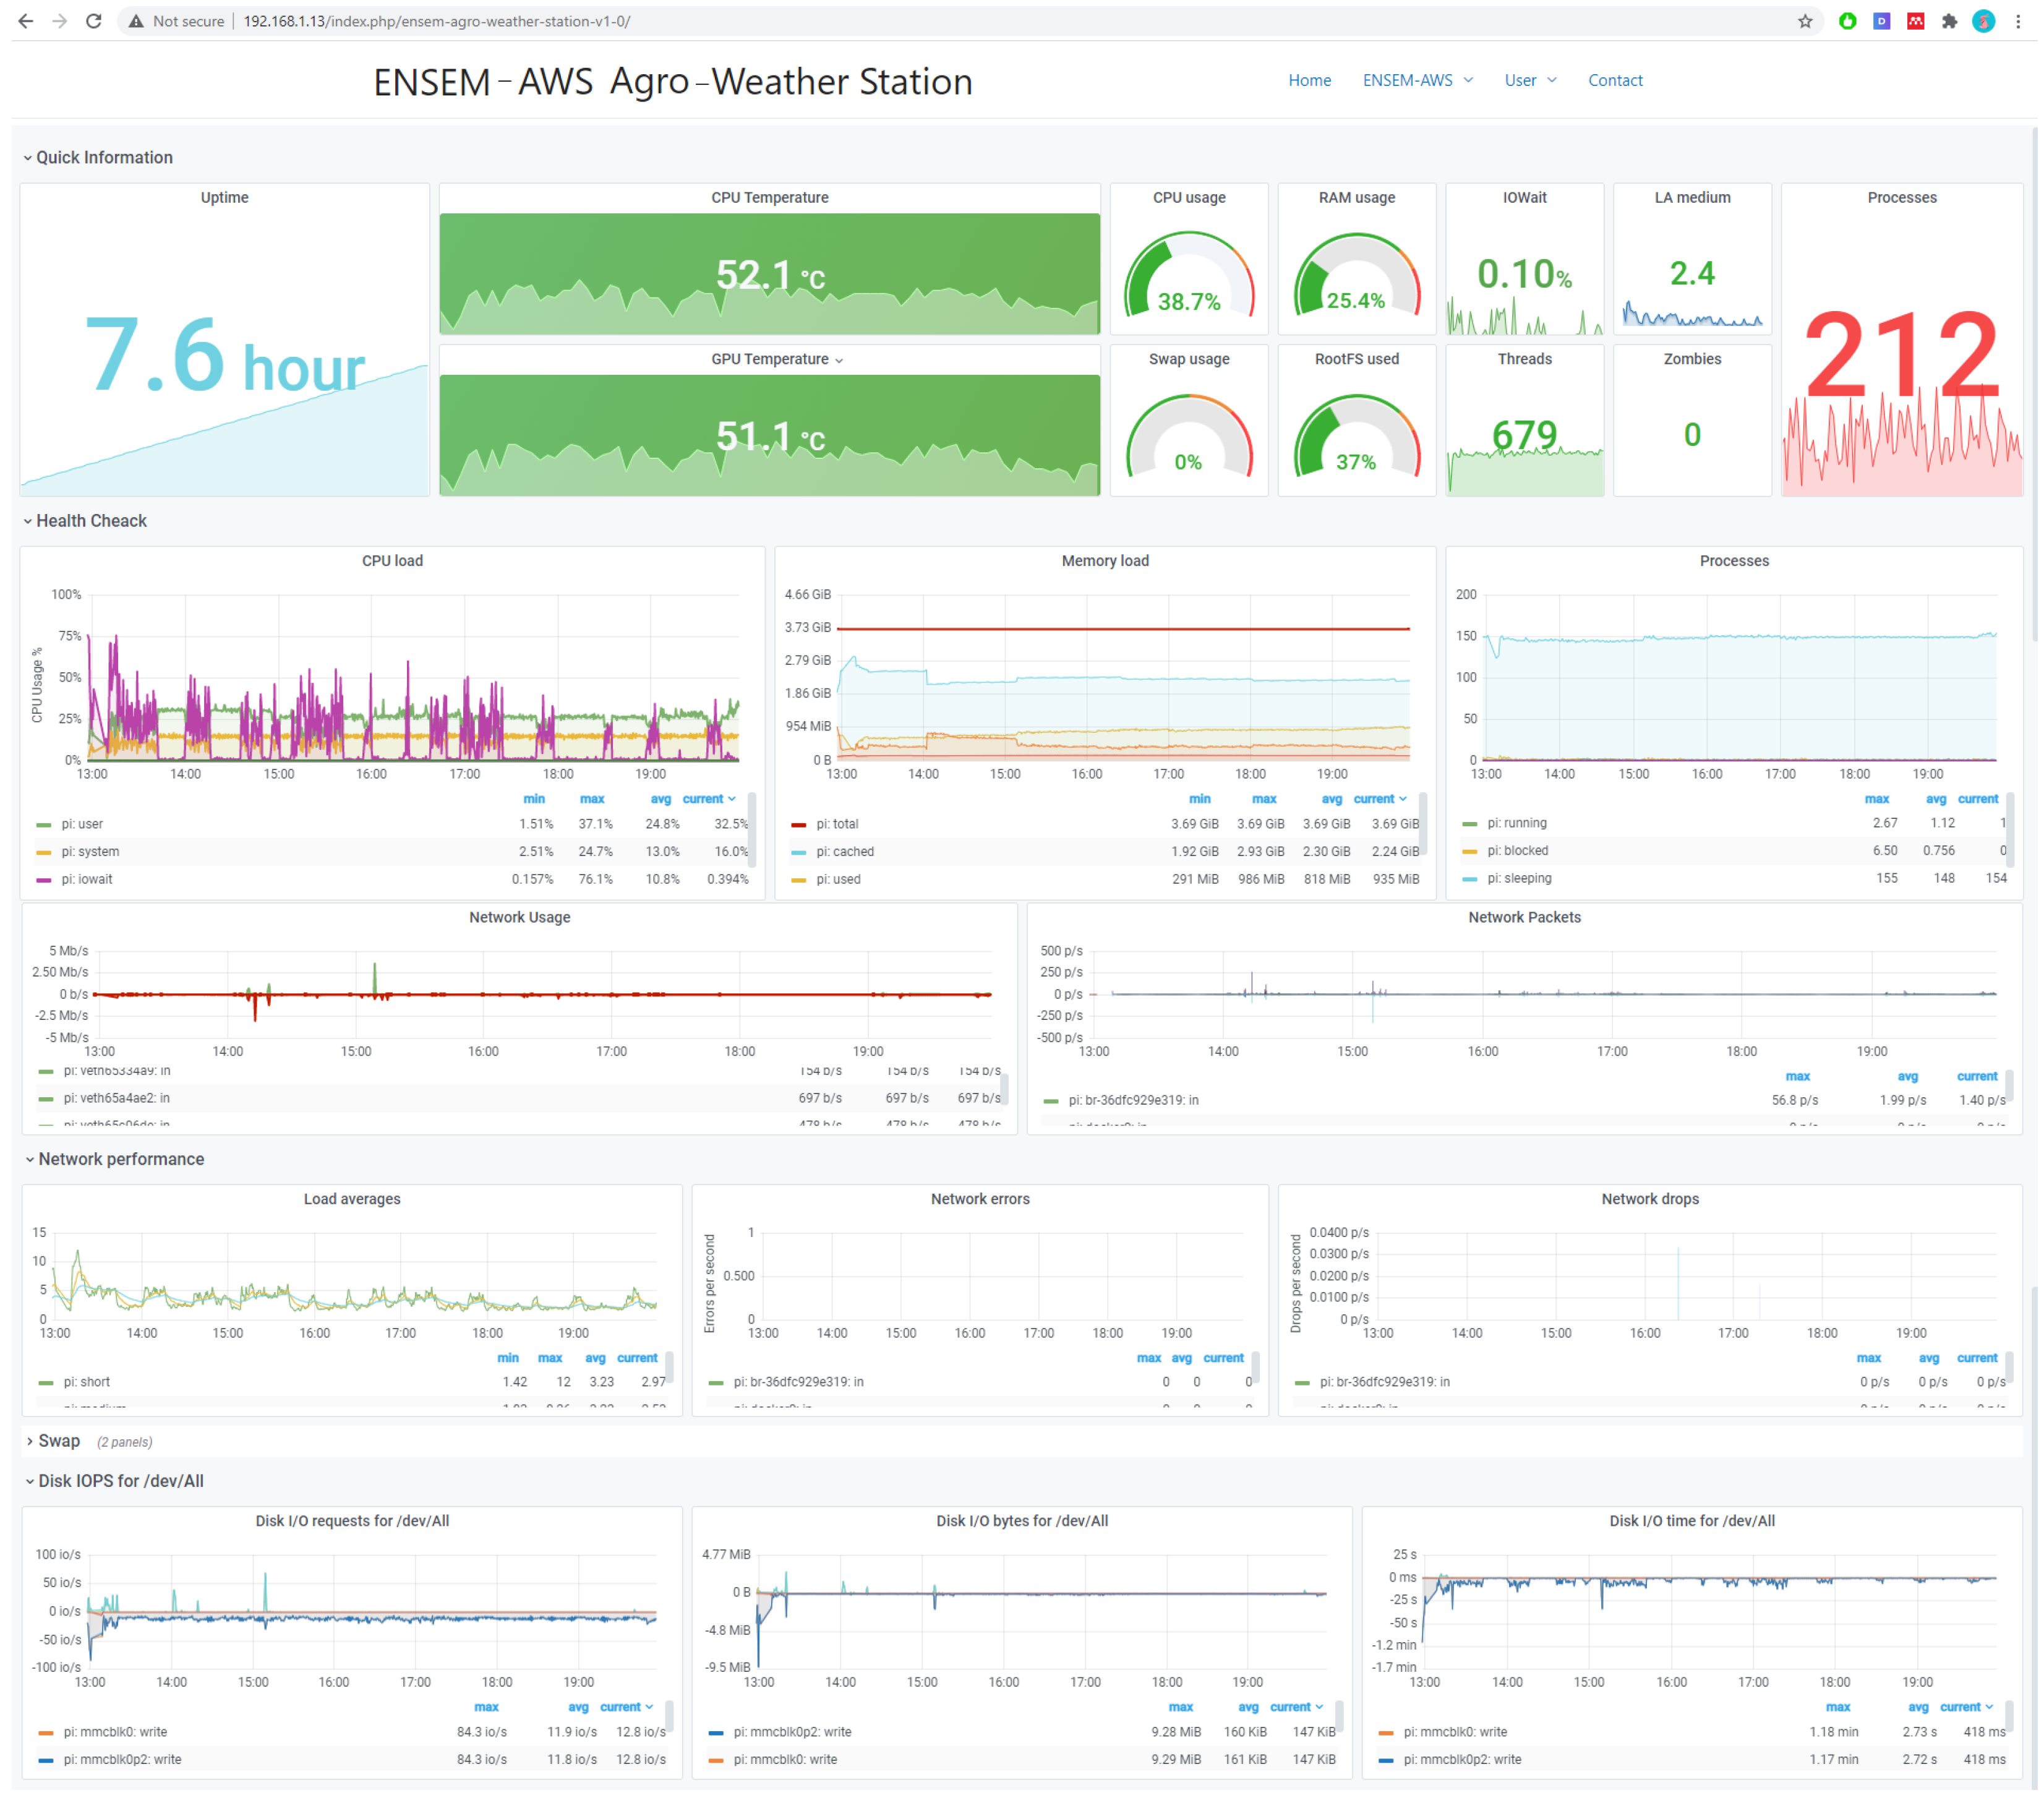
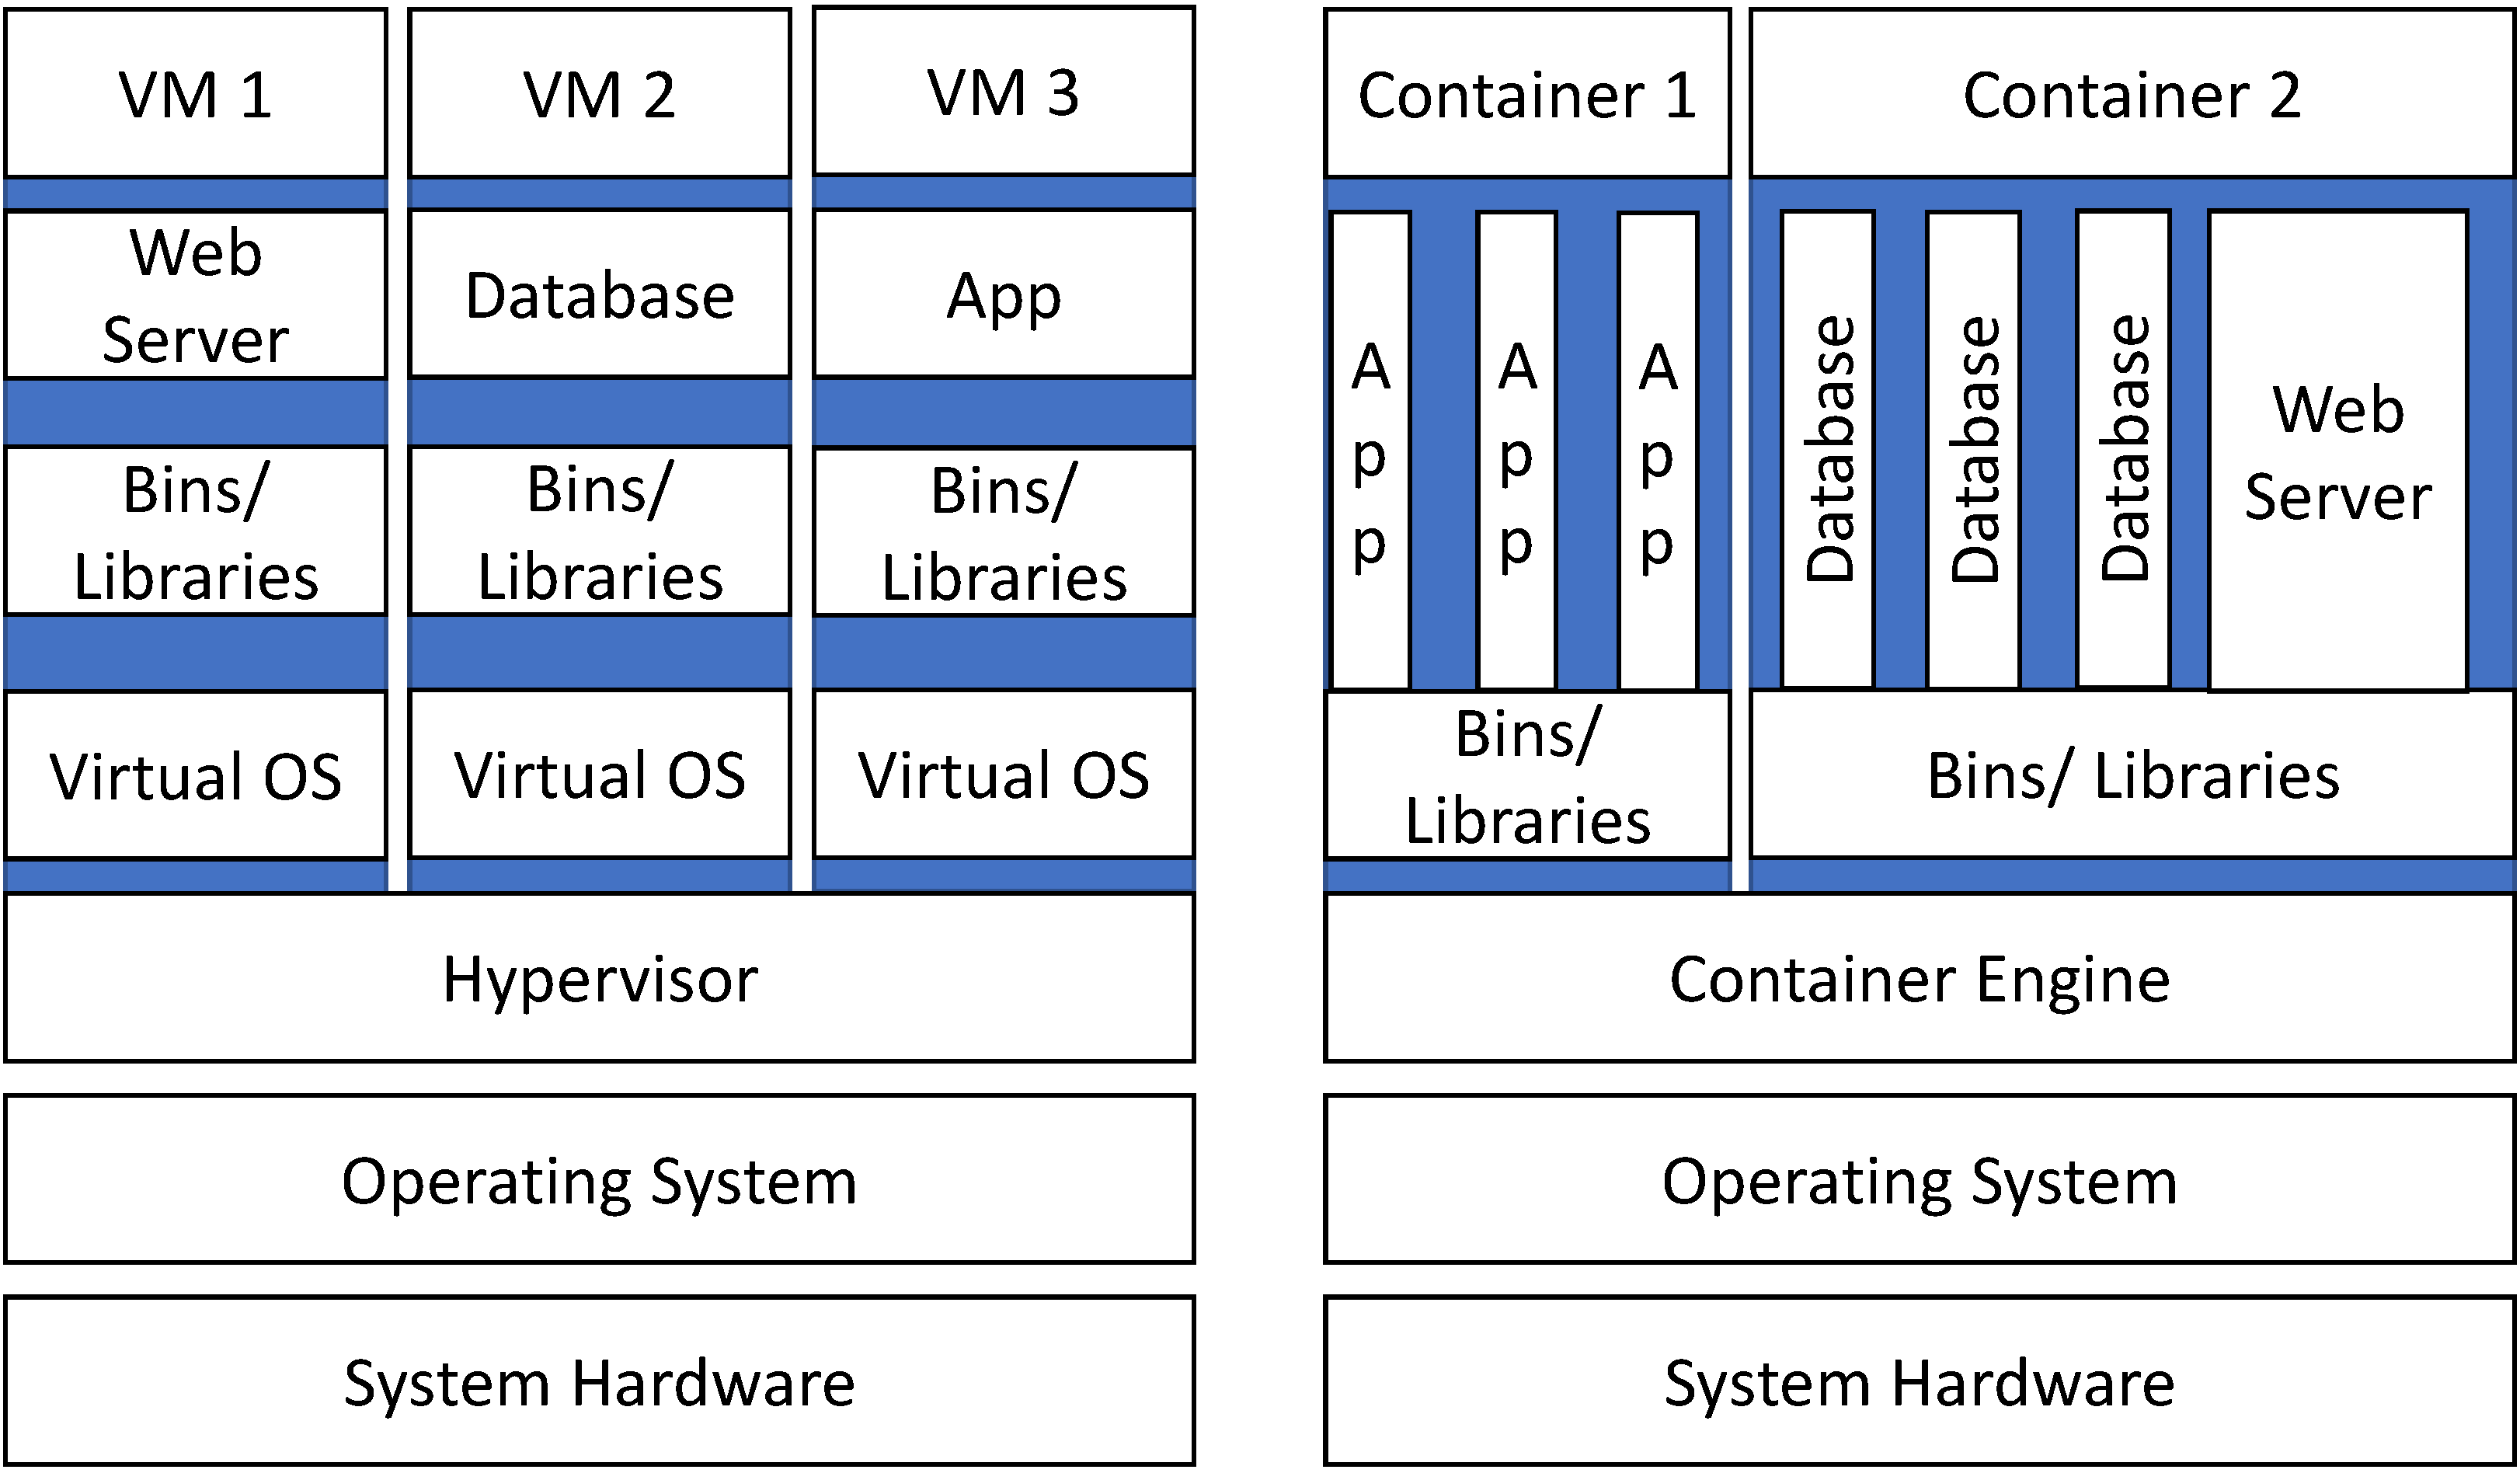
  • Resources’ optimization: Our proposed work relies on a fully containerized architecture, where services are not only lightweight but scalable, agile, and portable. This makes the agro-weather station’s full software architecture manageable and reproducible within a very short amount of time. It allows us to have very reliable and optimized micro-services such as local web server, time-series database, VPN server, etc that consume wisely the BS’s resources such as CPU, memory, and network as presented in Figure 11. Meanwhile, all the studied works in this article [20,21,22,23,24,25,26,27,28,29,30,52,53,54,55,56,57,58,59] are based on classical low-performance system on chips (SoCs) in designing and implementing station. The used SoCs such as Arduino microcontroller doesn’t support multitasking such as Raspberry Pi micro-computer, which limit the performance of the stations to basic monitoring tasks.
  • Cost analysis: In our work, we provide an Opex and Capex deep analysis to support the cost-effectiveness approach targeted in this work. Thus, we estimated the cost of investment to build the agro-weather station at 176 $ as depicted in Section 2.2.1. While, works presented in [22,25,26,30,57,58,59] have claimed development of a low-cost-based system for smart farming, meanwhile no one of these contributions has provided a detailed operation based analysis and capital based costing.
  • Quality of services: When studying the literature, we can see that there is a huge limitation when it comes to the deployment of a fully multi-agent-based architecture in systems’ design. In [28] the author presents a logical tailored approach for multi-user architecture design. In [21,22,23], the authors proposed the deployments of advisory systems either for early disease detection or crop productivity management. However, the proposed works focus on the design of a generic prototype rather than a customized approach relevant to each user type. Meanwhile, our system tries to provide different features adapted to different users based on real use-cases. Remote access to engineers and researchers, temperature forecasting for farmers and researchers, data security for all users are all standalone agents within the BS. Each agent ensures the utility and warranty of its functions and services.
  • Networking: We address the networking challenge based on fully agile architecture embedding different heterogeneous nodes. Our system supports multiple protocols for backbone transmission protocols such as (MQTT, NRF24L01, LAN). The platform is also extended for other protocols. Additionally, we create a system that supports plug-and-play nodes as described in Section 3.1. In our platform, we experiment with the proposed transmission protocols through the end-to-end monitoring ecosystem. Meanwhile, only [25] presents an adaptive mechanism for reliable smart farming. However, the technique is only dealing with an isolated scope which is transmission without validating the system by an end-to-end smart farming platform. While, other contributions rely on singe transmission protocol such as in [20,22,23,52,55,56,57,58,59] or don’t even support wireless transmission such as in [21,24].
  • Artificial Intelligence: AI becomes a necessity in modern applications and services. In our system, we deploy a high-performing LSTM model part of RNN for temperature forecasting. The deployed model as depicted in Section 3.2.3 shows a high-level performance in temperature prediction which allows the possibility to train and deploy similar models for other meteorological data such as humidity, pressure, wind speed, etc. In our system, we propose the hybrid data collection where historical data is continuously enhanced by the BS itself for a continuous model’s improvement. The BS supports tasks automation in form of cronjob and through a standalone deployed agent for alerts notification. The proposed work in [54] proposes a temperature foresting model based on ANN (Artificial Natural Network), meanwhile, it is known that the ANN is less powerful than the RNN (adopted in this paper). ANN doesn’t support the recurrent connections and is considered to be powerful with tabular data and text data rather than the sequence data which we have in meteorological parameters. Additionally, in [21,22,23] the authors create advisory systems for decision making. The proposed systems require a minimum level of knowledge, while in the developing countries the lack of technological awareness among farmers will be challenging for the usage of such systems. The same technological bottleneck is impacting the usage of AI within drones framework in crop management such as in [30,56]. In [53] authors only present a conceptual model that lacks testing and validation. Meanwhile, no AI implementation is considered in the works in [20,24,25,26,27,28,29,52,55,57,58,59].
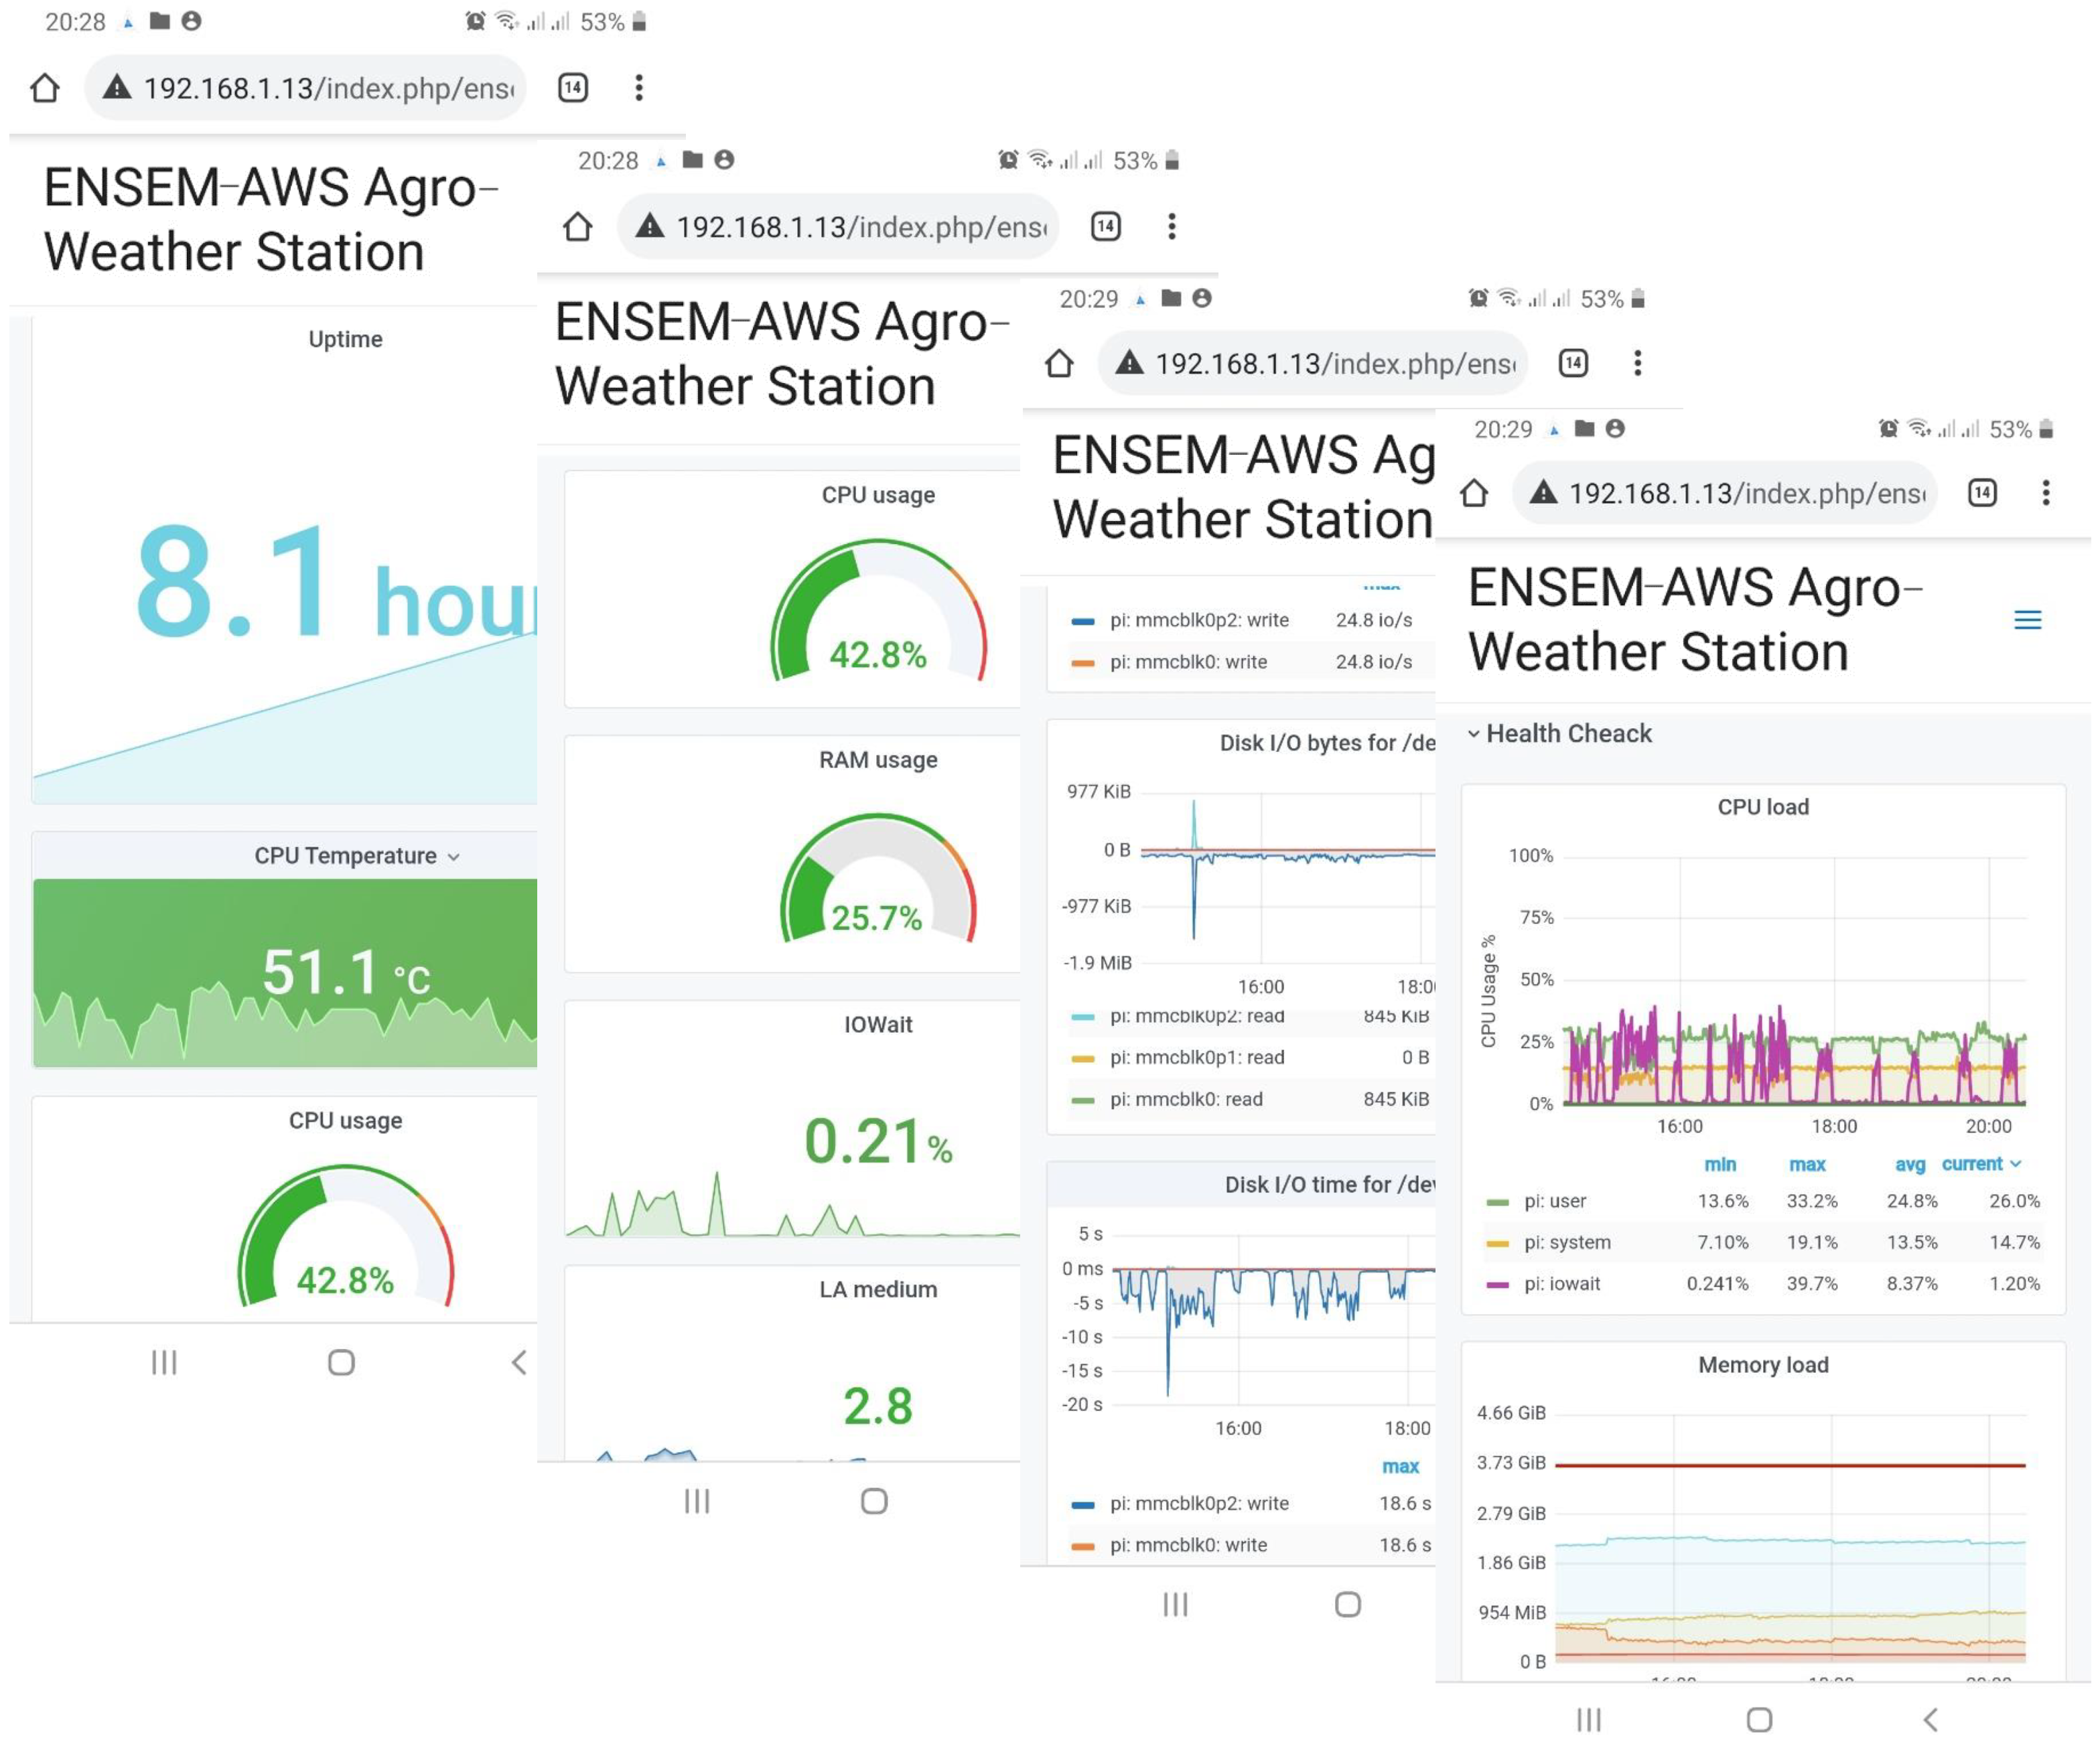
  • Operation and Maintenance: The studied works in this effort focus on the system’s utility through the functionalities and services offered by the proposed platforms, rather than focusing on the warranty through the assurance that the developed platforms and services will deliver the needed requirements. Therefore, no system surveyed in this work offers the possibility to have a holistic dashboard for operation and maintenance. Thus, we have created a dedicated dashboard part of the management layer as presented in Section 3.1. The dashboard will allow users such as engineers to consult different performance metrics such as network usage and packet drops, CPU load, operating system’s threads, and processes, etc. continuously for management purposes.
  • Remote access: None of the surveyed works in this study allows the possibility to have ultimate remote access to the deployed platform and its components. Only conceptual architecture with remote accessibility feature was proposed in [28] and partial data consultation was proposed in [54]. Meanwhile, as part of the system’s customization adopted in this work, we think that full remote accessibility allows tremendous ease of use and cost-saving when it comes to consulting the platform and the locally collected data. Thus, the proposed platform allows different users to connect remotely to the BS and consult all components through the GUI or the SSH sessions.
  • Security: Even though smart farming isn’t a critical domain when it comes to data sensitivity. However, privacy in today’s world is a huge concern for different users. Remote access comes with privacy challenges. As mentioned in Section 2.2.2 and Section 3.2.2 our platform supports the establishment of end-to-end VPN tunnels that add an extra layer of privacy and security when using remote access. The deployed VPN server allows peers to connect using the pre-generated secret keys and certificates that are based on strong 256-bit encryption. Even with the high-security concerns especially in the Covid-19 period, none of the others experimental platforms address or implement any feature or approach for system’s and services’ security and reliability.
A holistic comparison between our proposed system and the existing system is presented in Supplementary Part VII (see Supplementary Materials). In the table, we present the major advantages of the system and the major challenges that we detected during the review. We also categorize the platforms based on their validation. Additionally, we assess their cost-effectiveness based on deployed hardware and software. Finally, we categorized the usage of some features such as operation and maintenance, remote accessibility, and AI implementation.

5. Conclusions

In this paper, we propose an end-to-end AI-powered IoT-based low-cost platform for smart farming. The main goal of the system’s creation is to support different users such as farmers and researchers to monitor, understand, and act for better crop management. The followed approach in system design enables the smooth system’s development and enhancement through its different iterations, releases, and versions. The platform design and development purpose are to propose a real-time context-aware system for continuous cognitive monitoring. Ease of use, portability, low cost, and robustness are among many metrics considered in the system’s design and implementation. The proposed HW and SW prototype was validated on the field and presented a high performance in different activities and operations such as real-time monitoring, temperature forecasting, scalable wireless connections, reliable dashboards, etc. Therefore, we think that our low-cost platform can help farmers and researchers to co-create value and to have an impact on crop management. Additionally, we believe that developed station stress on vital concepts that were missed in similar works such as remote accessibility, security, operation, and maintenance. However, we believe that there is a large space for development and system enhancement. Thus, to enhance the platform performance, our subsequent work will focalize on:
  • Add more advanced functions to enhance the system performance, such as AI-based power management and fault detection agents.
  • Design and create predefined test cases and scenarios that enable extreme ease of use and service for the enhancement of automation.
  • Design AI-based mobility management that can be implemented to BS to reconfigure the platform without the need for human interaction.
  • Migrate the solution to a pure native cloud and support more communication technologies like Lora, Sigfox, and NBIoT.

Supplementary Materials

The following supporting information can be downloaded at: https://www.mdpi.com/article/10.3390/agriculture12010035/s1, Table S1: Some of the most common challenges in IoT, Figure S1: the key principales of Agile Methodology, Table S2: Capex investment, Table S3: Opex investment, Figure S2: Structure of single cell within LSM, Figure S3: Model work flow of a single cell, Figure S4: Feature selection using heat map method, Figure S5: Scatter plot of real values vs. prediction values, Figure S6: Residual plot of different time frame, Table S4: Range and percentage of deviation records, Table S5: Comparison between the proposed platform and other existing platforms.

Author Contributions

Conceptualization, methodology, software, validation, formal analysis, investigation, resources, writing, review, editing, visualization, supervision, project administration, funding acquisition, A.F., M.S. and E.S. All authors have read and agreed to the published version of the manuscript.

Funding

This work was carried out within the framework “Agrometeorological Stations Platform” project funded by the Moroccan Ministry of Higher Education and Scientific Research-National Centre for Scientific and Technical Research (CNRST) (PPR2 project).

Institutional Review Board Statement

Not applicable.

Informed Consent Statement

Not applicable.

Data Availability Statement

The data that support the findings of this study are available on request from the corresponding author.

Acknowledgments

We are grateful to the guest editor and the anonymous reviewers for their valuable comments that substantially improved the presentation of this research.

Conflicts of Interest

The authors declare no conflict of interest.

Abbreviations

The following abbreviations are used in this manuscript:
ACAlternative Current
AIArtificial Intelligence
ANNArtificial Neural Network
ARMAdvanced RISC Machines
CLICommand Line Interface
Covid-19Coronavirus disease-2019
CPUCentral Processing Unit
DBData Base
DCDirect Current
DOSDenial of Service Attacks
FTPFile Transfer Protocol
HDDHard Disk Drive
HTTPHyper Text Transfer Protocol
HWHardware
IoTInternet of Things
GUIGraphical User Interface
KPIKey Performance Indicators
LSTMLong Short Term Memory
M2MMachine-to-Machine
MQTTMessage Queue Telemetry Transport
MASEMean Absolute Scaled Error
NNNeural network
OASISOrganization for the Advancement of Structured Information Standards
O&MOperation and Maintenance
OSOperating System
PAPrecision Agriculture
PaaSPlatform as a Service
RISCReduced Instruction Set Computing
RMSERoot Mean Square Error
RNNRecurrent Neural Network
SFSmart Farming
SSLSecure Socket Layer
SUSStart Upgrade Stop
SWSoftware
STaaSStorage as a Service
TLSTransport Layer Security
UDUser Datagram Protocol
VMVirtual Machine
VPNVirtual Private Network
SVMSupport Vector Machine
SSHSecure Shell
WSNWireless Sensor Network

References

  1. United Nations; Department of Economic and Social Affairs; Population Division. World Population Prospects Highlights, 2019 Revision Highlights, 2019 Revision; United Nations: New York, NY, USA, 2019. [Google Scholar]
  2. O’Grady, M.J.; O’Hare, G.M. Modelling the smart farm. Inf. Process. Agric. 2017, 4, 179–187. [Google Scholar] [CrossRef]
  3. Julian, Q.; Nat, D. Climate Change and Land Tenure; IIED (International Institute for Environment and Development) and Natural Resources Institute, University of Greenwich: London, UK, 2008; p. 68. [Google Scholar]
  4. Ingram, G.K.; Hong, Y.H. (Eds.) Climate Change and Land Policies; Lincoln Institute of Land Policy: Cambridge, MA, USA, 2011. [Google Scholar]
  5. Adomako, T.; Ampadu, B. The Impact Agricultural Practices on Environmental Sustainability in Ghana: A Review. J. Sustain. Dev. 2015, 8, 70. [Google Scholar] [CrossRef]
  6. Mohanavelu, A.; Naganna, S.R.; Al-Ansari, N. Irrigation Induced Salinity and Sodicity Hazards on Soil and Groundwater: An Overview of Its Causes, Impacts and Mitigation Strategies. Agriculture 2021, 11, 983. [Google Scholar] [CrossRef]
  7. Wheeler, T.; von Braun, J. Climate Change Impacts on Global Food Security. Science 2013, 341, 508–513. [Google Scholar] [CrossRef]
  8. Walter, A.; Finger, R.; Huber, R.; Buchmann, N. Opinion: Smart farming is key to developing sustainable agriculture. Proc. Natl. Acad. Sci. USA 2017, 114, 6148–6150. [Google Scholar] [CrossRef] [Green Version]
  9. Akyildiz, I.; Su, W.; Sankarasubramaniam, Y.; Cayirci, E. A survey on sensor networks. IEEE Commun. Mag. 2002, 40, 102–114. [Google Scholar] [CrossRef] [Green Version]
  10. Yick, J.; Mukherjee, B.; Ghosal, D. Wireless sensor network survey. Comput. Netw. 2008, 52, 2292–2330. [Google Scholar] [CrossRef]
  11. Dâmaso, A.; Freitas, D.; Rosa, N.; Silva, B.; Maciel, P. Evaluating the Power Consumption of Wireless Sensor Network Applications Using Models. Sensors 2013, 13, 3473–3500. [Google Scholar] [CrossRef]
  12. Faid, A.; Sadik, M.; Sabir, E. IHEE: An Improved Hybrid Energy Efficient Algorithm for WSN. In Advances in Information and Communication; Arai, K., Ed.; Springer International Publishing: Cham, Switzerland, 2021; pp. 283–298. [Google Scholar]
  13. Trendov, N.M.; Varas, S.; Zeng, M. Digital Technologies in Agriculture and Rural Areas—Status Paper; FAO: Rome, Italy, 2019; p. 157. [Google Scholar]
  14. Farooq, M.S.; Riaz, S.; Abid, A.; Umer, T.; Zikria, Y.B. Role of IoT Technology in Agriculture: A Systematic Literature Review. Electronics 2020, 9, 319. [Google Scholar] [CrossRef] [Green Version]
  15. Villa-Henriksen, A.; Edwards, G.T.; Pesonen, L.A.; Green, O.; Sørensen, C.A.G. Internet of Things in arable farming: Implementation, applications, challenges and potential. Biosyst. Eng. 2020, 191, 60–84. [Google Scholar] [CrossRef]
  16. Jawad, H.; Nordin, R.; Gharghan, S.; Jawad, A.; Ismail, M. Energy-Efficient Wireless Sensor Networks for Precision Agriculture: A Review. Sensors 2017, 17, 1781. [Google Scholar] [CrossRef] [Green Version]
  17. Khanna, A.; Kaur, S. Evolution of Internet of Things (IoT) and its significant impact in the field of Precision Agriculture. Comput. Electron. Agric. 2019, 157, 218–231. [Google Scholar] [CrossRef]
  18. Talaviya, T.; Shah, D.; Patel, N.; Yagnik, H.; Shah, M. Implementation of artificial intelligence in agriculture for optimisation of irrigation and application of pesticides and herbicides. Artif. Intell. Agric. 2020, 4, 58–73. [Google Scholar] [CrossRef]
  19. Navarro, E.; Costa, N.; Pereira, A. A Systematic Review of IoT Solutions for Smart Farming. Sensors 2020, 20, 4231. [Google Scholar] [CrossRef]
  20. Gangwar, D.S.; Tyagi, S.; Soni, S.K. A conceptual framework of agroecological resource management system for climate-smart agriculture. Int. J. Environ. Sci. Technol. 2019, 16, 4123–4132. [Google Scholar] [CrossRef]
  21. Khattab, A.; Habib, S.E.; Ismail, H.; Zayan, S.; Fahmy, Y.; Khairy, M.M. An IoT-based cognitive monitoring system for early plant disease forecast. Comput. Electron. Agric. 2019, 166, 105028. [Google Scholar] [CrossRef]
  22. Muzafarov, F.; Eshmuradov, A. Wireless sensor network based monitoring system for precision agriculture in Uzbekistan. TELKOMNIKA Telecommun. Comput. Electron. Control 2019, 17, 10. [Google Scholar] [CrossRef] [Green Version]
  23. Nawandar, N.K.; Satpute, V.R. IoT based low cost and intelligent module for smart irrigation system. Comput. Electron. Agric. 2019, 162, 979–990. [Google Scholar] [CrossRef]
  24. Doshi, J.; Patel, T.; Bharti, S.k. Smart Farming using IoT, a solution for optimally monitoring farming conditions. Procedia Comput. Sci. 2019, 160, 746–751. [Google Scholar] [CrossRef]
  25. Ramli, M.R.; Daely, P.T.; Kim, D.S.; Lee, J.M. IoT-based adaptive network mechanism for reliable smart farm system. Comput. Electron. Agric. 2020, 170, 105287. [Google Scholar] [CrossRef]
  26. Sadowski, S.; Spachos, P. Wireless technologies for smart agricultural monitoring using internet of things devices with energy harvesting capabilities. Comput. Electron. Agric. 2020, 172, 105338. [Google Scholar] [CrossRef]
  27. Popović, T.; Latinović, N.; Pešić, A.; Žarko, Z.; Krstajić, B.; Djukanović, S. Architecting an IoT-enabled platform for precision agriculture and ecological monitoring: A case study. Comput. Electron. Agric. 2017, 140, 255–265. [Google Scholar] [CrossRef]
  28. Köksal, Ö.; Tekinerdogan, B. Architecture design approach for IoT-based farm management information systems. Precis. Agric. 2019, 20, 926–958. [Google Scholar] [CrossRef] [Green Version]
  29. Leelavinodhan, P.B.; Vecchio, M.; Antonelli, F.; Maestrini, A.; Brunelli, D. Design and Implementation of an Energy-Efficient Weather Station for Wind Data Collection. Sensors 2021, 21, 3831. [Google Scholar] [CrossRef]
  30. Almalki, F.A.; Soufiene, B.O.; Alsamhi, S.H.; Sakli, H. A Low-Cost Platform for Environmental Smart Farming Monitoring System Based on IoT and UAVs. Sustainability 2021, 13, 5908. [Google Scholar] [CrossRef]
  31. Faid, A.; Sadik, M.; Sabir, E. IoT-based Low Cost Architecture for Smart Farming. In Proceedings of the 2020 International Wireless Communications and Mobile Computing (IWCMC), Limassol, Cyprus, 15–19 June 2020; pp. 1296–1302. [Google Scholar] [CrossRef]
  32. Faid, A.; Sadik, M.; Sabir, E. EACA: An Energy Aware Clustering Algorithm for Wireless IoT Sensors. In Proceedings of the 2021 28th International Conference on Telecommunications (ICT), Vancouver, BC, Canada, 29–30 April 2021; pp. 1–6. [Google Scholar] [CrossRef]
  33. Aminikhanghahi, S.; Cook, D.J. A survey of methods for time series change point detection. Knowl. Inf. Syst. 2017, 51, 339–367. [Google Scholar] [CrossRef] [Green Version]
  34. Grigorik, I. Making the Web Faster with HTTP 2.0. Commun. ACM 2013, 56, 42–49. [Google Scholar] [CrossRef]
  35. Deschambault, O.; Gherbi, A.; Légaré, C. Efficient Implementation of the MQTT Protocol for Embedded Systems. J. Inf. Process. Syst. 2017, 13, 26–39. [Google Scholar]
  36. Microchip Technology. ATmega328P Datasheet. 2021. Available online: https://www.microchip.com/wwwproducts/en/ATmega328P (accessed on 13 April 2021).
  37. Nordic Semiconductor. nRF24L01 Datasheet. 2021. Available online: https://www.sparkfun.com/datasheets/Components/SMD/nRF24L01Pluss_Preliminary_Product_Specification_v1_0.pdf (accessed on 13 April 2021).
  38. Al-Shorman, M.Y.; Al-Kofahi, M.M.; Al-Kofahi, O.M. A practical microwatt-meter for electrical energy measurement in programmable devices. Meas. Control 2018, 51, 383–395. [Google Scholar] [CrossRef]
  39. Paunski, Y.K.; Angelov, G.T. Performance and power consumption analysis of low-cost single board computers in educational robotics. IFAC-PapersOnLine 2019, 52, 424–428. [Google Scholar] [CrossRef]
  40. Potdar, A.M.; D G, N.; Kengond, S.; Mulla, M.M. Performance Evaluation of Docker Container and Virtual Machine. Procedia Comput. Sci. 2020, 171, 1419–1428. [Google Scholar] [CrossRef]
  41. Struckov, A.; Yufa, S.; Visheratin, A.A.; Nasonov, D. Evaluation of modern tools and techniques for storing time-series data. Procedia Comput. Sci. 2019, 156, 19–28. [Google Scholar] [CrossRef]
  42. Maqsood, I.; Khan, M.R.; Abraham, A. An ensemble of neural networks for weather forecasting. Neural Comput. Appl. 2004, 13, 1433–3058. [Google Scholar] [CrossRef]
  43. Kreuzer, D.; Munz, M.; Schlüter, S. Short-term temperature forecasts using a convolutional neural network—An application to different weather stations in Germany. Mach. Learn. Appl. 2020, 2, 100007. [Google Scholar] [CrossRef]
  44. Hochreiter, S.; Schmidhuber, J. Long Short-Term Memory. Neural Comput. 1997, 9, 1735–1780. [Google Scholar] [CrossRef] [PubMed]
  45. Kent, R. Chapter 4—Services. In Energy Management in Plastics Processing, 3rd ed.; Kent, R., Ed.; Elsevier: Amsterdam, The Netherlands, 2018; pp. 105–210. [Google Scholar] [CrossRef]
  46. Willmott, C.J. On the Validation of Models. Phys. Geogr. 1981, 2, 184–194. [Google Scholar] [CrossRef]
  47. Delle Monache, L.; Nipen, T.; Deng, X.; Zhou, Y.; Stull, R. Ozone ensemble forecasts: 2. A Kalman filter predictor bias correction. J. Geophys. Res. Atmos. 2006, 111. [Google Scholar] [CrossRef]
  48. Kang, D.; Mathur, R.; Rao, S.T.; Yu, S. Bias adjustment techniques for improving ozone air quality forecasts. J. Geophys. Res. Atmos. 2008, 113. [Google Scholar] [CrossRef] [Green Version]
  49. Hyndman, R.J.; Koehler, A.B. Another look at measures of forecast accuracy. Int. J. Forecast. 2006, 22, 679–688. [Google Scholar] [CrossRef] [Green Version]
  50. Willmott, C.J. On the Evaluation of Model Performance in Physical Geography. In Spatial Statistics and Models; Gaile, G.L., Willmott, C.J., Eds.; Springer: Dordrecht, The Netherlands, 1984; pp. 443–460. [Google Scholar] [CrossRef]
  51. Stack, L.; Dill, J.; Pundt, L.; Raudales, R.; Smith, C.; Smith, T. New England Greenhouse Floriculture Guide; A Management Guide for Insects, Diseases, Weeds and Growth Regulators. Northeast Greenhouse Conference and Expo. 2017–2018. Available online: https://www.plantgrower.org/uploads/6/5/5/4/65545169/17section_b_2017-18_floriculture_guide.pdf (accessed on 13 April 2021).
  52. Codeluppi, G.; Cilfone, A.; Davoli, L.; Ferrari, G. LoRaFarM: A LoRaWAN-Based Smart Farming Modular IoT Architecture. Sensors 2020, 20, 2028. [Google Scholar] [CrossRef] [Green Version]
  53. Ratnakumari, K.; Koteswari, S. Design & implementation of innovative IoT based smart agriculture management system for efficient crop growth. J. Eng. Sci. 2020, 11, 607–616. [Google Scholar]
  54. Castañeda-Miranda, A.; Castaño-Meneses, V.M. Internet of things for smart farming and frost intelligent control in greenhouses. Comput. Electron. Agric. 2020, 176, 105614. [Google Scholar] [CrossRef]
  55. Tiglao, N.M.; Alipio, M.; Balanay, J.V.; Saldivar, E.; Tiston, J.L. Agrinex: A low-cost wireless mesh-based smart irrigation system. Measurement 2020, 161, 107874. [Google Scholar] [CrossRef]
  56. Roy, S.K.; De, D. Genetic Algorithm based Internet of Precision Agricultural Things (IopaT) for Agriculture 4.0. Internet Things 2020, 1, 100201. [Google Scholar] [CrossRef]
  57. Cicioğlu, M.; Çalhan, A. Smart agriculture with internet of things in cornfields. Comput. Electr. Eng. 2021, 90, 106982. [Google Scholar] [CrossRef]
  58. Podder, A.K.; Bukhari, A.A.; Islam, S.; Mia, S.; Mohammed, M.A.; Kumar, N.M.; Cengiz, K.; Abdulkareem, K.H. IoT based smart agrotech system for verification of Urban farming parameters. Microprocess. Microsyst. 2021, 82, 104025. [Google Scholar] [CrossRef]
  59. Gao, D.; Sun, Q.; Hu, B.; Zhang, S. A Framework for Agricultural Pest and Disease Monitoring Based on Internet-of-Things and Unmanned Aerial Vehicles. Sensors 2020, 20, 1487. [Google Scholar] [CrossRef] [PubMed] [Green Version]
Figure 1. High level presentation of wireless sensor network.
Agriculture 12 00035 g001
Figure 2. The End-to-End high-level decomposition of the proposed agro-weather station.
Agriculture 12 00035 g002
Figure 3. The middleware’s Multi-Agents.
Agriculture 12 00035 g003
Figure 4. The high level block diagram of the agro-weather station.
Agriculture 12 00035 g004
Figure 5. Virtualization versus containerization.
Agriculture 12 00035 g005
Figure 6. Overview on Docker’s containers and interaction with cloud and Colab.
Agriculture 12 00035 g006
Figure 7. Geographic location of the study area (Casablanca, Morocco).
Agriculture 12 00035 g007
Figure 8. Exemplary plots of Temperature range, Temperature dew point, Temperature Max, Temperature Min, Temperature, Precipitation, Humidity, Relative humidity, Pressure, Wind speed range, Wind speed Max, Wind speed Min, Wind speed.
Agriculture 12 00035 g008
Figure 9. The network’s communication workflow.
Agriculture 12 00035 g009
Figure 10. The agro-weather station in a field in Casablanca, Morocco.
Agriculture 12 00035 g010
Figure 11. The agro-weather station dashboard.
Agriculture 12 00035 g011
Figure 12. Remote access to the agro-weather station using VPN.
Agriculture 12 00035 g012
Figure 13. Temperature and humidity records of the agro-weather station.
Agriculture 12 00035 g013
Figure 14. Wind speed, direction and distribution of the agro-weather station.
Agriculture 12 00035 g014
Figure 15. Wind speed records of the agro-weather station.
Agriculture 12 00035 g015
Figure 16. Presentation of MASE-based and RMSE-based and Willmott’s-based training curve.
Agriculture 12 00035 g016
Figure 17. Prediction deviation vs. number of records.
Agriculture 12 00035 g017
Figure 18. Model validation—Muli-timeframe temperature prediction. (a) daily predictions vs. real plot for 8 years (entire dataset). (b) daily predictions vs. real plot for 1 month. (c) daily predictions vs. real plot for 1 year.
Agriculture 12 00035 g018
Table 1. Sensors’ technical specifications.
SensorRangeAccuracyResolution
Air Temperature 0 to 50 ± 1 1
Air Humidity0–100% ± % 0.5 %
Soil Temperature 0 60 ± 2 1
Relative Permittivity1–81 ± 3 % <0.02
Wind Speed5–100 km / h ± 1 km / h 1 km / h
Wind Direction 0 360 ± 2 22 . 5
Solar Radiation360 to 1120 nm ± 5 % 1 W / m 2
Table 2. Comparison between wireless transmission protocols.
ParametersStandardsBandData RateRangeEnergy Effeciency
WIFIIEEE 802.112.4–60 GHz1 Mbps–7 Gbps20–100 mLow
ZigBeeIEEE 802.15.42.4 GHz20–250 Kbps10–20 mHigh
BluetoothIEEE 802.15.12.4 GHz24 Mbps8–10 mHigh
MQTTOASIS2.4 GHz259 Kbps-High
Cellular2G/3G/4G9000 MHz, 18,000 MHz, 21,000 MHz, 2700 MHz--Medium
LoRaWANLoRa R1868/900 MHz0.3–50 Kbps30 kmVery High
SigFoxSigFox200 KHz100–600 bps30–50 kmVery High
Table 3. The HW and SW mapping towards layers.
LayerRaspberry PiDockerNode-REDInfluxDBMQTTWeb Server (Apache)CloudColabVPNWireless Nodes
Perception LayerYES YES YES YES
Transmission LayerYESYESYES YES YES
Presentation LayerYESYES YES YESYESYES
Management LayerYESYES YES YES
Middleware LayerYES
Table 4. Data feature of the our model.
FeatureUnitDescription
Temperature rangeCelsius (°C)Temperature range at a height of 2 m above the earth’s surface
Temperature dewCelsius (°C)dew/Frost point at a height of 2 m above the earth’s surface
Temperature MaxCelsius (°C)Maximum temperature at a height of 2 m above the earth’s surface
Temperature MinCelsius (°C)Minimum temperature at a height of 2 m above the earth’s surface
TemperatureCelsius (°C)Temperature at a height of 2 m above the earth’s surface
Earth skin temperatureCelsius (°C)Earth skin temperature at a height of 2 m above the earth’s surface
PrecipitationmmPrecipitation
Humidityg/kgSpecific humidity at a height of 2 m above the earth’s surface
Relative humidity%Relative humidity at a height of 2 m above the earth’s surface
PressurekPaSurface pressure
Wind speed rangem/sWind speed range at a height of 10 m above the earth’s surface
Wind speed Minm/sMinimum wind speed at a height of 10 m above the earth’s surface
Wind speed Maxm/sMaximum wind speed at a height of 10 m above the earth’s surface
Wind speedm/sMinimum wind speed at a height of 10 m above the earth’s surface
Publisher’s Note: MDPI stays neutral with regard to jurisdictional claims in published maps and institutional affiliations.

