Article

Agro Climatic Zoning of Saffron Culture in Miyaneh City by Using WLC Method and Remote Sensing Data

1
Department of Surveying Engineering, Faculty of Civil Engineering, Shahid Rajaee Teacher Training University, Tehran 16788-15811, Iran
2
Department of Soil Science, Faculty of Agriculture, Zanjan University, Zanjan 45371-38791, Iran
3
State Key Laboratory of Information Engineering in Surveying Mapping and Remote Sensing, Wuhan University, Wuhan 430079, China
4
State Key Laboratory of Resources and Environmental Information System, Institute of Geographic Sciences and Natural Resources Research, Chinese Academy of Sciences, Beijing 100101, China
*
Author to whom correspondence should be addressed.
Agriculture 2022, 12(1), 118; https://doi.org/10.3390/agriculture12010118
Submission received: 27 November 2021 / Revised: 28 December 2021 / Accepted: 30 December 2021 / Published: 17 January 2022
(This article belongs to the Section Digital Agriculture)

Abstract

:
Recent continuous droughts and decreasing ground water tables have prompted efforts to improve irrigation schedules and introduce crops that need less water. A study was recently conducted to determine suitable zones for saffron in Miyaneh using Landsat-8 images and the weighted linear combination (WLC) method. Climatic and geographical indices for saffron cultivation in the region were for soil type, slope, soil moisture, and soil salinity. Parameters such as 30 years of data on climate, soil, and water conditions were collected from synoptic and climatologic stations such as Tabriz. Then, parameters were weighted using WLC for importance in each region. The data were transferred to expert choice and clustered, rated, and integrated to produce the last layer. The results showed that the southeastern and northwestern regions of Miyaneh, especially the banks of rivers and catchments, were identified as suitable places for saffron cultivation and that 28% of the area is in the suitable class, 36% in the relatively moderately suitable class, 20% in the critical suitability class, and the rest of the area, which covers about 16% of the area, is in the non-suitable class. Therefore, if it is possible to identify favorable areas for saffron cultivation according to the climatic requirements and it is possible in practice to achieve higher performance per unit area, that in itself will contribute to improved economic conditions and levels of income for farmers. Due to the special characteristics of saffron, substituting it for the cultivation of crops with high water requirements, such as onions, potatoes, tomatoes, etc., will help reduce water consumption.

1. Introduction

One of the most important measures to reduce the dependence of Middle Eastern countries that have numerous oil fields, such as Iran, on oil revenues, is to increase non-oil exports. Creating new opportunities and increasing the level of employment in various sectors of the economy (agriculture, industry, mining), improving the quality of products and their competitiveness, and utilizing unused production capacities are among the factors that make it necessary to pay attention to the development of non-oil exports [1]. Among the export products with comparative advantage, saffron (Crocus sativus) is one of the most important products compatible with heat in arid and semi-arid regions, such as Iran, which is the world’s largest producer of saffron, with a production volume of 261 tons. According to research, the efficiency of water consumption in saffron is higher than in wheat (Triticum aestivum), cotton (Gossypium herbaceum), potato (Solanum tuberosum), or sugar beet (Beta vulgaris). In other words, each cubic meter of water consumed in saffron generates higher income than the other mentioned plants [2]; for every cubic meter of water consumed, the income from saffron is 20 times higher than that from potatoes, and 8.7 times higher than that from cereals. Due to the fact that the growing period for saffron is limited to autumn, winter, and early spring, the water requirement for this product is mainly met by rainfall. For this reason, in recent years, attention has been paid to the cultivation of this crop due to the water shortage conditions in Iran [3]. Saffron production relying on local inputs and low technologies is completely in line with environmental standards, which, today, is the form of organic agriculture that fits perfectly [4]. Saffron is very resistant to cold, but because its growth period coincides with autumn, winter, and early spring, it needs suitable and moderate weather. The yield of saffron is 80% dependent on soil variables and 20% on climatic conditions. Aghhavani Shajari et al., 2015, suggested an altitude range of 2300 to 1300 m and a slope of less than eight percent for saffron growth.
The minimum air temperature is between −18 to −20 °C during the vegetative period, the average air temperature is between 9 and 15 °C, the maximum and reproductive temperature is 30 °C during the recession period, and the climatic needs of this product are mentioned in [5]. Cardone et al. [6] stated that land slope is one of the effective factors in saffron cultivation. Low slope causes better water penetration and increases soil moisture storage. Koocheki et al. [7], mentioned slope aspects as another factor affecting the cultivation of agricultural products. In the northern hemisphere, the slope that faces the sun the most, the southern slope, receives the most radiation. Garcia-Rodriguez et al. [8], stated that it is better if we build a saffron garden on sloping land, with the slope facing south, so that the garden enjoys maximum light and heat.
The estimated amount of saffron in certain geographical areas is necessary for planning and principled decisions regarding economic transactions and trade, in order to formulate appropriate economic plans for export and import [9]. Estimation of the area under crop cultivation is performed using two methods of expert estimation: estimation through cataloging and the use of new technologies (remote sensing and GIS). Obtaining crop statistics with traditional methods leads to numerous mistakes, so it is essential to use accurate methods to help with macro-planning [10]. Remote sensing, by assessing the vegetation of an area, also helps to achieve suitable conditions for plant growth. The ability to examine changes in phenological stages and, of course, changes in production capacity can be very effective [11].
Remote sensing with the help of natural and artificial electromagnetic waves is widely used in agricultural surveys and planning and the management of natural resources [12]. Remote sensing techniques are widely used in various plant-based analyses due to the rotation of images of an area, imaging at different wavelengths at the same time, and finally the ability to quickly process and interpret the data obtained [13]. Remote sensing techniques are also widely used in plant performance analysis due to the rotation of images of an area, imaging at different wavelengths at the same time, and, finally, the possibility of processing and interpreting this information [14,15].
Yusoff et al. [16] investigated the use of satellite imagery to monitor abandoned groves in Malaysia in a semi-automatic manner. In this research, SPOT-6 satellite images with high spatial resolution and multi-time images from the Landsat satellite OLI sensor were used in order to develop the technology for abandoned fields. The results showed that homogeneous measurements obtained from SPOT images play a more important role than the plant phenological features extracted from Landsat images to identify abandoned groves. With the advancement of object-oriented classification, monitoring of an abandoned area can be performed semi-automatically with an accuracy of 92%. Vegetation indicators are a special type of spectral index that are used to analyze satellite image information. Each of these indicators is used in combination with spectral bands to estimate plant biophysical variables. The normalized vegetation difference index has long been used as an indirect method to determine crop performance [17].
This study sought to identify the special areas of saffron cultivation in Miyaneh city using parameters, such as soil salinity, soil type, soil slope, soil moisture, and minimum and maximum temperature of the region, with the help of remote sensing and the weighted linear combination (WLC) model, which can give results with the most accuracy and least error. The weighted linear combination (WLC) model is one the most widely used GIS-based decision rules. The method is often applied in land use/suitability analysis, site selection, and resource evaluation problems. The primary reason for its popularity is that the method is very easy to implement within the GIS environment using map algebra operations and cartographic modeling. The method is also easy to understand and intuitively appealing to decision makers. WLC can be operationalized using any GIS system with overlay capabilities. The overlay techniques allow the attribute map layers (input maps) to be aggregated in order to determine the composite map layer (output map). Some GIS systems (e.g., IDRISI and SPANS) feature WLC modules that perform the WLC procedure [18].
Because saffron is very valuable, we are required to consider conditions with high sensitivity. Soil degradation characteristics, such as salinity and soil texture, can gradually degrade the quality of agricultural products, but if we can obtain accurate data before any investment, then we can be more confident about the optimal conditions. Consider the scenario for growing crops. There are many good agricultural lands that have been left unused because they have not been accurately identified; remote sensing can be of great help in their identification.

2. Materials and Methods
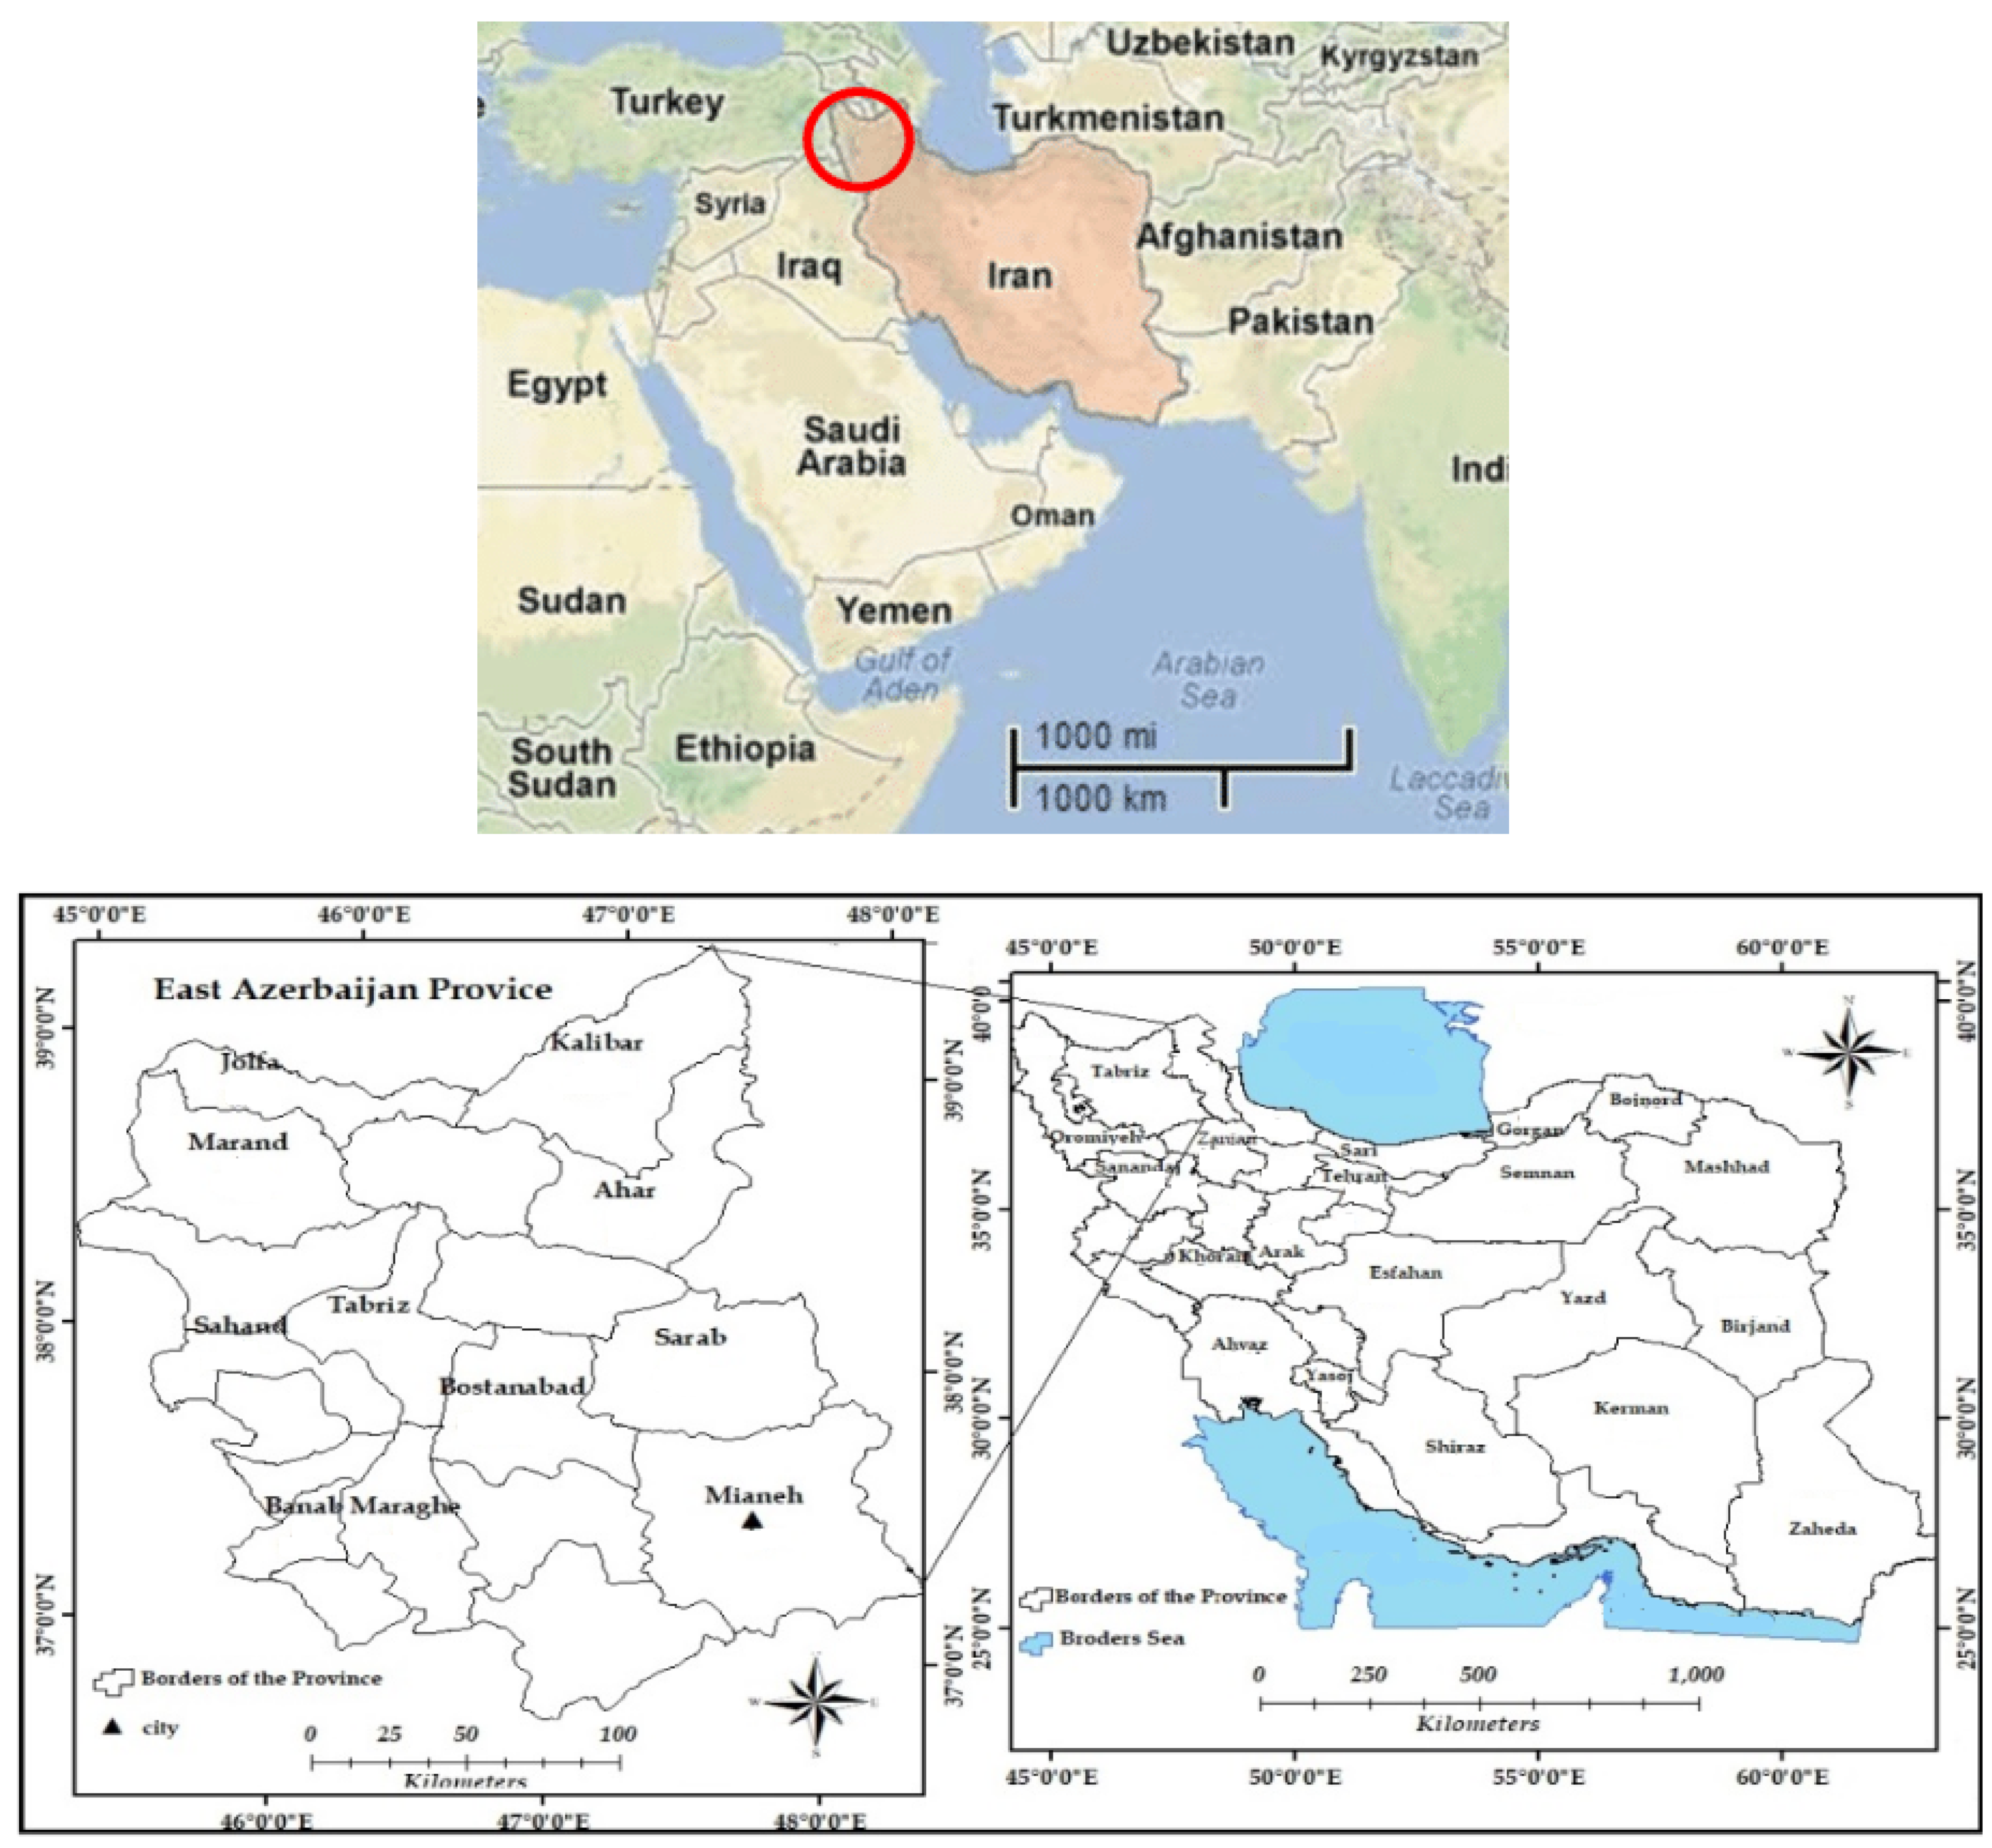
2.1. Study Area

East Azerbaijan Province is located in northwestern Iran. The area of the province is equal to 45,490.88 square kilometers and constitutes 2.8% of the total area of the country. This province is one of the coldest and most mountainous regions in the country. The climate of the province is cold and semi-arid and the average annual rainfall is 250–300 mm. The area of agricultural lands in the province is estimated at about 1.22 million hectares, which is equivalent to 46.6% of the province and about 12.6% of the Iran’s arable land. Miyaneh city is located in the southeast of East Azerbaijan province and as the largest city in the northwest of the country has an area of 5919 km. The city is located at 47 degrees and 42 min east longitude and 37 degrees and 20 min north latitude. Figure 1 shows the location of East Azerbaijan province and Miyaneh city in the province. Miyaneh city has two types of climates per year, so that in mid-spring and summer it has a semi-arid and warm climate, and, in autumn, it has a cold and mountainous climate. The average annual rainfall of 320 mm varies from 393 to 600 mm in the lowlands of the southeast. The average annual temperature in this city is 3 to 14.5 °C in different areas [12].

2.2. Areas Prone to Cultivating Saffron in Miyaneh City

Based on the amount and severity of land restrictions for planting saffron, different areas of Miyaneh city were divided into four classes, including: suitable, moderately suitable, critical suitable, and non-suitable. Areas in the suitable class (S1) do not have any restrictions or have minor restrictions for planting the desired crop; lands that have low restrictions in terms of climate or soil for the desired use are in the moderately suitable class (S2); and lands that have low profitability due to high restrictions are in the critical proportion class (S3). If the income from the intended use is less than the production costs of this product, due to severe restrictions, it will be in the non-suitable class (Table 1).

2.3. Dataset

2.3.1. Field Data

In this study, the ecological needs of saffron were determined using the available resources. Therefore, according to the ecological needs of the crop, a topographic and soil texture map were prepared by the Natural Resources Organization of Miyaneh city. Physiographic layers, including soil texture and slope, plant water requirement, and soil salinity based on Inverse Distance Weighted, were obtained in the ArcGIS environment. Slope maps, soil texture, plant water requirements, and soil salinity were prepared using a digital elevation model (DEM) in the middle of the city in an Arcmap environment at a cell size of 50 m in a raster format. In order to determine the values (values and uniformity of scales in digital layers of map information), methods based on fuzzy logic were used. The fuzzy set is a set that allows its members to have varying degrees of membership between 0 and 1 or 0 to 255 [19]. The fuzzy standardization method usually uses different functions, such as S-shaped, J-shaped, and linear functions for formatting. According to physiographic indices, for a more accurate assessment, it was necessary to determine the relative importance of each factor. In this study, the WLC process was used to weight the criteria. This was performed by designing a questionnaire and having it completed by saffron cultivation specialists at the research site. The weighted linear composition method is the most common technique in multi-criteria evaluation analysis. The purpose of multi-criteria evaluation is to select the best option based on their ranking through the evaluation of several main criteria. This technique is also called the simple summative weighting method or the scoring method. This method is based on the concept of weight average; the analyst or decision maker directly weighs the criteria based on the relative importance under consideration. Then, using Equation (1), multiply the relative weight by the value of that property to obtain a final value for each option.
S = w i x i C j
where S is the degree of desirability, wi is the factor weight, xi is the fuzzy value of the factor, Cj is the standard score of the constraint, and ∏ is the multiplication index [20]. Once the final value of each option has been determined, the options with the highest value are the most appropriate for the purpose of determining the suitability of the land for a particular application, or evaluating the potential of a particular event. According to the main purpose of this research, which is the zoning of lands prone to saffron cultivation in the middle, all climatic conditions are determined according to crop adaptation thresholds and the final map is created. After preparing the saffron cultivation potential map, the area was divided into 4 classes: suitable, moderately suitable, critically suitable, and non-suitable.

2.3.2. Satellite Data

The Landsat 8 satellite is the eighth satellite in the Landsat satellite program, and the seventh to successfully orbit. Originally called the Landsat Data Continuity Mission (LDCM), the satellite is a collaboration between NASA and the USGS. The satellite has two sensors called the Operational Land Imager (OLI) and Thermal Infrared Sensor (TIRS), which collect image information for nine shortwave bands (OLI spectral bands) and two thermal wavelength bands (TIRS spectral bands), respectively. Landsat 8 provides medium resolution images from 15 m to 100 m above the ground and in the polar regions; Landsat 8 is used in the range of visible light, near infrared, short infrared wave and thermal infrared spectrum. Landsat 8 captures about 400 images per day, which is a significant increase from the 250 images per day from the Landsat 7 satellite. As a result, the twelve-bit quantization of data via these bits allows for a more accurate description of ground coverage [21].
Satellite datasets are one of the new methods for field monitoring. The satellite images used in this study are satellite images from the Landsat 8 satellite. Dates from November 2019 to May 2020 were selected. We selected the above dates due to the fact that the cultivation period of most agricultural products is in spring and summer, and saffron is different from other agricultural products in this respect. Saffron’s growth begins in mid-November and remains green until the end of May the following year. Its flowering period is one month and runs from mid-November to mid-December.
In order to create a false color interpretation in this study, with the help of the Optimum Index Factor (OIF), the band composition that best displayed the phenomena in RGB space was determined, and a false color combination was produced. This index is a statistical index that acts based on the standard deviation and correlation coefficient between bands. OIF analysis was performed to create false images between bands 1 to 7 of the OLI sensor, and the best band composition was determined. Through researching of the effect of the ratio of false color composite images from RS images, the method of OIF (The Optimum Index Factor) is discussed. Chavez et al. have put forward a formula to calculate OIF (Optimum Index Factor) by using three standard deviations and a correlation coefficient.
OIF = i = 1 3 S D I j = 1 3 | C C j |
In the Equation (2), SDi means the standard deviation. |CCj| means the absolute value of correlation coefficient. Standard deviation represents the discrete degree. The more value it will be, the more radiation intensity difference we can see and the less of the |CCj|, the less of repeated degree. The results of this index are shown in Table 2. According to Table 2, the best band composition of 756 was determined because the highest amount of OFI recorded for this band composition was reported in [22].
Satellite data in the initial state needs to be corrected due to geometric and atmospheric distortions, this is a correction which must be applied to all bands. Satellite data were corrected to produce high-quality images for classifying, identifying, and distinguishing terrestrial phenomena, which is the primary goal of interpreting satellite data.
The direction of the geometric deviation was corrected in such a way that the output files could be adapted to the map. In order to geometrically correct the OLI sensor images, the first 30 ground control points with UTM coordinates were selected from the topographic map at 1:50,000. Then the points with a high number of errors, which were determined by examination, were removed. Finally, we selected 25 ground control points by applying the nearest neighbor method. The geometric polynomial model of the first degree panchromatic band (15 m) of the earth was referenced [23]. Radiometric correction or calibration of the sensor is necessary when multi-time images are used and the images are related to different seasons or years. These corrections were applied to the data using Equation (3):
Lrad = (DN/Max Gray) × (Lmax − Lmin) + Lmin
where, Lrad: luminosity in a given pixel digit; Lmax: maximum luminance digit in a given band; Lmin: minimum luminance digit in a given band; and Max Gray: calibration scale is the quantification of dimensions (0 < DN < 255). In order to create false color images in this study, with the help of the optimal index factor, the best band composition to display the phenomena in RGB space was determined and a false color combination was produced. This index is a statistical index that acts based on the standard deviation and correlation coefficient between bands [24].

2.4. Weighted Linear Combination (WLC) Method

The process of integrating information layers in a spatial information systems environment involves steps such as creating basic layers, applying basic functions, creating fuzzy layers, and combining information layers based on fuzzy logic. In this regard, fuzzy membership functions were designed and implemented for fuzzy standardization of criteria. In the Geospatial Information Systems (GIS) environment, different methods can be used to combine layers. Due to the implementation of fuzzy functions to standardize data, the weighted linear combination (WLC) method is one of the most desirable methods in this regard. The method of weighted linear composition (WLC) is the most common technique in multi-criteria evaluation analysis. This technique is also called the “scoring method”. This method is based on the weighted mean concept. The analyst or decision maker directly evaluates the criteria, designating value based on the relative importance of each criterion. Then, by multiplying the relative weight (W1, 2, …) by the value (Gx1, 2, …) of that attribute, a final value is achieved for each option. After the final value of each option is determined, the option that has the highest value will be the most appropriate option for the target. In this method of decision rule, the value of each option is calculated by the following Equation (4) [24]:
WLC = [(Gx1 × W1) + (Gx2 × W2) + (G… × W…) +…
In this method, the sum of the weights must be equal to one. In the absence of such conditions, the value of WLC must be divided by the sum of the total weights in the last step. Otherwise, the numerical output will be between 0 and 1. Of course, the output value could be a reason for the better fitting of an option [25]. For this study, four parameters have been used, but the weight of these parameters has not been the same; for this reason, we used the linear weighting method [26].

3. Results

In Arcmap, with the Reclassify command, the desired range was determined for each index, and the index map was binary and generated; that is, each place within the specified range was assigned the number 1 (white) and the rest were assigned the number zero (black). Then, the determined coefficients related to each index were applied, and, finally, the results related to each index in the WLC formula were added together, and the final and normalized image was obtained with the Raster Calculator command in ArcGis. The images of the study area from November to May of every year in the years 2017–2018, 2018–2019, and 2019–2020 were examined. Due to the growing time of saffron, which takes place from November of this year to May of next year, the cultivation of this plant is considered as an autumn cultivation, and the amount of rainfall and humidity on these days is greater than in other months.

3.1. Results of the Weighted Linear Composition Method (WLC)
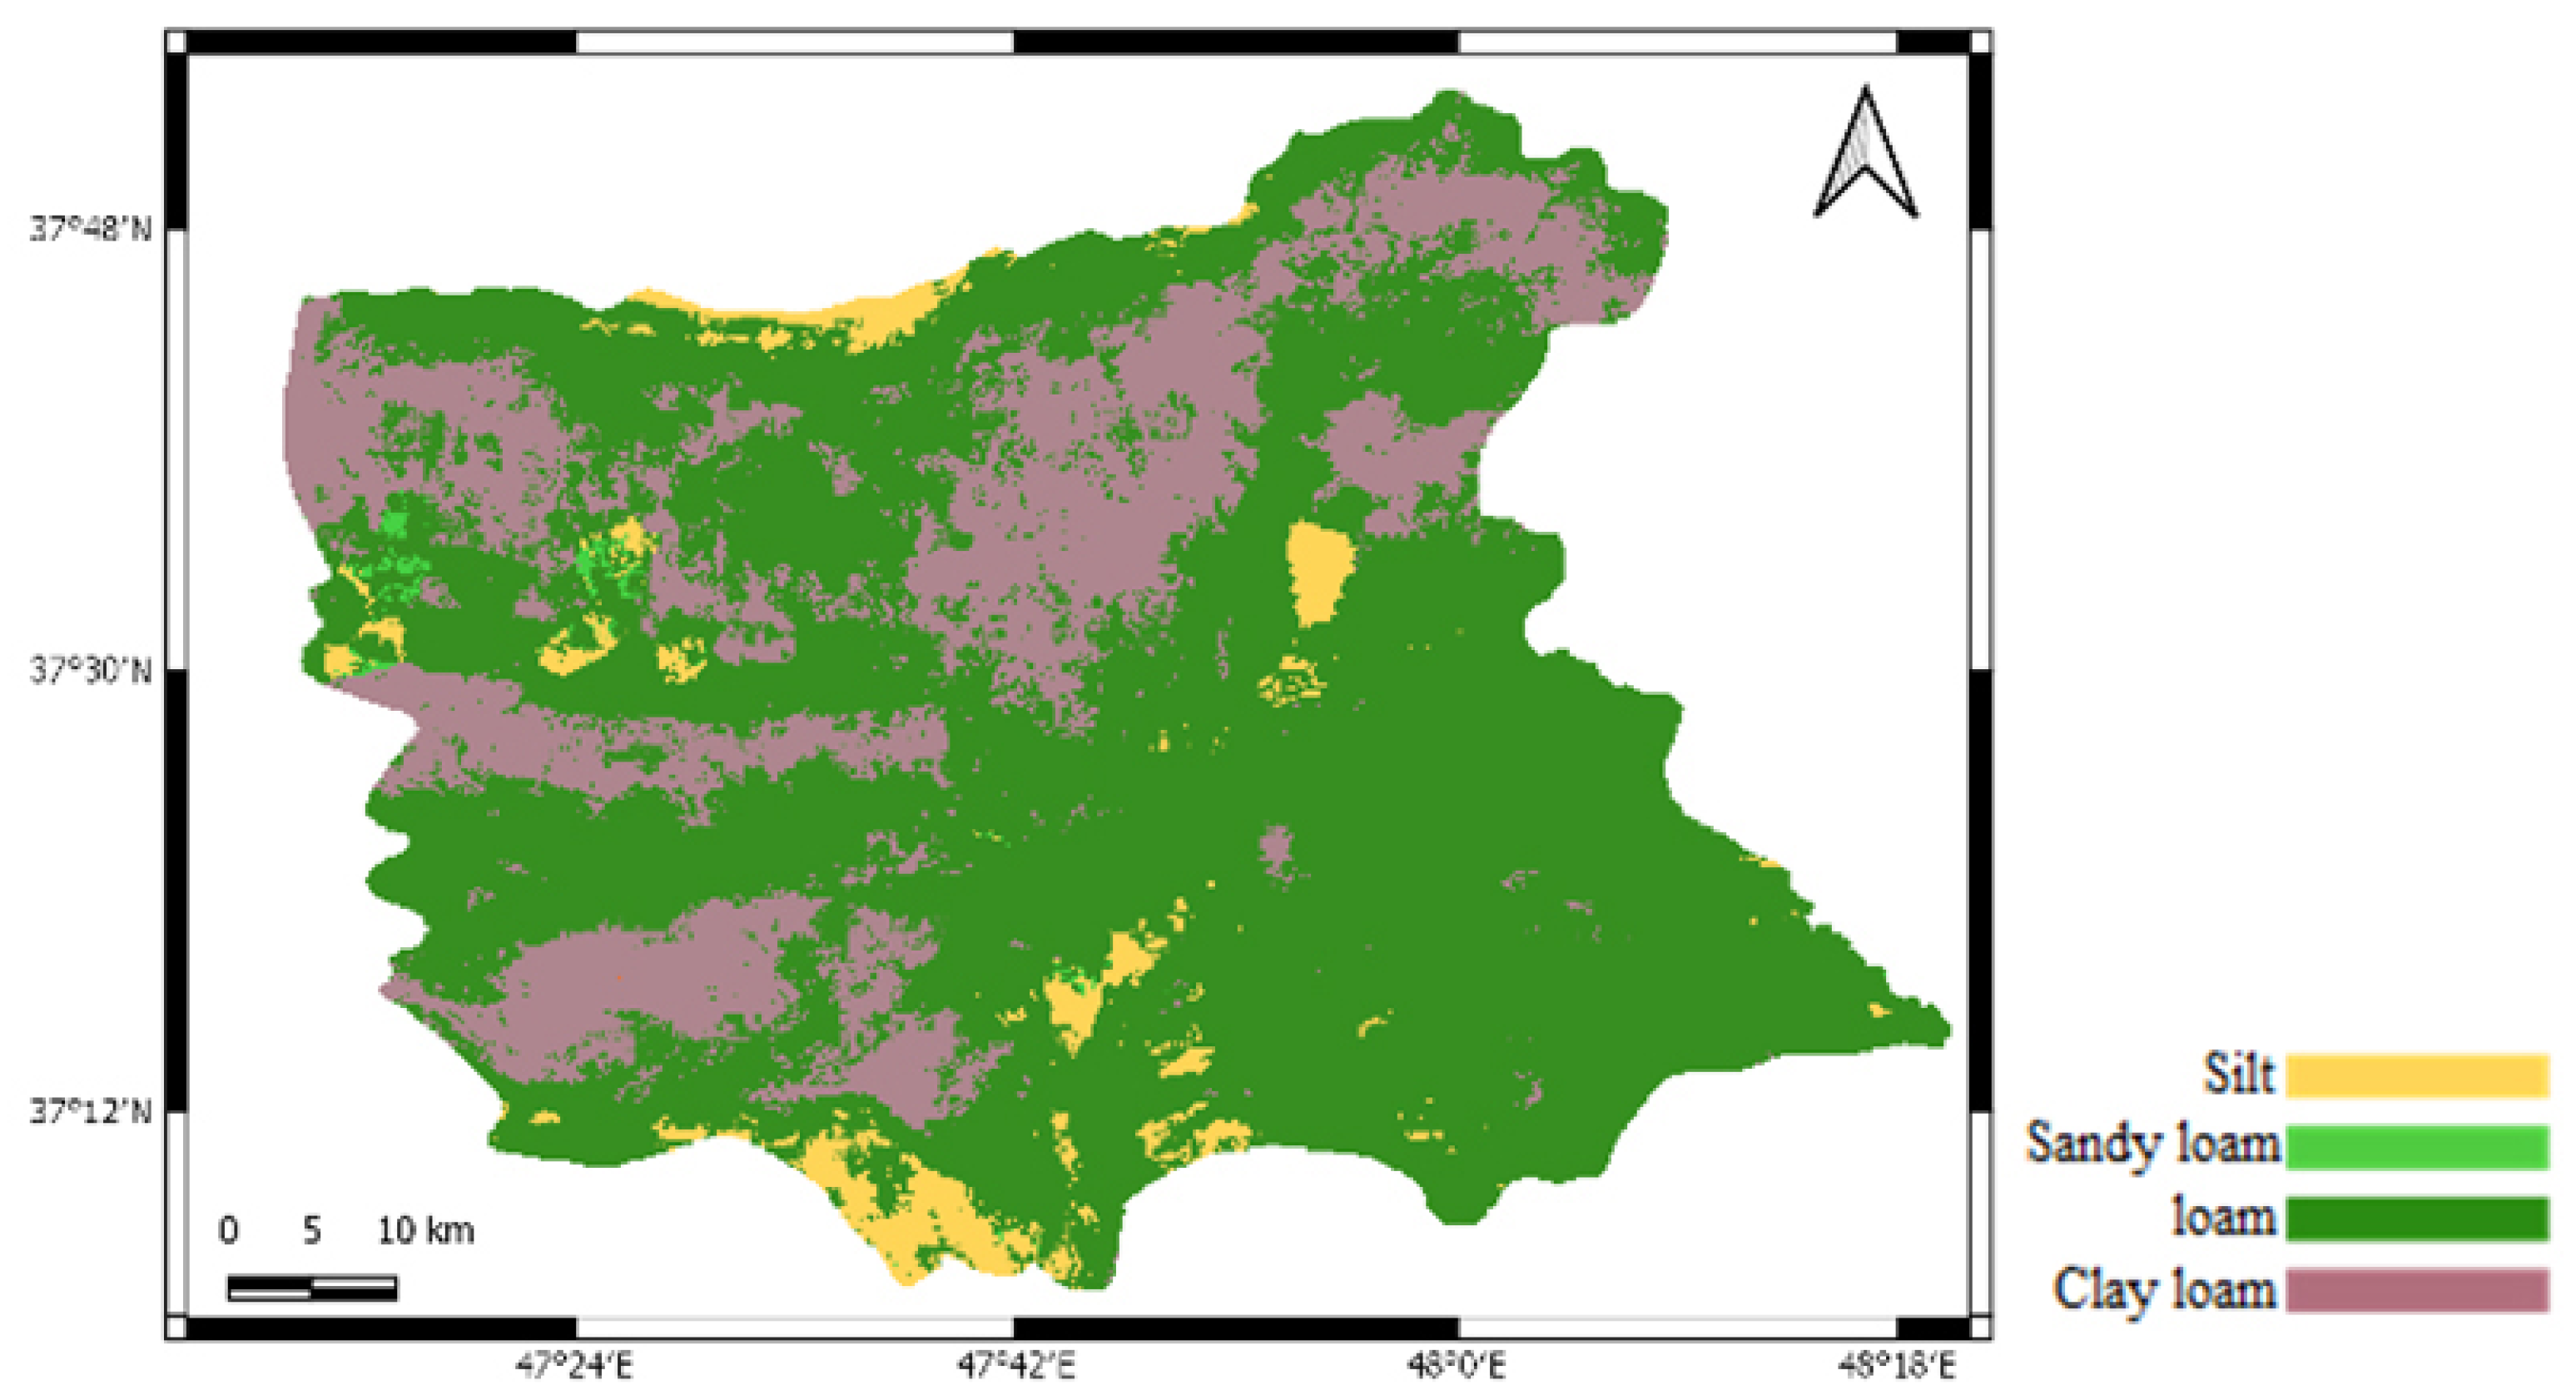
3.1.1. Soil Type

The first and most important factor considered in this study for locating saffron cultivation is soil type. On the soil type map of the region, the yellow color is related to silt, the dark green is related to loam, the light green is related to sandy loam, and the purple color is related to clay loam. The most important part of saffron is the flower, and the best part of the flower is the stigma. The highest number of flowers occurs in loamy, sandy, and silty soil textures, while the highest stigma yield occurs in silty soil texture. In this study, the priority of soil suitability for saffron cultivation in this region is loam, silt, sandy loam, and clay loam soils, respectively. Therefore, loamy, silty, and clay soils are unsuitable for saffron cultivation in this area (Figure 2). According to Table 1, the soil texture of the region was classified into four classes. According to Figure 3, 34% of land in the region was in the perfectly suitable class, 13% in the moderately suitable class, 8% in the critical suitability class, and 36% in the non-suitable class. The output map (Figure 2) is the result of a combined linear weight method for evaluating the potential of saffron cultivation in relation to soil texture, which has a raster format and whose values include values between zero and 255. Higher values (towards 255) in this map indicate greater potential for saffron cultivation, and lower values (towards zero) indicate lands with less potential.

3.1.2. Soil Slop

To prepare the slope map, the digital elevation model map was used by applying networking functions. Due to the irregular dimensions (TIN) of triangulation 3, the D-analyzed pixels were extracted and the slope value was passed through. To calculate the area according to the dimensions of the cells, the area of each cell is multiplied and the desired area is obtained per hectare. Therefore, a slope map was prepared for surface irrigation in four types. Based on the importance of the priority slope, with the southern, southeastern, and southwestern slopes, respectively, because areas close to flat areas are more suitable for saffron cultivation. These areas are often visible along rivers and catchments. According to Figure 4, 43% of the area is in the suitable class, 8% in the relatively moderately suitable class, 8% in the critical suitability class, and the remaining area, which represents about 41% of the total, is in the non-suitable class. The output map (Figure 3) is the result of a combined linear weight method for evaluating the potential of saffron cultivation in relation to slope, which has a raster format and whose values are between zero and 255. Higher values (towards 255) in this map indicate more potential for saffron cultivation, and lower values (towards zero) indicate lands with less potential.

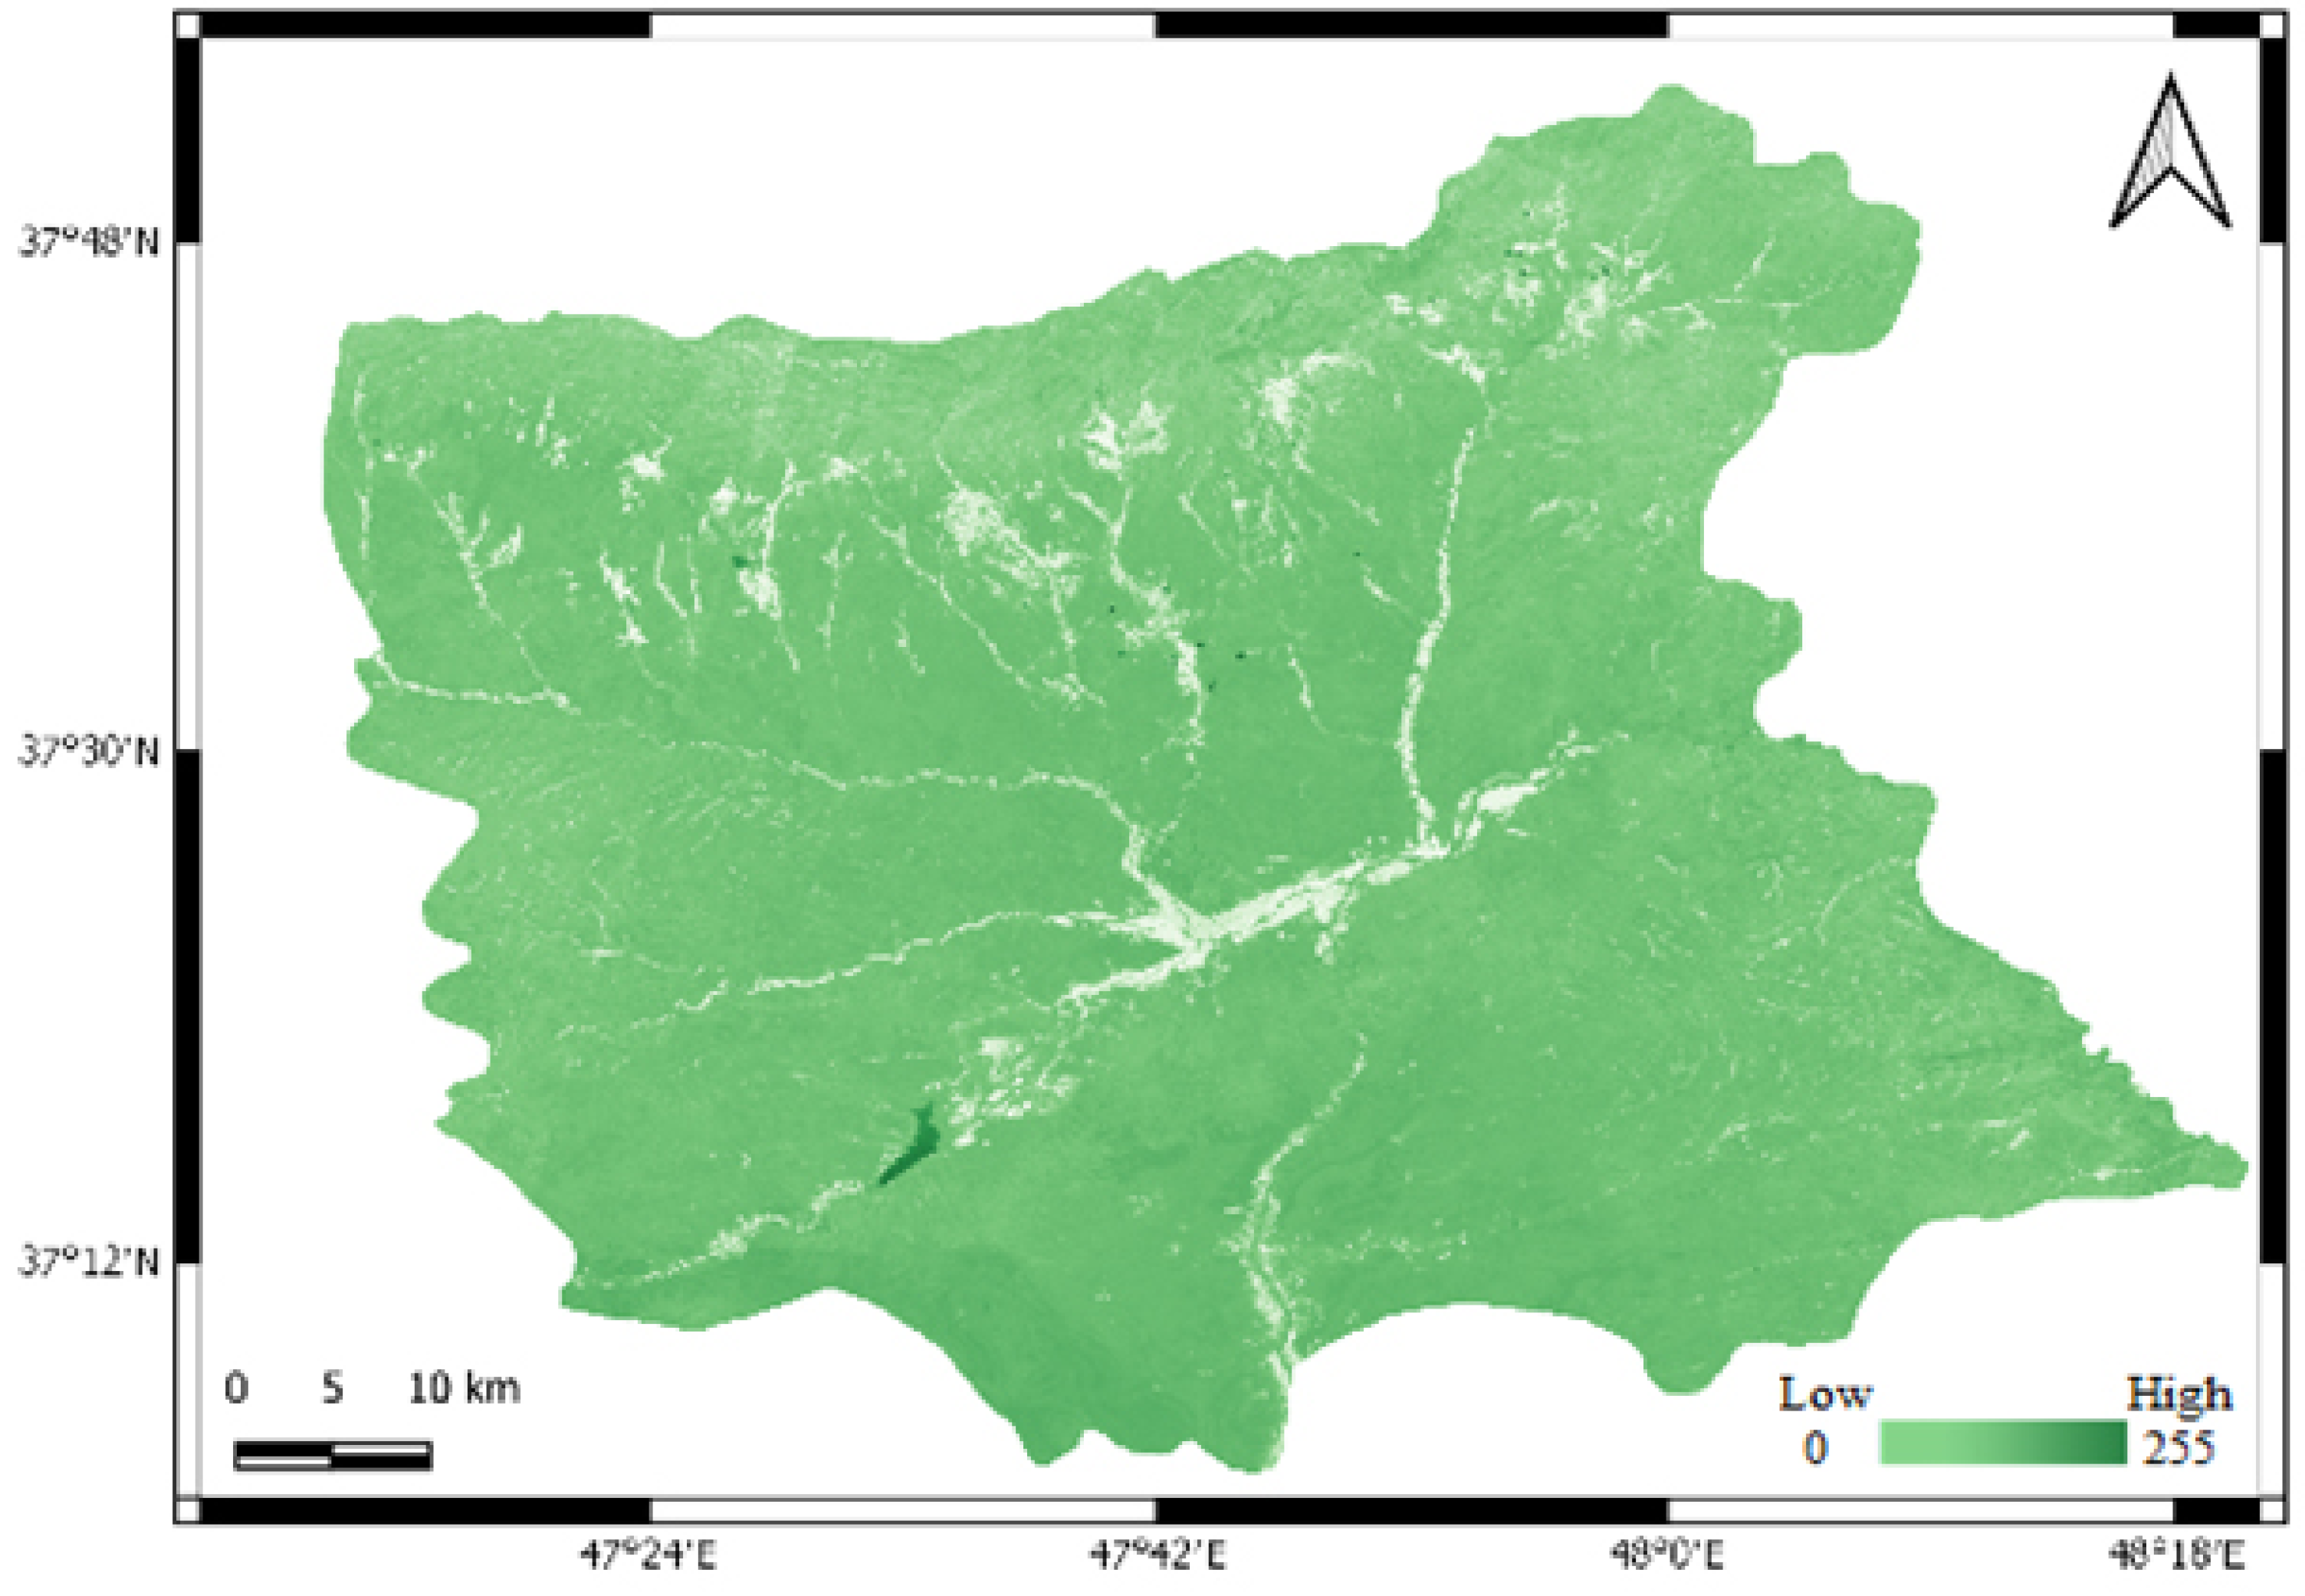
3.1.3. Soil Moisture

Soil moisture is the second parameter in terms of importance in finding the best land for saffron cultivation in this study. A parameter that, if not paid enough attention to, can cause irreversible damage to the saffron field. According to the information obtained from the soil moisture map, the values of this index are higher in rivers and catchments than in other areas. These areas, which are marked in bold blue, are not suitable for growing saffron in terms of moisture index. On the contrary, areas marked with pale blue can be suitable and cultivable areas for saffron (Figure 4). According to Figure 5, 49% of the area is in the suitable class, 30% in the relatively moderately suitable class, 9% in the critical suitability class, and the remaining, which represents about 12% of the total area, is in the non-suitable class (Figure 4). The output map (Figure 4) is the result of a combined linear weight method for evaluating the potential of saffron cultivation in relation to soil moisture, which has a raster format and whose values are between zero and 255. Higher values (towards 255) in this map indicate more potential for saffron cultivation, and lower values (towards zero) indicate lands with less potential.

3.1.4. Soil Salinity
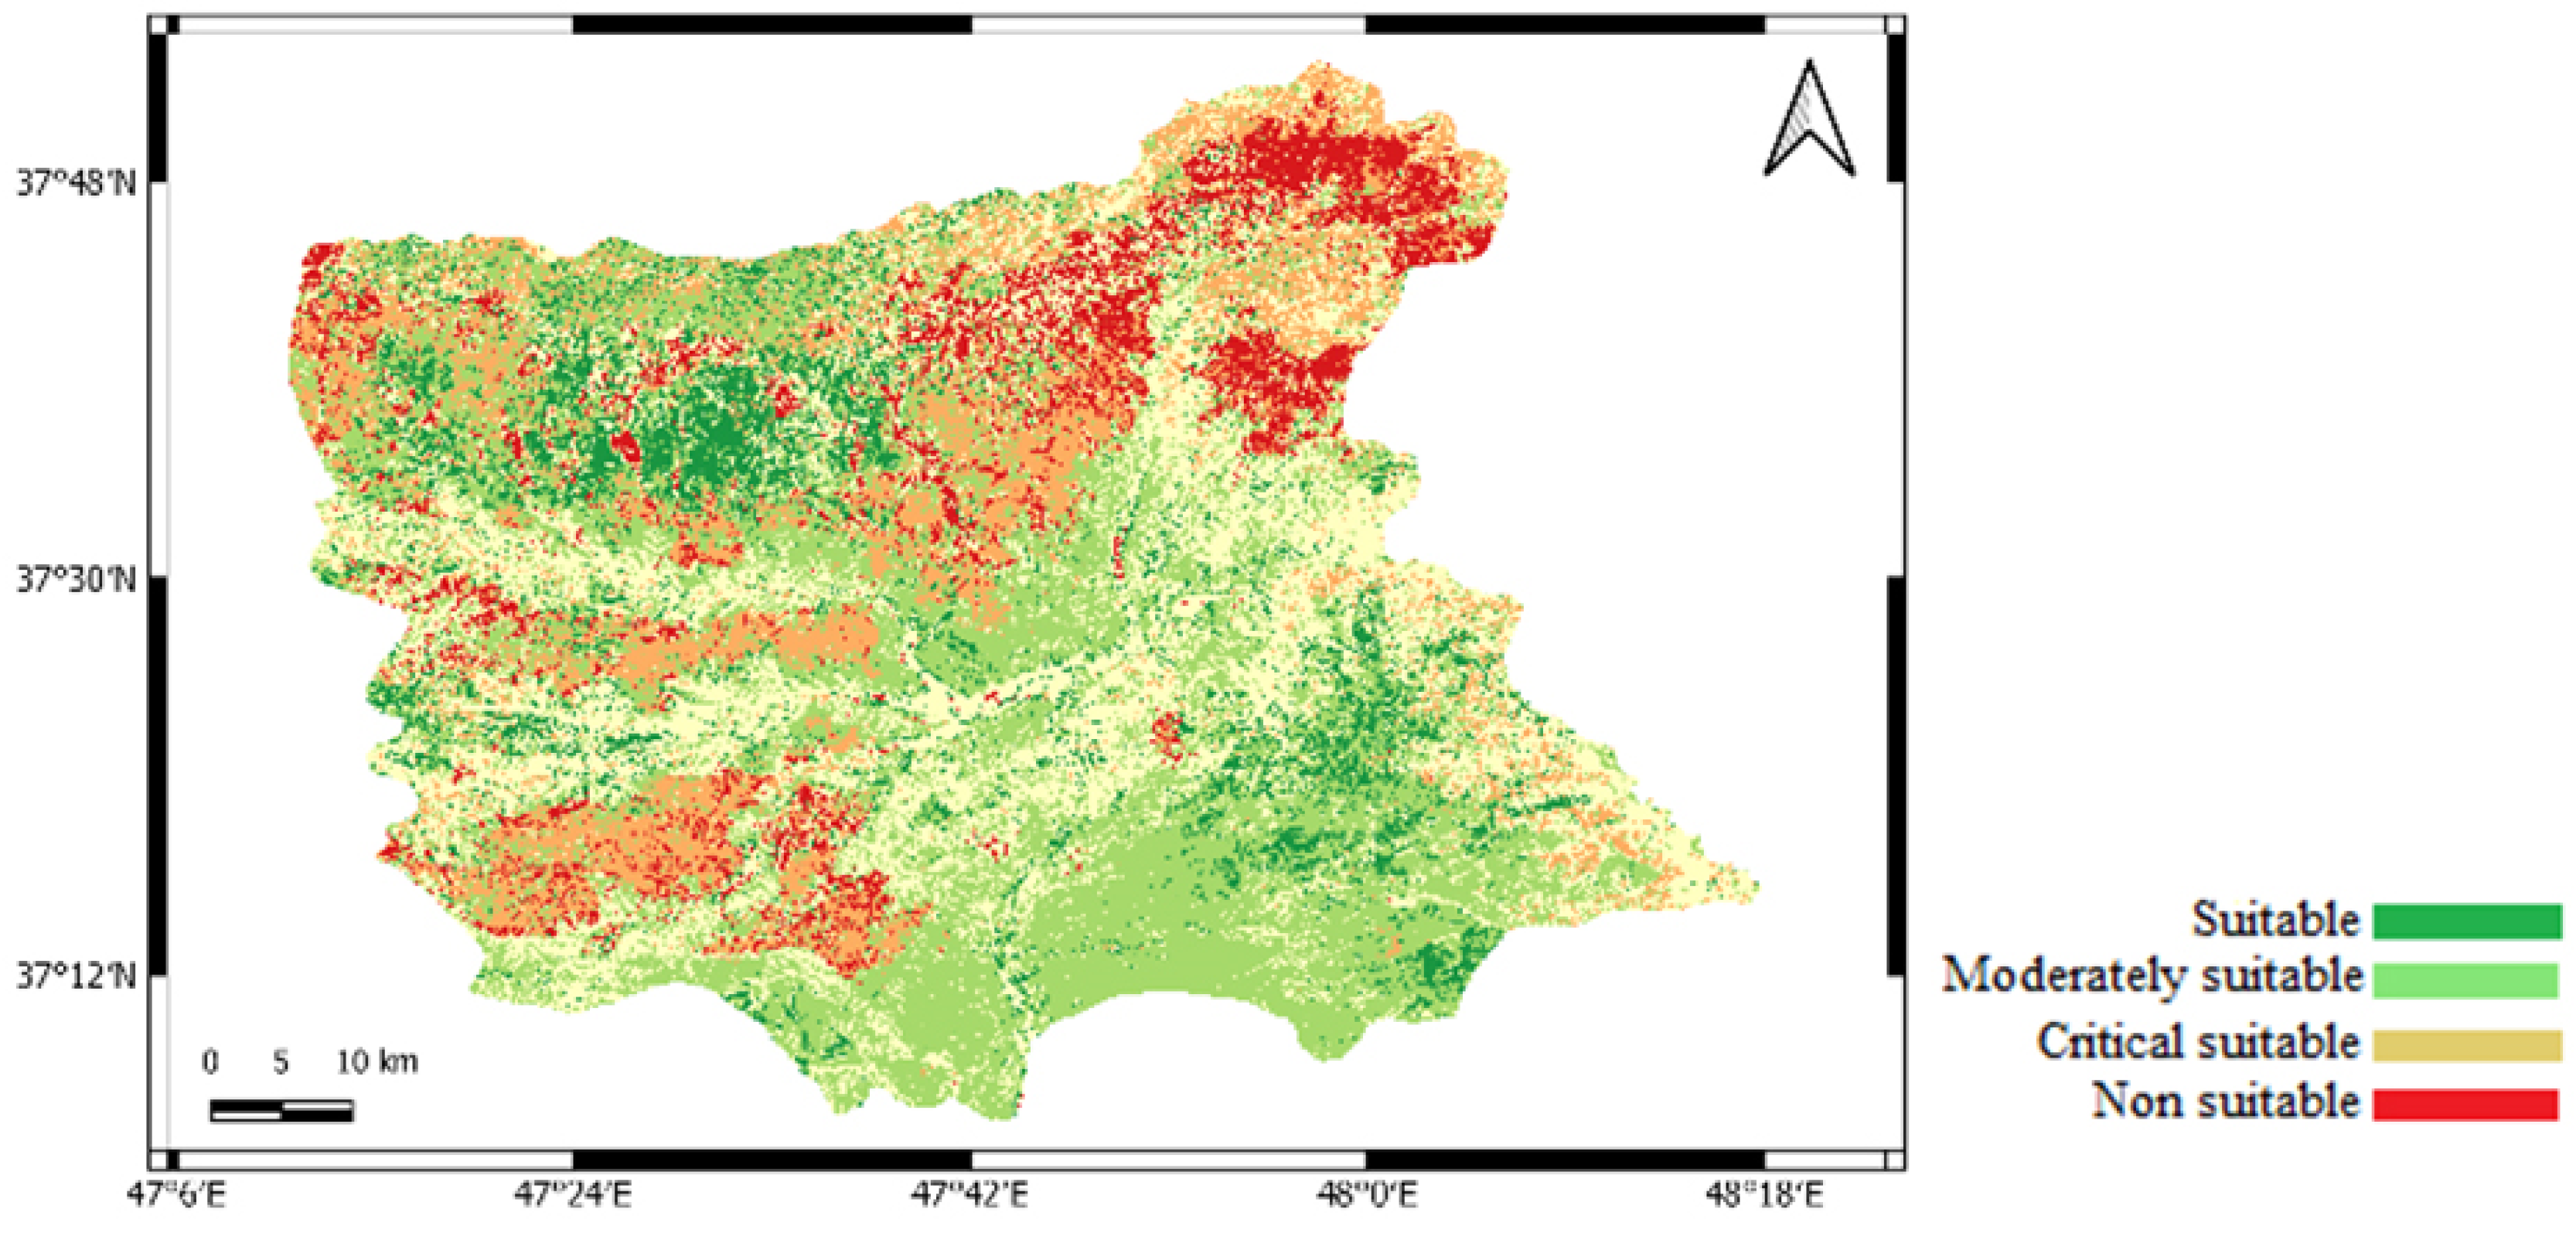
The third factor influencing location is soil salinity. According to the information obtained from the soil salinity map, the values of this index in rivers and catchments are lower than in other areas and are prone to saffron growth. The light green areas indicate suitable regions for saffron cultivation in terms of salinity index (Figure 5). According to Figure 6, 58% of the area is in the suitable class, 29% in the relatively moderately suitable class, 8% in the critical suitability class, and the remaining area, representing about 5% of the total area, is in the non-suitable class (Figure 5). The output map (Figure 5) is the result of a combined linear weight method for evaluating the potential of saffron cultivation in relation to soil salinity, which has a raster format and its values include values between zero and 255. Higher values (towards 255) in this map indicate more potential for saffron cultivation, and lower values (towards zero) indicate lands with less potential.

3.2. Soil Zoning

The layers used for zoning the study area in terms of saffron cultivation ability were combined to determine the suitability of different regions of the province for saffron cultivation. For this purpose, zoning was performed after combining the layers related to the four criteria mentioned, and considering that the terrestrial, soil, and climatic layers are significant factors in the production of agricultural products. As shown in Figure 6, the area is divided into four classes.
The most suitable areas for saffron cultivation in the study area are in a cultivation strip from southwest to southeast of the region and in the north of the region, which is shown in green (Figure 6). These conditions are due to a combination of climatic characteristics and having good soil conditions, slope, fertility, soil texture, as well as suitable conditions for irrigation. The most unsuitable lands are in the northeastern plains, which are marked in red. According to Figure 6, 28% of the area is in the suitable class, 36% in the relatively moderately suitable class, 20% in the critical suitability class, and the remaining area, which represents about 16% of the total area, is in the non-suitable class.

4. Discussion

4.1. The Effect of Soil Texture on the Identification of Suitable Areas to Saffron Cultivation

Since the texture of the soil can change the compaction and physical resistance to the emergence of buds from the soil, it seems that the reduction in soil resistance in the sandy loam texture has facilitated the exit of leaves, which has resulted in an increase in the speed of their emergence. Considering the effect of soil texture on compaction and creating resistance to aerial organ outflow, it seems that in soils with lighter texture there is less energy expenditure for the growth of underground organs than in soils with heavier textures. Compaction and improvement of physical soil properties has resulted in higher energy allocated to vegetation reservoirs, which results in an increased flowering rate [27]. As has been mentioned, the sandy loam texture causes the corm of saffron to grow more, which, in turn, improves the dry weight of the saffron corm by improving the conditions for its growth. This advantage can increase the income of farmers who cultivate saffron by improving the yield of saffron in the coming years. However, in this regard, the allopathic properties of various saffron organs, particularly saffron corm, should be reduced by increasing saffron corm weight in lighter textured soils, thereby shortening the exploitation period of the saffron farm compared to heavier textured soils [28]. Al-Hamed et al. [25] also stated that as the soil texture became heavier, the dry weight of the corm of saffron decreased.
However, these researchers found that the period of exploitation of saffron fields in soils with a rocky texture was relatively longer than in soils with a lighter texture. Ghanbari et al. [29] examined the effect of soil texture on saffron yield and stated that the highest number of flowers were produced with light texture. They found that, although the onset of flowering was the same in all tissues, the end time of this stage was much longer in light tissue soils than in heavy soils, which increased the number of saffron flowers. Chamkhi et al. Reference [2] found that soil texture is one of the most important determinants of growth characteristics and flower yield of plants that propagate through vegetative and reproductive tissues.

4.2. The Effect of Slope on the Identification of Suitable Areas to Saffron Cultivation

Land slope is one of the natural factors that has a great impact on the type of agricultural crops that can be grown. Low slopes cause better penetration of water in them and increase soil moisture storage, and in the critical period of plant growth, this moisture storage solves the problem of water shortage. On the other hand, the range of thermal changes on a low slope is less than on a high slope, and this is also a positive factor for plant growth [30]. Areas with a high slope score have a negative effect on plant growth. Additionally, the variety of energy received on high slopes is dependent on their location in relation to sunlight, and there are many changes in the thermal range. Changes in the slope and angle of the sun’s rays, which depend on the roughness and topography, are decisive for the difference in growth for different landscapes. This means that the amplitude that faces the sun the most receives the most radiation. In the northern hemisphere, the south-facing view and the horizontal surfaces always have a symmetry of solar energy, which is at its maximum at noon. The eastern slopes benefit from earlier morning radiation compared to the southern slopes, but the radiation status of the western slopes is symmetrical with the eastern slopes and receives more radiation in the afternoon than the southern slopes [31]. The northern vertical walls are deprived of direct sunlight at the time of the equinox and are placed in the shade. Due to the fact that saffron cultivation is dependent upon irrigation, and since the suitable slope of the land for irrigated cultivation has a maximum area of 8%, the higher the slope the less potential the lands have for cultivating saffron. In terms of topography, lands with a slope of less than 8% in Iran have an altitude of between 1000 and 1500 m, which is more suitable for cultivating this crop [32]. Maliki et al. [9], in a study to investigate the development of a land use suitability model for saffron cultivation, stated that a slope of more than 12% at a high altitude (more than 2700 m) is one of the main limiting factors for saffron cultivation. Giorgi et al. [33] indicated that the slope of the land is one of the most significant factors in saffron cultivation. Low slopes cause better water penetration and increases soil moisture storage. Lone et al. [34] mentioned the degree of slope as another factor that affects the potential cultivation of agricultural products. In the northern hemisphere, the slope that faces the sun the most, the southern slope, receives the most radiation.

4.3. The Effect of Amount of Water on the Identification of Suitable Areas to Saffron Cultivation

The term “water requirement of the plant” means the amount of water required for the growth and production of the crop, which includes the water used by the plant and special water needs, such as preparing the land and flooding the farm to wash away the soil salt. The amount of water for irrigation from rainfall in one year varies from year to year; therefore, the project to supply moisture to the plant cannot be based on the data from one year. To properly estimate rainfall, long-term records are needed [27]. Saffron cultivation is very desirable in terms of irrigation for arid and semi-arid regions where farmers face water shortages because the corm of saffron has been dormant for five months since mid-May, when the spring rains stop, and does not require irrigation. Reproductive growth of saffron begins with the first irrigation and the emergence of the first flower and ends with the emergence of the last flower, and the duration of this period is 15 to 25 days [35]. Even in the Mediterranean environment, saffron is not watered in many cultivated areas (Sardinia, Abruzzo, Greece, etc.) [36]. Some researchers [7,37] report up to 3000 m3 of flood irrigation per year in Iran and up to 500 m3/ha in Africa [37].

4.4. The Effect of Salinity on the Identification of Suitable Areas to Saffron Cultivation

Salinity stress, with its limitations in water transfer, will reduce the maximum quantum yield and reduce the efficiency of the photosystem. Plants produce reactive oxygen species (hydrogen oxide and hydroxyl) when exposed to stress conditions, including salinity stress, which degrade chlorophyll and membrane lipid peroxide. These compounds can damage plant enzymes and membranes and increase electrolyte leakage, and are therefore considered a biological indicator for estimating plant membrane damage under salinity stress [37]. Dastranj and Sepaskhah [38] reported that salinity reduces growth and increases the amount of sodium ions in all vegetative and reproductive organs of saffron, which leads to reduced growth of saffron. Mzabri et al. [39] reported that increasing the concentration of Nacl and Kcl reduces the length of the roots in the form of saffron. Feizi et al. [37] concluded that with increasing salinity stress, the number of leaves, dry weight of corm from saffron, and shoots are significantly reduced, which confirms the present results.

4.5. Weighted Linear Composition Method (WLC)

The WLC method involves a set of evaluations for a logical method, which, in general, depends on the hierarchical planning of an issue, and, on the other hand, it is related to the logic of understanding and analysis for the final decision and judgment. An important point to note about the use of this algorithm is that the effective indicators for determining the susceptibility of areas for grow a particular crop may be of lesser importance when considering another crop. The purpose of this study was to evaluate the potential of regions for saffron cultivation in northwestern Iran. The WLC method was selected as the working method in this study [40].
In the quantitative method, indicators are involved in the evaluation process based on weight and preference, and all effective criteria and indicators are involved in the process. Involvement of criteria and indicators based on weight and degree of preference is one of the capabilities and positive points of the WLC method. In this study, ecological criteria related to the natural environment weigh more than other criteria, including economic and social, in the evaluation process. The use of fuzzy logic to quantify and normalize qualitative criteria is more useful and is more in line with the natural complexities of the study area. In the WLC method, the linear combination of the importance of different factors and priorities in relation to land suitability is used strategically and cumulatively. The set of factors takes into account the priority of factors and the priority of their internal classes, even if they do not belong to the highest rank. This method is comparable in performance to the execution of a condition in decision-making. Therefore, the more the method evaluates the priority of the upper classes of land suitability, the more conservative the WLC method will be [41,42,43].
After creating the database, based on the relevant criteria and their weight, weight layers were produced, and by combining the layers and determining the value of the regions, the final layer was produced. Using the WLC method is a convenient way to solve complex multi-criteria decision-making problems in economic matters. The WLC method is a flexible and practical tool for determining the potential of different regions to grow crops suitable for their climatic conditions. Kiani et al. [44], by preparing a water and soil quality map for saffron cultivation in the lands of northwestern Iran, using multi-criteria decision-making methods based on hierarchical analysis, reported that 8% of lands had very suitable conditions, 46.5% of lands had suitable conditions, 16% of land had relatively positive conditions for saffron cultivation, 18% had unsuitable conditions, and 11.5% were completely unsuitable. Maleki et al. [9] compared the similarity of the northeastern climate (as the main center of saffron cultivation in Iran) with the northwest to study the feasibility of saffron cultivation by the WLC method. Temperature is a more significant condition for saffron cultivation in northeastern Iran than rainfall. Finally, they came to the conclusion that saffron cultivation in the plains of western Iran is possible from a climatic point of view, such as in northeastern Iran, which is the source of saffron cultivation.

5. Conclusions

The results of a land use assessment for saffron cultivation showed that about 36% of the area is not suitable for saffron cultivation. The most suitable places for saffron cultivation in the study area are in a cultivation strip from southwest to southeast, and in parts of the north of the region. From the results, we found that the changes in the indicators in each year vary significantly between years. Therefore, we selected data that have very high stability in the indicators in different years. Finally, the final map obtained from the index map is the zoning map of the region. On this map, the places that are visible in bold green are the best, and the places that are visible in red are the worst areas for saffron cultivation in Miyaneh city. Thus, from green to red areas, the probability of saffron cultivation in these areas in Miyaneh city decreases. In general, according to the final zoning map of Miyaneh city, the southeastern and northwestern regions of this city, especially the banks of rivers and catchments, were identified as suitable places for saffron cultivation. In the present study, with the help of WLC, the weight of priorities was determined and the results obtained from the weight line composition chain analysis model in locating saffron cultivation led to the selection of the best spatial option for saffron cultivation. Therefore, if it is possible to identify favorable areas for saffron cultivation according to the climatic requirements of this product and identify the limitations or capabilities that these indicators have created in the environment, it is practically possible to achieve higher performance per unit area, which, in itself, will improve the economic conditions and the level of income of the farmer. Due to the special characteristics of the saffron product, replacing its cultivation with products with high water requirements, such as onions, potatoes, tomatoes, etc., will save water consumption.

Author Contributions

Conceptualization, A.Sh.; methodology, A.Sh.; validation, Sh.F., A.T. and N.Z.; formal analysis, A.Z.; writing—original draft preparation, A.Z. and N.Z.; writing—review and editing, A.Sh., Sh.F. and N.Z.; visualization, A.Sh. and N.Z.; supervision, A.Sh.; funding acquisition, N.Z. All authors have read and agreed to the published version of the manuscript.

Funding

This research was funded by the National Natural Science Foundation of China, grant number 42071374.

Institutional Review Board Statement

Not applicable.

Informed Consent Statement

Not applicable.

Data Availability Statement

The data that support the findings of this study are available from the first author, upon reasonable request.

Conflicts of Interest

The authors declare no conflict of interest.

References

  1. Cao, Z.; Ma, R.; Duan, H.; Xue, K.; Shen, M. Effect of Satellite Temporal Resolution on Long-Term Suspended Particulate Matter in Inland Lakes. Remote Sens. 2019, 11, 2785. [Google Scholar] [CrossRef] [Green Version]
  2. Chamkhi, I.; Abbas, Y.; Tarmoun, K.; Aurag, J.; Sbabou, L. Morphological and Molecular Characterization of Arbuscular Mycorrhizal Fungal Communities Inhabiting the Roots and the Soil of Saffron (Crocus sativus L.) under Different Agricultural Management Practices. Arch. Agron. Soil Sci. 2019, 65, 1035–1048. [Google Scholar] [CrossRef]
  3. Hong, S.Y.; Park, J.H.; Cho, S.H.; Yang, M.S.; Park, C.M. Phenological Growth Stages of Brachypodium Distachyon: Codification and Description. Weed Res. 2011, 57, 612–620. [Google Scholar] [CrossRef]
  4. Kosari, A.; Sharifi, A.; Ahmadi, A.; Khoshsima, M. Remote Sensing Satellite’s Attitude Control System: Rapid Performance Sizing for Passive Scan Imaging Mode. Aircr. Eng. Aerosp. Technol. 2020, 92, 1073–1083. [Google Scholar] [CrossRef]
  5. Felegari, S.; Sharifi, A.; Moravej, K.; Amin, M.; Golchin, A.; Muzirafuti, A.; Tariq, A.; Zhao, N. Integration of Sentinel 1 and Sentinel 2 Satellite Images for Crop Mapping. Appl. Sci. 2021, 11, 10104. [Google Scholar] [CrossRef]
  6. Cardone, L.; Castronuovo, D.; Perniola, M.; Scrano, L.; Cicco, N.; Candido, V. The influence of soil physical and chemical properties on saffron (Crocus sativus L.) growth, yield and quality. Agronomy 2020, 10, 1154. [Google Scholar] [CrossRef]
  7. Koocheki, A.A. Indigenous knowledge in agriculture with particular reference to saffron production in Iran. Acta Hortic. 2004, 650, 175–182. [Google Scholar] [CrossRef]
  8. Garcia-Rodriguez, M.V.; Lopez-Corcoles, H.; Alonso, G.L.; Pappas, C.S.; Polissiou, M.G.; Tarantilis, P.A. Comparative evaluation of an ISO 3632 method and an HPLC-DAD method for safranal quantity determination in saffron. Food Chem. 2017, 221, 838–843. [Google Scholar] [CrossRef]
  9. Maleki, F.; Kazemi, H.; Siahmarguee, A.; Kamkar, B. Development of a Land Use Suitability Model for Saffron (Crocus sativus L.) Cultivation by Multi-Criteria Evaluation and Spatial Analysis. Ecol. Eng. 2017, 106, 140–153. [Google Scholar] [CrossRef]
  10. Mehrara, M.; Baghbanpour, J. The Contribution of Industry and Agriculture Exports to Economic Growth: The Case of Developing Countries. World Sci. News 2016, 46, 100–111. [Google Scholar]
  11. Melnyk, J.; Wang, S.; Massimo, M. Chemical and Biological Properties of the World’s Most Expensive Spice: Saffron. Food Res. Int. 2010, 43, 1981–1989. [Google Scholar] [CrossRef]
  12. Mirjavadi, A.; Abdollah Karimi, L.; Azimi, R.; Ghanaiee, M.; Shamshiri, A.; Tariverdi, M. Livestock Brucellosis: Frequency of Mutations Causing Resistance to Fluoroquinolone, Streptomycin and Rifampin. Arch. Pediatric Infect. Dis. 2020, 8, 213–242. [Google Scholar] [CrossRef]
  13. Moghaddasi, M. Saffron Chemicals and Medicine Usage. J. Med. Plants Res. 2011, 8, 84–97. [Google Scholar]
  14. Sharifi, A. Using Sentinel-2 Data to Predict Nitrogen Uptake in Maize Crop. IEEE J. Sel. Top. Appl. Earth Obs. Remote Sens. 2020, 13, 2656–2662. [Google Scholar] [CrossRef]
  15. Sharifi, A.; Amini, J.; Sri Sumantyo, J.T.; Tateishi, R. Speckle Reduction of PolSAR Images in Forest Regions Using Fast ICA Algorithm. J. Indian Soc. Remote Sens. 2015, 43, 339–346. [Google Scholar] [CrossRef]
  16. Yusoff, N.M.; Muharam, F.M.; Khairunniza-Bejo, S. Towards the use of remote-sensing data formonitoring of abandoned oil palm lands in Malaysia: A semi-automatic approach. Int. J. Remote Sens. 2017, 38, 432–449. [Google Scholar] [CrossRef]
  17. Sharifi, A. Remotely sensed vegetation indices for crop nutrition mapping. J. Sci. Food Agric. 2020, 100, 5191–5196. [Google Scholar] [CrossRef] [PubMed]
  18. Hopkins, L. Methods for generating land suitability maps: A comparative evaluation. J. Am. Inst. Plan. 1977, 34, 19–29. [Google Scholar] [CrossRef]
  19. Badihi, L.; Gerami, M.; Akbarinodeh, D.; Shokrzadeh, M.; Ramezani, M. Physio-chemical responses of exogenous calcium nanoparticle and putrescine polyamine in Saffron (Crocus sativus L.). Physiol. Mol. Biol. Plants 2021. [Google Scholar] [CrossRef]
  20. Massam, B.H. Multi-criteria decision making (MCDM) techniques in planning. Prog. Plan. 1988, 30, 1–84. [Google Scholar] [CrossRef]
  21. Sharifi, A.; Moradi, E. A Methodology for Radiometric Calibration of Remote Sensing Images. In Proceedings of the 38th Asian Conference on Remote Sensing—Space Applications: Touching Human Lives (ACRS), New Delhi, India, 23–27 October 2017. [Google Scholar]
  22. Can, M. Fuzzy Multiple Objective Models for Facility Location Problems Fuzzy Multiple Objective Models for Facility Location Problems. Southeast Eur. J. Soft Comput. 2012. [Google Scholar] [CrossRef]
  23. Moradi, E.; Sharifi, A. Assessment of forest cover changes using multi-temporal Landsat observation. Environ. Dev. Sustain. 2022. [Google Scholar] [CrossRef]
  24. Yin, S.; Li, J.; Liang, J.; Jia, K.; Yang, Z.; Wang, Y. Optimization of the Weighted Linear Combination Method for Agricultural Land Suitability Evaluation Considering Current Land Use and Regional Differences. Sustainability 2020, 12, 10134. [Google Scholar] [CrossRef]
  25. Al-Hamed, S.A.; Wahby, M.F.; Aboukarima, A.M.; El Marazky, M.S. Effect of soil and water characteristics on yield and properties of ‘Spunta’ potatoes. Chil. J. Agric. Res. 2017, 77, 250–256. [Google Scholar] [CrossRef] [Green Version]
  26. Fu, X.; Wang, X.; Yang, Y.J. Deriving suitability factors for CA-Markov land use simulation model based on local historical data. J. Environ. Manag. 2018, 206, 10–19. [Google Scholar] [CrossRef] [PubMed]
  27. Sereshti, H.; Ataolahi, S.; Aliakbarzadeh, G.; Zarre, S.; Poursorkh, Z. Evaluation of storage time effect on saffron chemical profile using gas chromatography and spectrophotometry techniques coupled with chemometrics. J. Food Sci. Technol. 2018, 55, 1350–1359. [Google Scholar] [CrossRef] [PubMed]
  28. Fallahi, H.R.; Aghhavani-Shajari, M.; Sahabi, H.; Behdani, M.A.; Sayyari-Zohan, M.H.; Vatandoost, S. Influence of some pre and post-harvest practices on quality of saffron stigmata. Sci. Hortic. 2021. [Google Scholar] [CrossRef]
  29. Ghanbari, J.; Khajoei-Nejad, G.; van Ruth, S.M.; Aghighi, S. The possibility for improvement of flowering, corm properties, bioactive compounds, and antioxidant activity in saffron (Crocus sativus L.) by different nutritional regimes. Ind. Crops Prod. 2019, 135, 301–310. [Google Scholar] [CrossRef]
  30. Rhebergena, T.; Fairhurstc, T.; Zingorea, S.; Fisherd, M.; Oberthüre, T.; Whitbread, A. Climate, soil and land-use based land suitability evaluation for oil palm production in Ghana. Eur. J. Agron. 2016, 81, 1–14. [Google Scholar] [CrossRef] [Green Version]
  31. Yalew, S.G.; van Griensven, A.; van der Zaag, P. AgriSuit: A web-based GIS-MCDA framework for agricultural land suitability assessment. Comput. Electron. Agric. 2016, 128, 1–8. [Google Scholar] [CrossRef]
  32. Behzad, S.; Razavi, M.; Mahajeri, M. The effect of various amounts of ammonium phosphate and urea on saffron production. Acta Hortic. 1992, 306, 337–339. [Google Scholar] [CrossRef]
  33. Giorgi, A.; Pentimalli, D.; Giupponi, L.; Panseri, S. Quality traits of saffron (Crocus sativus L.) produced in the Italian Alps. Open Agric. 2017, 2, 52–57. [Google Scholar] [CrossRef] [Green Version]
  34. Lone, R.; Shuab, R.; Koul, K. AMF association and their effect on metabolite mobilization, mineral nutrition and nitrogen assimilating enzymes in saffron (Crocus sativus) plant. J. Plant Nutr. 2016, 39, 1852–1862. [Google Scholar] [CrossRef]
  35. Kabiri, M.; Rezadoost, H.; Ghassempour, A. A comparative quality study of saffron constituents through HPLC and HPTLC methods followed by isolation of crocins and picrocrocin. LWT 2017, 84, 1–9. [Google Scholar] [CrossRef]
  36. Azami, S.; Shahriari, Z.; Asgharzade, S.; Farkhondeh, T.; Sadeghi, M.; Ahmadi, F.; Vahedi, M.M.; Forouzanfar, F. Therapeutic Potential of Saffron (Crocus sativus L.) in Ischemia Stroke. Evidence-based Complement. Altern. Med. 2021. [Google Scholar] [CrossRef] [PubMed]
  37. Feizi, H.; Moradi, R.; Pourghasemian, N.; Sahabi, H. Assessing saffron response to salinity stress and alleviating potential of gamma amino butyric acid, salicylic acid and vermicompost extract on salt damage, South African. J. Bot. 2021, 141, 330–343. [Google Scholar] [CrossRef]
  38. Dastranj, M.; Sepaskhah, A. Response of saffron (Crocus sativus L.) to irrigation water salinity, irrigation regime and planting method: Physiological growth and gas exchange. Sci. Hortic. 2019, 257, 354–367. [Google Scholar] [CrossRef]
  39. Mzabri, I.; Legsayer, M.; Kouddane, N.; Boukroute, A.; Berrichi, A. Salt stress effects on some morphological, physiological and biochemical parameters of saf-fron plant (Crocus sativus L.) in Eastern Morocco. J. Mater. Environ. Sci. 2017, 8, 4894–4901. [Google Scholar]
  40. Pilevar, A.R.; Matinfar, H.R.; Sohrabi, A.; Sarmadian, F. Integrated fuzzy, AHP and GIS techniques for land suitability assessment in semi-arid regions for wheat and maize farming. Ecol. Indic. 2020, 110, 105–127. [Google Scholar] [CrossRef]
  41. Siddiqui, M.Z.; Everett, J.W.; Vieux, B.E. Landfill siting using geographic information systems: A demonstration. J. Environ. Eng. 1996, 122, 515–523. [Google Scholar] [CrossRef]
  42. Hu, P.; Sharifi, A.; Tahir, M.N.; Tariq, A.; Zhang, L.; Mumtaz, F.; Shah, S.H.I.A. Evaluation of Vegetation Indices and Phenological Metrics Using Time-Series MODIS Data for Monitoring Vegetation Change in Punjab, Pakistan. Water 2021, 13, 2550. [Google Scholar] [CrossRef]
  43. Shah, S.H.I.A.; Yan, J.; Ullah, I.; Aslam, B.; Tariq, A.; Zhang, L.; Mumtaz, F. Classification of Aquifer Vulnerability by Using the DRASTIC Index and Geo-Electrical Techniques. Water 2021, 13, 2144. [Google Scholar] [CrossRef]
  44. Kiani, S.; Minaei, S.; Ghasemi-Varnamkhasti, M. Instrumental approaches and innovative systems for saffron quality assessment. J. Food Eng. 2018, 216, 1–10. [Google Scholar] [CrossRef]
Figure 1. Location of study area in the West North of Iran.
Agriculture 12 00118 g001
Figure 2. Soil type map.
Agriculture 12 00118 g002
Figure 3. Soil slop map.
Agriculture 12 00118 g003
Figure 4. Soil moisture map.
Agriculture 12 00118 g004
Figure 5. Soil salinity map.
Agriculture 12 00118 g005
Figure 6. Final zoning map of the study area.
Agriculture 12 00118 g006
Table 1. Saffron crop requirements (Institute Research Water and Soil of Iran (http://www.swri.ir/en-US/DouranPortal/1/page/Home on 20 January 2021)).
ClassSuitableModerately SuitableCritical SuitableNon Suitable
Slope for surface0–22–55–8>8
Soil textureHeavyMediumLightVery heavy
EC (ds/m)4 < EC < 88 < EC < 1616 < EC < 32EC > 32
Irrigation
capability
III–IIIIVV–VI
Lands that are suitable for surface irrigation by performing construction and corrective operations.Lands that are expected to be moderately suitable for irrigated agriculture through construction and remediation operations.Lands that are expected to be relatively unsuitable for irrigated agriculture through construction and remediation operations.The irrigation capability of these lands is not clear in the current situation.
Table 2. Values OIF index to determine the best False Color Composite.
BandsOIF Index Highest Ranking
Band 7, Band5, Band65326.46
Band4, Band5, Band65197.78
Band1, Band5, Band65134.22
Band4, Band6, Band75121.60
Band2, Band5, Band65086.73
Band3, Band5, Band65073.36
Publisher’s Note: MDPI stays neutral with regard to jurisdictional claims in published maps and institutional affiliations.

