1. Introduction
There is a growing body of studies and analyses aimed at developing new products with predefined sensory and health benefits [
1]. One of the employed strategies entails the provision of adequate protection during the growth of original plants, and the use of modern plant protection agents or fertilizers containing silver and copper nanoparticles. The latter can be applied in a variety of ways—directly into the soil or onto plant leaves. Nano-fertilizers can increase the effectiveness of nutrient use three-fold, as well as provide improved stress resistance [
2]. The rate of germination is affected by environmental factors such as abiotic stress, including draught, low temperatures [
3], salination [
4], and heavy metal toxicity [
5]. Many researchers have also studied the impact of nanoparticles on the germination and growth of plants with a view to promoting the use of such compounds in agriculture [
6]. In recent years, there have been numerous publications pertaining to the interactions between nanoparticles and plants [
7,
8,
9,
10]. Most of the studies focused on the potential toxicity of metallic nanoparticles (MNPs), as well as the positive and negative effects of their use. There are results to indicate that the toxicity of silver (AgNP) nanoparticles is negligible with low levels of exposure to, approx. 5 mg·dm
−3, while higher concentrations are reported to inhibit plant growth [
11,
12]. Experiments conducted by Parveen and Rao [
13] with the use of AgNP demonstrated increased germination capacity of pearl millet (
Pennisetum glaucum). Meanwhile, other studies have suggested that nanoparticles showed no impact on the germination process, but did affect plant growth [
14,
15]. Rape sprouts constitute a valuable source of nutrients, such as vitamins, and phenolic compounds acting as antioxidants. The choice of the correct strategy, in terms of seed dressing and plant spraying, requires a better understanding of the biochemical processes facilitating rapeseed germination. In particular, the drying pretreatment ought to ensure the maximum preservation of their nutritional value [
16]. During drying, the quality of the product can be significantly altered due to changes to its chemical composition, content of active ingredients, and bioactivity [
17,
18]. Excessive temperature can lead to undesirable discoloration of the dried material, due to the reactions of enzymatic and non-enzymatic browning [
19,
20]. It also exacerbates the decomposition of various pigments, including carotenoids, chlorophylls, and anthocyanins [
21]. Moreover, the final composition of the dry material is affected by ions of certain metals and its own pH [
22].
The analysis of rapeseed sprouts, so far not widely considered as a viable food supplement, is motivated by the shortage of information regarding the content of bioactive compounds in this product. Substances that may significantly impact both the sensory quality and health benefits of sprouts (fats, proteins, vitamins) from cruciferous vegetable seeds include glucosinolates and polyphenols. The compounds’ inclusion in the human diet is desirable, as the available epidemiological studies indicate a reverse dependence between their consumption and the incidence of tumors and heart diseases [
23].
The aim of the present study was to analyze the chemical and physical parameters of rapeseeds and rape sprouts grown from seeds obtained from a three-year cultivation (2018–2020) and treated with silver and copper nanoparticle sprays, and to evaluate the impact of the drying process on the quality of the obtained product (rapeseed sprouts). Seeds obtained from plants sprayed with the analyzed mixture were analyzed in terms of the mass of the seeds, content of protein, fat, flavonoids, and glucosinolates, and subsequently allowed to germinate. The obtained sprouts were freeze-dried at different temperatures and analyzed in terms of protein and fat content, color, polyphenols and flavonoids present in the dry material.
2. Materials and Methods
2.1. Material Origin
Unenclosed winter rapeseed (Brassica napus L.) of the ‘Ricky’ cultivar, obtained from the Strzelce Sp. z o.o. Grupa IHAR Seed Plant, were used in the experiments.
Nanomaterials for the laboratory and field experiments were obtained in the form of two commercially available compounds, sold in 1 dm3 bottles containing nanosilver and nanocopper colloids concentrated at ≥0.1% silver (ITP-1KAg PO) and ≥0.1% copper (ITP-1KCu PO), respectively, marketed by ITP-SYSTEM Sp. z o.o. from Dąbrowa Górnicza. For the purposes of the present experiment, a colloid is understood as a colloidal suspension defined as a non-homogenous mixture, usually biphasic, forming a system of two substances, one dispersed in the other. The purchased nanoparticle colloids were unenveloped and stabilized, among other factors, with organic acid salts. The colloid concentrations were adjusted to ensure unproblematic application by end users for agricultural purposes. As the authors were unable to identify any scientific publications pertaining to studies conducted specifically with the use of nanocolloids, the obtained results are referenced below to studies employing nanoparticles.
2.2. Cultivation of Rapeseeds
The field experiment was conducted in a biannual cycle between 2018 and 2020, in medium, fine sand soil. The field experiment entailed the use of the lowest nanoparticle concentrations (50 mL·L−1). The concentration was chosen with a view to minimizing the potentially harmful environmental impact. The prepared unenclosed seeds were sown in 30 m2 experimental fields, in triplicate. The seeds were sown using a KUHN KN253APL E drill seeder with narrow, 12 cm spacing. The experiment was done in 2 variants. In the first, the plants were sprayed with the prepared nanoparticle solutions (silver and copper) only once at 12–16 BBCH. In the second variant, the plants were sprayed twice, at 12–16 BBCH and during florescence (61–66 BBCH). The control sample was provided by seeds not sprayed with the analyzed substance.
After emergence, the density of 60 plants per m2 was obtained for each of the experimental variants. The remaining agrotechnical procedures were conducted as recommended for winter rape. Pre-sowing mineral fertilization was provided in the form of a multi-component NPK fertilizer dosed at 18 kg·ha−1 N, 60 kg P2O5, 90 kg·ha−1 K2O, as well as nitrogen fertilization at 92 kg·ha−1. Herbicidal protection was provided with the use of the Command 480EC compound dosed at 0.2 L·ha−1. During vegetation in the 3 L stage, a foliar spray BORMAX fertilizer was used at the dose of 1 L·ha−1.
In the last week of July, the rape was harvested in a single-stage system using a KM-ELITE Wintersteiger field harvester. The harvested seeds were winnowed using a laboratory SNL winnower. After winnowing, the seeds were stored in jute sacks for two weeks, in laboratory conditions, at the temperature of 20 °C, with daily stirring to equalize the moisture levels in the entire bulk of the material. The seeds were divided into two batches, the first batch intended for analysis, the second for germination. Over the three-year period, the average yield from the control field was 1.5 t·ha−1.
2.3. Preparation of Nanocolloid Solutions
The nano-solutions (silver nanocolloid AgNP and copper nanocolloid CuNP) for the purposes of spraying were prepared at the concentration of 50 mL·L−1 (0.005%) by diluting a suitable amount of the preparation volumetrically in 1 L of distilled water.
2.4. Transmission Electron Microscopy Analysis (TEM)
The primary analysis conducted to confirm the content of nanoparticles in the preparations was performed at the Central Electron Microscopy Laboratory of Maria Curie Skłodowska University in Lublin. The silver and copper nanoparticles were analyzed using a high-resolution transmission electron microscope-Titan G2 60–300 from FEI. TEM preparations were obtained by applying a drop of the analyzed solution onto a copper mesh-reinforced carbon film. Micrographs were taken in the dark field mode of the TEM microscope.
The qualitative identification of AgNP was done with the method of energy-dispersive X-ray spectroscopy (EDX). In the STEM-HAADF scanning mode, the linear profile of AgL was performed to confirm the content of silver in the nanoparticles.
2.5. Seed Preparation and Germination Conditions
The seed germination was conducted in two independent variants. In the experiment aimed at analyzing the germination energy and capacity, rapeseeds were placed in a 70% ethanol solution for 15 s to ensure surface sterility; next, they were placed in a 1.5% solution of sodium chloride(I) (NaClO) for 15 min, after which the seeds were rinsed five times in distilled water. The seeds germinated on Petri dishes laid with three layers of filter paper moistened with distilled water—1.5 cm3 per dish.
2.6. Drying Method
Sprouts have a short shelf life as a result of increased water content. The purpose of the sprouts drying was to decrease the moisture content, stop the germination process and extend the shelf life of the shoots. Decreasing the moisture content of the sprouts enables their fine grinding and further use as a powdered additive to many foods products.
Germination was induced in 100 g of rapeseeds harvested from the field cultivation by pre-moistening them with distilled water for 3 h. Next, the seeds were put in a germination apparatus and placed in a climatic chamber (ICH 256, Memmert, Düsseldorf, Germany). The programmed germination temperature was 20 °C, at a relative air humidity of 90%. The sprouts were kept in the chamber for 5 days to control the growth conditions. During germination, the sprouts were rinsed and the water supply was replenished each day.
Samples of raw material were frozen at −30 °C for 48 h and freeze-dried using an ALPHA 1–4 laboratory freeze dryer comprising a drying chamber, a cold trap, a vacuum pump, and a measurement and control system. The freeze dryer was also equipped with a heating system coupled with an LDC-1M driver (Martin Christ Company, Osterode am Harz, Germany) and integrated with a weighing system for measuring changes in the weight of the samples during the drying process. The heating system consisted of five hot plates placed on a support stand. The heat required for the phase transition was supplied to the material through direct contact. Both the measurement and the regulation of the hot plate temperature relied on a temperature sensor placed inside one of the freeze-dried plates. The mass of the material was recorded continuously during drying with the accuracy of ±0.1 g [
24]. The process of drying was continued at 20, 40 and 60 °C, and with a constant pressure of 52 Pa inside the drying chamber until the sample reached the moisture of about 5% (wb).
2.7. Modeling of Drying Curves
Relying on the measurements of mass loss recorded in the course of the experiment, drying curves were charted as functions of water ratio (
MR) to time, using the following equation:
where
u is the water content while drying [kg H
2O/kg DM],
u0 is the initial water content [kg H
2O/kg DM], and
ur is the equilibrium water content [kg H
2O/kg DM]. With a view to selecting the most appropriate mathematical equation for the description of the freeze-drying of rape sprouts, seven candidate equations commonly mentioned in the literature were examined (
Table S1, go to the
Supplementary Material).
2.8. Total Phenolic Content, Antiradical Activity (ABTS, DPPH)
The ground rape sprouts (0.5 g, granulation below 300 µm) were extracted separately with 5 mL of 50% methanol (ME). The obtained extracts were shaken for 30 min using a rotator Multi RS-60 operating at 5000 rpm (Biosan, Riga, Latvia). The homogenate was centrifuged at the same velocity for 10 min at 4 °C using an MPW-352R centrifuge (MPW, Warsaw, Poland). The extraction was carried out in duplicate. The supernatants of ME were used for further analyses.
Total phenols were estimated in accordance with the Folin–Ciocalteau method [
25]. A 0.5 mL sample of the extract was mixed with 0.5 mL of H
2O and 2 mL of Folin reagent (1:5 H
2O), and after 3 min, with 10 mL of 10% Na
2CO
3. After 30 min, the absorbance of the mixed samples was measured at the wavelength of 720 nm. The amount of total phenolics was expressed as a gallic acid equivalent (GAE) per g of dry weight (DW).
The ability to scavenge ABTS free radicals was determined using the method developed by Re et al. [
26], and the capacity to scavenge DPPH free radicals was determined using the method by Brand-Williams et al. [
27]. The absorbance decrease was measured quantitatively using a spectrometer, at the wavelength of 734 nm. The ability to neutralize ABTS and DPPH free radicals was expressed as EC
50—concentration of the extract (mg
s.m.·mL
−1) causing a 50% reduction of the initial concentration of ABTS or DPPH free radicals.
2.9. Color Measurement
The color of dried rape sprout samples was measured using a CR-400 Chromameter (Minolta). The analyses of the color values were performed ten times for each sample of dried rape sprouts. Three parameters
L* (lightness),
a* (redness), and
b* (yellowness) were used to study the color changes. Multiple measurements (10 points) of
L*,
a* and
b* parameters were obtained by placing the sensor of the colorimeter on the dried and ground sample. From the data obtained, delta Chroma (Δ
C) and hue angle (
HU) values were calculated according to following equations [
28]:
2.10. Analysis of the Glucosinolates and Flavonoid Content
Glucosinolates from rapeseeds and rape sprouts (dried) were extracted with methanol, purified and subjected to enzymatic desulfation on ion-exchange resin. The content of glucosinolates was measured using a high-pressure liquid chromatograph (HPLC) equipped with a UV-VIS detector from Shimadzu, using reverse phase and gradient elution columns.
Rapeseed flavonoids were measured spectrophotometrically after their extraction from the material using acetone, hydrochloric acid and urotropine, and after measurement of the solutions’ absorbance at the wavelength of λ = 425 nm with a Cary 100 Bio spectrophotometer from Varian.
2.11. Measurement of the Mass of One Thousand Seeds (MTS)
The method involves measuring the mass of 1000 seeds in the natural state. Seeds were selected from the sample at random and weighed with the accuracy of 0.01 g using a Radwag AS 110. R2 electronic scale. The measurement was performed in triplicate for each variant used in the experiment, after which the arithmetic mean of the results was calculated. The mass of 1000 seeds at natural moisture levels was calculated from the following formula:
where:
X—mass of 1000 dry seeds (g);
a—mass of 1000 seeds in the natural state (g);
b—seed moisture content (%).
2.12. Analysis of the Protein Content in the Seeds and Dry Material
The protein content was calculated using Kjeldahl’s method, in accordance with the PN-A-04018/A z 3:2002 standard [
29]. The method entails transforming organic nitrogen compounds into ammonium sulphate through mineralization with concentrated sulfuric acid in the presence of a catalyst, alkalization of the solution, distillation of NH
3, and titration of ammonia bound with boric acid with sulfuric acid. The results were expressed in % and estimated as the average of three measurements.
2.13. Analysis of the Fat Content in the Seeds and Dry Material
The fat content was measured using a Soxtec 8000 device (ASN 310 applications). The Soxhlet method entails multiple, continuous extractions of fat from the pulverized and pre-dried product using an organic solvent, then removing the solvent and weighing the fatty substance. The results are expressed as % and estimated as the mean from triplicate measurements. The analysis was performed in accordance with the PN-EN ISO 659:2010 standard [
30].
2.14. Experimental Design and Statistical Analysis
A three-way analysis of variance (ANOVA) was performed to determine the effect of the metal nanoparticles’ addition, freeze-drying temperature, and the year of rapeseed cultivation on fat, protein, flavonoids, glucosinolates and total polyphenolic content (
Tables S2–S5, go to the
Supplementary Material). The lightness, chroma and hue were also determined (
Tables S6–S8, go to the
Supplementary Material). Moreover, a two-way analysis of variance (ANOVA) was performed to determine the effect of the metal nanoparticles’ addition and the year of rapeseed cultivation on fat content, protein and thousand seed weight (
Tables S9–S13, go to the
Supplementary Material). To analyze the significance of differences between the means of the analyzed results, a pairwise comparison was made (Tuckey’s post-hoc test). The adopted significance level was established at 0.05. All the tests and analyses were conducted in 5 replications. All analyses were performed using the StatisticaTM statistical software (version 13.1, TIBCO Software Inc., Palo Alto, CA, USA).
The analysis of drying kinetics regression was performed with the method of nonlinear least square estimation by calculating the coefficient of determination, the root mean squared error (RMSE) and chi-squared test value (
χ2). The values of RMSE and
χ2 were calculated from:
where:
MRi,p is the expected value of reduced water content;
MRi,e is the experimental value of the reduced water content;
N is the number of measurements, and
n is the number of parameters in the given model’s equation.
3. Results
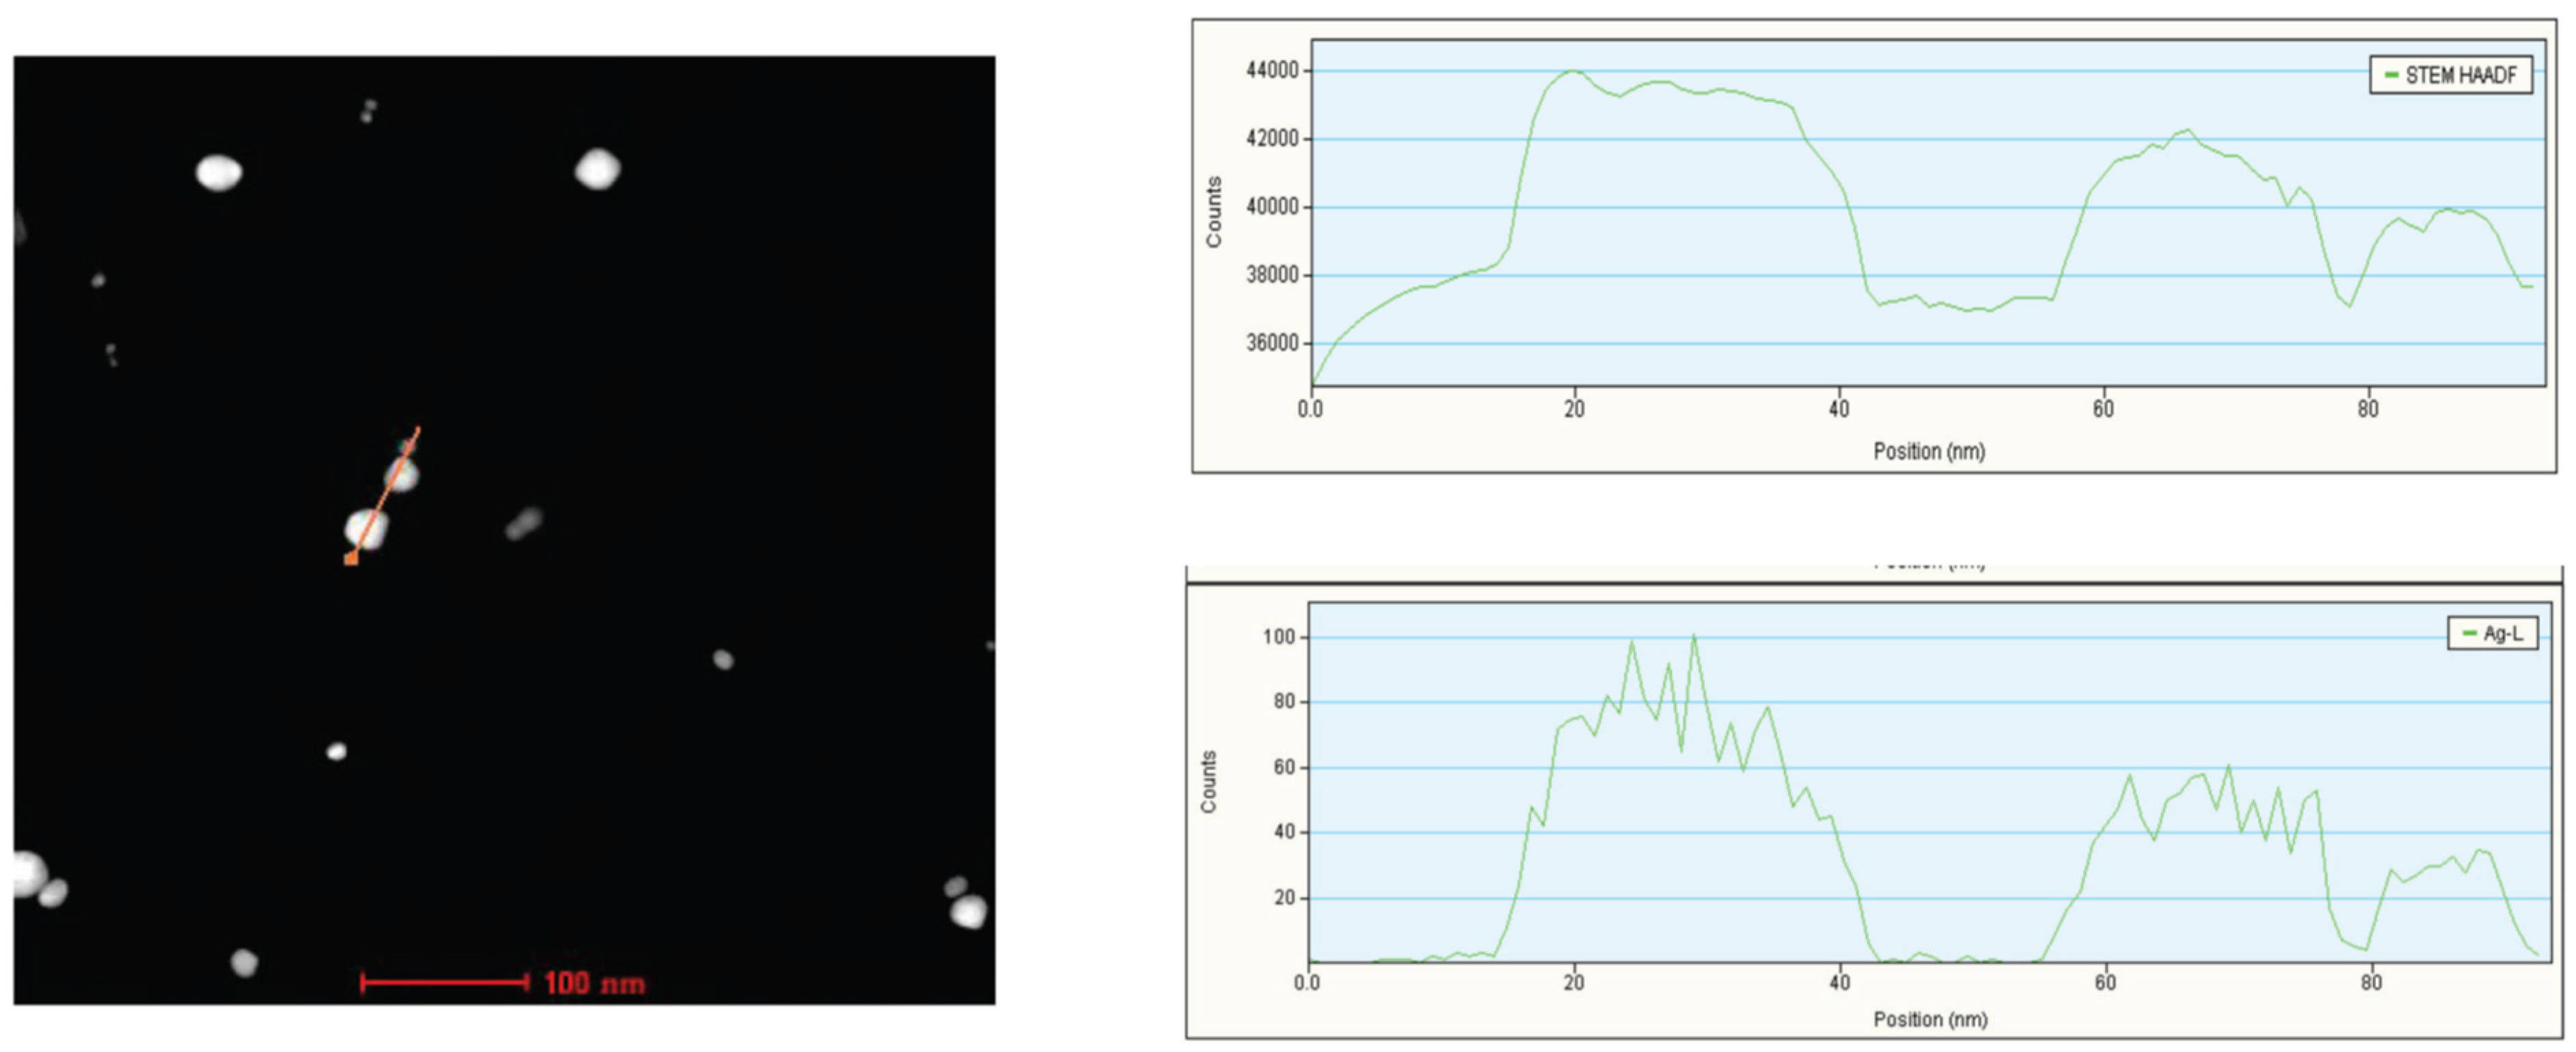
3.1. Effect of TEM Analysis
As seen in the left panel of
Figure 1, the analysis pertained to a cross-section of three nanoparticles (dark field image). On the right-hand side, there are two profiles: the top one represents the sizes of the particles, the bottom one their spectrum. In the case of the bottom panel, the spectrum of the L-AgNP line corresponds exactly to the particles themselves, which evidences that they are indeed silver [
31].
Figure 2 evidences the presence of copper in the analyzed nanoparticle, as determined on the basis of lattice constants measured in Fourier transform images, the high-resolution FFT of the TEM micrograph, and the ICCD crystallographic database. Based on the analysis of lattice constant measurements in the diffraction image in two different planes, and the comparison of the lattice parameters with the ICCD diffraction database, it was confirmed that the analyzed sample contained CuNP nanoparticles [
31].
3.2. Mass of One Thousand Seeds, Fat and Protein Content in Rapeseeds
Based on the results (
Table 1) recorded in 2018, the mean fat content in the control sample was 43.63%. In the respective experimental variants, the fat content was statistically significantly higher. In the plants subjected to single (×1) and double (×2) treatment with AgNP, it was higher by 7.11% and 8.41%, respectively, as compared with the control. The results recorded in plants treated with CuNP were similar to those recorded for silver nanoparticles: 8.80% and 7.88%, respectively,
In terms of the mean protein content, the mean value recorded for the control sample was 22.43% and the values observed in the experimental samples were statistically significantly lower by comparison. After single application (×1) AgNP, mean protein content in the rapeseeds decreased by 10.70%, and after double application (×2) by 12.75%, compared with the control. In the case of the single (×1) and double (×2) application of CuNP, the same decreased by 21.95% and 20.16%, respectively, relative to the control.
Significant differences were observed in terms of the size of seeds estimated based on the MTS. In the control sample, the mass of one thousand seeds was 6.29 g. After the single and double application of AgNP, the average size of the seeds was reduced by 8.74% and 3.97%, respectively, relative to the control. After the (×1) and (×2) application of CuNP, the differences were considerably higher, 9.54% and 7.47%, respectively.
In 2019, the average fat content in the control sample was 44.07%. After the (×1) and (×2) application of the silver nanoparticles, the same decreased by 1.0% and 0.33%, respectively. The application of CuNP led to a slight increase in the analyzed parameter’s value, by 1.72% (×1) and 0.68% (×2), respectively.
For the mean content of protein in rapeseed, the value for the control sample was 21.57%. The application of both nanoparticles, regardless of the dose, led to a decrease of the same amount. After spraying the plants with AgNP, the protein content decreased by 0.28% (×1) and 0.32% (×2), respectively. In the case of the CuNP treatment, the respective protein content decreased by 4.36% and 4.74%.
MTS analyses for the control sample revealed that the mass of one thousand seeds in the control sample was 4.59 g. Its decrease was observed only in the case of the (×1) AgNP treatment, where the result was 3.49% lower than in the control. After (×2) application of nanosilver, the mass of seeds increased by 11.5%. Copper nanoparticle treatment also contributed to increased MTS, by 4.36% after single application and 11.55% after double application of CuNP, relative to the control.
In 2020, the mean fat content level in rapeseeds (42.66%) increased relative to the control after the application of all the nanoparticle treatment variants. In the experimental variants, the fat content in seeds was within the range from 0.39, after (×2) AgNP, to 2.11% after (×1) CuNP.
The protein content in the control sample seeds was 21.96%. In the experimental variants, it was observed to decrease within the range from 1.21%, after both the single and double application (×1 and ×2) of AgNP, to 5.61% after the single application (×1) of CuNP.
Determination of the MTS value allows an assessment of the quality of the material harvested in a given period. Based on the obtained results, it can be concluded that the mass of one thousand seeds was reduced due to the nanoparticle treatments. The observed decrease in the MTS was between 4.60% for (×2) CuNP, and 18.61% for (×2) AgNP.
3.3. Fat and Protein Content in Dried Rapeseed Sprouts
The process of drying rapeseed sprouts may affect the content of fat and protein in the material. The table below presents the results recorded in this context (
Table 2). Analyses related to the fat content in rape sprouts dried in 2018 at various temperatures (20, 40, and 60 °C) returned the following results: the application of both silver and copper nanoparticles during plant growth did not reduce the fat content in the dried sprouts. Instead, a statistically significant increase was observed in each experimental variant. Furthermore, increasing the drying temperature led to a significant increase in the dried sprouts’ fat content. For the drying temperature of 20 °C, an increase in the mean fat content was recorded for both nanoparticle treatments. It ranged from 2.41% (×1) CuNP to 10.41% (×2) AgNP. At 40 °C, the registered increase was between 1.47% for (×1) CuNP and 14.66% for (×2) AgNP, whereas for the highest tested temperature of 60 °C, the increase in fat content was between 4.69% for (×1) CuNP, and 16.21% for (×2) AgNP.
The increase in fat content was accompanied by a decrease in protein content. In most cases, the latter was statistically significantly lower as compared with the control sample values. For the drying temperature of 20 °C, the protein content in the dried sprouts decreased by between 0.25% for (×2) CuNP, and 20.13% for (×2) AgNP. At 40 °C, the values oscillated between 2.21%, after the application of (×1) CuNP, and 22.66% after the application of (×2) AgNP. The use of the highest of the analyzed drying temperatures 60 °C led to a decrease in the respective protein content by between 2.60% for (×1) CuNP, and 19.68% for (×2) CuNP, relative to the control.
In the sprouts grown from the seeds collected in 2019, the drying process in most cases caused a statistically significant decrease in the content of both fat and protein. For the drying temperature of 20 °C, a statistically significant increase in the fat content was registered after the double application (×2) of silver and copper nanoparticles. The value obtained in the control sample was 40.94%. The respective increase in the mean fat content in the sprouts, compared with the control, was 2.80% for AgNP and 0.97% for CuNP, whereas the decrease in the parameter’s value was 6.65% and 2.84%, respectively. During drying at 40 °C, all the analyzed variants showed a decrease in the fat content by between 0.64% after the (×1) application of CuNP, and 3.82% after (×1) AgNP. In the case of drying at 60 °C, a tendency similar to that observed for 20 °C was recorded, with the fat content increasing after the (×2) application of AgNP and CuNP. The respective values relative to the control were 0.18% and 2.11%.
The mean content of protein in the control sample sprouts was between 20.95% for sprouts dried at 20 °C and 23.46% for 60 °C. During drying at 20 °C, a significant increase in this value was observed for the single application of both nanoparticle treatments, by 7.62% and 3.61%, respectively, relative to the control. At the average drying temperature of 40 °C, both after the (×1) and (×2) application of AgNP, the determined protein content was higher compared with the control, by 7.61% and 6.86 %, respectively. After spraying the plants (×1) with CuNP, the average protein content was also observed to increase by 1.27% relative to the control, but after the (×2) application, it decreased by 2.55%. In the highest temperature range (60 °C), the dried rape sprouts showed lowered protein levels for all nanoparticle treatment variants. The decrease was within the range from 0.93% for (×1) AgNP, to 7.37% for (×2) CuNP.
The control sample of dry rape sprout material obtained from seeds collected in 2020 was characterized by a fat level from 38.21% (60 °C) to 40.36% (20 °C). In experimental variants treated with silver and copper nanoparticles, both after one-time and double application, increases in terms of this value were observed for all drying temperatures adopted in the experiment. The highest value was observed for drying at 20 and 60 °C for the double (×2) application of AgNP (5.15% for drying at 20 °C, and 5.71% for 60 °C).
3.4. Content of Flavonoids and Glucosinolates in Rapeseeds
The analytical results related to the content of flavonoids and glucosinolates in the rapeseeds obtained from plants sprayed with the metal nanoparticles are presented in
Table 3.
In 2018, the mean content of flavonoids in the control sample seeds was 5.47 mg·100 g−1. The application of metal nanoparticles in most of the analyzed cases led to a statistically significant decrease in that value. The difference relative to the control was between 10.42% for (×2) CuNP, and 57.95% for (×1) AgNP and CuNP.
In the case of glucosinolates, the application of the analyzed preparations led to a significant increase in their content in the seeds. In the control sample, the same corresponded to 12.2 µmol·g−1, whereas the application of nanoparticles in both the single and double dose induced an increase of between 6.22% for (×1) CuNP, and 18.61% for (×2) CuNP.
In the case of seeds harvested in 2019, the mean content of flavonoids was 5.99 mg·100 g−1 in the control sample, and an increase thereof was observed after the double application of either nanoparticle. In seeds from plants sprayed (×2) with AgNP, the value increased by 8.01%, and by 10.35% after (×2) CuNP, relative to the control. The results below the control values were observed after single application, with a decrease of 19.03% and 3.70%, respectively.
The mean content of glucosinolates in the control sample was 16.02 µmol·g−1. The single application of both silver and copper nanoparticles led to its decrease in the rapeseeds. The obtained values were lower than in the control by 17.35 and 16.54%, respectively. However, double application of the solutions induced an increase in the same by 25.59 and 2.68%, respectively.
The content of flavonoids in the seeds harvested in 2020 showed a downward trend. In all analyzed variants, the average values of this parameter were lower, relative to the control (5.61 mg·100 g−1). The lowest content was observed after the (×2) application of CuNP (0.36%), and the highest after (×1) AgNP (19.3%).
Analyses pertaining to the content of glucosinolates in rapeseeds returned the mean value of 14.88 µmol·g−1 for the control sample, and the application of silver and copper nanoparticles induced an increase of between 0.47 for (×1) CuNP, and 2.21% for (×2) CuNP.
3.5. Flavonoid Content in Rapeseed Sprouts
The results for the flavonoid content measured relative to the respective years of harvest and the drying temperatures employed are presented in
Table 4. The 2018 samples analyzed in the three adopted temperature ranges (20, 40, and 60 °C) revealed that the mean content in the control sample was between 84.08 mg·100 g
−1 (for drying at 40 °C) and 87.71 mg·100 g
−1 (for drying at 20 °C). In the experiment involving the application of the two nanoparticles treatments, the cultivated sprouts were dried. After the process, a statistically significant decrease in the content of flavonoids was observed. The highest decrease was recorded for seeds from plants treated (×1) with AgNP (26.68%), and the lowest was for the (×2) application of CuNP (13.05% at 20 °C). After drying at 40 °C, the largest decrease was recorded for the (×1) application of CuNP (21.12%), and the lowest for (×2) AgNP (3.48%).
Analysis of the samples obtained in the subsequent year (2019) showed a similar trend, but with a small exception. The content of flavonoids in the control was between 75.30 for 20 °C drying, to 88.20 mg·100 g−1 for 40 °C. The largest differences relative to the control were observed after drying the sprouts at 20 and 40 °C. In the former case, the most significant decrease was recorded in the (×1) CuNP experiment, where the parameter dropped by 18.26%, and the least significant was in the case of (×2) AgNP, where it was only 0.36%. After drying at 40 °C, the decrease observed for the (×1) AgNP sample was 38.45%, relative to the control. At this temperature, the mentioned exception was also recorded; specifically, an increase in the content of flavonoids in the dried rape sprout material, as the parameter increased by 1.49% relative to the control for the (×2) CuNP sample.
3.6. Color Assessment
With increasing temperature of the heating plates, in the respective years of cultivation and after the single or double spraying with silver or copper nanoparticle, a decrease in the value of the
L* coordinate was observed (
Table 5). The mean value of L in dried rape sprouts in the control samples from 2018–2020 was within the range of 49.3 to 60.8. The application of silver and copper nanoparticles onto the plants during their growth in the field increased the value in most of the analyzed cases for both treatment variants. The highest increase for the (×1) AgNP treatment was observed in 2018 in the variant dried at 40 °C. The relevant value was 11.6% higher relative to the control and the highest observed during the three-year experiment for samples treated with nanosilver. In the case of CuNP application, similar results were obtained for the (×2) treatment, also in 2018. The value of this factor was 11.9% higher from that obtained in the control dried at 20 °C.
The fluctuations between the temperature levels of 20 °C and 40 °C were slight, but increased at 60 °C. In many cases, the impact of the heating plates’ temperature on the lightness of the dry material proved insignificant (α = 0.05). However, regardless of the employed variant of nanocolloid treatment and the temperature of the heating plates during sublimation drying, significant differences in terms of the
L* value were observed between the dried rape sprouts obtained in the respective years. The brightest dry material was observed in the 2020 harvest, and the lowest
L* value was recorded for rape harvested in 2018. The tendency was observed regardless of the nanocolloid treatment employed or the number of applications thereof. No clear impact of nanoparticle sprays on the values of this color coordinate were recorded relative to the control. Dried rape sprouts with the highest value of lightness (
L* = 62.2) were obtained after sublimation drying at 20 °C for the material cultivated in 2020, and subjected to a single treatment with the solution containing CuNP. The observed deterioration of the dry material’s lightness with increasing drying temperature was due to chlorophyll degradation [
32], which contributes to the material’s brownish color [
33]. Reduction of the
L* color coordinate with growing temperature has also been reported by other authors in the context of drying: e.g., for garlic [
34], bananas [
35], apples and pumpkin [
36].
In the entire measurement period (
Table 6), the value of color saturation was between 24.3 and 32.2. For rape cultivated in 2018 and 2019, no clear impact of the heating plate temperature or the nanocolloid treatment regimen on the color saturation of dried sprouts was observed. In the case of rape cultivated in 2020, the color saturation was observed to decrease with growing temperature of the heating plates (with the exception of sprouts obtained from seeds treated with ×2 CuNP). Regardless of the year of cultivation or the drying temperature, no significant impact of the spraying regimen on the color saturation was observed.
The dry material obtained from seeds cultivated in 2018 and 2019 was characterized by more stable color hue values oscillating between 88 and 90 (
Table 7). In this case, no clear impact of the drying temperature of the spraying variant on this color characteristic was observed. In most cases, the results were statistically insignificant. Absence of significant variations in terms of the color hue during drying under different conditions was also reported by Soysal [
37], Baysal et al. [
38], and İlter et al. [
39]. The dry material obtained from sprouts grown from seeds harvested in 2020 (for the heating plate temperatures of 20 °C and 40 °C) was characterized by lower values of color hue, compared with the previous years. No such tendency was observed at 60 °C. In the case of dried sprouts from seeds harvested in 2020, an impact of the heating plates’ temperature on the color hue was recorded. With higher drying temperatures, the color hue value increased.
3.7. Polyphenol Content in Dried Sprouts
Table 8 presents the results obtained in terms of the total polyphenol content in the dried rape sprouts. The content of polyphenols in the control samples in all experimental years was within the range from 4.31 mg GME/gDM (for the drying temperature of 60 °C in 2020) and 7.94 mg GME/gDM (for the drying temperature of 20 °C in 2020).
In nearly all analyzed years of cultivation and for all silver and copper nanoparticle treatments, increasing the temperature of the heating plates induced a reduction of the total polyphenol content (TPC). The TPC decrease was slight at 40 °C, and more significant at 60 °C. The lowest value of TPC (3.92) was recorded in 2019 for sprouts heated at 60 °C, sprayed one time with the silver nanoparticles. In turn, the highest value of the analyzed factor (8.58) was observed for sprouts treated with the same nanoparticles but twice, dried at 20 °C and cultivated in 2020. In the case of sprouts from 2018 treated with a single dose of silver nanoparticles, a minimum increase in the polyphenol content was observed after increasing the drying temperature from 20 to 40 °C, but the difference was statistically insignificant. Upon analyzing the TPC results in the control group, a gradual decrease in the content of the compounds with increasing drying temperature could also be observed. The respective values were within the range of 5.62–7.46 for the 2018 samples, and 4.31–6.51 and 6.61–7.94 for the 2019 and 2020 cultivations, respectively.
At the given temperature level, the use of nanoparticle treatments (in the three analyzed years) during rape cultivation did not significantly affect the total polyphenol content. Dried sprouts obtained in 2020 returned the highest TPC values (regardless of the drying temperature), whereas dried material obtained from rape cultivated in 2019 showed the lowest results.
4. Discussion
Respective rape cultivars differ from each other, particularly in terms of yields, mass of 1000 seeds, content of raw fat, total protein, and glucosinolates.
The size of seeds is an important factor in the processing industry, as smaller seed dimensions are associated with higher phosphorus content in the oil, including non-hydratable forms that are particularly difficult to eliminate. Based on the description provided by Grupa IHR (on the packaging), the average mass of 1000 seeds for the “Ricky” cultivar in 2018, 2019, and 2020 was 5.0 g. Meanwhile, the experimentally determined MTS was varied. It was higher in the first year, and in the subsequent two years lower than that declared by Grupa IHAR-Hodowla Roślin Strzelce Sp.z o.o. Specifically, in 2018 it fluctuated between 5.69 g for (×1) CuNP, and 6.29 g (in the control sample). In 2019, the result obtained after double application of AgNP was 4.43 g, whereas for AgNP, also dosed at (×2), the result was 5.12 g. In 2020, the results varied between 4.56 g (×1) AgNP and 4.88 g (control).
A significant impact on the mass of 1000 seeds in the experiment, particularly in the case of the control sample, was associated not only with the use or absence of the nanoparticle treatment, but also the prevalent weather conditions. The results reported by Murawa and Warmiński [
40] pertained to different rape cultivars (‘Star’ and ‘Margo’). In the study, the authors employed a variety of plant control agents and observed that the MTS of the analyzed cultivars did not depend on the specific year of cultivation, but fluctuated between 4.05 g (after desiccation and pesticide use) and 4.53 g (after applying Butisan+Ronilan) depending on the combination of agents used.
The usability of rapeseeds in the food industry is affected by specific physical properties with the size of seeds being chief among the same [
41], which, as observed by Fornal et al. [
42] is strongly dependent on genetic factors. The size of seeds is an important factor in the processing industry, as smaller seed dimensions are associated with higher phosphorus content in the oil, including non-hydratable forms that are particularly difficult to eliminate.
Other criteria significant to the assessment of spring rapeseed quality, in the context of edible oil production, include the fat and protein content that are largely dependent on agrotechnical and climatic factors, as well as the plant cultivar [
43]. The yield of fat and protein, strictly related to the content thereof in seeds and harvests, is strongly affected by the weather, especially the levels of precipitation [
44]. The content of fat in rapeseeds is significant both technologically and economically, while the chemical composition of the obtained oil and sprouts determines their stability, nutritional value and health benefits. In the cultivar analyzed in the present study, the fat content in seeds varied in 2018 between 43.63% in the control sample, and 47.47% after single application of CuNP. In 2019, the lowest fat content in the seeds was observed after a single application of AgNP (4.43%), and the highest after the single application of CuNP (44.83%). In 2020, the fat content varied between 4.56% in plants sprayed with a single dose of AgNP, and 4.88% in the control.
In terms of protein, both the lowest and highest content thereof was recorded in the 2018 harvest: 20.20% for (×2) CuNP and 22.43% for the control, respectively.
The process of germination entails the disintegration of polysaccharides to oligo- and monosaccharides, fats to free fatty acids, protein to polypeptides and free amino acids. These processes can be considered a pretreatment that facilitate the human absorption of the compounds. During germination, the content of anti-nutrients (phytic acid, trypsin inhibitor) decreases, and once the process is completed, the sprouts contain a number of compounds with confirmed health benefits, e.g., natural antioxidants and glucosinolates [
45]. Germinated seeds also contain various taste-related and aromatic compounds that activate digestive enzymes, as well as saponins, flavonoids, and phytohormones, all of which are beneficial to health.
It is assumed that seeds intended for both sowing and consumption must satisfy the requirements of the Polish norm that stipulates the glucosinolates content of 15 μM·g
−1 in sowing seeds, and 25 μM·g
−1 in de-fattened cake for seeds intended for processing [
46]. In a study by Billsborrow et al. [
47], it was demonstrated that the application of nitrogen within the range of 0 to 150 kg·ha
−1 significantly increased the concentration of glucosinolates. Above 150 kg·ha
−1, however, the treatment had negligible effects, or none at all, on the concentration of the compounds in rapeseeds.
Glucosinolates are found in plants in their glycoside form, thanks to which they are not toxic to animals, plants or pathogens [
48]. Their qualitative and quantitative composition depends on the particular plant species, organ, or developmental phase. They are present, albeit in varying concentrations, in roots, leaves, sprouts, seeds, blossoms, and young seedlings [
49]. The content of glucosinolates can also depend on environmental factors and signal particles related to the response to biotic and abiotic stress [
50]. Glucosinolates found in brassicas have significant uses in cancer chemoprevention [
51].
In winter rape, the content of glucosinolates is considerably reduced, reaching between 6.18 and 9.9 μmol·g
−1, on average [
51]. In our study, the content of glucosinolates in rapeseeds was within the following annual ranges: in 2018, between 12.20 µmol·g
−1 in the control and 14.47 after double application of AgNP (×2); in 2019, between 13.24 in seeds after the (×1) application of AgNP, and 20.12 µmol·g
−1 after (×2) AgNP. In the last year of the experiment, it was between 14.88 in the control and 15.21 µmol·g
−1 after (×2) application of CuNP.
Flavonoids are found, for example, in leaves and blossoms—usually as yellow pigments, as well as seeds. Flavonoid compounds determine the color, smell and taste of fruit and flowers, which allows the plants to be recognized by insects, birds and mammals transporting the pollen or seeds [
51]. Furthermore, they are toxic to pests as well as fungal and bacterial pathogens, which contributes to plants’ resistance to infections. They also protect plants against harmful effects of UV radiation. The compounds have broad and positive pharmacological effects [
52]; they are substances capable of very efficiently sweeping toxins, such as heavy metals (lead, mercury, cadmium, etc.), and eliminating them from the organism, particularly in the liver and the urinary system [
53,
54]. In oily raw materials, they can be a potential source of phenolic antioxidants preventing lipid oxidation in food, as well as, due to their biological properties, ingredients in diet supplements and functional food [
55,
56].
The content of flavonoids in rapeseeds analyzed in the present study varied, in 2018, from a level below the limit of determination, after the (×1 and ×2) application of both nanoparticles, to 6.04 mg·100 g
−1 after the application of CuNP. In the subsequent years, the respective values were between 4.85 mg·100 g
−1 for (×1) AgNP, and 6.61 mg·100 g
−1 for (×2) CuNP, as well as 4.52 mg·100 g
−1 after (×1) AgNP and 5.59 mg·100 g
−1 after (×2) CuNP. In an experiment conducted by Hezaveh et al. [
57], on rapeseeds cultivated under different conditions with the use of ZnO NPs, it was concluded that the content of flavonoids increased to 27.76% in plants treated with NaCl. The concentration of these compounds in the seeds was significantly decreased, to the level of 13.09%, after the application of both NaCl (100 mM) and ZnO (20 mg·L
−1) nanoparticles. The lowest level of flavonoids was reported after the combined use of NaCl (100 mM) and ZnO NPsNP (20 mg·L
−1).
In the case of rapeseed sprouts grown and subsequently dried in the present study, the content of flavonoids was considerably higher. In the sprouts obtained from the 2018 seeds, the concentration varied between 64.31 after (×1) AgNP, and 87.71 mg·100 g−1 in the control, for the drying temperature of 20 °C. In 2019, it ranged from 54.29 for (×1) AgNC, to 89.51 mg·100 g−1 for (×2) CuNP, after drying at 40 °C. In the last year of the experiment (2020), the respective flavonoid content was between 50.80 for (×1) AgNP, and 68.90 mg·100 g−1 for (×1) CuNP, for the drying temperature of 40 °C.
Polyphenols are valuable nutrients found in plants that act as natural antioxidants. Although they can be produced synthetically, polyphenolic compounds obtained from plants tend to show better bioavailability and stronger effects. The rape sprouts analyzed in this study were good dietary sources of such compounds. As revealed in the conducted experiments, regardless of the year of cultivation, increasing the temperature of heating plates decreased the total polyphenol content. This was observed both for single and double nanoparticle treatment. As demonstrated in numerous studies, when the temperature exceeds 50 °C, the total polyphenol content tends to drop rapidly [
58,
59,
60,
61,
62].


