1. Introduction
Dried fruits and vegetables have become more and more popular as healthy snacks, replacing, to some extent, potato chips or crisps [
1].
Drying reduces the growth of micro-organisms and inhibits enzymatic degradation, thus extending the time of consumption of fruits and vegetables. The chemical composition, appearance, and texture of dried biological materials depends on the drying process. [
1,
2]. The purpose of drying is to reduce the volume of products, making them easier to store and transport. In convective drying methods, products undergo long periods of exposure to heat and light, which usually causes degradation of nutrients in the dried products [
2,
3].
Freeze drying (FD) involves removing water from a frozen product through ice sublimation, which is the conversion of ice to vapor, bypassing the liquid state. It is a complex and multi-stage process [
4] that ensures optimum product quality [
5]. Many researchers have shown that the best radical neutralization capacity of dried materials is obtained by the FD method [
6,
7,
8]. Dried products obtained by this method showed levels of polyphenolic compounds and antioxidant activity that were comparable to those of the raw material [
9]. The low temperature of the FD process slows the degradation reactions of bioactive compounds and preserves higher nutrient values compared to other drying methods [
2].
Lowering the temperature of the convection drying process can have a positive effect on the quality of the dried product. Vacuum drying (VD) offers the possibility of lowering the process temperature, owing to the presence of reduced pressure in the drying chamber. VD is often used to dry heat-sensitive materials [
10].
Choosing the right drying method and the right process parameters is necessary to obtain a product with a high content of bioactive compounds and high antioxidant activity [
1].
Vacuum impregnation (VI) is a widely used vegetable and fruit pretreatment process that involves osmotic dehydration under reduced pressure [
11]. VI is considered a promising technique for use in the food industry [
12]. Recently, numerous studies have been conducted using micro-organisms and biologically active compounds as impregnating solutions. These activities are aimed at obtaining innovative nutritional products. Researchers noted that, in the case of dried zucchini slices, VI with MD (maltodextrin) and CaCl
2 solutions did not lead to a significant water loss. When using the addition of maltodextrin in impregnating solutions, the authors observed, in dried zucchini thick walls, intercellular spaces rich in solutes and turgid cells, in which no structural changes were observed [
13]. The purpose of VI is to introduce additives, such as microbial preservatives, anti-browning agents, or cryoprotectants, into fruit and vegetable tissues. The additives are intended to improve the properties of biological materials [
12]. However, there are few reports of product modifications induced by impregnated particles and/or pressure changes affecting the functional and nutritional properties of processed fruits and vegetables [
11].
Texture is an important quality property of both fresh and processed fruits and vegetables. There are a number of published studies on vegetables and fruits enriched with calcium salts [
13,
14]. Positive effects of VI on the mechanical properties of processed food products and their acceptability to consumers have also been reported [
13].
According to global crop statistics, sweet potato (
Ipomoea batatas) is one of the most important food crops and offers significant nutritional and economic benefits [
15]. Sweet potatoes are rich in vitamins, such as B, C, E, and K, complex minerals (calcium, potassium, iron, phosphorus, potassium, zinc, and sodium), carbohydrates, dietary fiber, and other nutrients—the amount of which depends on the variety [
15,
16]. Orange-colored sweet potatoes are also a rich source of the cancer-fighting antioxidant β-carotene. The human body can convert β-carotene into vitamin A, which is essential for a healthy immune system [
15]. Researchers have attempted to use sweet potatoes to make sweet bread [
17] and cookies [
18].
The aim of the present study was to evaluate the effect of the type of impregnating solution and drying method (FD and VD) on the physicochemical properties of dried sweet potatoes. The total polyphenol, carotenoid, chlorophyll, ferric-reducing antioxidant potential (FRAP), and DPPH (1,1-diphenyl-2-picrylhydrazyl) and ABTS (2,2′-azino-bis(3-ethylbenzthiazoline-6-sulphonic acid)) radical-scavenging activities and VOC composition of dried sweet potatoes were determined. In addition, water activity, dry matter content, color change, and texture were also determined.
2. Materials and Methods
2.1. Reagents and Standards
All reagents and organic solvents were of analytical grade. Ethanol, 1,1-diphenyl-2-picrylhydrazyl (DPPH) ferrous chloride, tripyridyl triazine (TPTZ), potassium peroxydisulfate, 2,2′-azino-bis(3-ethylbenzthiazoline-6-sulphonic acid) (ABTS), and 6-hydroxy-2,5,7,8-tetramethylchroman-2-carboxylic acid (Trolox) were obtained from Sigma-Aldrich (St. Louis, MO, USA). Folin–Ciocalteu reagent, acetone, and sodium carbonate were obtained from POCh (Gliwice, Poland).
2.2. Plant Material and Sample Processing
Sweet potatoes were purchased from a vegetable trading market (country of origin, Netherlands). Prior to testing, the raw material was stored at 4 ± 2 °C in an RL58GRGIH refrigerator (Samsung Electronics Polska sp. z o.o., Wronki, Poland). Sweet potatoes with an initial moisture content of 79.93% were washed, blotted dry, peeled, and cut into slices 3 mm ± 0.1 mm thick, and each slice was cut in half.
2.2.1. Impregnating Solutions
Four types of infiltration solutions were used in this study: 2% sodium chloride (NaCl) solution (N) 4 °Bx, squeezed kale juice with 2% NaCl solution (K) 6.5 °Bx; squeezed onion juice with 2% NaCl solution (O) 10.5 °Bx, and squeezed onion and kale juice in a 50:50 ratio with 2% NaCl solution (OK) 9.6 °Bx. Juices were obtained using a juicer (AE 3532 CTC Clatronic, Warsaw, Poland). The concentration of vegetable juices was measured using an Atago Digital Brix Refractometer PAL-3 (Atago Co., Ltd., Tokyo, Japan).
2.2.2. Vacuum Impregnation
VI was performed with a prototype plant located at the lab, Wroclaw University of Life Sciences. A vacuum chamber connected to a vacuum pump was used [
11]. Samples (100 g) were placed in a perforated stainless-steel vessel. The total process time was 26 min. In Stage I, the vessel was put in the chamber and exposed to reduced pressure of 6 kPa, maintained for 2 min. In Stage II, 700 g of impregnating solution was added and the material was in the impregnation chamber for 4 min. In Stage III, atmospheric pressure was restored and the samples were held for 20 min. The impregnating solution was drained using a filter paper.
2.2.3. Drying Methods
The prepared material was dried using two methods: freeze drying (FD) and vacuum drying (VD). The control sample consisted of sweet potato slices without pretreatment (F).
The prepared sweet potato slices were spread and then frozen at −18 °C for 48 h at a freezing rate of 1 °C·min−1 in a home freezer, RL58GRGIH (Samsung Electronics Polska sp. z o.o., Wronki, Polska). FD was performed in an installation (Free-Zone 4.5 L, Labconco, Fort Scott, KS, USA) for 24 h under a pressure of 5 Pa. A contact heat delivery method was used. The temperature of the heating shelves was 22 °C. The temperature of the drying chamber was −50 °C.
VD was performed in a V0101 laboratory dryer (Memmert, Schwabach, Germany) at 10 kPa for 24 h. The drying temperature was set to 50 °C. The drying conditions were determined based on preliminary tests.
2.3. Total Phenolic Content and Antioxidant Capacity
2.3.1. Sample Preparation
Powder samples of sweet potato (0.5 g) were extracted with 10 mL of 80% methanol acidified with 1% HCl (v/v). The extraction was performed by incubation for 20 min under sonication (300 W, 40 kHz; Sonic 6D, Polsonic, Warsaw, Poland) with occasional shaking. This method proved to be adequate for complete extraction. Next, the slurry was centrifuged at 19,000× g for 10 min, and the supernatant was filtered through a hydrophilic PTFE 0.20 µm membrane (Millex SamplicityTM filter, Merck, Darmstadt, Germany) and used for analysis.
2.3.2. Total Phenolic Content
Total phenolic content (TP) was obtained using a modification of the method described previously by Gao et al. [
19]. Briefly, 5 µL of methanolic sweet potato extract mixed with 50 μL 10% sodium carbonate, 100 μL H
2O, and 10 μL Folin–Ciocalteu reagent. Next, the mixture was shaken for 30 s and the result was read after 1 h. The results were recorded at 765 nm on Synergy H1 (BioTek, Winooski, VT, USA). The results were expressed as mg of gallic acid per 1 g of sweet potato dry matter (DM). The results are expressed as the mean ± standard deviation of four replicates.
2.3.3. Antioxidant Capacity
The antioxidant capacity of the samples was determined using the FRAP in the method described by Benzie et al. with modifications [
20]. Briefly, in the FRAP assay, 10 μL of methanolic sweet potato and 200 μL FRAP solution were added. The mixture was shaken for 30 s and the absorbance was measured after 10 min at a wavelength of 593 nm. The DPPH and ABTS of the samples were determined according to the method described by Yen et al. [
21] and Re et al. [
22] with some modifications on Synergy H1 (BioTek, Winooski, VT, USA). To determine the DPPH, 10 μL of methanolic sweet potato extract and 200 µL DPPH solution were mixed for 10 min, and then measured at 517 nm. In the ABTS assay, 10 μL of methanolic sweet potato and ABTS solution (200 µL) were added, mixed for 10 min, and then measured at 734 nm. A standard curve was prepared using different concentrations of Trolox. All result were expressed as Trolox equivalents per 100 g of sweet potato dry matter (µMol Tx/100 g DM).
2.3.4. Quantification of Total Carotenoids and Chlorophylls
The content of carotenoids and chlorophylls was determined using the method described by Nawirska-Olszańska, Stępień, and Biesiada [
23]. In brief, 2 g of the powdered samples of sweet potato was extracted with 15 mL 100% acetone, and slightly stirred. The samples were incubated for 24 h at 4 °C. The extracts were then centrifuged at 12,500×
g for 5 min, and the supernatants were recovered. The absorbance was measured using a Shimadzu UV-160A spectrophotometer [
24] at 661.6, 644.8, and 470 nm.
The total carotenoids and chlorophylls (as the sum of chlorophyll a and b) were calculated using the following formulae:
where:
Cha is chlorophyll a;
Chb is chlorophyll b;
Ca is the total carrotenoids;
A is the absorbency at corresponding wavelengths; the values 11.24, 2.04, 20.13, 4.19, 1.9, and 63.14 are molar absorptivity coefficients according to Wrolstad et al. [
24] for acetone (absorption of 1 cm).
2.4. Volatile Organic Compounds (VOCs) Profile
The extraction of VOCs in dried sweet potato headspace was performed by headspace solid-phase microextraction (HS-SPME) Arrow 1.10 mm (Divinylbenzene/Carbon WR/Polydimethylsiloxane (DVB/C-WR/PDMS)) (CTC Analytics AG, Zwingen, Switzerland) and followed by GC-MS analysis with Shimadzu GCMS-QP2020 (Shimadzu Company, Kyoto, Japan) equipped with Zebron ZB-5MSi (30 m × 0.25 mm × 0.25 μm) column (Phenomenex, Torrance, CA, USA). Briefly, 0.200 ± 0.01 g of fully grinded dried material was placed into a 20 mL headspace vial, along with 10 µg of undecane-2-one (Sigma-Aldrich, Steinheim, Germany) as internal standard and preincubated for 5 min at 60 °C, 250 rpm. Thereafter, the samples were subjected to 30 min of VOC extraction with the same conditions. After extraction, VOCs were desorbed at 250 °C in a GC injector with split 10. For analytes separation, the following temperature program was used: 50 °C to 130 °C at 4 °C/min, then to 180 °C at 10 °C/min, and, finally, to 280 °C at 20 °C/min. For mass spectrometry, the following conditions were used: ion source temperature 220 °C, interface temperature 250 °C, scanning mode from 40 to 400 m/z.
For data processing, Shimadzu software GCMS Postrun Analysis (Shimadzu Company, Kyoto, Japan) was used. The identification of VOCs was based upon the comparison of experimentally obtained linear retention indices (LRIs) calculated against C7–C40 n-alkanes mix (Sigma-Aldrich) analysis and experimentally obtained mass spectra with those available in Flavors and Fragrances of Natural and Synthetic Compounds GCMS Library (FFNSC 3) (Shimadzu Company, Kyoto, Japan). The LRIs filter was set at ±15 points, and only compounds with a similarity score ≥ 90% were considered as correct hits. Quantification was based on the peak area normalization against the internal standard peak area. The approximation of VOC concentration was calculated in relation to the amount of added internal standard.
2.5. Dry Matter and Water Activity
Sweet potato samples were weighed on a balance (AS/160/C/2, Radwag, Radom, Poland, accuracy ± 0.0001 g) and dried at 70 °C under reduced pressure (3 kPa) until a constant weight was obtained. The result was the mean of the four measurements (%) [
25].
Water activity of fresh and dried samples was determined using an AquaLab CX-2 apparatus (AquaLab Dew Point Water Activity Meter 4TE ± 0.003, AquaLab, Warszawa, Poland) according to the manufacturer’s instructions. The temperature for water activity determination was constant at 25 °C.
2.6. Colour
The color of the fresh, impregnated, and dried sweet potatoes was analyzed with a CR-200 colorimeter (Minolta Conica, Japan). The results are expressed as CIE L*, a*, and b* values, where L* represents the lightness component, a* represents green (−) and red (+), and the b* value represents blue (−) and yellow (+). The colorimeter was corrected using a calibration plate before the measurement. Each sample was measured at ten different locations.
The total change in color (∆E) between dried (L* sample, a* sample, b* sample) and fresh sweet potatoes was calculated according to [
26].
Chroma (Chroma) C*, which is used to determine the degree of difference in hue from a gray color of the same brightness, is considered a quantitative attribute of color. Higher saturation values are associated with a higher color intensity of dried sweet potatoes, as perceived by humans. Color saturation was calculated according to the following equation [
27]:
The browning index (BI) was calculated using the following equation [
28]:
where:
2.7. Texture Profile Analysis
Texture profile analysis (TPA) of the fresh and dried sweet potatoes was performed using an Instron 5544 strength-testing machine (Instron Corporation, Canton, MA, USA). TPA was performed according to the protocol described by Figiela and Tajnera-Czopka [
29]. The sample was subjected to double compression cycles imitating the double bite of the human jaw. A rectangular slab of 10 mm × 10 mm × 2 mm was cut and placed carefully on the table of the texture analyzer. The compression was performed at a speed of 0.1 mm/s and 50% deformation of the initial sample height. The test was performed in 10 repetitions. Based on the TPA curve, four parameters were determined: hardness, cohesiveness, springiness, and gumminess.
2.8. Statistical Analysis
The results are presented as the mean of three technical replications, unless indicated otherwise. Statistical analyses were performed using Statistica version 13.1 (StatSoft, Tulsa, OK, USA). One-way analysis of variance (ANOVA) using Duncan’s test was used to compare the mean values. Differences were considered to be significant at p < 0.05.
3. Results and Discussion
3.1. Bioactive Compounds Composition
The phenolic content was affected by the addition of the impregnating solution before drying (
Table 1). Samples subjected to VD were characterized by an average of 3% lower total phenolic (TP) content compared to the FD samples; however, these differences were not statistically significant.
The lowest TP content was determined in samples dried without the addition of the impregnating solution before drying. In vacuum-dried samples, a decrease in TP concentration by 18.1% was observed, whereas, in VD samples, it was 21.3% lower than that of the fresh sample. The addition of NaCl had a protective effect on dried sweet potato slices. It probably acted as a protective coating to protect polyphenolic compounds from oxidation. The samples with the addition of vegetable juices were characterized by the significantly highest total phenolics content (mean of 1.37 mg GAE/g DM for onion, mean of 1.26 mg GAE/g DM for kale, and mean of 1.33 mg GAE/g DM for onion with kale juice), as compared to the dried sweet potato without juice addition, which had the lowest value (0.76 mg GAE/g DM).
Several studies have shown that sweet potato is a good source of phenolic com-pounds. The TP content found in some of these studies was higher compared to the pre-sent data, while, in others, the results were similar. Grace et al. [
30] found that different sweet potato genotypes contained 2.78–39.92 mg GAE/g DM. Tang, Cai, and Xu [
31] determined that the TP content in five sweet potato varieties was in the range of 4.15 to 16.79 mg GAE/g DM. In their studies on two contrasting cultivars of sweet potato, Shekhar, Mishra, Buragohain, Chakraborty, and Chakraborty [
32] found that TP concentration varies in the range of 1.49–1.58 mg GAE/g, which is in accordance with our results. These differences may be affected by genetic factors, growth conditions, variety, soil properties, harvesting time, or geographical variations of sweet potato plants.
The addition of onion and kale juices affected the increase in TP concentration as compared to the fresh sample. This may be due to both the protective effect of the juice layer on the surface of the dried sweet potato slices and the enrichment of the samples with polyphenols from these raw materials. Both onions and kale are considered valuable sources of polyphenols. Lu et al. [
33] reported that, in yellow onion, total phenolic content (TPC) was in the range of 1.64 mg GAE/g of fresh matter (FM), while Mlček et al. [
34], in their studies on yellow onion varieties, determined TPC in the range of 1.17 to 1.62 mg GAE/g FM, depending on the harvesting season. The concentration of phenolic compounds in fresh and frozen kale, as determined by Ilyasoğlu and Burnaz [
35], was 12.69 and 21.30 mg GAE/g DW, respectively, and Ferioli et al. [
36] found that TPC in kale ethanolic extract ranged between 13.49 and 28.54 mg/g DM.
Analysis of carotenoid concentrations in sweet potato samples revealed that the drying method and functional addition had a significant effect on the total carotenoid content of the tested samples (
Table 1).
The addition of vegetable juices increased the concentration of total carotenoids (TC). The highest concentration of TC was determined in samples with the addition of onion and kale juices (mean of 173.79 mg/g DM). This is most likely due to the enrichment of the samples with carotenoids derived from onions and kale, as the presence of carotenoids in both these materials was noted [
36,
37]. In the case of drying without the addition of a functional ingredient and with the addition of sodium chloride, a reduction in carotenoid content was observed (on average by 19.2% and 13.8%, respectively). The samples obtained with the VD method had a 19.2% lower TC content compared to the freeze-dried samples.
Chlorophyll content in samples after drying without additives and with the addition of sodium chloride slightly decreased; however, these changes were not statistically significant (
Table 1). The addition of vegetable juices increased the content of chlorophyll; the highest values were determined in samples with the addition of kale (2.2-fold) for FD and 2.1-fold for VD. Increasing the content of chlorophyll in dried samples is related to their enrichment with kale juice. The literature indicates that the chlorophyll content in kale varies between 1624 and 13,543 mg/kg DM [
36,
38].
The results show that the concentration of bioactive compounds in dried plants is dependent on the conditions during the drying process. The variability of bioactive compounds in plant tissues depends on many factors, such as process temperature, UV light, the presence of oxygen, and the presence of protective additives [
39,
40,
41].
3.2. In Vitro Antioxidant Activity
The in vitro antioxidant activity of sweet potato samples was measured as free radical scavenging activity (DPPH and ABTS methods), as well as the ferric-reducing capacity by the FRAP method (
Table 2). The results of the DPPH, ABTS, and FRAP methods are expressed in the same units, that is, µmol of Trolox equivalent per 100 g of sweet potato DM.
Analysis of the antioxidant capacity of the sweet potato samples revealed that the addition of functional ingredients before drying had a significant (
p < 0.05) and positive effect on the ability to reduce free radicals in the tested samples (
Table 2). A positive correlation was observed between ABTS and the type of impregnating solution (r = 0.84) and dry matter (r = 0.60). FRAP was positively correlated with impregnating solution (r = 0.60) and index b* (r = 0.63), while DPPH was only positively correlated with index b* (r = 0.71).
For DPPH and FRAP analyses, the highest in vitro antioxidant activity was observed in the samples with onion (mean of 2357.94 and 2049.17 µmol Tx/100 g DM, respectively), whereas, in the ABTS method, the highest values were determined in the FD samples with the addition of onion and kale juices (1805.77 µmol Tx/100 g DM), respectively. The lowest results for DPPH and ABTS methods were obtained in samples dried without functional addition (mean of 242.87 and 708.76 µmol Tx/100 g DM, respectively), whereas, in the FRAP analysis, the lowest value was recorded in the VD sample with the addition of sodium chloride, −321.37 µmol Tx/100 g DM.
Drying sweet potato samples without the addition of functional ingredients and with the addition of NaCl resulted in a reduction in the antioxidant capacity of the samples. The most significant changes were observed with the FRAP method in samples with the addition of NaCl, regardless of the drying method (over 2.5-fold decrease in the ferric-reducing capacity in both cases).
A positive correlation was observed between the antioxidant capacity of the samples and the content of bioactive compounds (
Table 3).
Polyphenols have the highest ability to reduce free radicals. The correlation coefficient ranged between 0.77 for FRAP and 0.97 for the ABTS method. In the case of carotenoids, the highest correlation coefficient was noted with the ABTS method (R2 = 0.81), and the presence of chlorophyll was strongest in the ABTS method (R2 = 0.40).
Both flavonoids and carotenoids are known for their antioxidant properties [
42,
43]. Flavonoids have strong antioxidant properties because of the presence of many hydroxyl groups, and carotenoids due to the numerous double bonds present in the molecule. Compounds showing antioxidant and antimutagenic activities also include chlorophylls. These compounds, which belong to the chromoplastic pigments together with carotenoids, can prevent the development of degenerative diseases and cancer [
44].
The influence of different drying methods on the antioxidant capacity has been frequently described in the literature. Other research clearly shows that the drying technique plays a significant role on a higher and lower antioxidant capacity. The power to scavenge free radicals depends on the type of bioactive compounds, their concentration, and the drying technique used. Our results are in agreement with those of Nguyen et al. [
45], who analyzed the influence of different drying methods on the bioactive compound concentrations and antioxidant capacity of Phyllanthus amarus. The authors found a positive correlation coefficient with antioxidant capacity under DPPH, FRAP, and CUPRAC assays and that FD had a lower effect on the reduction in the polyphenolic content and the antioxidant capacity compared to samples under VD treatment. These results were also confirmed by Wojdyło et al. [
6].
3.3. Aroma Profiling
As presented in
Table 4, overall. 25 VOCs were found in the headspace of dried sweet potato, while 22 were successfully identified. For the fresh sweet potato, the highest contribution in VOC composition had phenylacetaldehyde, (
E)-2-octen-1-al, and benzaldehyde, with shares of 44.90%, 9.43%, and 8.18%, respectively. Further, of interest was the influence of kale addition to the raw material, which introduced into the dried material VOC profile compounds, such as hexanal, (
E)-2-hexenal, (
Z)-2-hexenal, (
Z)-3-hexen-1-ol, and hexan-1-ol. Unfortunately, the influence of onion addition to the raw material was not so clearly presented. This result was strongly confusing, especially in reference to the intensive onion aroma. Nevertheless, it is possible that the material (sweet potato) structure had strongly influenced the onion-originated VOCs, the contribution of which was totally decreased during drying procedures.
The most important was the influence of various drying techniques on the total VOC concentration. It was clearly presented that, in comparison to the fresh sample, all drying procedures had reduced the VOC concentration by at least 28.8%. The optimal method for preserving the VOCs content was FD with sodium chloride addition and FD with kale addition. The type of impregnating solution (
p = 0.735) did not have a significant influence on the tested parameter. Volatile compounds were only positively correlated with water activity (r = 0.73) and negatively correlated hardness (r = −0.68) and method (r = −61). Overall, the most destructive for VOC content in dried products were all the samples that were treated with VM drying. Those results correspond to numerous studies referring to drying technology, where FD is very often treated as the reference drying method [
1,
46]. In terms of the destructive influence of particular drying methods, it has been proven before that it is impossible to point out undoubtedly which drying method is the less optimal one [
47,
48]; it has always been dependent on the object of the study. In the case of sweet potato with kale, onion, or sodium chloride addition, it may be concluded that FD or VD should be applied; however, it has to be highlighted that onion addition has some unexpected influence on the VOC retention. This may be due to the difference in concentration between the impregnating solutions and the solids content of the onion, which makes it difficult to transport water. In dried sweet potatoes with the addition of onions, the lowest value of dry matter was observed, which affected the above studies.
3.4. Dry Matter and Water Activity
The parameters characterizing the stability of the dried material are dry matter and water activity, to which the color of the biological materials is related. Biological material is considered to be properly dried if the dry matter content is ≥88% [
49]. Low water activity (Aw) of <0.6 characterizes biological materials as resistant to biochemical and physical changes and microbial proliferation [
49]. In our study, Aw in the dried products ranged from 0.082 to 0.496, which ensures microbiological safety (
Table 5). In other studies, an Aw value of 0.2836 was found in lyophilizing C. alata [
50], and 0.184 for loquat fruit [
51].
In fresh sweet potatoes, the dry matter was 20.70%, and, after drying, it ranged from 94.93% to 98.29%, indicating that all samples were properly dried (
Table 5). Other researchers have reported a dry matter value of 6.17% for fresh zucchini [
13]. A significant effect of the drying method (
p < 0.05) on the dry matter and water activity values of the dried products was observed. Dry weight positively correlated with the impregnating solution (r = 0.60), water activity (r = 0.66), and ABTS (r = 0.60), and negatively correlated with the hardness (r = −0.62) and gumminess (r = −0.60). Higher values of dry matter and lower values of Aw were found in dried products subjected to sublimation drying. These results are consistent with previous observations of dried sweet potato slices [
5]. The use of vegetable juices as impregnating solutions resulted in higher dry matter values (
p < 0.05) in the samples before drying. This may be due to the presence of solid particles in freshly squeezed onion and kale juice, which hinder water transport. The type of impregnating liquid had no effect on the water activity value (
p >0.05). Water activity negatively correlated with the hardness (r = −0.80) and cohesiveness (r = −0.69), springiness (r = −0.65) and gumminess (r = −0.71), and VOCs (0.73). The results of dry matter and water activity were consistent with other studies in which kale leaves were dried using VI with NaCl and O+ NaCl; the dry matter values were lower for the solution containing fresh onion juice [
11].
3.5. Color
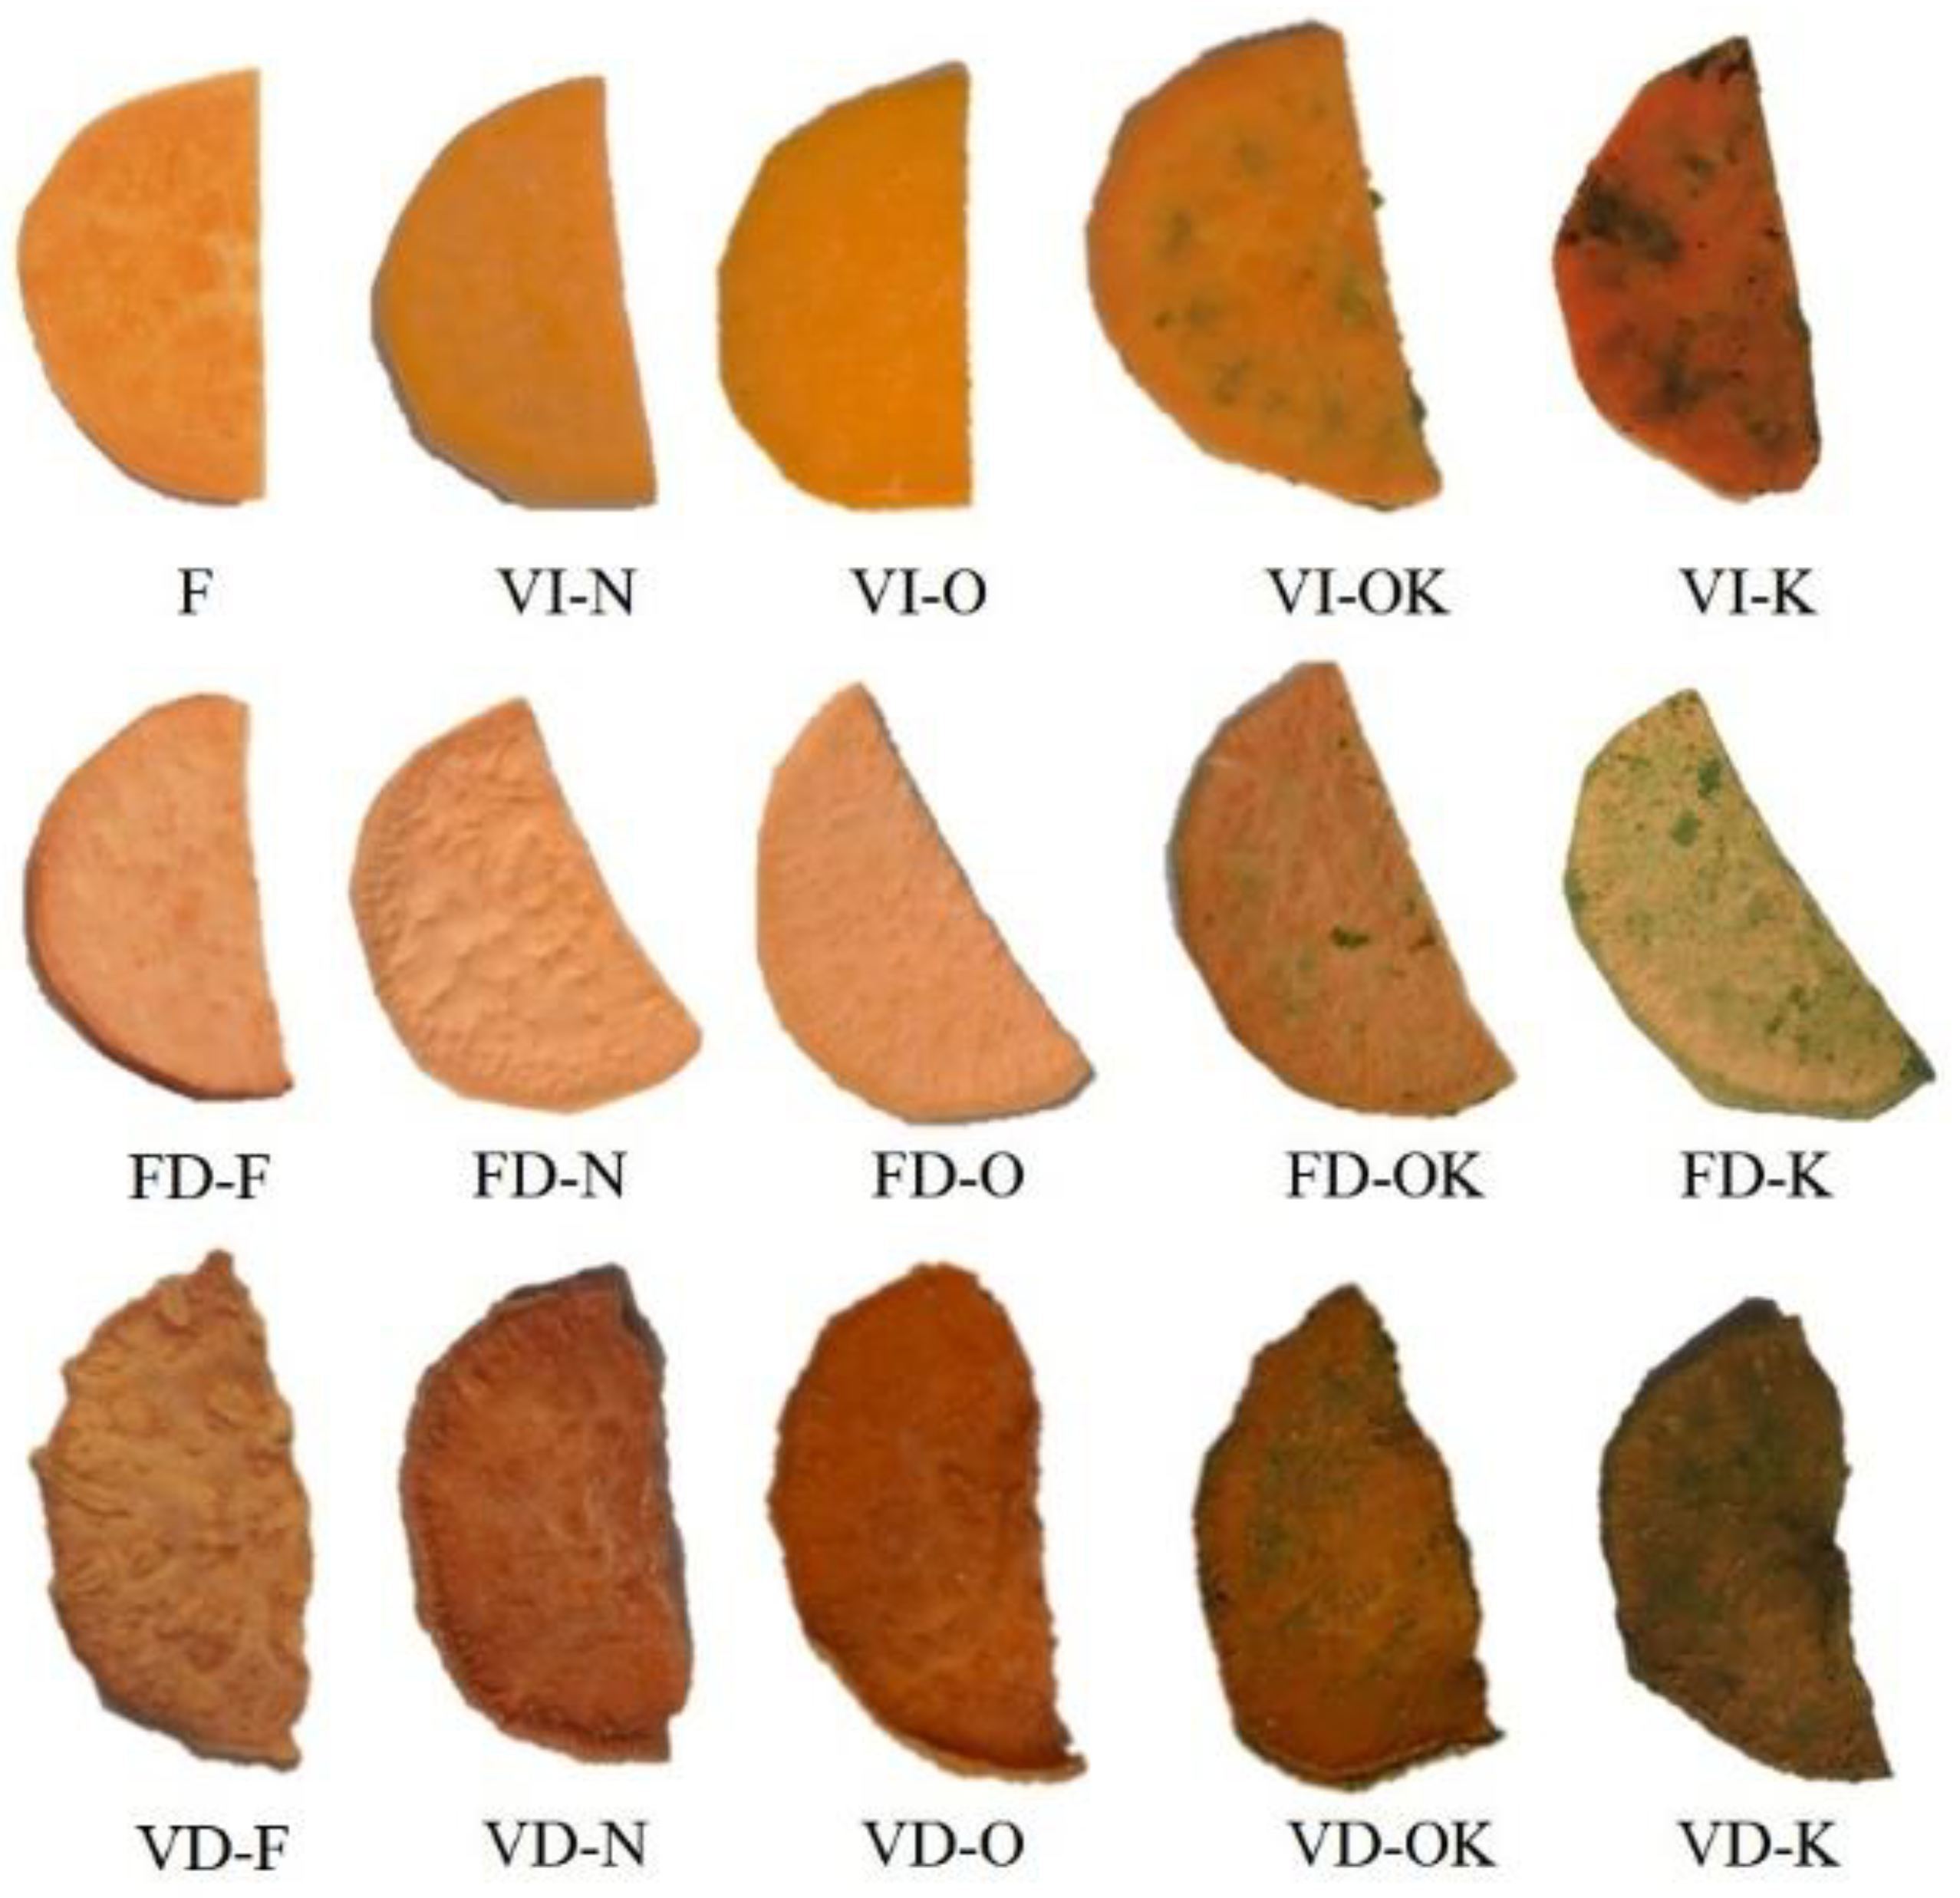
The obtained dried products were characterized by different brightness values from 40.01 to 81.02 (
Table 6). depending on the applied drying method and the impregnating solution (
Figure 1). The use of VI (
p < 0.05) resulted in a decrease in brightness in all samples tested compared to the control sample (F). The highest L* value was observed for untreated sweet potato (81.02), compared with 73.27 for fresh sweet potato. Other investigators have noted high L* values for fresh jujube compared to L* after drying [
6]. Fijałkowska, Nowacka, Wiktor, Śledź, and Witrowska-Rajchert [
52] observed higher L* values for apple slices after drying. VD resulted in browning of the sweet potato tested, and all samples were darker than the dried samples obtained by the FD method. Similar results were reported by Wojdylo et al. (2019). A significant effect of the drying method on the tested parameters was noted (
p < 0.05).
The drying process of products of plant origin is usually characterized by the degradation of pigment compounds, which results in higher values of parameters a* and b* (
Table 6). This relationship holds for sweet potatoes not subjected to VI and sweet potatoes impregnated with K (due to the dark color of kale juice). VI protected the color parameters of the other impregnation solutions.
Positive values were obtained for the color parameter a*, which indicated the red hue of the dried sweet potatoes. In the case of 2% sodium chloride solution and onion juice impregnating solutions, an increase in the values of the studied parameter was observed compared to the control sample, which may be related to the enzymatic browning reaction during pretreatment. Other authors have observed a similar relationship in fluidized bed drying of kale impregnated with onion juice + NaCl, and NaCl [
11]. Both the impregnating solution and the drying method had a significant effect on the values of the color parameters a* and b* (
p < 0.05). Higher a* and b* values were recorded for the sublimation-dried samples.
A significant effect of impregnating solution (
p < 0.05) and drying method (
p < 0.05) on color saturation (C*) was observed in the present study (
Table 5). The C* value increased for both drying methods with the following impregnating solutions: S, O, and OK, compared to the untreated control sample. Similar observations were noted by Dziki et al. [
28].
Based on the analysis of the change in the ΔE parameter, it was found that the change in color of all VI-treated materials differed significantly from that of fresh sweet potatoes. Similar observations have been noted in previous studies [
52].
The change in value of the ΔE parameter was smaller in the FD process compared with VD, which indicates better color retention during FD. Similar results were obtained in tests of drying methods on jujube color, in which the smallest color change for dried products was obtained with the FD method [
6]. In samples pretreated with onion juice (O) and 2% sodium chloride solution (N), the range of changes in ΔE values between the pre-drying and post-drying levels was smaller than that of the control sample (F). This finding indicates a protective effect of the impregnating solutions used on kale color during drying. Both the impregnating solution (
p < 0.05) and drying method (
p < 0.05) had a significant effect on the total color difference index.
The browning index corresponds to the quantification of the brown color resulting from the heat treatment. BI values in the range of 0.04–0.33 were recorded in the present study, indicating very low browning. Lower values of this parameter were recorded for the dried products obtained using the FD method. Other authors studying kale also recorded lower BI values for FD, with BI ranging from 43.30 to 66.83. This phenomenon appears to be related to the formation of pigmentation as a result of nonenzymatic and enzymatic reactions [
28].
3.6. Texture Profile Analysis
In
Table 7, we present the results of the texture profile analysis of dried sweet potatoes subjected to different impregnating solutions and drying methods. We identified significant differences in hardness between the impregnation solution and drying method (
p < 0.05). The hardness of fresh vegetables was higher than that of the dried sweet potatoes. Hardness, which is determined as the first peak force on the TPA curve, is defined as the force required to compress a substance between molar teeth [
29]. These results indicate tissue softening after drying. Higher hardness values of fresh fruits or vegetables than those of dried fruits were also observed for cape gooseberry [
53], pumpkin, and green bell pepper [
54]. Overall, the application of VI lowered the hardness depending on the drying method.
The dried samples (untreated and pretreated) presented higher cohesiveness and springiness values than did the fresh samples. The differences in values were not high, which means that fresh and dried sweet potatoes have similar strengths of internal bonding. Our results are in agreement with those reported by Junqueira et al. [
53] and Castillo-Gironés et al. [
55].
The drying and VI of sweet potatoes significantly reduced the gumminess, once again due to the intense decrease in hardness, as observed earlier (
p < 0.05). VI lowers the gumminess; therefore, for dried sweet potatoes, lower energy is required to disintegrate and chew the products to a ready state for swallowing. Similarly, lower gumminess in cape gooseberry subjected to freezing/thawing prior to drying was observed by Junqueira et al. [
53].
The softest samples and lower values of cohesiveness, springiness, and gumminess were obtained as a result of the FD process. This result is similar to that reported by Guiné and Barroca [
54] in the case of pumpkin processed with FD.
4. Conclusions
VI has a significant effect on the chemical, physical, and VOC composition characteristics of dried products. Dried products obtained by the FD method showed higher con-tents of polyphenols, carotenoids, chlorophyll, antioxidant capacity, and VOC composition, as well as the lowest values of hardness, cohesiveness, springiness, and gumminess.
The highest values of phenol content and antioxidant capacity were obtained for sweet potatoes impregnated with kale and onion juice compared to fresh sweet potatoes and after drying without VI. Higher values of polyphenols, carotenoids, and chlorophylls were obtained using the FD drying technique. The highest volatile compounds were identified in sweet potatoes impregnated with kale juice and 3% NaCl solution. Both drying methods reduced volatile compounds in all tested trials. Higher values of volatile com-pounds were observed in freeze-dried sweet potato than in vacuum-dried sweet potato. It was observed that, with the use of the N solution as the impregnating solution, the lowest values of dry matter were observed, and thus a higher value of volatile compounds present in the dried material was noted compared to the O impregnating solution, where the effect was inverse. The use of vacuum impregnation decreased the value of all the examined features: hardness, cohesiveness, springiness, and gumminess. However, the type of impregnating solution used did not have a significant effect on the parameters tested in the analysis of the texture profile.
Thus, the use of VI as a pretreatment contributed to the improvement in the proper-ties of dried sweet potatoes in all samples tested. Therefore, it is worth continuing this re-search by introducing variable impregnating solutions on the basis of vegetable juices and examining the influence of other drying techniques, i.e., convection and microwave drying, on the quality parameters of dried products. Increasing the chemical composition and bioactivity of sweet potatoes can positively affect their popularity and constitute a healthy snack. Thanks to these and subsequent studies, the market of healthy and functional vegetable snacks can develop.


 ,
, 


