Article

Farmer Decision-Making on the Concept of Coexistence: A Comparative Analysis between Organic and Biotech Farmers in the Philippines

by
Clarisse Mendoza Gonzalvo
1,*,
Wilson Jr. Florendo Aala
2 and
Keshav Lall Maharjan
1
1
Graduate School of Humanities and Social Sciences, Hiroshima University, 1-1-1 Kagamiyama, Higashi-Hiroshima City, Hiroshima 739-8524, Japan
2
Institute of Clinical Medicine, National Cheng Kung University, No. 1 University Road, Tainan 701, Taiwan
*
Author to whom correspondence should be addressed.
Agriculture 2021, 11(9), 857; https://doi.org/10.3390/agriculture11090857
Submission received: 5 July 2021 / Revised: 3 September 2021 / Accepted: 4 September 2021 / Published: 8 September 2021
(This article belongs to the Special Issue Agricultural Policy and Farmer Behavior)

Abstract

:
Farmer perspectives are relevant for understanding agricultural issues and formulating policies. In this study, we conducted a cross-sectional survey on 70 Filipino farmers (i.e., 35 organic and 35 biotech) to understand farmers’ perspectives regarding coexisting farming methods. Internal response variables were tested to verify the type of decision-making processes being undertaken by biotech and organic farmers. Our results showed that a non-linear decision-making process, similar to the Stimulus–Organism–Response Model, was present for both farmer groups. The study also found that biotech farmers were more influenced by internal factors (e.g., consumer resources) than organic farmers, who rely more on external influences (e.g., culture and social interactions), in connection to their coexistence perspective. The presence of “maverick executives” within the organic farmers gives traction to the notion that coexistence can help empower farmers in choosing what farming method is most suitable to their needs. Our data can also provide insights to policymakers in terms of surveying farmer perspectives to balance farmer needs, primarily in yield and income security, with the national agricultural agenda centered on environmental conservation. Thus, farmer perspectives should be considered alongside ongoing studies and debates on coexistence.

1. Introduction

The United Nations (UN) predicts that the global population will continue to increase to 9.7 billion by 2050 from 7.7 billion in 2019, which will pose many threats to sustainable development [1]. In addition to persistent problems associated with the booming population, the world is facing other simultaneous challenges related to climate change, land degradation, and food insecurity. Furthermore, the COVID-19 pandemic may add between 83 and 132 million more individuals to the total number of undernourished people worldwide, which is currently around 690 million or 8.9% of the global population [2]. Therefore, the agriculture sector must continuously come up with effective solutions to meet the world’s food needs, while considering other food-related problems, such as improper diet and food waste, which are more critical in developing countries where food production must be doubled to meet future food demands [3]. The coexistence of different production systems—such as organic, conventional, and genetically engineered (GE) or biotech crops—has been identified as a workable solution to support the agricultural sector in meeting the world’s food demands and addressing climate change challenges [4,5,6,7].
In the Philippines, different production systems, particularly organic farming and biotech farming, are viewed as separate systems and have been perceived as dichotomizing issues for many years. However, both technologies are highly supported in various regions of the country. The Philippines currently ranks 12th worldwide in the list of biotech mega-countries, with 0.9 million ha of biotech corn [8]. It was also the first country in Southeast Asia to adopt a biotech crop when biotech corn was approved for feed production and commercialization in 2002. Previous studies have demonstrated that resulting reductions in insecticide use have led to yield and income gains [9,10,11]. Meanwhile, as of 2019, there are 12,037 Filipino organic farmers planting in 168,352 ha of organic agricultural land [12]. In 2020, the Philippine Organic Agriculture Act of 2010 or Republic Act (RA) 10,068 was amended with RA 11511, which was recognized as a very significant milestone by organic agriculture organizations worldwide. The amendment officially recognizes the Participatory Guarantee System (PGS)—a locally focused quality assurance system for organic agriculture verification, together with third-party certification—which places the Philippines among the world’s leading countries implementing the PGS, with more than 15 years of PGS implementation history. It was also proven that organic farming has provided socio-economic, energy use, and environmental benefits to Filipino farmers [13].
While some facets of organic farming are ideal and have manifested positive contributions in addressing climate change challenges, the industry still has many limitations and remains impractical on a large-scale basis [14]. In line with this, the European Commission’s Farm to Fork (F2F) Strategy—which aims to increase EU’s organic agricultural land from 7.5% to at least 25% by 2030—may induce various unintended land-use implications, such as higher yield reductions, increased greenhouse gas emissions due to additional land conversions and organic manure applications, and threats to natural biodiversity as a result of increases in global land requirements [15]. However, biotechnological breeding innovations can complement classic breeding methods and supplement the limitations and challenges being faced by organic agriculture. When combined, modern biotechnology and organic farming can produce important synergies and help address Sustainable Development Goals 2 (Zero Hunger), 13 (Climate Action), and 15 (Life on Land). Coexistence can be taken as either spatial or temporal in nature. Spatial coexistence, or the contiguous planting of GE and non-GE crops, has been established in previous studies [16,17,18], such as by setting the buffer distance and scheduling the flowering time of crops. On the other hand, temporal coexistence, which is the type of coexistence referred to in this study, combines agricultural methods (e.g., biotech and organic farming).
Associated with the use of any technology is how people employ decision-making judgments, which are greatly rooted on how information is processed, learned, stored, and applied in social situations. This is encapsulated in the information processing theory, which highlights how humans can encode and retrieve information from the three facets of memory, namely sensory, working/short-term, and long-term [19]. The theory also explains how humans accept or reject new views, relative to their previous perspectives [20,21]. On the other hand, social cognitive theory considers the interaction of an individual’s cognitive, biological, and emotional determinants in connection with behavioral patterns and environmental events [22]. This theory also shows how humans adapt and change based on the prevailing social system. These theories, which focus on the internal and external aspects of decision-making, have served as foundations in analyzing farmer decision-making.
Numerous studies have explored and modeled farmer decision-making and factors affecting their decisions [23,24,25]. Some comparative studies have also been conducted in the context of farmer decision-making, comparing either internal or external concepts and events. In a study that compared decision-making between farmers in Thailand and Vietnam, it was found that livelihood platforms, weather shock expectation and experience, and physical–economic conditions of living localities determine farmers’ land-use decision-making [26]. In a similar study conducted in Switzerland and the United States, in relation to policy schemes, it was found that Swiss farmers rate ecological aspects higher than Illinois farmers, who assign more value to land use responsibility [27]. Another study compared the decision-making of cotton and vegetable farmers in Kenya and India and found that trained farmers exhibit more confidence in their decision-making and pest management strategies than untrained farmers [28]. Based on these previous studies, future decision-making studies should be considered and analyzed on a case-by-case basis, since each population exhibits inter- and intra-specific variation [29]. Furthermore, studies of decision-making remain complex undertakings since the process cannot be easily represented by linear flow charts with yes/no alternative routes [28]. Despite these difficulties, farmer decision-making remains a crucial aspect in understanding and developing agricultural policies and technologies.
While the merging of biotech and organic seeds is not yet viable due to its impacts on ecology and plant genetics, combining farming methods (temporal coexistence) has been mentioned in several studies on agricultural sustainability [6,15,30]. Furthermore, even if the applicability of coexistence has been broadly explored in previous studies [4,5,6,7], there has still been limited research focusing on farmer perspectives regarding this issue. However, since farmers are the future technology adopters/consumers, considering their perspectives is crucial in the diffusion of any kind of farming technology. Hence, farmer perspectives should be considered alongside current studies and debates on coexistence.
In this study, we hypothesized that farmers exhibit either a linear or non-linear decision-making process and may be affected by either internal or external factors. We, therefore, aimed to contribute to the understanding of farmer decision-making regarding coexistence and factors affecting their decision-making. In this study, farmers are treated as consumers/adopters, and the specific technologies considered are organic farming and biotech farming. Other studies may consider farmers as producers, but since the authors of this research aimed to determine farmers’ decision-making regarding technology adoption, decision-making models that focus on consumer behavior were selected. Lastly, the authors of this study did not measure actual behavior, instead focusing on analytical aspects, primarily the decision-making process of farmers.

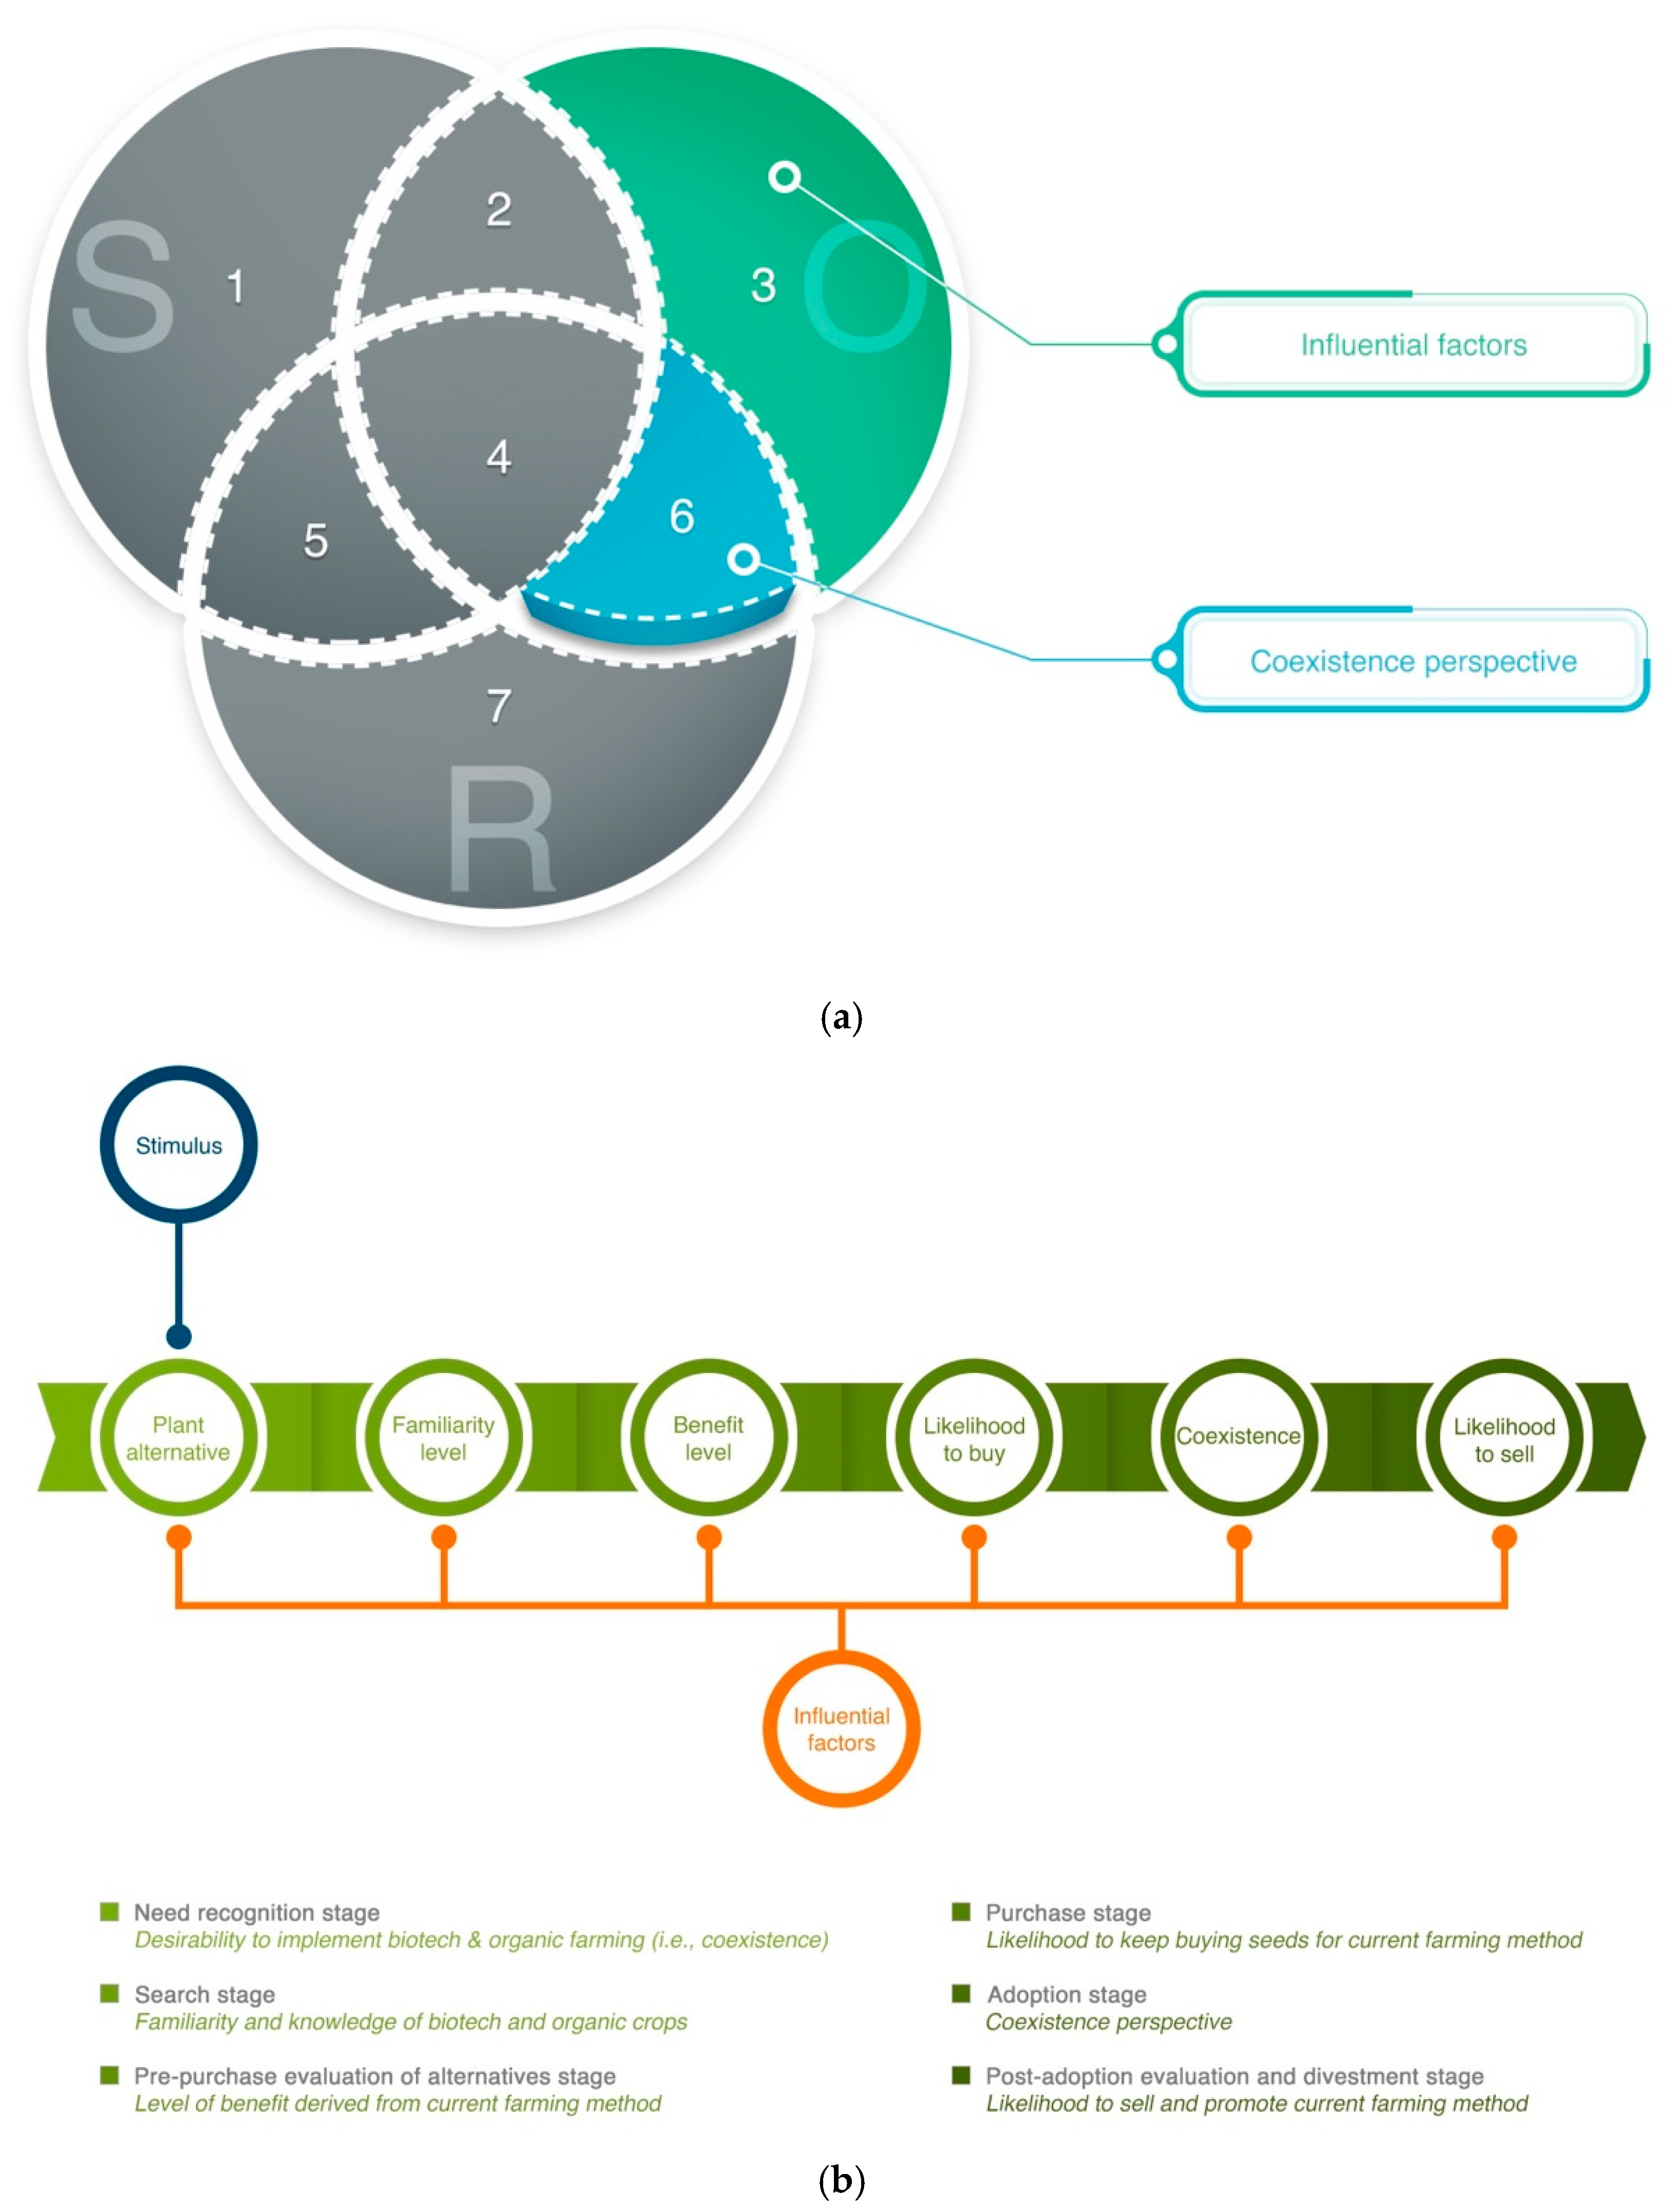
Theoretical Framework

In the study of decision-making, there are various cognitive models that can be used. These models can be classified as either analytical or prescriptive, with the former focusing more on key elements of decision-making and the latter focusing more on the behavioral aspect. The authors of this study concentrated on the analytical perspective and did not measure actual behavior. There are two common approaches in analyzing decision-making, which are linear and non-linear models. For the former, the Consumer Decision Model (CDM) is among the widely used and cited models [31]; for the latter, the Stimulus–Organism–Response (S–O–R) model is commonly used [32].
The CDM was first developed in 1968 and has undergone various revisions since then. The model assumes that when a consumer is exposed to a stimulus that is deemed relevant to his/her needs and wants, the decision-making process is activated. The CDM has a seven-point decision process, namely: (1) the need recognition stage, where a problem is recognized or a difference is seen between the alternative and actual state of an individual; (2) the search for information stage, where a person seeks relevant information for solutions to the problem, whether internally or externally; (3) the pre-purchase evaluation of alternatives, where a person weighs and judges the two states being compared using his/her own evaluative criteria; (4) purchase and (5) consumption/adoption, where a person chooses which state to adhere to; (6) post-consumption/adoption evaluation, where a consumer decides if he/she is satisfied with the chosen state; and (7) divestment, where a person can choose to dispose, recycle, or remarket the chosen state. The model assumes that each stage is influenced by individual differences and environmental influences.
The developers of the CDM stated that the model replicates the phenomena it is designed to present and that it shows the interrelationship of building blocks (variables) of the decision-making process [33]. One of the model’s key strengths is its evolutionary development through the years, which has improved its explanatory power while incorporating updates in the field of decision-making. The model also provides a clear depiction of the decision process, making it easy to apply in decision-making studies [34]. On the other hand, major critiques of the model are in its linearity and mechanistic perspective, which makes it difficult to incorporate the complexity of consumer decision situations [35]. The vagueness of the model’s environmental and individual variables makes it difficult to explain and quantify their effects on the decision-making stages [36]. Lastly, the model has been criticized for its inability to explain non-conscious behaviors that may not be well-modeled using a rational information processing approach [37,38]. Hence, other decision-making models are depicted in a circular fashion, such as the Wheel of Consumer Analysis and the revised S–O–R Model, which is another analytical model that can guide decision-making analysis [32,35].
The S–O–R model shows a temporally bound, non-linear decision-making process [32] through three overlapping Venn diagrams, which are divided into three main sectors (S–O–R). First is the Stimulus sector, where Sector 1 (Encountered Environment) is located, comprising all the stimuli that people are exposed to (e.g., ads, logos, products, and word-of-mouth communication). Next is the Organism sector, where Sector 3 (Experiential Storehouse) or memory is located, comprising all the influential factors affecting an individual’s decision-making; this is generally referred to as “long-term memory” since it contains all the emotive and cognitive systems of an individual (e.g., knowledge, beliefs, values, and motives). In between Sectors 1 and 3 is Sector 2 (Automatic Processing), where the subconscious processing of information takes place (as research has shown that mere exposure to stimulus sometimes lead to subconscious processing) [39]. This is also where implicit learning or “learning without awareness” takes place. In the middle part of the Venn diagram is Sector 4 (Consciousness), where the conscious processing of information or the “awareness of being aware” occurs [40]. Next is the Response sector, where Sector 7 (External Responses) is located, encompassing all externally detectable responses of an individual (e.g., pupil dilations, smiling, and usage of a product or idea). In the middle of Sectors 3 and 7 is Sector 6 (Internal Responses), which comprises outcomes of Sector 4 that are not directly visible to an outsider. This sector contains an individual’s changes in beliefs, judgments (e.g., on risk or quality of products), learning, intentions, satisfaction, etc. The outputs of Sector 6 often shift towards Sector 3, thereby adding up to an individual’s long-term memory [32]. Lastly, in the middle of Sectors 1 and 7 is Sector 5 (Nontrace Stimulus–Response Events), which explains an individual’s reflex behavior or any kind of behavior that does not leave a psychological trace of occurrence (e.g., loosening one’s tie when it is hot).
In contrast to linear decision-making models, circular or non-linear models can be more applied to complex decision-making studies because they are not strictly bound to follow linear paths and can account for temporal dimensions. They also provide more coherent ways of looking at internal response variables, especially when non-linear decision-making is detected. In this study, the S–O–R Model aided in concentrating on the main internal response variable being analyzed, which was the coexistence perspective of farmers. Therefore, all influential factors fall under Sector 3, and the coexistence perspective can be classified under Sector 6 (Figure 1a). Furthermore, since internal response variables in the S–O–R Model can also be taken as the stages of the CDM, we contextualized these decision-making stages as farmer-specific internal response variables (Figure 1b).

2. Materials and Methods

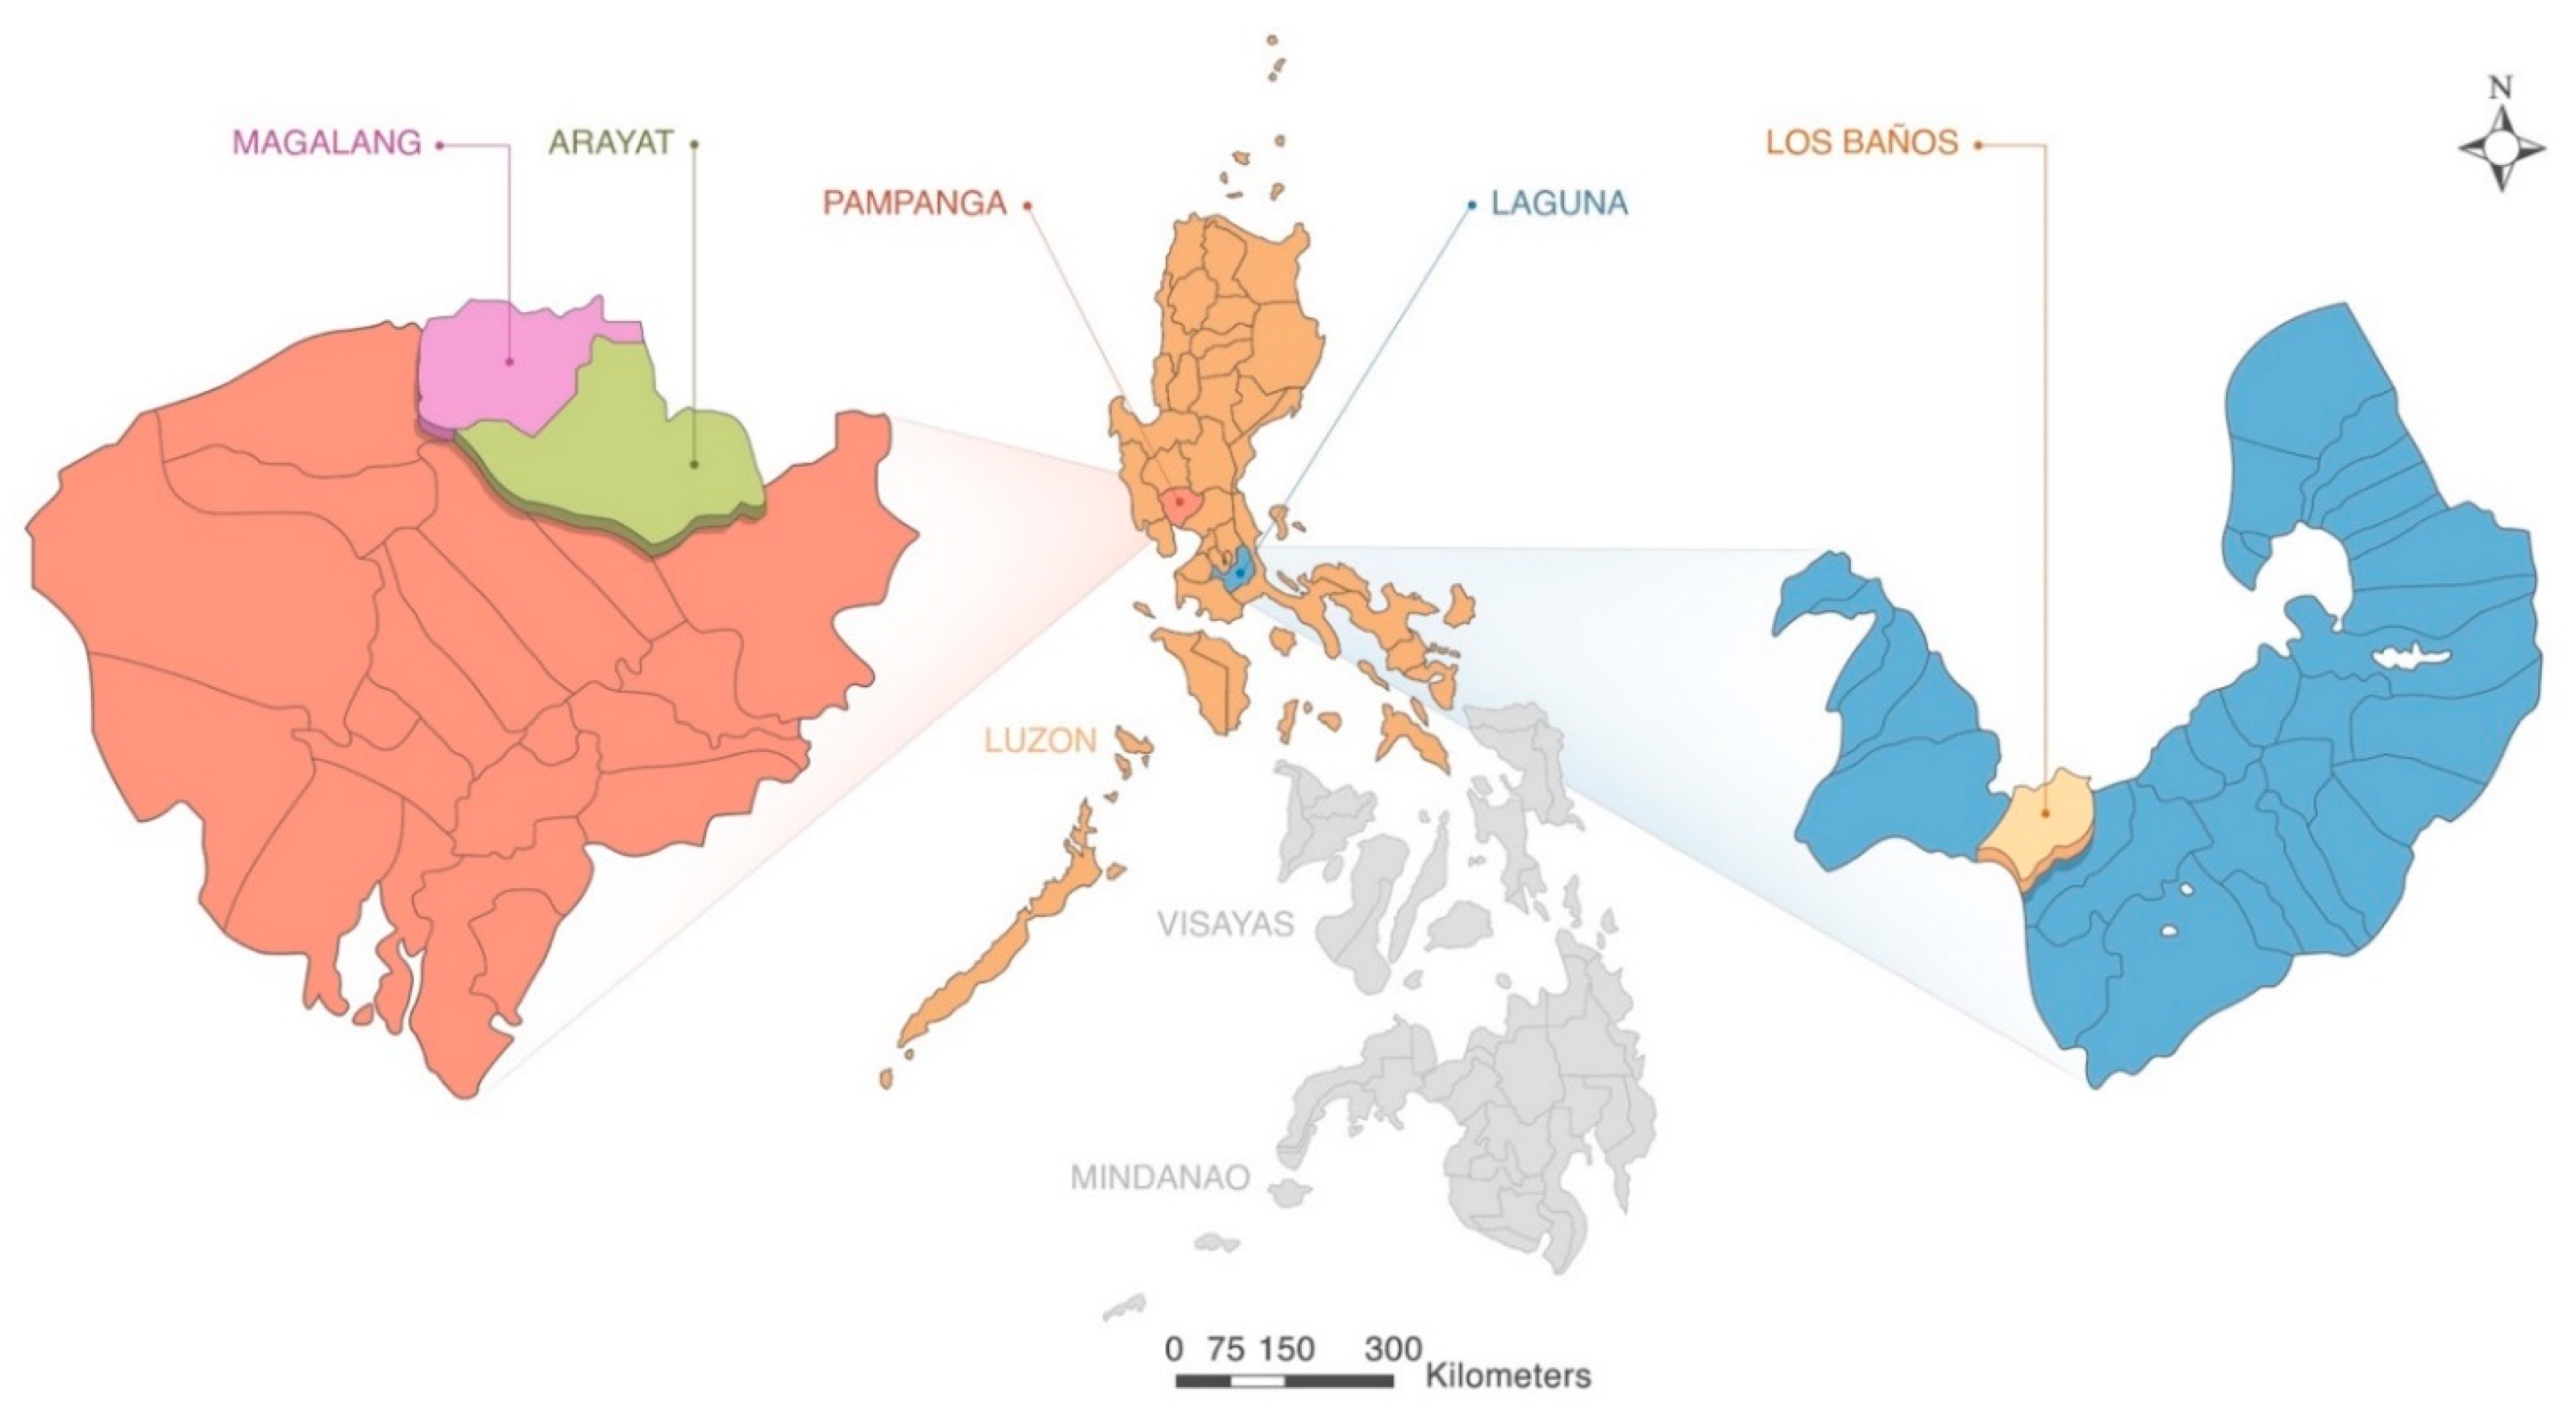
2.1. Research Design and Sampling Sites

The biotech and organic farmers’ coexistence perspectives and factors affecting their decision-making were determined by employing a cross-sectional survey. Respondent-driven sampling—a specialized form of snowball sampling—was used to track down and interview a total of 70 farmers (i.e., 35 biotech and 35 organic).
The study was conducted in two provinces of Luzon Island, Philippines—particularly the province of Pampanga, where biotech farming was first introduced in 2003, and the province of Laguna, where organic farming has been highly supported for several decades (Figure 2). Pampanga is a first class, highly urbanized city that is located in the Central Luzon region. This province is divided into two cities comprising 19 municipalities and 505 barangays. As of 2018, the province had a rural population of 875,943 and a total farmland area of 64,959 ha [41]. Most lowland areas in Pampanga are devoted to rice, with corn being the second major crop during the dry season. The Office of the Provincial Agriculturist (OPAG) stated that two of the top biotech corn-producing municipalities in the province are Arayat and Magalang; hence, these two municipalities were chosen as the sampling sites for biotech farmers in this study. On the other hand, the province of Laguna is located in the Calabarzon region and comprises six cities, 24 municipalities, and 681 barangays. As of 2018, it had a rural population of 751,470 and a total farmland area of 62,555 ha, with rice and corn as the top agricultural crops [42]. The municipality of Los Baños highly supports organic farming, and some farmers in this study reported that they had already been adopting organic farming for more than three decades. Top international institutions focusing on agricultural research are also located in Los Baños, such as the University of the Philippines Los Baños (UPLB), which recently launched an organic agriculture facility called The Organic Agriculture Research, Development, and Extension Center (OARDEC). The government and agricultural institutions in this municipality are working together to support organic farmers in the area via the provision of seeds and free agricultural seminars, among other methods. For these reasons, Los Baños was chosen as the sampling site for organic farmers in the study.
A standardized questionnaire was administered through face-to-face interviews to elicit and capture the answers and explanations of the farmers. All the respondents gave their informed consent to participate in the study, and the survey was done in accordance with the rules of the Research Ethics Committee of Hiroshima University. The selected internal response variables were framed as successive questions to mimic the CDM process. Influential factors, socio-demographic measures, and farm-related characteristics were also gathered. Each of the internal response variables had a corresponding rating scale to measure farmers’ response, while the coexistence perspective was in binary form (i.e., 0 = coexistence is not possible and 1 = coexistence is possible). In terms of the influential factors, the farmers were asked how influential each variable was to their industrial practice. Each farmer ranked the influential factors on a 5-point rating scale (i.e., 1 = not at all influential, 2 = slightly influential, 3 = somewhat influential, 4 = very influential, and 5 = extremely influential). Accompanying explanations were requested for all given answers and were utilized for subsequent thematic analyses.

2.2. Testing Decision-Making Models to Understand Farmers’ Perspectives on Coexistence

To determine whether a linear (CDM) or circular (S–O–R Model) approach is appropriate in understanding how farmers undergo decision-making when considering coexistence and factors affecting it, the internal response variables were contextualized into the stages of the CDM (Table 1). A directed acyclic graph analysis (DAG) using a chi-square test in SPSS v.27 (IBM, NY, USA) was then employed to verify the relationship between connected CDM stages. We further tested this approach on a larger dataset of biotech corn farmers from Gonzalvo et al. (2020) [23], who utilized the CDM as their main conceptual framework.

2.3. Inferential Analyses

Differences between biotech and organic farmers were determined using the Mann–Whitney U test for continuous socio-demographic and farm-related variables, and Jonckheere–Terpstra Test for Ordered Alternatives for categorical variables (i.e., influential factors and internal response variables). The effects of influential factors were determined using stepwise regression in SPSS v.27. Model fit, collinearity diagnostics, and R2 values for regression models were also obtained using SPSS v.27.

3. Results

3.1. Internal Response Variables of Biotech and Organic Farmers

In terms of each group’s internal responses, both groups exhibited positive desirability to implement biotech and organic farming (i.e., coexistence) (Table 2). A difference could be seen in terms of the familiarity and knowledge of biotech and organic crops, where biotech farmers answered with higher familiarity. High positive attributions were also given to benefit level and likelihood to buy seeds based on current farming method. These similarities in distribution show a similar pattern of decision-making in the context of their current farming methods. However, a difference was seen regarding the main internal response variable coexistence perspective, as almost all organic farmers (88.6%) but only about two-thirds of biotech farmers (62.9%) answered that coexistence is possible. A similar pattern in distributions was also observed for farmers’ likelihood to sell and promote current farming method, as most of both groups gave highly positive responses.

3.2. Inferential Analysis for Group Comparison

To determine the feasibility of coexistence between biotech and organic farming, differences between socio-demographic measures and farm-related characteristics of biotech and organic farmers were obtained (Supplemental Table S1) and compared using the Mann–Whitney U Test (Table 3). Significant differences (p < 0.01) were detected between groups for land area allotted for current farming method, estimated expenses, and profit, such that the mean rank values were higher for biotech farmers than for organic farmers regarding these three variables.
In addition to socio-demographic and farm-related characteristics, differences in farmers’ internal response variables and influential factors (internal and external) were detected using the Jonckheere–Terpstra Test for Ordered Alternatives (Table 4). In terms of the internal response variables for each group, significant differences were detected for the familiarity and knowledge of biotech and organic crops, coexistence perspective, and likelihood to sell and promote current farming method. For the familiarity and knowledge of biotech and organic crops, a higher median was observed for biotech farmers (4), relative to organic farmers (3), with the latter exhibiting a wider dispersion of answers from 1 to 5. Between-group response for the coexistence perspective was also found to be significantly different, as 89% and 63% of organic and biotech farmers, respectively, gave positive responses. At the last stage (likelihood to sell and promote current farming method), a higher median value was observed for biotech farmers (5) relative to organic farmers (4), although the latter had less diversity in terms of range.
Significant differences were also observed for influential factors, namely attitude towards health effects and acceptability in barangay. The same median value was detected for attitude towards health effects (4) for both groups, with the organic farmer group having a positive skewness. Meanwhile, in terms of response to acceptability in barangay, the biotech farmer group exhibited a positive skewness ( x ~ = 4 ) relative to the organic farmer group.

3.3. Directed Acyclic Graph (DAG) Analysis

The stepwise order of the stages in the canonical Consumer Decision Model [31] assumes an accumulative linear path from the stimulus that leads to the post-adoption evaluation and divestment stages (Figure 3a). To test whether this canonical causal path exists in our current dataset, a chi-square-aided directed acyclic graph analysis was carried out in DAGitty [43] (Supplemental Table S2).
For the biotech farmer group, only the level of benefit derived from current farming method and likelihood to buy seeds based on current farming method were found to have a significant relationship (Figure 3b). The organic farmer group, similar with the biotech farmer group, did not show significant relationships between any linked pairs of decision-making stages (Figure 3c).
To verify whether this lack of linear relationship between connected stages in the Consumer Decision Model—revealed using the DAG analysis—was robust and representative of the group to which the farmers belonged, the same analysis was done using a previously collected dataset from 111 biotech corn farmers sampled within similar sampling sites as the current study [23]. Results from this reanalysis revealed that there was no significant relationship at the initial stages of the model from the need recognition stage up to pre-purchase evaluation of alternatives stage, showing similar profiles to that shown in Figure 3b, although significant relationships were detected at later stages, namely between the pre-purchase evaluation of alternatives and purchase stages, between the purchase and adoption stages, and between the adoption and post-adoption evaluation and divestment stages. This reanalysis indicates that our representative sample was sufficient to capture underlying relationships between internal response variables. A previous dataset for organic farmers studied in the same context that could be used as a test dataset was not readily available.

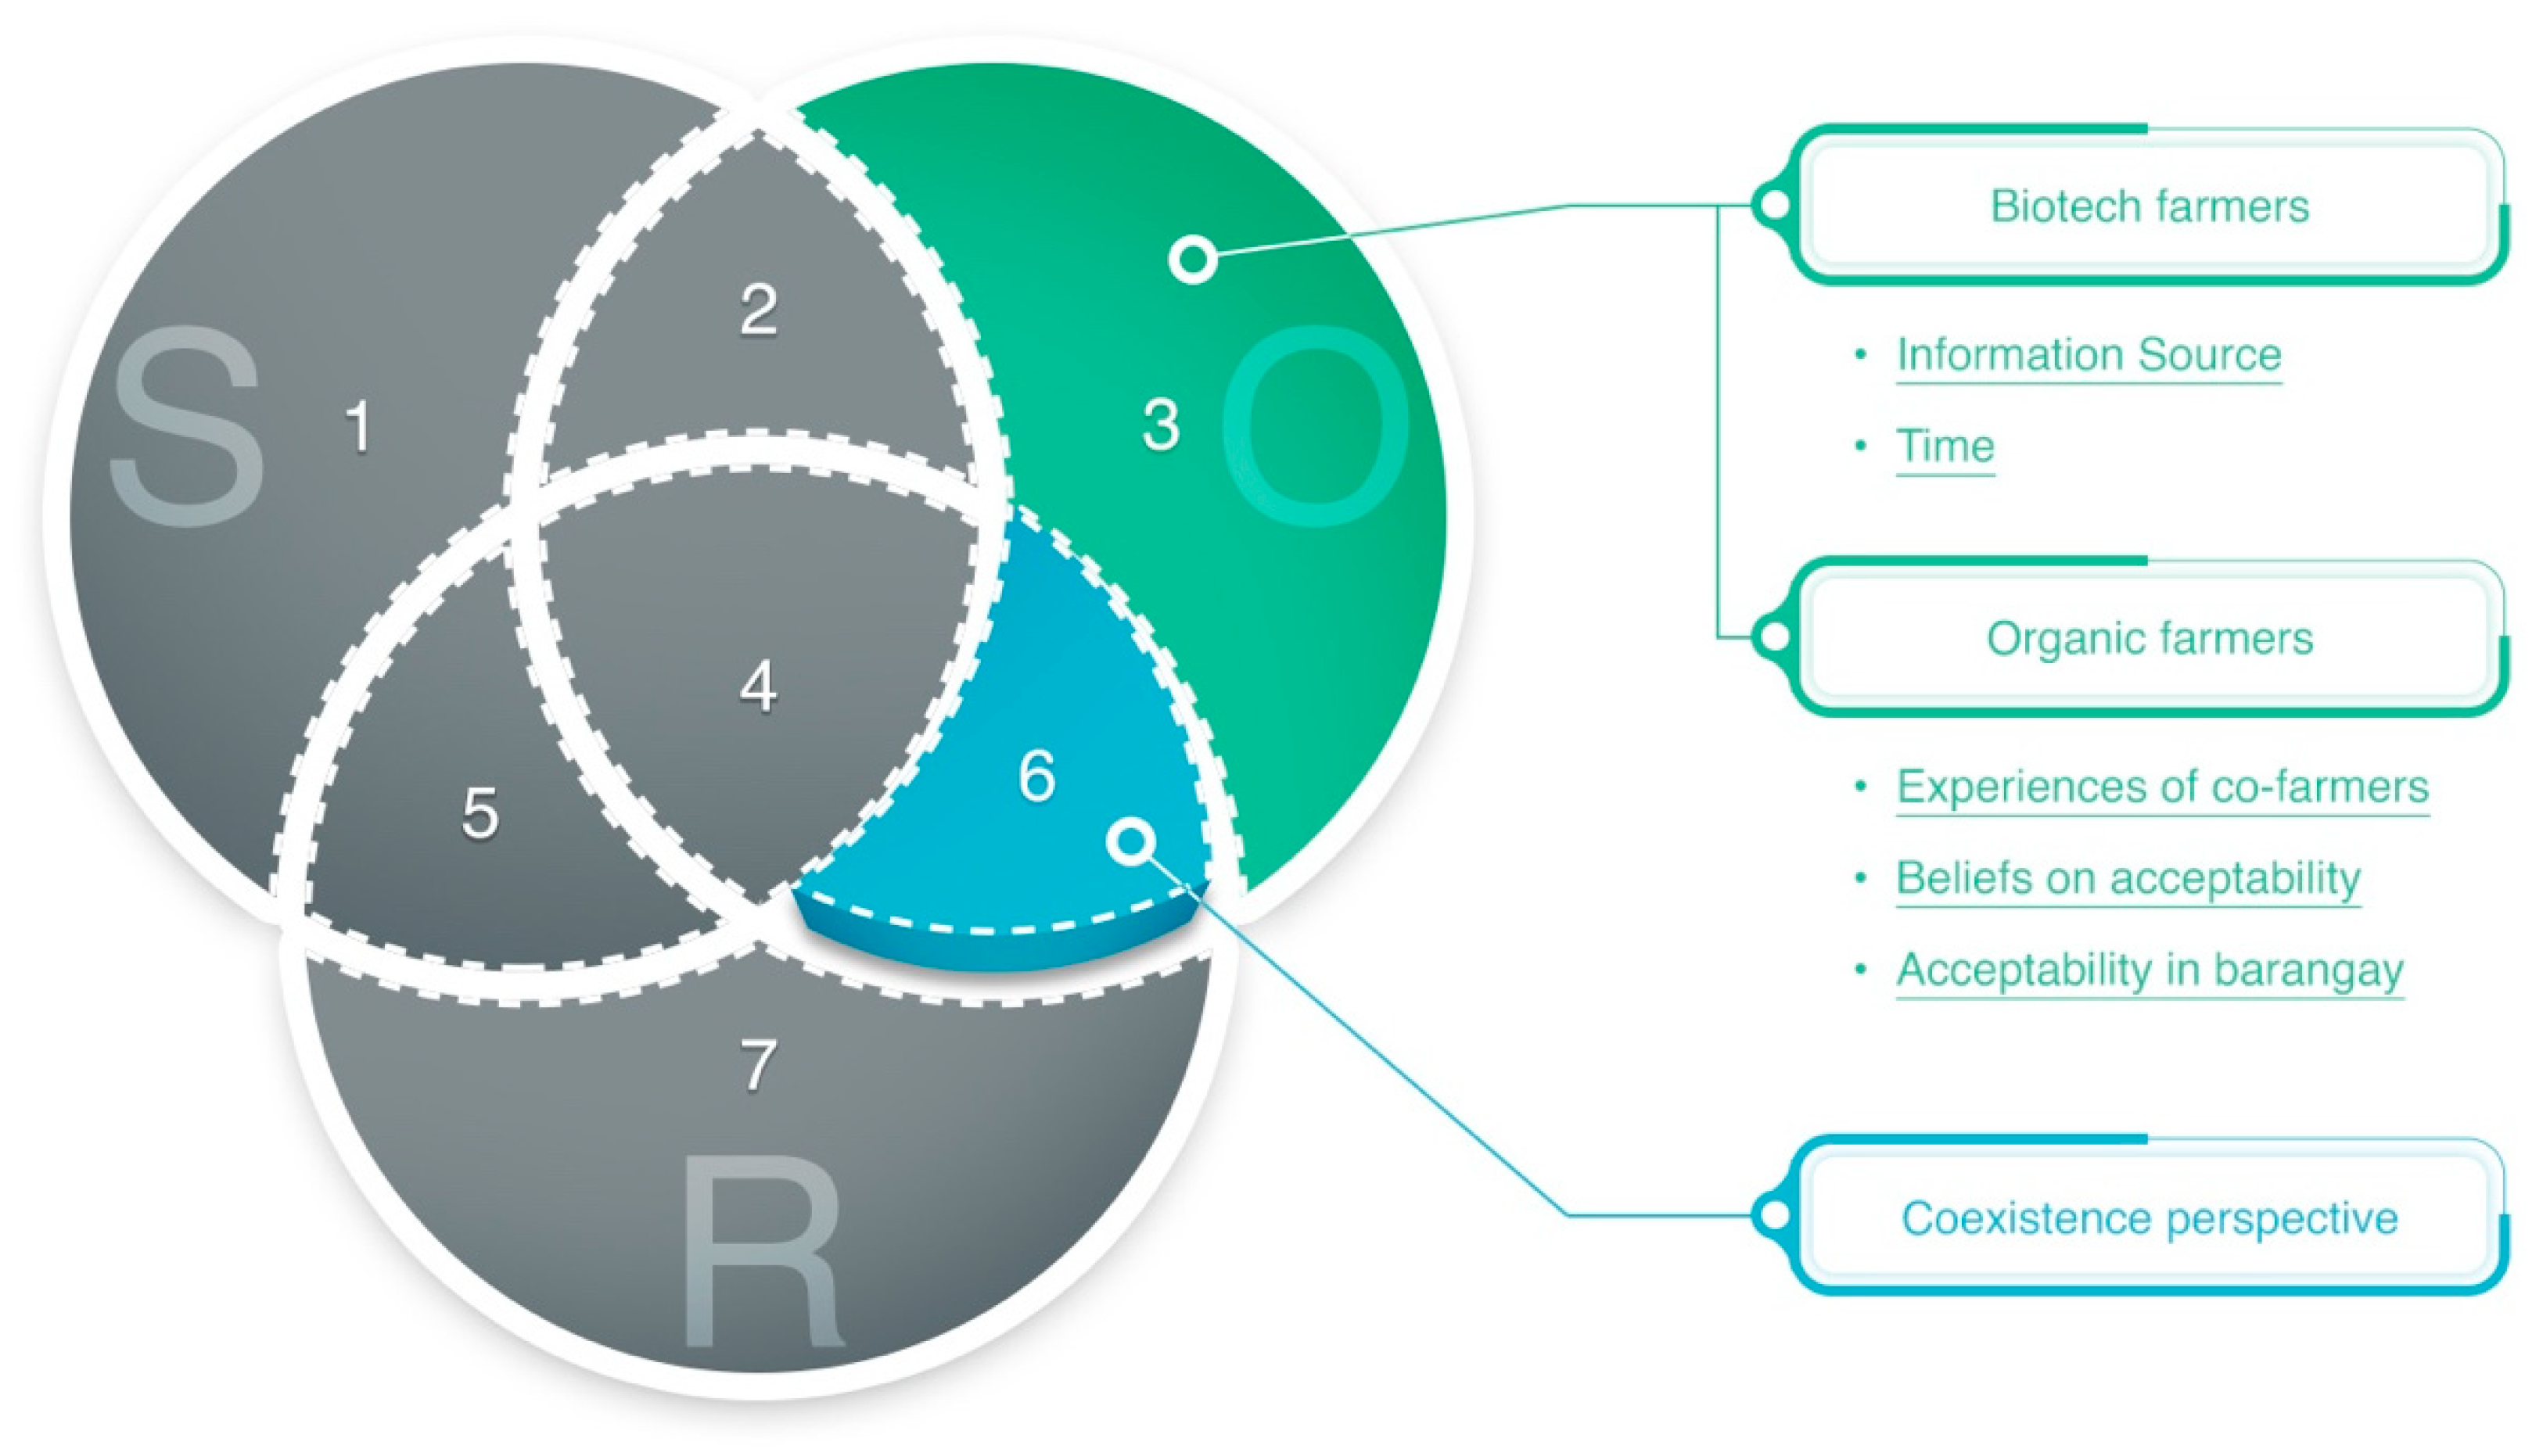
3.4. Effect of Influential Factors on Coexistence Perspective

The effect of specific influential factors on the biotech and organic farmers’ coexistence perspective was next determined using stepwise regression (Table 5). Here, sources of information and time were found to have contrasting effects on the coexistence perspective of biotech farmers. Specifically, sources of information were found to have an enhancing effect, with a regression coefficient of 0.221 (CI: 0.097, 0.344), whereas the increasing influence of time was found to have a negative effect, with a regression coefficient of −0.184 (CI: −0.314, −0.054) (Figure 4).
Within organic farmers, acceptability in barangay, experiences of co-farmers, and beliefs on acceptability (arranged in decreasing R2 values) were found to significantly affect the coexistence perspective. Though the experiences of co-farmers were found to enhance their coexistence perspective, with a regression coefficient of 0.129 (CI: 0.036, 0.221), beliefs on acceptability and acceptability in barangay were found to have negative effects, with regression coefficients of −0.121 (CI: −0.240, −0.002) and −0.135 (CI: −0.230, −0.041), respectively (Figure 4).

4. Discussion

Agricultural coexistence in the current generation can be interpreted as either spatial or temporal coexistence. The former describes how farms with biotech crops should be designed to coexist with neighboring non-biotech farms, while the latter describes the fusion of agricultural farming methodologies (e.g., using organic farming methods on biotech crops and vice versa). In the 2015 USDA Coexistence Factsheet, five production methodologies were clearly defined, namely certified organic, conventional, biotechnology, identity preservation, and specialty crops [44]. Though it was clearly highlighted in that document that previous studies showed no fundamental differences in terms of animal safety, human safety, and nutritional content between these production methodologies, they are taken as discrete entities and are not allowed to mix with each other. This is particularly evident for certified organic farms, which are required to meet stringent product specifications that have barred the use of biotech crops. Though this may seem logical, it has led to contradictions with production goals—especially in developing countries where annual production usually fails to meet domestic demands, thus leading to a heavy reliance on importation.
In discussions involving temporal agricultural coexistence, the voice of the actual stakeholders who are central to the entire sustainable production movement are scarcely heard or utilized in policy framing. In the Philippines, even though organic and biotech farming are highly supported, both are perceived as polarizing issues and discrete farming methods; hence, the authors of this study gathered information to understand the decision-making processes of organic and biotech farmers regarding the concept of coexistence, as well as to investigate which internal and external influential factors have the most effect on their coexistence perspectives.
Using the organic and biotech farmers’ socio-demographic and farm-related information, we found no significant differences between groups in terms of age, family size, and number of years farming; this was expected because representative samples were obtained from communities where farming is the main livelihood. Meanwhile, biotech farmers were found to have significantly higher profits and estimated expenses than organic farmers. The uncertainty of where to sell their organic products and the inefficiency of organic pesticides/herbicides were the main difficulties reported by the organic farmers affecting their profit. On the other hand, the existence of traders within the biotech corn farming community—who loan capital; supply biotech seeds, fertilizers, pesticides, and other necessary inputs, and eventually serve as harvest buyers—is the main reason reported by biotech farmers for their high estimated expenses. However, since the farmers can stock seeds until selling price becomes favorable, their profit is secured.
Each groups’ score on internal response variables (i.e., desirability to implement biotech and organic farming (coexistence), familiarity and knowledge of biotech and organic crops, level of benefit derived from current farming method, likelihood to buy seeds based on current farming method, coexistence perspective, and likelihood to sell and promote current farming method) were also compared to gain understanding regarding how each group internally processes their decision-making. Interestingly, it was shown that there was no significant difference in terms of both groups’ responses regarding their desirability to implement biotech and organic farming (i.e., coexistence). The choice of farming inputs is left for biotech farmers to make [44], so alternative farming methods (e.g., by using organic inputs) may have been perceived as a risk-free suggestion, as clearly seen in the testimonial of Respondent 12: “I know of some farmers here who are storing fecal matter and using it as fertilizer. This is rare nowadays”. For organic farmers, however, the use of biotech crops is tantamount to being denied their certified organic label. In addition, the sampled organic farmers are continuous adopters [45] of organic farming, primarily due to the implementation of Republic Act 10068 [46]. Roughly 83% (29/35) of the organic farmers found it desirable to use biotech seeds. This internal response can be interpreted that of “maverick executives” (described in Ray et al. (1996), or innovators among their own group [47]. Furthermore, the work of Ram and Jung (1991) states that such individuals who pursue product trial and repetitive use significantly reduce innovation resistance and allow for a positive post-adoption evaluation (satisfaction and attitude) within their group [48]. Organic farmers are aware that their yield is comparatively low compared to biotech farmers [49,50], and based on their narratives, they are interested in adopting biotech crops due to stable yields and resistance to pest and diseases. This was highlighted in testimonials by interviewed organic farmers such as by Respondent 38, who stated, “I want to test it. Because there are seasons when our crops get diseases”; Respondent 68, who stated, “I want my crops to be disease resistant. I am also interested about biotech crops’ insect and herbicide tolerance”; Respondent 39, who stated, “Since I want my crops to have good yield, I think biotech crops are worth trying.” This was also supported by the findings that profit and organic farmers’ attitudes and opinions towards their farming method have a significant positive relationship (Supplemental Tables S3–S6).
Gonzalvo et al. (2020) showed that biotech corn farmers perceive themselves as highly familiar with their crop choice based on the high influence of knowledge factors in their adoption decision [23]. A similar result was also observed in this study, as shown by the significantly higher median value of familiarity and knowledge of biotech and organic crops among biotech farmers relative to organic farmers. Some biotech farmers mentioned that they have previously experimented using different farm inputs such as organic fertilizers and pesticides. On the other hand, since organic farming methods are mainly obtained from the training offered by barangays or municipalities that are implementing Republic Act 10068, information regarding biotech crops may not have been conveyed to the interviewed organic farmers.
In terms of the coexistence perspective, more organic farmers (89%; 31/35) were found to have a positive view than biotech farmers (63%; 22/35), which further supports the presence of maverick executive-like individuals within organic farmers. Most testimonials indicated a perceived harmony between organic and biotech farming when asked about coexistence, e.g., Respondent 60 (organic farmer), who stated, “That is what I want to happen. Since the biotech crop is already good, using organic farming will further improve this”; Respondent 45 (organic farmer), who stated, “When you combine these two, then the harvest will be even better. In organic farming, the fertilizer is good, and in biotech farming, the crops are insect and disease resistant”; and Respondent 3 (biotech farmer), who stated, “If we use biotech corn and apply organic farming, it means it would be more environmentally safe. I think organic farming can meet the requirements of biotech corn planting.”
If the linear path of the canonical Consumer Decision Model [31] was presumed to hold true for both groups, then this pattern for the coexistence perspective could mainly be attributed to the cumulative responses of each group from the desirability to implement biotech and organic farming (coexistence), familiarity and knowledge of biotech and organic crops, level of benefit derived from current farming method, and likelihood to buy seeds based on current farming method, as shown in Figure 3. To test this, each pair of internal response variables that were directly connected in the CDM was checked for independence using the chi-square test of independence. As shown in Figure 3b,c, no relationship was established for all pairs of internal response variables for organic farmers, and only one pair—level of benefit derived from current farming method and likelihood to buy seeds based on current farming method—was found to be dependent on each other for the biotech farmers. This means that these internal response variables may be behaving as discrete packets that may be influenced by either internal or external factors (as shown in the S–O–R Model) rather than as stepwise or progressive stages [32]. This model was, therefore, used to guide the identification of key factors affecting the coexistence perspective among farmers.
Using 23 influential factors to model the coexistence perspective of biotech and organic farmers led to a set of predictors emerging for each group. Among biotech farmers, time and sources of information act in opposing directions relative to their coexistence perspective. The concept of time was found to be different among organic and biotech farmers. Most, if not all, of the biotech farmers that were interviewed stated that they value the decreased labor time necessary to take care of their biotech crops due to decreased pesticide use [51]. Meanwhile, for organic farmers, the amount of work and time they put in making organic inputs directly translates to a sense of achievement and pride through the stimulation of learning and the open exchange of experiences [52,53,54]. Thus, the negative effect of increasing influence from time towards biotech farmers’ coexistence perspective may be attributed to the potential increase in labor time necessary to generate organic inputs. This was confirmed by testimonials such as those of Respondent 4, who stated, “If organic farming is used, then our yield will be low and field labor might be increased”, and Respondent 30, who stated, “I don’t like to do the nuances of organic farming”. Gonzalvo et al. (2020) showed that information and knowledge play key roles in the adoption decision of biotech corn farmers [23]. This trend also emerged in this study, which revealed that increasing influences from sources of information also increase the biotech farmers’ coexistence perspective. In the multiple answer component of the questionnaire, the farmers were asked to identify which sources of information are available to them. This revealed that ~91% (32/35) of the biotech farmers relied on agricultural technicians as their main source of information. This may thus serve as a viable entry point for the introduction of coexistence among biotech farmers.
Within the organic farmer group, it was shown that acceptability in barangay had the highest R2 value, explaining roughly 35.6% of the variability in their coexistence perspective responses. Increasing influence from acceptability in barangay was found to decrease the coexistence perspective score of organic farmers. Indeed, due to the implementation of Republic Act 10068, farmers are not allowed to utilize biotech seeds, as this would mean the cessation of the provision of free organic fertilizer bags by the barangay/municipality. Stemming from a similar explanation, beliefs on acceptability were also found to negatively affect the coexistence perspective score of organic farmers. Roughly 77% (27/35) of the organic farmers reported relying on agricultural technicians for information regarding proper farming techniques and organic input production. Since these agricultural technicians follow Republic Act 10068, biotech crops may not have been mentioned in trainings and instruction materials. Opposing the effects of both acceptability in barangay and beliefs on acceptability, experiences of co-farmers were found to enhance the coexistence perspective score of organic farmers. Social ties have been proven to be crucial in agricultural knowledge exchange [55]. In Enugu State, Nigeria, co-farmers were noted to be one of the major sources of information among farmers [56]. Similarly, it was noted that 66% (23/35) of the organic farmers interviewed in this study rely on co-farmers as their source of information. Farmer testimonials reporting of poor income within their organic farming peers—such as by Respondent 48, who said, “Some are buried deep in their debts. I think that it is not a good idea to loan because their income is used to pay off their debts” and Respondent 63, who said, “Most of the organic farmers here suffered losses because their plants have diseases” could have led to the enhancing effect of experiences of co-farmers towards coexistence perspective. This was further supported by the results of the Spearman correlation between estimated expenses and experiences of co-farmers, which showed a highly significant positive relationship (Supplemental Tables S3–S6).
Regarding the identified factors that significantly affect each group’s coexistence perspective, it was revealed that biotech farmers primarily rely on internal factors (i.e., sources of information and time) and organic farmers predominantly rely on their external environment, with all three factors being external community factors (i.e., acceptability in barangay, beliefs on acceptability, and experiences of co-farmers). This might underlie a fundamental difference between how biotech and organic farmers undergo decision-making, as described in the elaboration likelihood model, with the former focusing more on the scrutiny of product characteristics [57,58] and the latter being more influenced by sources with high credibility [59].
Lastly, Figure 5 shows how the coexistence perspective and influential factors are contextualized in the study, showing a non-linear decision-making (i.e., the S–O–R Model). All the influential factors were found to be located on Sector 3 or memory, while the main internal response variable that was analyzed in the study was found to be located on Sector 6. By following a non-linear decision-making model, each internal response variable—which are normally presumed to be connected and follow a linear path in the CDM—could be treated as discrete packets and individually analyzed, which allowed for the further understanding of the main objective of this study (i.e., the coexistence perspective).

5. Conclusions

Though each farmer has a myriad of considerations, foremost among them are income and yield because they support both livelihood and family needs [23]. Therefore, farmer choice in terms of crop and farming methods should be seriously considered by policymakers to ensure that the national agenda (e.g., reduction in environmental footprint) aligns with farmer needs. In the current agricultural setting, the mixing of farming methods has not been fully explored, and this can be seen in how policies for organic farming have been framed. Organic certifications provide higher selling premiums at the cost of strictly prohibiting the use of biotech crops and methods. On the other hand, regulations for biotech farmers are more lenient in terms of what methods can be used. Thus, the impact of reduced yield weighs more heavily on organic farmers. Indeed, the biotech farmers in this study reported higher yields and profits than organic farmers. Meanwhile, various studies have established that there is no fundamental difference in terms of the nutritional content and safety of organic and biotech products [44].
Broadly, coexistence gives farmers freedom to optimize production systems to suit their own goals [5,6]. We therefore explored how farmers view the concept of coexistence to understand their underlying decision-making process and what influential factors affect this process. Previous studies have shown that individuals are considered to be rational thinkers [60], an idea that may lead to the assumption that a linear decision-making process is appropriate. However, results from our analyses highlighted the inadequacy of linear decision-making models such as the CDM in addressing complex analytical problems. In this regard, we found that farmers employ a non-linear decision-making process, as demonstrated in the Stimulus–Organism–Response Model. Our approach has the added benefit of simplifying analysis complexity by removing the need to account for relationships between connected stages if a linear model is assumed, thus allowing us to focus on the specific variable of interest, which was the coexistence perspective in this study.
After understanding the decision-making process being undertaken by biotech and organic farmers relative to the coexistence perspective, we identified influential factors affecting this internal response. It was found that external factors influence the coexistence perspective of organic farmers, whereas biotech farmers rely more on internal factors. The presence of “maverick executives” within organic farmers warrants further scrutiny since they may no longer enjoy the selling premium offered by the current legislation for organic farming. Currently, Philippine legislation on organic farming has been ratified to promote environmental sustainability at the cost of hindering farmer choice regarding crop yield, therefore limiting income potential. In theory, if biotech crops are allowed to be organically grown and sold at certain premium prices (that may be lower than those for certified organic produce), then a balance between yield, income, and national agenda could be achieved. This would also provide more choices for farmers to suit their specific production and farm needs and capabilities. Meanwhile, our data suggest that both biotech farmers and organic farmers (who have more to lose regarding income) are open to the coexistence of farming methodologies. Thus, if the concept of temporal coexistence takes hold in future agricultural policies, it could empower farmers, address production limitations and challenges, and contribute to achieving sustainable development goals. If the coexistence movement moves forward, our data could also provide insights regarding how farmers will react to such policies and determine their acceptability within the farming community.
This study also addresses one of the common critiques of decision-making models [36] by providing a measurement of relationships between influential factors and internal response variables. Our approach allowed us to identify which factors are the most critical in influencing farmer decision-making, as well as how different farmer groups vary in terms of the internal and external factors influencing them, which can also be applied in future decision-making studies.
This study was undertaken to highlight the need to focus on stakeholder perspective regarding agricultural policies. Due to the burden placed on farmers to meet not only the national agricultural agenda but also internal family needs, they should be at the forefront of discourse regarding coexistence and agricultural policies in general. While the sample size used in this study may have been moderate to serve as a basis for actual policy changes, the results are sufficient to warrant further investigations using more robust sample sizes. In this paper, we have shown how farmers think and feel about coexistence, and we have provided information regarding its acceptability prior to any implementation measures (due to the analytical approach used in the study design), which may support policy framing. The benefit of this approach can potentially extend to other agricultural issues, such as when new farming technologies are introduced to farmers and how they will react to new policies being implemented in their communities.

Supplementary Materials

The following are available online at https://www.mdpi.com/article/10.3390/agriculture11090857/s1: Table S1: Socio-demographic and farm-related characteristics of biotech and organic farmers; Table S2: Chi-square tests for internal response variables as contextualized Consumer Decision Model stages for directed graph analyses (DAGs); Table S3: Spearman correlation coefficients for organic farmers’ socio-demographic and farm-related factors regarding internal response variables; Table S4: Spearman correlation coefficients for organic farmers’ socio-demographic and farm-related factors on influential factors relative to current farming method; Table S5: Spearman correlation coefficients for biotech farmers’ socio-demographic and farm-related factors on internal response variables; Table S6: Spearman correlation coefficients for biotech farmers’ socio-demographic and farm-related factors on influential factors relative to current farming method.

Author Contributions

Conceptualization, methodology, validation, formal analysis, investigation, resources, data curation, and writing—original draft preparation: C.M.G. and W.J.F.A.; writing—review and editing, C.M.G., W.J.F.A. and K.L.M.; visualization, C.M.G. and W.J.F.A.; supervision, K.L.M.; funding acquisition, C.M.G. and K.L.M. All authors have read and agreed to the published version of the manuscript.

Funding

The APC was partially funded by the Hiroshima University TAOYAKA Program through the Program for Leading Graduate Schools of the Ministry of Education, Culture, Sports, Science and Technology of Japan.

Informed Consent Statement

Informed consent was obtained from all farmers involved in the study.

Data Availability Statement

Research data in this paper are not publicly available due to privacy restrictions, but they can be requested from the corresponding author.

Acknowledgments

This paper is based on a draft previously presented at the 5th Association for Regional Agricultural and Forestry Economics (ARAFE) International Workshop, which was held last July 2021 in Japan. The paper was then revised by incorporating comments and advice from the workshop, and the authors received funding to bear the full cost of MDPI’s English editing services. The authors are thankful to the ARAFE for this support. The authors also wish to thank Ruth Joy Sta. Maria for her help and expertise in the preparation of figures for this article. The authors also wish to thank all the farmers who participated in the study. Lastly, Gonzalvo would like to express her gratitude to the Japanese Government for her MEXT scholarship (文部科学省奨学金), which facilitated her Ph.D. study at Hiroshima University, Japan.

Conflicts of Interest

The authors declare no conflict of interest. The funders had no role in the design of the study; in the collection, analyses, or interpretation of data; in the writing of the manuscript; or in the decision to publish the results.

References

  1. UN. World Population Prospects 2019: Highlights; UN: New York, NY, USA, 2019. [Google Scholar]
  2. FAO; IFAD; UNICEF; WFP; WHO. The State of Food Security and Nutrition in the World 2020. Transforming Food Systems for Affordable Healthy Diets; FAO: Rome, Italy, 2020. [Google Scholar]
  3. FAO. The Future of Food and Agriculture—Trends and Challenges; FAO: Rome, Italy, 2017. [Google Scholar]
  4. USDA. Enhancing Coexistence: A Report of the AC21 to the Secretary of Agriculture; USDA: Washington, DC, USA, 2012.
  5. ISAAA. Pocket K No. 51 Coexistence of Biotech and Non-biotech Crops; ISAAA: Ithaca, NY, USA, 2020. [Google Scholar]
  6. SEARCA. Forum on Organic and Inorganic Farming: Proceedings; SEARCA: Los Baños, Philippines, 2020. [Google Scholar]
  7. Ronald, P.; Adamchak, R. Tomorrow’s Table: Organic Farming, Genetics, and the Future of Food; Oxford University Press: New York, NY, USA, 2017; p. 344. [Google Scholar]
  8. ISAAA. Global Status of Commercialized Biotech/GM Crops in 2019: Biotech Crops Drive Socio-Economic Development and Sustainable Environment in the New Frontier; ISAAA Brief No. 55; ISAAA: Ithaca, NY, USA, 2019. [Google Scholar]
  9. Panopio, J.; Navarro, M. Philippines: Drama and communication behind Asia’s first commercialized Bt corn. In Communication Challenges and Convergence in Crop Biotechnology; ISAAA: Ithaca, NY, USA, 2011; pp. 43–80. [Google Scholar]
  10. Yorobe, J.M., Jr.; Quicoy, C.B. Economic impact of Bt corn in the Philippines. Philipp. Agric. Sci. 2006, 89, 258–267. [Google Scholar]
  11. APAARI. GM Maize in the Philippines—A Success Story; APAARI: Bangkok, Thailand, 2019. [Google Scholar]
  12. Willer, H.; Trávníček, J.; Meier, C.; Schlatter, B. The World of Organic Agriculture: Statistics & Emerging Trends 2021; Research Institute of Organic Agriculture FiBL: Frick, Switzerland; IFOAM—Organics International: Bonn, Germany, 2021. [Google Scholar]
  13. Mendoza, T.C. Evaluating the benefits of organic farming in rice agroecosystems in the Philippines. J. Sustain. Agric. 2004, 24, 93–115. [Google Scholar] [CrossRef]
  14. Seufert, V.; Ramankutty, N.; Foley, J.A. Comparing the yields of organic and conventional agriculture. Nature 2012, 485, 229–232. [Google Scholar] [CrossRef]
  15. Purnhagen, K.P.; Clemens, S.; Eriksson, D.; Fresco, L.O.; Tosun, J.; Qaim, M.; Visser, R.G.F.; Weber, A.P.M.; Wesseler, J.H.H.; Zilberman, D. Europe’s farm to fork strategy and its commitment to biotechnology and organic farming: Conflicting or complementary goals? Trends Plant Sci. 2021, 26, 600–606. [Google Scholar] [CrossRef]
  16. Weber, W.E.; Bringezu, T.; Broer, I.; Eder, J.; Holz, F. Coexistence between GM and Non-GM maize crops—Tested in 2004 at the field scale level (Erprobungsanbau 2004). J. Agron. Crop Sci. 2007, 193, 79–92. [Google Scholar] [CrossRef]
  17. Messeguer, J.; Penas, G.; Ballester, J.; Bas, M.; Serra, J.; Salvia, J.; Palaudelmas, M.; Mele, E. Pollen-mediated gene flow in maize in real situations of coexistence. Plant Biotechnol. J. 2006, 4, 633–645. [Google Scholar] [CrossRef]
  18. Della Porta, G.; Ederle, D.; Bucchini, L.; Prandi, M.; Verderio, A.; Pozzi, C. Maize pollen mediated gene flow in the Po valley (Italy): Source-recipient distance and effect of flowering time. Eur. J. Agron. 2008, 28, 255–265. [Google Scholar] [CrossRef]
  19. Craik, F.; Lockhart, R. Levels of processing: A framework for memory research. J. Verbal Learn. Verbal Behav. 1972, 11, 671–684. [Google Scholar] [CrossRef]
  20. McGuire, W. Attitude change: The information-processing paradigm. In Experimental Social Psychology; McClintock, C.G., Ed.; Holt, Rinehart, and Winston: New York, NY, USA, 1972; pp. 108–141. [Google Scholar]
  21. Hamilton, M.; Stewart, B. Extending an information processing model of language intensity effects. Commun. Q. 1993, 41, 231–246. [Google Scholar] [CrossRef]
  22. Bandura, A. Social cognitive theory and clinical psychology. In International Encyclopedia of the Social and Behavioral Sciences; Elsevier: Amsterdam, The Netherlands, 2001; pp. 14250–14254. [Google Scholar]
  23. Gonzalvo, C.M.; Tirol, M.S.C.; Moscoso, M.O.; Querijero, N.J.V.B.; Aala, W.F., Jr. Critical factors influencing biotech corn adoption of farmers in the Philippines in relation with the 2015 GMO Supreme Court ban. J. Rural Stud. 2020, 74, 10–21. [Google Scholar] [CrossRef]
  24. Montes de Oca Munguia, O.; Pannell, D.J.; Llewellyn, R. Understanding the adoption of innovations in agriculture: A review of selected conceptual models. Agronomy 2021, 11, 139. [Google Scholar] [CrossRef]
  25. Edwards-Jones, G. Modelling farmer decision-making: Concepts, progress and challenges. Anim. Sci. 2006, 82, 783–790. [Google Scholar] [CrossRef]
  26. Nguyen, T.T.; Nguyen, L.D.; Lippe, R.S.; Grote, U. Determinants of farmers’ land use decision-making: Comparative evidence from Thailand and Vietnam. World Dev. 2017, 89, 199–213. [Google Scholar] [CrossRef]
  27. Celio, E.; Flint, C.G.; Schoch, P.; Gret-Regamey, A. Farmers’ perception of their decision-making in relation to policy schemes: A comparison of case studies from Switzerland and the United States. Land Use Policy 2014, 41, 163–171. [Google Scholar] [CrossRef]
  28. Williamson, S.; Little, A.; Ali, M.A.; Kimani, M.; Meir, C.; Oruko, L. Aspects of cotton and vegetable farmers’ pest management decision-making in India and Kenya. Int. J. Pest Manag. 2003, 49, 187–198. [Google Scholar] [CrossRef]
  29. Dessart, F.J.; Barreiro-Hurle, J.; van Bavel, R. Behavioural factors affecting the adoption of sustainable farming practices: A policy-oriented review. Eur. Rev. Agric. Econ. 2019, 46, 417–471. [Google Scholar] [CrossRef] [Green Version]
  30. Husaini, A.M.; Sohail, M. Time to redefine organic agriculture: Can’t GM crops be certified as organics? Front. Plant Sci. 2018, 9, 423. [Google Scholar] [CrossRef]
  31. Blackwell, R.; Miniard, P.; Engel, J. Consumer Behavior, 10th ed.; Thomson/South-Western: Mason, OH, USA, 2006. [Google Scholar]
  32. Jacoby, J. Stimulus-organism-response reconsidered: An evolutionary step in modeling (consumer) Behavior. J. Consum. Psychol. 2002, 12, 51–57. [Google Scholar] [CrossRef]
  33. Engel, J.; Blackwell, R.; Miniard, P. Consumer Behavior, 8th ed.; The Dryden Press: Orlando, FL, USA, 1995. [Google Scholar]
  34. Foxall, G. Consumer Psychology in Behavioural Perspective; Routledge: London, UK; New York, NY, USA, 1990. [Google Scholar]
  35. Peter, J.; Olson, J. Consumer Behavior and Marketing Strategy, 9th ed.; McGraw-Hill/Irwin: New York, NY, USA, 2010. [Google Scholar]
  36. Loudon, D.; Della Bitta, A. Consumer Behaviour Concepts and Applications, 4th ed.; McGraw Hill: New York, NY, USA, 1993. [Google Scholar]
  37. Bozinoff, L. A script theoretic approach to information processing: An energy conservation application. In NA—Advances in Consumer Research; Association for Consumer Research: Urbana, IL, USA, 1982; Volume 9. [Google Scholar]
  38. Erasmus, A.; Boshoff, E.; Rousseau, G. Consumer decision-making models within the discipline of consumer science: A critical approach. J. Fam. Ecol. Consum. Sci. 2001, 29, 82–90. [Google Scholar] [CrossRef] [Green Version]
  39. Jacoby, L.L.; Brooks, L.R. Nonanalytic cognition—Memory, perception, and concept-learning. Psychol. Learn. Motiv. Adv. Res. Theory 1984, 18, 1–47. [Google Scholar] [CrossRef]
  40. Zaltman, G. Consumer researchers: Take a hike! J. Consum. Res. 2000, 26, 423–428. [Google Scholar] [CrossRef]
  41. Philippine Statistics Authority. Quickstat Pampanga (as of June 2018); Philippine Statistics Authority: Quezon City, Philippines, 2018.
  42. Philippine Statistics Authority. Quickstat Laguna (as of June 2018); Philippine Statistics Authority: Quezon City, Philippines, 2018.
  43. Textor, J.; van der Zander, B.; Gilthorpe, M.S.; Liskiewicz, M.; Ellison, G.T.H. Robust causal inference using directed acyclic graphs: The R package ‘dagitty’. Int. J. Epidemiol. 2016, 45, 1887–1894. [Google Scholar] [CrossRef] [Green Version]
  44. USDA. USDA Coexistence Factsheets—Crop Production Methods; USDA: Washington, DC, USA, 2015.
  45. Pannell, D.J.; Claassen, R. The Roles of Adoption and Behavior Change in Agricultural Policy. Appl. Econ. Perspect. Policy 2020, 42, 31–41. [Google Scholar] [CrossRef]
  46. Department of Agriculture. Republic Act 10068 (Organic Agriculture Act of 2010) and Its Implementing Rules and Regulations (IRR); Department of Agriculture: Quezon City, Philippines, 2011.
  47. Ray, R.; Ugbah, S.; Brammer, C.; DeWine, S. Communication Behaviors, Innovation, and the Maverick Leader. J. Leadersh. Stud. 1996, 3, 21–30. [Google Scholar] [CrossRef]
  48. Ram, S.; Jung, H. “Forced” adoption of innovations in organizations: Consequences and implications. J. Prod. Innov. Manag. 1991, 8, 117–126. [Google Scholar] [CrossRef]
  49. Durham, T.; Mizik, T. Comparative economics of conventional, organic, and alternative agricultural production systems. Economies 2021, 9, 64. [Google Scholar] [CrossRef]
  50. Luczka, W.; Kalinowski, S. Barriers to the development of organic farming: A polish case study. Agriculture 2020, 10, 536. [Google Scholar] [CrossRef]
  51. Wieczorek, A. Use of Biotechnology in Agriculture—Benefits and Risks; University of Hawaii: Honolulu, HI, USA, 2003; p. 6. [Google Scholar]
  52. Bouttes, M.; Darnhofer, I.; Martin, G. Converting to organic farming as a way to enhance adaptive capacity. Org. Agric. 2019, 9, 235–247. [Google Scholar] [CrossRef] [Green Version]
  53. Azam, M.S.; Shaheen, M. Decisional factors driving farmers to adopt organic farming in India: A cross-sectional study. Int. J. Soc. Econ. 2019, 46, 562–580. [Google Scholar] [CrossRef]
  54. Damayanti, M.; Nugroho, P.; Tyas, W.P. Norms in community-based organic farming. Agriculture 2018, 8, 185. [Google Scholar] [CrossRef] [Green Version]
  55. Cadger, K.; Quaicoo, A.K.; Dawoe, E.; Isaac, M.E. Development interventions and agriculture adaptation: A social network analysis of farmer knowledge transfer in Ghana. Agriculture 2016, 6, 32. [Google Scholar] [CrossRef] [Green Version]
  56. Agwu, A.E.; Ekwueme, J.N.; Anyanwu, A.C. Adoption of improved agricultural technologies disseminated via radio farmer programme by farmers in Enugu State, Nigeria. Afr. J. Biotechnol. 2008, 7, 1277–1286. [Google Scholar]
  57. Sohail, M.S.; Awal, F. Examining the impact of self-image congruence on brand preference and satisfaction: The moderating effect of expertise. Middle East J. Manag. 2017, 4, 133–149. [Google Scholar] [CrossRef]
  58. Sirgy, M. Self-concept in relation to product preference and purchase intention. Dev. Mark. Sci. 2015, 3, 350–354. [Google Scholar]
  59. Petty, R.; Cacioppo, J. Elaboration Likelihood Model. In A First Look at Communication Theory, 10th ed.; Grffin, E., Ledbetter, A., Sparks, G., Eds.; McGraw-Hill Education: New York, NY, USA, 2019; pp. 182–193. [Google Scholar]
  60. Becker, G.S. The Economic Approach to Human Behavior; University of Chicago Press: Chicago, IL, USA, 1976; p. 314. [Google Scholar]
Figure 1. (a,b) Simplified Stimulus–Organism–Response Model (a) and Consumer Decision Model (CDM) (b), as contextualized in this study.
Agriculture 11 00857 g001
Figure 2. Sampling sites of the study.
Agriculture 11 00857 g002
Figure 3. (ac) Directed acyclic graph analysis of the canonical Consumer Decision Model (a) in the context of biotech farmers (b) and organic farmers (c).
Agriculture 11 00857 g003
Figure 4. Heat diagram of internal and external factors affecting the coexistence perspective of biotech and organic farmers, guided by the CDM and the S–O–R Model.
Agriculture 11 00857 g004
Figure 5. Stimulus–Organism–Response Model showing the influential factors affecting biotech and organic farmers’ coexistence perspective.
Agriculture 11 00857 g005
Table 1. Contextualized internal response variables and influential factors used in the study based on the Consumer Decision Model.
Consumer Decision Model (CDM) VariablesContextualized Variables Used in the Study
Decision-making stagesInternal response variables
Need recognition stageDesirability to implement biotech and organic farming (i.e., coexistence)
Search stageFamiliarity and knowledge of biotech and organic crops
Pre-purchase evaluation of alternatives stageLevel of benefit derived from current farming method
Purchase stageLikelihood to keep buying seeds for current farming method
Consumption/adoption stageCoexistence perspective
Post-consumption/adoption evaluation and divestment stageLikelihood to sell and promote current farming method
Individual differencesInternal influential factors relative to current farming method
Consumer resourcesTime
Capital
Sources of information
KnowledgeKnowledge about current farming method
Knowledge about planting practices
Knowledge about planting requirements
Knowledge about news
AttitudesAttitude towards planting method
Attitude towards environmental effects
Attitude towards health effects
Motivation and involvementBenefit
Satisfaction
Personality, Values, and LifestylePersonal experiences
Usage of income
Environmental influencesExternal influential factors relative to current farming method
CultureBeliefs on acceptability
Acceptability in barangay
Social interactionsExperiences of co-farmers
Personal influencesPersonal opinion
FamilySupport of family
Perception/opinion of family
SituationSituation of co-farmers
Market situation
Situation after planting
Table 2. Internal response variables a of biotech and organic farmers.
Internal Response VariablesBiotech FarmersOrganic Farmers
Frequency
(n = 35)
Percentage
(%)
Frequency
(n = 35)
Percentage
(%)
Desirability to implement biotech and organic farming (i.e., coexistence)
Very desirable1337.1925.7
Desirable1542.92057.1
Neutral411.4411.4
Undesirable25.725.7
Very undesirable12.900.0
TOTAL35100.035100.0
Familiarity and knowledge of biotech and organic crops
Extremely familiar822.9411.4
Moderately familiar1234.3822.9
Somewhat familiar925.7617.1
Slightly familiar12.9822.9
Not at all familiar514.3925.7
TOTAL35100.035100.0
Level of benefit derived from current farming method
Extremely beneficial1337.11645.7
Moderately beneficial1234.31337.1
Somewhat beneficial720.0514.3
Slightly beneficial38.612.9
Not at all beneficial00.000.0
TOTAL35100.035100.0
Likelihood to buy seeds based on current farming method
Extremely likely1645.7925.7
Likely1234.31645.7
Neutral514.3822.9
Unlikely25.712.9
Extremely unlikely00.012.9
TOTAL35100.035100.0
Coexistence perspective
Coexistence is possible2262.93188.6
Coexistence is not possible1337.1411.4
TOTAL35100.035100.0
Likelihood to sell and promote current farming method
Extremely likely1954.3925.7
Likely1131.41954.3
Neutral38.6720.0
Unlikely25.700.0
Extremely unlikely00.000.0
TOTAL35100.035100.0
a Decision-making stages which are present in one sector (i.e., internal responses) in the S–O–R Model.
Table 3. Between-group comparison a of biotech farmers and organic farmers in terms of various socio-demographic and farm-related factors.
CategoryMean Rank
(Biotech Farmers)
Mean Rank
(Organic Farmers)
Significance b
Age33.1037.900.324
Family size33.7737.230.472
Number of years farming31.8639.140.133
Number of years farming using current farming method35.5935.410.972
Land area41.4129.590.014
Land area used for current farming method43.5027.500.001 **
Estimated expenses49.7721.230.000 **
Profit42.6028.400.003 **
a Mann–Whitney U Test. b Asymptotic significance. ** Significant at p < 0.01.
Table 4. Between-group comparison a of biotech farmers and organic farmers in terms of internal response variables b and influential factors relative to current farming method.
CategorySignificance c
Internal response variables
Desirability to implement biotech and organic farming (i.e., coexistence)0.565
Familiarity and knowledge of biotech and organic crops0.021 *
Level of benefit derived from current farming method0.284
Likelihood to buy seeds based on current farming method0.120
Coexistence perspective0.011 *
Likelihood to sell and promote current farming method0.043 *
Influential factors relative to current farming method
Time0.711
Capital0.688
Sources of information0.178
Knowledge about current farming method0.170
Knowledge about planting practices0.489
Knowledge about planting requirements0.246
Knowledge about news0.962
Attitude towards planting method0.173
Attitude towards environmental effects0.229
Attitude towards health effects0.046 *
Benefit0.774
Satisfaction0.241
Personal experiences0.820
Beliefs on acceptability0.443
Usage of income0.336
Acceptability in barangay0.010 **
Experiences of co-farmers0.170
Personal opinion0.829
Support of family0.126
Perception/opinion of family0.082
Situation of co-farmers0.051
Market situation0.640
Situation after planting0.195
a Independent Sample Jonckheere–Terpstra Test for Ordered Alternatives. b Decision-making stages grouped together in one sector (i.e., internal responses) in the S-O-R Model. c Asymptotic significance. * Significant at p < 0.05; ** significant at p < 0.01.
Table 5. Stepwise regression estimates of influential factors on the coexistence perspective within biotech farmers (BF; n = 35) and organic farmers (OF; n = 35).
Regression Estimates a
GroupβSER295% CICollinearity
LowerUpperTVIF
Biotech farmers b
Sources of information0.221 **0.0610.1740.0970.3440.9151.093
Time−0.184 **0.0640.170−0.314−0.0540.9151.093
Organic farmers c
Acceptability in barangay−0.135 **0.0460.356−0.230−0.0410.8881.126
Experiences of co-farmers0.129 **0.0450.1360.0360.2210.8791.138
Beliefs on acceptability−0.121 **0.0580.090−0.240−0.0020.9551.047
a Criteria: Probability of F to enter ≤ 0.050, probability of F to remove ≥ 0.100. b Final Model: constant + time + sources of information: Fchange of 8.312 and SigFchange of 0.007. Regression and Residuals ANOVA: F: 8.405, Sig.: 0.001. c Final Model: constant + acceptability in barangay + experiences of co-farmers + beliefs on acceptability: Fchange of 4.306 and SigFchange of 0.046. Regression and Residuals ANOVA: F: 5.636, Sig.: 0.003. ** significant at p < 0.01.
Publisher’s Note: MDPI stays neutral with regard to jurisdictional claims in published maps and institutional affiliations.

