Article

Assessment of Meteorological and Agricultural Drought Occurrence in Central Poland in 1961–2020 as an Element of the Climatic Risk to Crop Production

by
Renata Kuśmierek-Tomaszewska
* and
Jacek Żarski
Department of Agrometeorology, Plant Irrigation and Horticulture, Faculty of Agriculture and Biotechnology, Bydgoszcz University of Science and Technology, 6 Bernardyńska Str., 85-029 Bydgoszcz, Poland
*
Author to whom correspondence should be addressed.
Agriculture 2021, 11(9), 855; https://doi.org/10.3390/agriculture11090855
Submission received: 20 July 2021 / Revised: 1 September 2021 / Accepted: 6 September 2021 / Published: 7 September 2021

Abstract

:
The results of numerous studies concerning meteorological drought show that there is a considerable impact of this phenomenon on several regions in Europe. On the other hand, statistical trends of dry spell occurrences in some areas of the continent are unclear or even negative. Therefore, further research should be directed towards a better understanding of this hazard, particularly the seasonal changes, in order to elaborate adequate strategies to prevent and mitigate its undesirable effects. The main goal of the work, conducted as part of the research strategy on contemporary climate change, was to confirm the hypothesis of increasing frequency and intensity of droughts during the period of active plant growth and development (May–August) in central Poland in 1961–2020. The prevailing rainfall conditions in this period determine the production and economic effects of agricultural output. The analysis covered a multiannual period, including two separate climate normals: 1961–1990 and 1991–2020. The work is also aimed at detecting relationships between indicators characterizing meteorological drought (the Standardized Precipitation Index—SPI) and agricultural drought (the actual precipitation deficiency—PAdef). It was found that the frequency of meteorological droughts in the studied period amounts to 30.0% (severe and extreme constitute 6.7%). No significant increase in the frequency and intensity of meteorological droughts over time was observed. Relationships between meteorological and agricultural drought indicators were significant, so the SPI can be considered an indicator of plant irrigation needs in the studied area.

1. Introduction

Meteorological droughts are defined as long periods with little or no rainfall, leading to a significant decrease in water availability at a specific time and in a given area. Definitions of types of droughts and their causes, the current state of knowledge on them, identified gaps and research perspectives for this phenomenon can be found in the work of Hagenlocher et al. [1]. As indicated by many sources [2,3,4], the phenomenon of drought is not only attributed to arid or semiarid climates, but also to areas located in the temperate zone consisting of, inter alia, the predominant surface of the European continent [5,6]. Results of research by Spinoni et al. [7] show (according to the standardized precipitation index—SPI), a statistically significant tendency towards less frequent and severe drought events over northeastern Europe, especially in winter and spring, and a moderate opposite tendency over southern Europe, especially in spring and summer. Both for frequency and severity, the evolution towards drier conditions is more relevant in the last three decades over central Europe in spring, in the Mediterranean area in summer, and in eastern Europe in autumn. For the period of active plant growth (summer season) in central Europe (covering the territory of Poland) the authors did not recognize any significant (positive or negative) trends in the frequency and severity of droughts determined by the SPI. Hänsel et al. [8] assessed the long-term variability of drought conditions and seasonal climate trends within 1951–2015 based on a collective of 91 climate stations from the national meteorological services of Germany, Poland and the Czech Republic. Seasonally, drying trends were observed for spring and less pronounced for summer, while autumn and winter showed wetting trends. The authors also shown that the choice of the study period matters (1951–2015 vs. 1961–2015) as the pronounced (multi)decadal variability of drought conditions restricts the temporal stability of computed trends. The drought trends computed for 1951–2015 were similar in direction, but generally smaller in magnitude than those of the shorter period 1961–2015, as the 1950s was a very dry decade in central Europe. In the conditions of the climate of central Poland, located entirely in the center of the temperate zone, which is the transition between the maritime and continental climatic conditions, droughts occur frequently but irregularly. An analysis carried out based on a long 145-year set of monthly rainfall totals in Bydgoszcz city (1861–2005) showed that the rate of months with a meteorological drought is approximately 30% [9]. The essential feature of meteorological droughts in central Poland is the irregularity of their occurrence in subsequent years, resulting from the great temporal variability of atmospheric precipitation occurrence. This variability, which is expressed in the presence of absolutely distinct rainfall conditions in the same calendar time spans of individual years, is primarily caused by circulation factors. The physical and geographical conditions of central Poland enable a free, latitudinal exchange of air masses over the land. The results of the research done by Marsz et al. [10] and Wrzesiński et al. [11] confirm that the frequency of droughts over Poland depends on the circulating factors and it is greater in the period of increased intensity of thermohaline circulation (THC), the phases of a “warm” north Atlantic Ocean. The research of Bąk and Maszewski [12] shows that in the region between the cities Bydgoszcz and Toruń, anticyclonic systems with air advection from the north and west play the greatest role in the formation of meteorological droughts, while the input of the systems with advection from the east is much less. Prolonged meteorological droughts lead to a decrease in soil moisture, resulting in the occurrence of agricultural droughts. Agricultural droughts are defined as periods when soil moisture is insufficient to meet the water requirements of plants and appropriate agricultural management. In the literature from all over the world, one can find numerous examples of how to identify agricultural drought [1,13]. Some authors define agricultural drought as a shortage of soil water in a given soil type for a given plant cultivar in a specific time or phase, which results in a reduction in the yield of arable crops [14]. For others however, the basic criterion for determining agricultural drought is the duration of an uninterrupted period of days with an exhausted stock of water readily available to plants in the root zone in a soil profile. In their opinion, moderate agricultural drought begins when this sequence of days is at least seven, and for intense drought, it is at least 2 weeks, and in the case of very intense drought the period is longer than 20 days [15]. In extreme cases, especially on sandy soils, even a complete loss of the crop is possible. According to the research by Żarski et al. [16], the occurrence of agricultural drought, expressed as the number of precipitation deficits in June and July, led to a decrease in the yield of maize grain in the Kujawsko-Pomorskie voivodeship by an average of 13%, and in the extremely dry 2006, by 27% compared to average crops. On the scale of an individual farm, the yield reductions caused by agricultural drought are much greater. As a result of many years of research (2005–2016) conducted by researchers from the University of Science and Technology in Bydgoszcz [17] the yield of maize grain, which amounted on average to 9.10 t/ha, in the years of agricultural drought occurring in the period of the high water needs of maize, decreased to 3.90 t/ha.
In recent years, many efforts have been made in Poland and other countries to expand knowledge about the main quantitative characteristics of droughts in terms of climatology, including their frequency, extent, duration, and intensity, as well as identification methods [14,18,19]. In addition, numerous studies concern the agricultural aspect of droughts, including in particular the assessment of quantitative effects and methods of their mitigation and active prevention [20,21]. The growing interest in drought phenomena in Poland and on the world scale, especially noted since the beginning of the 21st century, is related to the increasing importance of the main scientific problem of contemporary climatology, which is oriented toward the ongoing climate change and its effects on agriculture [22,23,24,25,26,27]. This global problem can be divided into several strategies: learning about the climate in the past, recognition of the currently observed climate changes, and finally projections about the climate in the future. With regard to droughts taking place in the past, it was demonstrated based on the SPI index analysis that the long-term frequency of these phenomena in Poland was stable over the last two or even three centuries [28]. The stability of droughts over time is confirmed by the results of other studies conducted in various regions of the world [29,30,31]. However, some studies have obtained different results [32,33]. For example, according to the research by Szyga-Pluta [33] carried out based on data from 30 stations of the National Institute of Meteorology and Water Management in 1966–2015, a tendency towards increased dryness of the growing season in Poland was observed at the statistically significant level of p = 0.1. But, it must be pointed out that the study concerned droughts calculated based on the Sielianinov k coefficient. This index takes into account not only atmospheric precipitation but also air temperature. Once droughts were determined based on indicators taking into account only rainfall (standardized precipitation index, relative precipitation index), no long-term trend was found, which means no risk of increasing water deficit appeared. The results of research by Kuśmierek-Tomaszewska et al. [34,35,36] indicate the lack of intensification of the phenomenon of agricultural droughts in selected localities of the Kujawsko-Pomorskie voivodship in 1981–2010. It was also found that the amount and variability of atmospheric precipitation in the growing season in Poland did not show significant changes over time [37,38,39]. On the other hand, some studies indicate that the unfavorable changes related to the increase in the frequency and intensity of droughts is already taking place. Such conclusions are presented in the research by Somorowska [40] carried out for the years 1956–2015 based on the standardized precipitation-evapotranspiration index (SPEI). Similar conclusions have also been presented by other researchers [41,42,43,44,45,46].
As stated by the forecasts of climate change, the main manifestation of which is an increase in air temperature, the frequency of extreme weather conditions, and thus also the occurrence of droughts, is expected to rise in moderate latitudes [47]. In simulation studies conducted under the typical GISS Model E, HadCM3, and GFDL R15 climate change scenarios, it has been shown that in central Poland an increase in precipitation variability of up to 20 percent, depending on the scenario, is expected. This means a greater risk of droughts and the need to meet the increasing water requirements of crops during the growing season [48]. The probabilities of the incidence of extremely dry periods in central Poland predicted for 2050–2060 show an average increase of two, three, and four times, depending on the climate change scenario, compared to the current conditions [49].
Nowadays, more and more often the issues related to vulnerability and resilience to climate change and broadly understood climate justice are discussed [50]. In order to understand the climatic risk manifested in the agricultural economy, it is necessary to recognize the features of selected elements of this risk, such as droughts.
The main goal of the work, conducted as part of the research strategy on contemporary climate change, was to confirm the hypothesis of the increasing frequency and intensity of droughts during the period of active plant growth and development in the Bydgoszcz region in the years 1961–2020. In the moderate climate zone, the period of active growth and development covers the months from May to August. The prevailing rainfall conditions in this period determine the production and economic effects of agricultural output. The region of Bydgoszcz is representative of the Kujawsko-Pomorskie voivodeship in central Poland, which constitutes the main area of agricultural production. The analysis covers a multiannual period, including two separate climate normals: 1961–1990 and 1991–2020. The work also aims to detect relationships between indicators characterizing meteorological and agricultural droughts.

2. Materials and Methods

2.1. Study Area and Data Sources

The material consisted of the results of conventional measurements of atmospheric precipitation and air temperature taken in the years 1961–2020 during periods of active plant growth: May, June, July, and August. Meteorological data were obtained from a measuring point at the Research Station of the University of Technology and Life Sciences in Bydgoszcz, located in a rural area (ϕ = N 53°13′, λ = E 17°51′, elev. = 98.5 m above sea level) in a distance of 20 km from the city center of Bydgoszcz. This area is devoid of the influence of urban anthropogenic factors and can be treated as representative of the Bydgoszcz region, which in turn reflects the conditions peculiar to the Kujawsko-Pomorskie voivodeship and central Poland.
Air temperature was measured in a Stevenson screen at the height of 2 m above ground level by mercury-in-glass thermometers with a certificate of calibration, approved by the National Institute of Meteorology and Water Management. After the setting of the measuring point, readings were taken unchangeably three times per day at the same time: 06, 12, 18 Coordinated Universal Time (UTC) with an accuracy of 0.1 °C. Daily temperature was calculated according to the formula (1):
t d = t 06   U T C + t 18   U T C + t m a x + t m i n 4
where:
  • td—mean daily air temperature (°C)
  • t06 UTC—air temperature at 06 UTC (°C)
  • t18 UTC—air temperature at 18 UTC (°C)
  • tmax—maximum air temperature (°C)
  • td—minimum air temperature (°C)
Atmospheric precipitation was measured by a Hellmann’s rain gauge at an elevation of 1 m a. g. l. Readings were taken once a day at 06 UTC with an accuracy of 0.1 mm.
To verify the homogeneity and accuracy of the data, they were compared to the data from the reference station operating in the national network of the Institute of Meteorology and Water Management, located in Toruń, confirming their reliability and representative feature.
Meteorological and agricultural droughts were identified in the following spans: the entire period of active plant growth May–August, the individual months of May, June, July, and August, and three two-month intervals covering periods of increased water needs of the most economically important crops: May–June for the main cereals and winter oilseed rape; June–July for corn, July–August for sugar beet.

2.2. Drought Identification

The identification of meteorological droughts (mD) was done based on the standardized precipitation index (SPI) [51]. The index was calculated for a 60-year data series. Precipitation totals (P) were normalized by the transforming function f(P) = ∛P [52].
Based on the SPI values, meteorological drought classes were determined according to the scale applicable in the rainfall conditions monitored in Poland, led by the Institute of Technology and Life Sciences (Table 1).
To determine the agricultural drought (aD), the indicator of actual precipitation deficiency (PAdef) as the relation between actual precipitation (PA) and crop optimal precipitation (POpt) was used. The optimal precipitation was calculated based on Klatt’s table values for selected crops (POK) [54] and soils of medium compactness. This indicator is commonly used by many authors in research related to plant water needs and irrigation schedule [55,56,57,58]. According to the values of POK elaborated by Klatt, the following optimal precipitation level was assumed: in May, 70 mm at an average air temperature of 13 °C; in June, 75 mm at an average air temperature of 16 °C; in July, 90 mm at an average temperature of 18 °C; and, in August, 80 mm at an average air temperature of 17 °C. The difference in temperature referring to the given normative values caused an increase or decrease in optimal precipitation (POpt) by 5 mm for each 1 °C of this difference.

2.3. Statistical Analysis

Statistical methods commonly used in climatological studies were applied [59]. The calculations performed for all time intervals mentioned concerned regression and correlation analysis (Pearson’s coefficient at the p–level of 0.05), as well as the analysis of trends using linear regression equations for the 60-year measurement period. Data analysis was performed with the Analysis ToolPak of Microsoft Excel 2010 add-in program data analysis tools.

3. Results

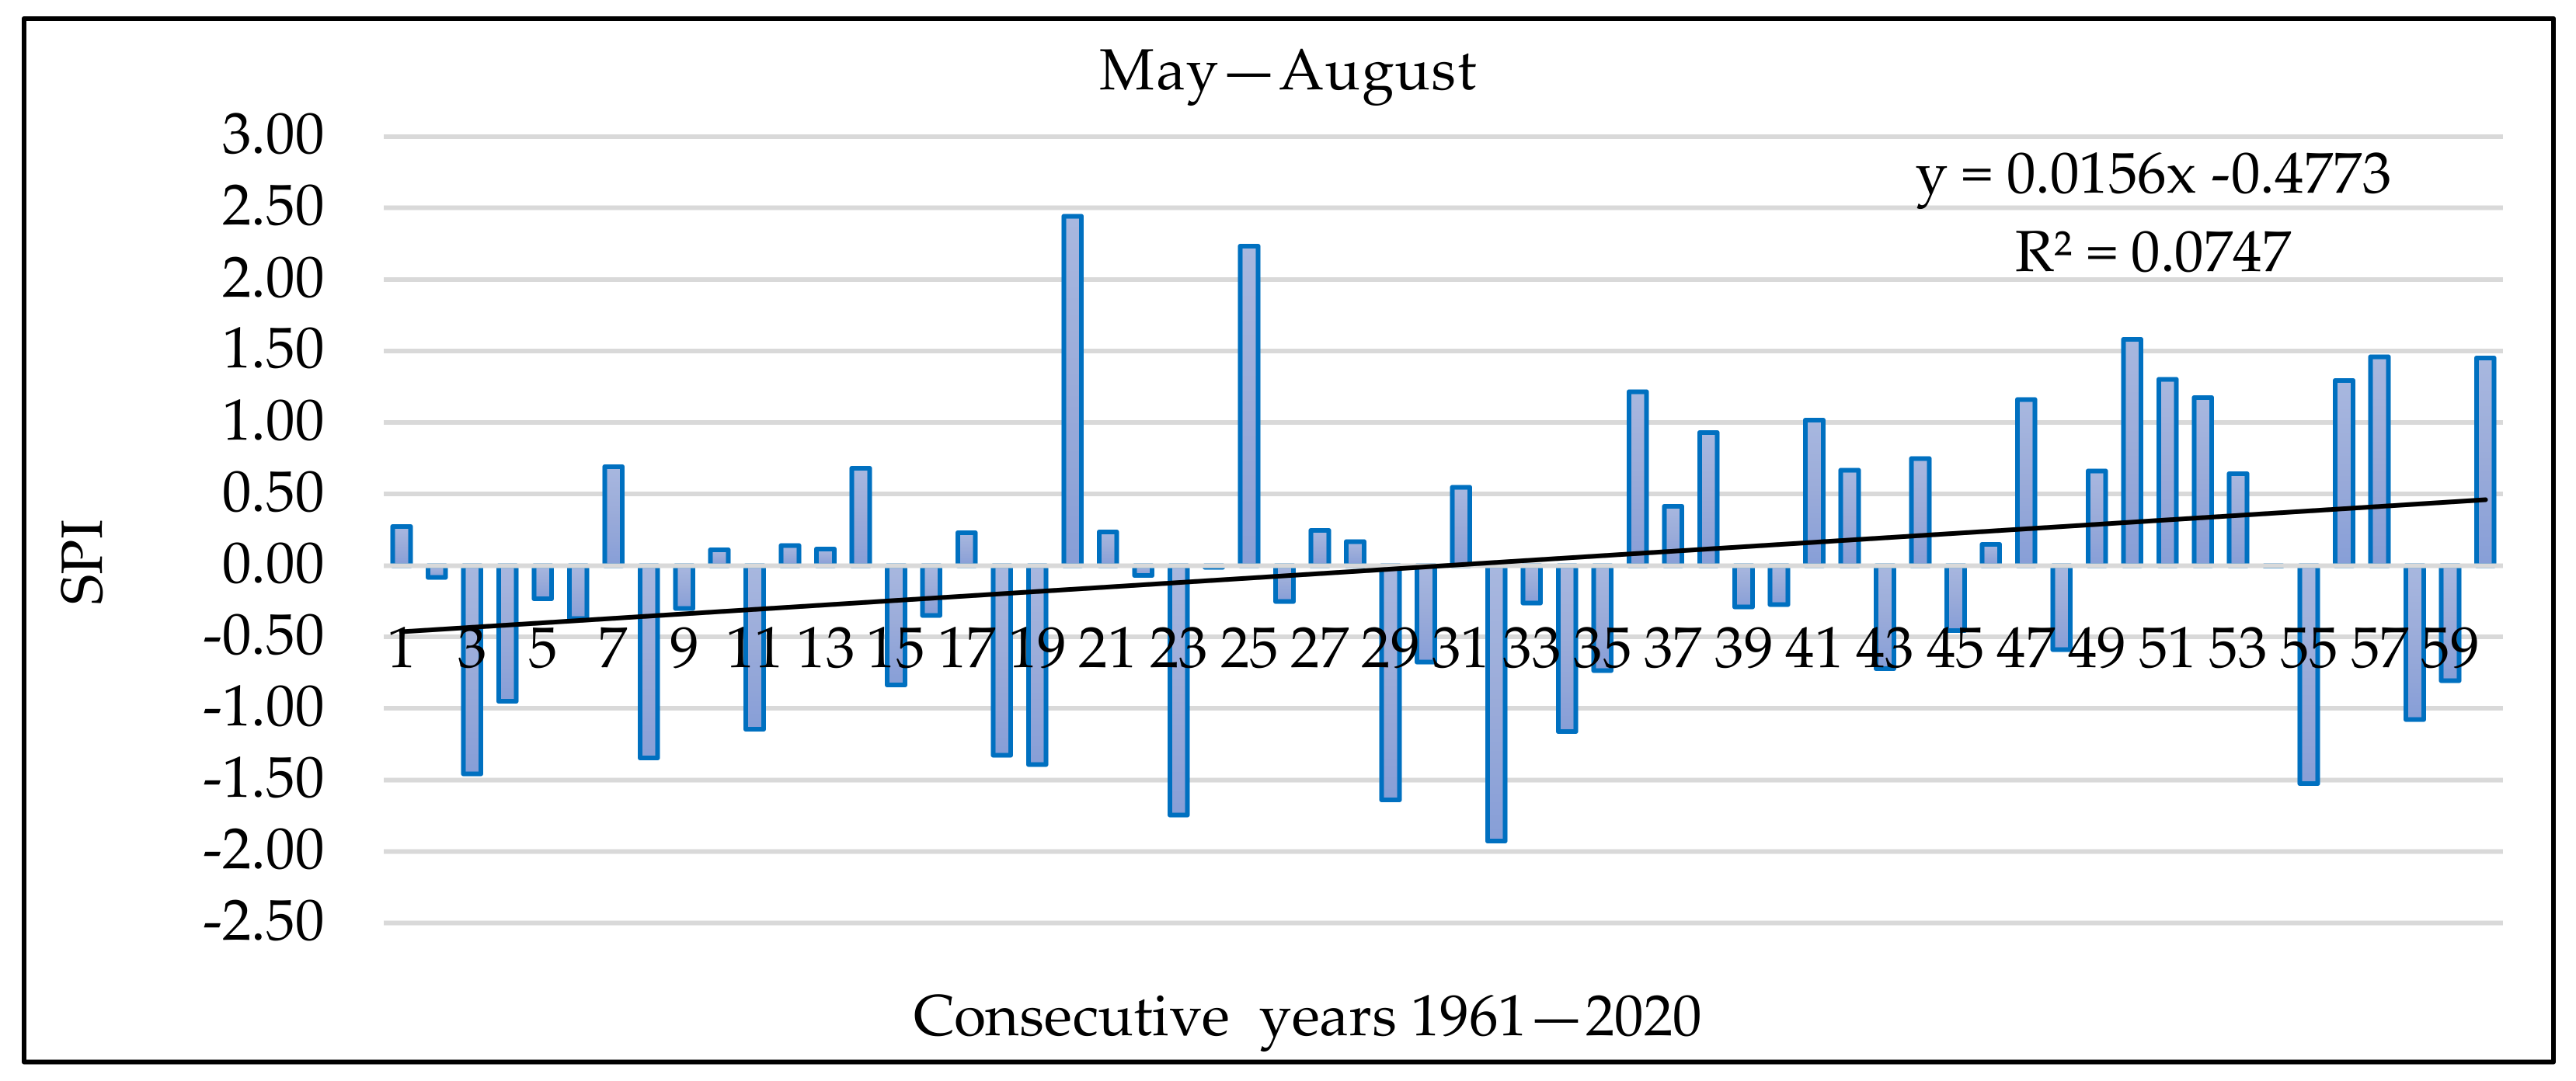
3.1. Frequency and Intensity of Meteorological Droughts

The frequency of meteorological droughts in the entire period of active growth and development of plants (May–August) in the region of Bydgoszcz in 1961–2020 equaled 30.0% (Table 2). In 18 out of 60 analyzed periods, droughts were identified: in seven cases, the periods were slightly dry; in another seven, moderately dry; and, in the final four, very dry. However, not a single whole period of active growth and development of plants was found as extremely dry. In the individual months, the frequency of droughts varied from 23.3 to 35.0%. The most droughts were identified in June but they occurred very seldom in August. The most severe and extreme droughts were found in May and July (the frequency was 8.3%), while to a lesser extent in August (5.0%), but they were not identified at all in June when the total number of all droughts was the greatest.
In the two-month periods, covering the periods of high water needs of the most economically important agricultural plants, droughts occurred with a frequency of 28.3–30%. Four to five such periods out of 60 were extremely or very dry (the frequency varied from 6.7 to 8.3%). When comparing the frequency of meteorological droughts in two consecutive normal periods—the earlier 1961–1990 and the later 1991–2020—one can see that, as a rule, more dry periods occurred in the first 30 years (Figure 1 and Figure 2). This applies to May, July, the two-month periods of May–June, June–July, and July–August, and the entire period of active growth and development of plants from May to August. In August, the frequency of droughts was the same in both climate normal periods, while in June in the period 1991–2020, the number of droughts was greater by one as compared to the previous period. The frequency of the most severe, extreme and very strong droughts in the entire period from May to August was the same in the two 30-year periods compared. This also refers to the periods June–July and July–August. The greatest difference in the presence of extreme and very strong droughts was found in May. In 1961–1990 there were four such cases, while in the years 1991–2020 just one.
Apart from the variability over time characterizing the variation in the occurrence of droughts between subsequent years, one should draw attention to the intraseasonal variability. It is worth noting that in the whole 60-year period there was no case when all four months constituting the period of active growth and development of plants were dry in a given year. Shorter or longer drought spells with different levels of intensification were found in 42 out of the 60 analyzed years. In the 30 years of 1961–1990, the number of such cases was greater (24) compared to the period 1991–2020 (18 cases). The longest and most severe droughts occurred in the initial 30-year span of the analyzed period 1961–2020: in the years 1983 and 1989, and then in 1963, 1968, 1978, and 1979, whereas in the most recent 30-year span these were the seasons of 1992 and 2015 as well as 1994 and 2018.
No increasing frequency and intensity of meteorological droughts were found during the period of active plant growth and development in the region of Bydgoszcz in the studied years 1961–2020 (Figure 3). The values of the indicator of meteorological drought (SPI) were characterized by great variability over time from −1.93 in 1992 to 2.44 in 1980. An upward trend of the SPI values in the years 1961–2020 indicates a significant increase in the amount of atmospheric precipitation, and thus a substantial improvement in weather conditions in agricultural production. As shown by the values of regression equations (Table 3), the amount of atmospheric precipitation increased significantly during the summer months (July–August). Regarding the other analyzed periods, no significant changes in the SPI were found over the years 1961–2020. It is noteworthy that the regression coefficient had a positive value in all studied cases, which proves an upward trend in the SPI values; however, in June it was the least. The SPI values indicate a very strong variability over time, as evidenced by the great range between the extreme values.

3.2. Frequency and Intensity of Agricultural Droughts

Identification of agricultural droughts brings more difficulties than the identification of meteorological droughts. The occurrence of agricultural drought is conditioned not only by meteorological factors but also by the retention capacity of soil and the phase of plant growth and development, which affects evapotranspiration. In this study, to determine the agricultural drought (aD), we used the method of actual precipitation deficiency (PAdef) concerning optimal precipitation (POpt). We assumed the maximum values of POpt for individual months of active plant growth and development and limited the calculation of the optimal precipitation only to the types of soil of medium compactness which dominate the region covered by the study.
The determined values of shortages and excesses of precipitation for the entire period from May to August are indicative, characterizing the general level of the water factor concerning the needs of crop production. Regarding individual months and two-month periods of high water needs of plants, the values of the indicator (aD) reflect the actual shortage or excess of rainfall in the production of the economically most important crops, which account for about 88% of the sowing area. In May and June, this applies to cereal crops and winter rape, in June and July maize grown for grain and green fodder, and in July and August for sugar beet.
Air temperature plays an important role in establishing the value of the agricultural drought index (aD) since it influences the amount of calculated optimal precipitation (POpt). The average air temperature throughout the active growth and development of plants (May–August) varied over time to a great extent (Figure 4). The highest temperature, 18.9 °C, occurred in 2018; whereas the lowest, 13.7 °C, was recorded in 1962.
Statistical analysis demonstrated a significant trend of increase in average air temperature in the period May–August over time. The linear regression equation indicates that the increase for 10 years amounted to 0.26 °C (Table 4). Further, a significant upward trend in the average air temperature in 1961–2020 was found in July, August, and all the two-month periods. In May and June, an increase in this weather factor was recorded too, but the tendency was not statistically significant. Air temperature values in all time intervals showed great variability over time, which is proved by a wide range between extreme values.
The values of the agricultural drought index (aD), representing the difference between the actual (PA) and optimal (POpt), rainfall were characterized by great variability over time, which is analogous to the values of SPI. During the entire period of active growth and development of plants, they amounted on average to −90 mm. This means that agricultural field production in the region of Bydgoszcz is limited by a deficiency of the precipitation factor. The greatest shortage of rainfall occurred in 1992 and amounted to –262.6 mm. Precipitation deficits lower than −200 mm were also recorded as well in 1963, 1983, 1989, 1994, 2015, and 2018. In the other 10 years, the values ranged from −150 to −200 mm. In the case of such great rainfall shortages, farmers are dealing with significant losses in regional crop production and thus with the risk of ensuring a constant supply of raw materials for food production. By contrast, in 1980, due to great rainfall totals in June and July, the excess of precipitation compared to plant water needs amounted to 187.4 mm. A similar situation occurred in 1985 when the surplus due to severe rainfall in August equaled 136.0 mm. The regression analysis did not reveal the significant variability over time of the agricultural drought index in the period May–August in 1961–2020 (Figure 5). There was rather a tendency to decrease rainfall deficits by 0.76 mm per year.
Similarly, in the individual months and the two-month periods of high water needs of crops economically important in the region, no significant changes in agricultural drought indices were found with the passage of years. In all the equations of regression, the values of the Y-intercept were positive, which implies a tendency to diminish precipitation deficits. As in the case of the entire period of active growth and development of plants (May–August), in months and two-month periods, the average rainfall deficiencies were recorded, reflecting water factor deficit in agricultural plant production. Also found was a very high variability of agricultural drought indicators over time (Table 5).

3.3. The Relationship between the Meteorological and Agricultural Drought Index

The regression analysis revealed a significant relationship between the meteorological drought index (SPI) and precipitation deficiency (PAdef) as the indicator of agricultural drought (Figure 6). Values of correlation coefficient describing the strength of the linear dependence exceeded 95–97%, depending on the time interval (Table 6). The value of slope (b) reflects the rainfall shortage at SPI = 0. The equations of regression allow the assessment of precipitation deficiencies (PAdef) in the individual time steps based on the SPI values and thus only on precipitation data. These rainfall deficiencies permit the determination of the irrigation needs of crops in the studied region. This concerns cereals and winter rape in May–June, maize in June–July and sugar beet in July–August. The precipitation deficit throughout the period of active growth and development of −90.0 mm is an index assessment of the water factor deficit in the studied region.

4. Discussion

Results of research by Erfurt et al. [60] taking into account the correlation of the derived long-term trends in droughts with the temperature increase in the global warming trend, show that there is no comparable outstanding development to the anthropogenic temperature trend over the last 200 years in southwestern Germany. This is in line with the findings of Sheffield et al. [61], Spinoni et al. [62], according to which the frequency of droughts is increasing in southern Europe, while the opposite trend is occurring in northern Europe.
The reconstruction of droughts in the period of the last 500 years (since the 1500s) done by Glaser and Kahle [63] for Germany, shows a remarkable long-term stability of this phenomenon. The authors argue that the measured increase in droughts in recent decades should be considered normal from a long-term perspective, and that historical volatility is greater than the modern fluctuations observed since the 1950s.
Ionita and Nagavciuc [64] analyzed the drought characteristics at the European level in 1901–2019 using three drought indices: standardized rainfall index (SPI), standardized rainfall evapotranspiration index (SPEI), and Palmer’s self-calibrated drought severity index (scPDSI). The results based on SPEI and scPDSI show that central Europe and the Mediterranean region are becoming drier due to increased potential evapotranspiration and mean air temperature, while Northern Europe is getting wetter. On the other hand, the SPI did not reveal these changes in drought volatility, mainly due to the fact that rainfall did not show a significant change, especially over central Europe.
The analysis by Utkuzova et al. [65] has shown that SPI adequately identifies drought and wet events in Russia in 1966–2010 in the summer months. The authors have ascertained an increase in the amplitude of extreme (drought/wet) events during the past years, with a prevalence of wet events over drought ones. They found that the spread of drought reduces in June and August and increases in July; wetness propagation increases in June and August and reduces in July in the European territory of Russia.
Overall, the results regarding the frequency of meteorological droughts in the region of Bydgoszcz are consistent with the findings so far [28,34,35,36,60,61,62,63,64,65,66]. As presented in the authors’ research, these droughts appear in a given time in the analyzed region with a frequency of approx. 30%. They occur irregularly, depending on the varying circulation factors related to the advection of different atmospheric masses and pressure systems over Poland. Similar conclusions are presented in other studies, emphasizing that the frequent occurrence of droughts as meteorological phenomena, diverging from the average conditions, is a constant feature of the climate in Poland. The climate is distinguished by the variability of weather conditions, which rarely meet the average values.
Contrary to many findings so far, especially the projections of climate change [47,67,68,69], the results of our research did not confirm the main research hypothesis. There was no evidence of an increase in the frequency and intensity of meteorological droughts with time in 1961–2020. Furthermore, it was observed that droughts occurred more often in the former period of climate norm of 1961–1990 compared to the valid climate normal of 1991–2020. Therefore, one cannot talk of an increase in the frequency and intensity of drought phenomena in central Poland related to ongoing climate change.
The qualitative features of meteorological drought, especially the absence or shortage of atmospheric precipitation, along with high air temperature [67] and great vapor-pressure deficits, result in the depletion of water in soil readily available to plants. As a consequence, meteorological droughts promote the formation of agricultural droughts, which is an unfavorable factor that contributes to the climatic risk of growing plants. We have shown in this study that in the analyzed area no increase in the frequency of agricultural droughts was observed, despite the fact that the increase in air temperature was significant. An explanation of this is the fact that increased evapotranspiration resulting from higher air temperature was compensated by greater precipitation totals. In turn, greater precipitation could be the result of more intense dynamics of the atmosphere resulting from evolving thermal conditions [70].
This work presents the problem of agricultural droughts as a phenomenon taking into account only the most important climatic factors—atmospheric precipitation and air temperature. However, it needs to be remembered that an important factor affecting the occurrence of agricultural drought is also an increasing anthropo-pressure leading to a reduction in soil retention [32,71,72]. Water deficits in the soil environment are, inter alia, deepened by factors such as simplifications in the structure of sowing, simplifications in tillage, reduced content of organic matter due to reduced fertilization, and higher yields. Due to the diminished role of soil retention in mitigating the effects of rain-free periods, growing attention is paid to the development of plant irrigation as an active drought avoidance system. In Poland crop irrigation is nowadays treated as a serious reserve in agriculture, ensuring, according to many studies, an increase, and stability of crops and their quality improvement [73,74,75,76,77,78].
A significant relationship between the indicators of meteorological and agricultural drought was discussed in another work [79]. The results of our analysis confirm these findings and, what is more, enable the assessment of water factor deficiency in agriculture. The quantitative recognition of these shortages can be used in strategic planning in irrigation development, effective scheduling of irrigation systems, and controlling the water factor in agriculture in central Poland.

5. Conclusions

In this work we investigated the frequency and severity of meteorological droughts in central Poland in a 60-year period based on the SPI. As shown in this work, the SPI is frequently used in different studies globally and locally to analyze precipitation fluctuations over time. Despite the fact that SPI has some limitations, for example it only uses one climate variable (precipitation), which makes it less connected with soil conditions [80], it is a flexible index easy for the computation of both short- and long-term periods through the definition of various intervals of time. This flexibility of SPI allows perfect monitoring not only of meteorological but also of agricultural droughts. Furthermore, other indicators, involving more components or related to remote sensing data may not have long records; therefore their use is limited in long-term climatological studies. Based on our results we found that no significant increase in the frequency and intensity of meteorological droughts in 1961–2020 was observed. It is worth noting that the choice of the study period mattered: a greater number of these phenomena occurred in the years 1961–1990, compared to 1991–2020. The frequency of meteorological droughts in the period of active plant growth in the Bydgoszcz region amounted to 30.0% (23.3–35.0% depending on the analyzed period), while severe and extreme droughts constituted 6.7% (0–8, 3%), and we found these findings consistent with the results of other studies for this region.
Water consumption in plant production in Poland is much lower than the world average, since irrigation of crops in the country is still only supplementary. However, as statistics show, plant production is highly dependent on water and is highly susceptible to its shortage, and production effects largely depend on soil and rainfall conditions. Field cultivation in the region of Bydgoszcz during the period of active growth and development of plants and in particular intervals of this period is carried out in conditions of shortages of atmospheric precipitation. However, these shortages do not show either a significant or specific direction of changes in the years 1961–2020. The significant relationship between the indicators of meteorological and agricultural drought allows for the determination of precipitation deficits in crops on the basis of the standardized precipitation index (SPI). It is worth emphasizing that these shortages can also be treated as an indicator of irrigation needs in the studied region.
Currently, about 8% of farms are subject to water charges resulting from crop irrigation in Poland. Lately, the Minister of Agriculture launched an irrigation program in agriculture. As part of the first call for projects, EUR 89 million will be allocated to investments related to irrigation systems, and the total amount allocated to the program is EUR 222.15 million. The program is aimed primarily at owners of farms in areas most affected by drought in recent years. In addition, a retention program was introduced to be implemented in the years 2021–2027. Its budget is EUR 3.11 billion, which is to be allocated to the construction of large and small retention reservoirs, especially important for rural areas. However, the development of irrigation systems, and thus the use of water in plant production, will be determined by the productive and economic efficiency of agricultural crops [77]. However, the results presented by Agovino et al. [81] show that, even at country-level, variation in policy efficiency can be large. Moreover, the authors state that policies affect food sustainability significantly, especially when they target nutritional challenges.

Author Contributions

Conceptualization, R.K.-T. and J.Ż.; methodology, R.K.-T. and J.Ż.; software, R.K.-T. and J.Ż.; validation, R.K.-T. and J.Ż.; formal analysis, R.K.-T. and J.Ż.; investigation, R.K.-T. and J.Ż.; resources, R.K.-T. and J.Ż.; writing—original draft preparation, R.K.-T. and J.Ż.; writing—review and editing, R.K.-T. and J.Ż.; visualization, R.K.-T. and J.Ż. All authors have read and agreed to the published version of the manuscript.

Funding

This research received no external funding.

Institutional Review Board Statement

Not applicable.

Informed Consent Statement

Not applicable.

Data Availability Statement

The data that support the findings of this study are available upon request from the authors.

Conflicts of Interest

The authors declare no conflict of interest.

References

  1. Hagenlocher, M.; Meza, I.; Anderson, C.C.; Min, A.; Renaud, F.G.; Walz, Y.; Siebert, S.; Sebesvari, Z. Drought vulnerability and risk assessments: State of the art, persistent gaps, and research agenda. Environ. Res. Lett. 2019, 14, 083002. [Google Scholar] [CrossRef]
  2. Mishra, A.K.; Singh, V.P. A review of drought concepts. J. Hydrol. 2010, 391, 204–216. [Google Scholar] [CrossRef]
  3. Wu, H.; Wilhite, D.A. An operational agricultural drought risk assessment model for Nebraska, USA. Nat. Hazards 2004, 33, 1–21. [Google Scholar] [CrossRef]
  4. United Nations Office for Disaster Risk Reduction. GAR Special Report on Drought 2021: Summary for Policymakers; United Nations Office for Disaster Risk Reduction: Geneva, Schwitzerland, 2021; p. 173. Available online: https://www.undrr.org/publication/gar-special-report-drought-2021 (accessed on 3 July 2021).
  5. Spinoni, J.; Naumann, G.; Vogt, J.; Barbosa, P. Meteorological Droughts in Europe: Events and Impacts—Past Trends and Future Projections; EUR 27748 EN; Publications Office of the European Union: Luxembourg, 2016; p. 129. [Google Scholar] [CrossRef]
  6. Van Lanen, H.A.J.; Vogt, J.V.; Andreu, J.; Carrão, H.; De Stefano, L.; Dutra, E.; Feyen, L.; Forzieri, G.; Hayes, M.; Iglesias, A.; et al. Climatological risk: Droughts. In Science for Disaster Risk Management 2017: Knowing Better and Losing Less; Poljanšek, K., Marín Ferrer, M., De Groeve, T., Clark, I., Eds.; EUR 28034 EN; Publications Office of the European Union: Luxembourg, 2017; p. 554. [Google Scholar] [CrossRef]
  7. Spinoni, J.; Naumann, G.; Vogt, J.V. Pan-European seasonal trends and recent changes of drought frequency and severity. Glob. Planet. Chang. 2017, 48, 113–130. [Google Scholar] [CrossRef]
  8. Hänsel, S.; Ustrnul, Z.; Łupikasza, E.; Skalak, P. Assessing seasonal drought variations and trends over Central Europe. Adv. Water Resour. 2019, 127, 53–75. [Google Scholar] [CrossRef]
  9. Łabędzki, L. Estimation of local drought frequency in Central Poland using the standardized precipitation index SPI. Irrig. Drain. 2007, 56, 67–77. [Google Scholar] [CrossRef]
  10. Marsz, A.A.; Styszyńska, A.; Krawczyk, W.E. Long-term fluctuations of annual discharges of the main rivers in Poland and their association with the Northern Atlantic Thermohaline Circulation. Przegl. Geograf. 2016, 88, 295–316. (In Polish) [Google Scholar] [CrossRef]
  11. Wrzesiński, D.; Marsz, A.A.; Styszyńska, A.; Sobkowiak, L. Effect of the North Atlantic thermohaline circulation on changes in climatic conditions and river flow in Poland. Water 2019, 11, 1622. [Google Scholar] [CrossRef] [Green Version]
  12. Bąk, B.; Maszewski, R. Types of atmospheric circulation in the region Bydgoszcz–Toruń during long-time meteorological drought in the years 1989–1998. Infr. Ecol. Rural Areas 2012, 12, 17–29. (In Polish) [Google Scholar]
  13. Qin, N.X.; Wang, J.N.; Hong, Y.; Lu, Q.Q.; Huang, J.L.; Liu, M.H.; Gao, L. The drought variability based on continuous days without available precipitation in Guizhou Province, southwest China. Water 2021, 13, 660. [Google Scholar] [CrossRef]
  14. Łabędzki, L. Agricultural Droughts: An Outline of Problems and Methods of Monitoring and Classification; IMUZ: Falenty, Poland, 2006; p. 107. (In Polish) [Google Scholar]
  15. Dudek, S.; Kuśmierek-Tomaszewska, R.; Żarski, J. Drought spells classification based on easily accessible soil water balance. Infr. Ecol. Rural Areas 2009, 3, 109–117. (In Polish) [Google Scholar]
  16. Żarski, J.; Dudek, S.; Kuśmierek-Tomaszewska, R.; Żarski, W. Effects of agricultural droughts in the province of Kujawsko-Pomorskie and possibilities of minimizing their impact. Infr. Ecol. Rural Areas 2017, II/2, 813–824. [Google Scholar] [CrossRef]
  17. Żarski, J.; Dudek, S.; Kuśmierek-Tomaszewska, R. Drip irrigation as a factor mitigating drought impact in corn cultivation in central Poland. In Proceedings of the 8th International Scientific Conference Rural Development, Bioeconomy challenges, Aleksandras Stulginskis University, Kauno, Lithuania, 23–24 November 2017; Raupelienė, A., Ed.; Aleksandras Stulginskis University: Kauno, Lithuania, 2018; pp. 182–186. [Google Scholar] [CrossRef] [Green Version]
  18. Tokarczyk, T.; Szalińska, W. The operational drought hazard assessment scheme-performance and preliminary results. Arch. Environ. Prot. 2013, 39, 61–77. [Google Scholar] [CrossRef] [Green Version]
  19. Łabędzki, Ł.; Bąk, B. Meteorological and agricultural drought indices used in drought monitoring in Poland: A review. Meteorol. Hydrol. Water Manag. 2014, 2, 3–14. [Google Scholar] [CrossRef] [Green Version]
  20. Żarski, J.; Dudek, S.; Kuśmierek-Tomaszewska, R.; Rolbiecki, R.; Rolbiecki, S. Forecasting effects of plants irrigation based on selected meteorological and agricultural drought indices. Annu. Set Environ. Prot. 2013, 15, 2185–2203. (In Polish) [Google Scholar]
  21. Łabędzki, L.; Bąk, B. Impact of meteorological drought on crop water deficit and crop yield reduction in Polish agriculture. J. Water Land Dev. 2017, 34, 181–190. [Google Scholar] [CrossRef]
  22. Kundzewicz, Z.W.; Kozyra, J. Reducing impacts of climatic threats to agriculture and rural area. Pol. J. Agron. 2011, 7, 68–81. (In Polish) [Google Scholar]
  23. Zhang, L.; Song, W.; Song, W. Assessment of Agricultural Drought Risk in the Lancang-Mekong Region, South East Asia. Int. J. Environ. Res. Public Health 2020, 17, 6153. [Google Scholar] [CrossRef]
  24. Meza, I.; Siebert, S.; Döll, P.; Kusche, J.; Herbert, C.; Eyshi Rezaei, E.; Nouri, H.; Gerdener, H.; Popat, E.; Frischen, J.; et al. Global-scale drought risk assessment for agricultural systems. Nat. Hazards Earth Syst. Sci. 2020, 20, 695–712. [Google Scholar] [CrossRef] [Green Version]
  25. Park, S.; Sur, C.; Kim, J.; Choi, S.; Lee, J.; Kim, T. Projected drought risk assessment from water balance perspectives in a changing climate. Int. J. Climatol. 2021, 41, 2765–2777. [Google Scholar] [CrossRef]
  26. Cunningham, C. Characterization of dry spells in Southeastern Brazil during the monsoon season. Int. J. Climatol. 2020, 40, 4609–4621. [Google Scholar] [CrossRef]
  27. Kim, J.S.; Park, S.Y.; Hong, H.P.; Chen, J.; Choi, S.J.; Kim, T.W.; Lee, J.H. Drought risk assessment for future climate projections in the Nakdong River Basin, Korea. Int. J. Climatol. 2020, 40, 4528–4540. [Google Scholar] [CrossRef]
  28. Przybylak, R.; Oliński, P.; Koprowski, M.; Filipiak, J.; Pospieszyńska, A.; Chorążyczewski, W.; Puchałka, R.; Dąbrowski, H.P. Drought in the area of Polnd in recent centuries in the light of multi-proxy data. Clim. Past 2020, 16, 627–661. [Google Scholar] [CrossRef] [Green Version]
  29. Ganguli, P.; Ganguly, A.R. Space-time trends in U.S. meteorological droughts. J. Hydrol. Reg. Stud. 2016, 8, 235–259. [Google Scholar] [CrossRef] [Green Version]
  30. David, V.; Davidová, T. Identification and frequency analysis of drought events in the Blanice River catchment (Czech Republic). In Drought: Research and Science-Policy Interfacing; Andreu, J., Solera, A., Paredes-Arquiola, J., Haro-Monteagudo, D., van Lanen, H., Eds.; CRC Press: Boca Raton, FL, USA, 2015; pp. 177–182. [Google Scholar]
  31. Haslinger, K.; Blöschl, G. Space-time patterns of meteorological drought events in the European Greater Alpine Region over the past 210 years. Water Resour. Res. 2017, 53, 9807–9823. [Google Scholar] [CrossRef] [Green Version]
  32. Chiang, F.; Mazdiyasni, O.; AghaKouchak, A. Evidence of anthropogenic impacts on global drought frequency, duration, and intensity. Nat. Commun. 2021, 12, 2754. [Google Scholar] [CrossRef] [PubMed]
  33. Szyga-Pluta, K. Variability of drought occurrence during growing season in Poland in years 1966–2015. Przegl. Geofiz. 2018, 1, 51–66. (In Polish) [Google Scholar]
  34. Kuśmierek-Tomaszewska, R.; Dudek, S.; Żarski, J.; Januszewska-Klapa, K. Temporal variability of drought in field crops in the region of Kujawsko-Pomorskie, Poland. Res. Rural Develop. 2018, 2, 62–68. [Google Scholar] [CrossRef]
  35. Kuśmierek-Tomaszewska, R.; Dudek, S.; Żarski, J. Detection of change in drought frequency in Bydgoszcz region, central Poland. In Proceedings of the 8th International Scientific Conference Rural Development, Bioeconomy Challenges, Kauno, Lithuania, 23–24 November 2017; Raupelienė, A., Ed.; Aleksandras Stulginskis University: Kauno, Lithuania, 2018; pp. 652–656. [Google Scholar] [CrossRef] [Green Version]
  36. Kuśmierek-Tomaszewska, R.; Żarski, J.; Dudek, S. Assessment of Irrigation Needs in Sugar Beet (Beta vulgaris L.) in Temperate Climate of Kujawsko-Pomorskie Region (Poland). Agronomy 2019, 9, 814. [Google Scholar] [CrossRef] [Green Version]
  37. Czarnecka, M.; Nidzgorska-Lencewicz, M. Multiannual variability of seasonal precipitation in Poland. Water Environ. Rural Areas 2012, 12, 45–60. (In Polish) [Google Scholar]
  38. Żarski, J.; Dudek, S.; Kuśmierek-Tomaszewska, R.; Bojar, W.; Knopik, L.; Żarski, W. Agro-climatological assessment of the growing season rainfall in the Bydgoszcz region. Infr. Ecol. Rural Areas 2014, II/3, 643–656. (In Polish) [Google Scholar]
  39. Tomczyk, A.M.; Szyga-Pluta, K. Variability of thermal and precipitation conditions in the growing season in Poland in the years 1966–2015. Theor. Appl. Climatol. 2019, 135, 1517–1530. [Google Scholar] [CrossRef] [Green Version]
  40. Somorowska, U. Changes in Drought Conditions in Poland over the Past 60 Years Evaluated by the Standardized Precipitation-Evapotranspiratiom Index. Acta Geophys. 2016, 64, 2530–2549. [Google Scholar] [CrossRef] [Green Version]
  41. Somorowska, U. Increase in the hydrological drought risk in different geographical regions of Poland in the 20th century. Pr. Studia Geogr. 2009, 43, 97–114. (In Polish) [Google Scholar]
  42. Jania, J.A.; Zwoliński, Z. Extreme meteorological, hydrological and geomorphological events in Poland. Landf. Anal. 2011, 15, 51–64. (In Polish) [Google Scholar]
  43. Skowera, B. Changes of hydrothermal conditions in the Polish area (1971–2010). Fragm. Agronom. 2014, 31, 74–87. (In Polish) [Google Scholar]
  44. Wibig, J. Moisture conditions in Poland view of the SPEI index. Water Environ. Rural Areas 2012, 12, 329–340. (In Polish) [Google Scholar]
  45. Ziernicka-Wojtaszek, A. Climatic water balance in Poland in the light of the present day climate change. Water Environ. Rural Areas 2015, 15, 93–100. (In Polish) [Google Scholar]
  46. Ziernicka-Wojtaszek, A.; Kopcińska, J. Variation in Atmospheric Precipitation in Poland in the Years 2001–2018. Atmosphere 2020, 11, 794. [Google Scholar] [CrossRef]
  47. IPCC. Climate Change 2014: Synthesis Report; Contribution of Working Groups I, II and III to the Fifth Assessment Report of the Intergovernmental Panel on Climate Change; Core Writing Team, Pachauri, R.K., Meyer, L.A., Eds.; IPCC: Geneva, Switzerland, 2014; p. 151. Available online: https://www.ipcc.ch/report/ar5/syr/ (accessed on 25 May 2021).
  48. Kuchar, L.; Iwański, S. Rainfall evaluation for crop production until 2050–2060 and selected climate change scenarios for north central Poland. Infr. Ecol. Rural Areas 2013, 2/I, 187–200. (In Polish) [Google Scholar]
  49. Kuchar, L.; Iwański, S.; Diakowska, E.; Gąsiorek, E. Simulation of hydrothermal conditions for crop production purpose until 2050–2060 and selected climate change scenarios for North Central Poland. Infr. Ecol. Rural Areas 2015, II/1, 319–334. (In Polish) [Google Scholar] [CrossRef]
  50. Cisco, G.; Gatto, A. Climate Justice in an Intergenerational Sustainability Framework: A Stochastic OLG Model. Economies 2021, 9, 47. [Google Scholar] [CrossRef]
  51. McKee, T.B.; Doesken, N.J.; Kleist, J. The relationship of drought frequency and duration to time scales. In Proceedings of the Eighth Conference on Applied Climatology, Anaheim, CA, USA, 17–22 January 1993; pp. 179–184. [Google Scholar]
  52. Łabędzki, L.; Bąk, B. Standardized climatic water balance as drought index. Acta Agrophys. 2004, 3, 117–124. (In Polish) [Google Scholar]
  53. Łabędzki, L.; Bąk, B. Monitoring and forecasting the course and impact of water deficit in rural areas. Infr. Ecol. Rural Areas 2013, II/1, 65–76. (In Polish) [Google Scholar]
  54. Tokarczyk-Dorociak, K.; Sylla, M. Integrating ecosystem service assessment as a tool to support decision-making in the framework of environmental impact assessment. Ekonom. Środ. 2017, 63, 8–17. [Google Scholar]
  55. Dzieżyc, H.; Chmura, K.; Dmowski, Z. Determination of the effect of precipitation on the yield of very early and early potatoes in southern Poland. Water Environ. Rural Areas 2012, 12, 133–141. [Google Scholar]
  56. Filipek-Mazur, B.; Lepiarczyk, A.; Tabak, M. Nitrogen and sulphur fertilization on yielding and zinc content in seeds of winter rape ‘baldur’ cultivar. Ecol. Chem. Eng. A 2013, 20, 1351–1358. [Google Scholar] [CrossRef]
  57. Radzka, E.; Jankowski, K.; Jankowska, J. Effects of rainfall shortage and climatic water balance on agriculture. Appl. Ecol. Environ. Res. 2019, 17, 7667–7678. [Google Scholar] [CrossRef]
  58. Radzka, E.; Lenartowicz, T. Rainfall deficit and excess rainfall during vegetation of early potatoes varieties in central-eastern Poland (1971–2005). Nauka Przyr. Technol. 2015, 9, 25. [Google Scholar] [CrossRef]
  59. Garnier, B.J. Podstawy Klimatologii (Basics of Climatology); IMGW: Warszawa, Poland, 1996; pp. 97–114. (In Polish) [Google Scholar]
  60. Erfurt, M.; Glaser, R.; Blauhut, V. Changing impacts and societal responses to drought in southwestern Germany since 1800. Reg. Environ. Chang. 2019, 19, 1–13. [Google Scholar] [CrossRef] [Green Version]
  61. Sheffield, J.; Wood, E.F.; Roderick, M.L. Little change in global drought over the past 60 years. Nature 2012, 491, 435–438. [Google Scholar] [CrossRef]
  62. Spinoni, J.; Naumann, G.; Vogt, J.; Barbosa, P. European drought climatologies and trends based on a multiindicator approach. Glob. Planet. Chang. 2015, 127, 50–57. [Google Scholar] [CrossRef]
  63. Glaser, R.; Kahle, M. Reconstructions of droughts in Germany since 1500—Combining hermeneutic information and instrumental records in historical and modern perspectives. Clim. Past 2020, 16, 1207–1222. [Google Scholar] [CrossRef]
  64. Ionita, M.; Nagavciuc, V. Changes in drought features at the European level over the last 120 years. Nat. Hazards Earth Syst. Sci. 2021, 21, 1685–1701. [Google Scholar] [CrossRef]
  65. Utkuzova, D.N.; Han, V.M.; Vil’fand, R.M. Statistical analysis of extreme drought and wet events in Russia. Atmos. Ocean. Opt. 2015, 28, 336–346. [Google Scholar] [CrossRef]
  66. Karamuz, E.; Bogdanowicz, E.; Senbeta, T.B.; Napiórkowski, J.J.; Romanowicz, R.J. Is It a Drought or Only a Fluctuation in Precipitation Patterns?—Drought Reconnaissance in Poland. Water 2021, 13, 807. [Google Scholar] [CrossRef]
  67. Brunner, M.I.; Swain, D.L.; Gilleland, E.; Wood, A.W. Increasing importance of temperature as a contributor to the spatial extent of streamflow drought. Environ. Res. Lett. 2021, 16, 024038. [Google Scholar] [CrossRef]
  68. Pereira, V.R.; Blain, G.C.; Heuminski de Avila, A.M.; de Matos Pires, R.C.; Pinto, H.S. Impacts of climate change on drought: Changes to drier conditions at the beginning of the crop growing season in southern Brazil. Bragantia 2018, 77, 201–211. [Google Scholar] [CrossRef] [Green Version]
  69. Gornall, J.; Betts, R.; Burke, E.; Clark, R.; Camp, J.; Willett, K.; Wiltshire, A. Implications of climate change for agricultural productivity in the early twenty-first century. Philos. Trans. R Soc. Lond. B Biol. Sci. 2010, 365, 2973–2989. [Google Scholar] [CrossRef]
  70. Teegavarapu, R.S. Changes and Trends in Precipitation Extremes and Characteristics: Links to Climate Variability and Change. In Trends and Changes in Hydroclimatic Variables; Teegavarapu, R., Ed.; Elsevier: Berlin/Heidelberg, Germany, 2019; pp. 91–148. [Google Scholar] [CrossRef]
  71. AghaKouchak, A.; Mirchi, A.; Madani, K.; Di Baldassarre, G.; Nazemi, A.; Alborzi, A.; Anjileli, H.; Azarderakhsh, M.; Chiang, F.; Hassanzadeh, E.; et al. Anthropogenic drought: Definition, challenges, and opportunities. Rev. Geophys. 2021, 59, e2019RG000683. [Google Scholar] [CrossRef]
  72. Van Loon, A.F.; Gleeson, T.; Clark, J.; Van Dijk, A.I.J.M.; Stahl, K.; Hannaford, J.; Di Baldassarre, G.; Teuling, A.J.; Tallaksen, L.M.; Uijlenhoet, R.; et al. Drought in the anthropocene. Nat. Geosci. 2016, 9, 89–91. [Google Scholar] [CrossRef] [Green Version]
  73. Wszelaczyńska, E.; Pobereżny, J.; Dudek, S.; Kuśmierek-Tomaszewska, R.; Żarski, J.; Pawelzik, E. The effects of fertilizers, irrigation and storage on the properties of potato tubers and their constituent starches. Starch/Stärke 2015, 67, 478–492. [Google Scholar] [CrossRef]
  74. Rolbiecki, S.; Rolbiecki, R.; Kuśmierek-Tomaszewska, R.; Dudek, S.; Żarski, J.; Rzekanowski, C. Requirements and effects of drip irrigation of mid-early potato on a very light soil in moderate climate. Fresenius Environ. Bull. 2015, 24, 3895–3902. [Google Scholar]
  75. Dudek, S.; Kuśmierek-Tomaszewska, R.; Żarski, J. Forecasting production effects of irrigated faba bean (Vicia faba var. minor) depending on drought levels. Latvia Res. Rural Dev. 2018, 2, 77–82. [Google Scholar] [CrossRef]
  76. Żarski, J.; Kuśmierek-Tomaszewska, R.; Dudek, S. Needs and Effects of Use Sprinkler Irrigation Systems in Crops Production in Central Poland on the Example of Spring Malting Barley (Hordeum vulgare L.). In Infrastructure and Environment; Krakowiak-Bal, A., Vaverkova, M., Eds.; Springer: Cham, Switzerland, 2019; pp. 46–52. [Google Scholar] [CrossRef]
  77. Żarski, J.; Kuśmierek-Tomaszewska, R.; Dudek, S. Impact of Irrigation and Fertigation on the Yield and Quality of Sugar Beet (Beta vulgaris L.) in a Moderate Climate. Agronomy 2020, 10, 166. [Google Scholar] [CrossRef] [Green Version]
  78. Kuśmierek-Tomaszewska, R.; Żarski, J. The Effects of Plant Irrigation in Poland. In Management of Water Resources in Poland; Zeleňáková, M., Kubiak-Wójcicka, K., Negm, A.M., Eds.; Springer: Cham, Switzerland, 2021; pp. 379–393. [Google Scholar] [CrossRef]
  79. Łabędzki, L.; Bąk, B.; Kanecka-Geszke, E.; Kasperska-Wołowicz, W.; Smarzyńska, K. Relationship between meteorological and agricultural drought in different agroclimatic regions in Poland. Water Environ. Rural. Areas Rozpr. Monogr. 2008, 25, 1–136. (In Polish) [Google Scholar]
  80. Kumar, R.; Musuuza, J.L.; Van Loon, A.F.; Teuling, A.J.; Barthel, R.; Ten Broek, J.; Mai, J.; Samaniego, L.; Attinger, S. Multiscale evaluation of the standardized precipitation index as a groundwater drought indicator. Hydrol. Earth Syst. Sci. Discuss. 2015, 12, 7405–7436. [Google Scholar] [CrossRef]
  81. Agovino, M.; Cerciello, M.; Gatto, A. Policy efficiency in the field of food sustainability. The adjusted food agriculture and nutrition index. J. Environ. Manag. 2018, 218, 220–233. [Google Scholar] [CrossRef]
Figure 1. Occurrence of meteorological droughts (mD) determined on the base of the SPI during the period of active plant growth and development (May–August) in the region of Bydgoszcz in 1961–1990. The colors illustrate the level of drought intensity.
Agriculture 11 00855 g001
Figure 2. Occurrence of meteorological droughts (mD) determined on the base of the SPI during the period of active plant growth and development (May–August) in the region of Bydgoszcz in 1991–2020. The colors illustrate the level of drought intensity.
Agriculture 11 00855 g002
Figure 3. Variability over time of the meteorological drought index (SPI) during the period of active plant growth and development (May–August) in the region of Bydgoszcz in 1961–2020.
Agriculture 11 00855 g003
Figure 4. Variability over time of average air temperature (°C) during the period of active plant growth and development (May–August) in the region of Bydgoszcz in 1961–2020.
Agriculture 11 00855 g004
Figure 5. Variability over time of the agricultural drought index (PAdef) during the period of active plant growth and development in the region of Bydgoszcz (May–August) in 1961–2020.
Agriculture 11 00855 g005
Figure 6. The linear relationship between the meteorological drought index and agricultural drought in the period of active plant growth and development (May–August) in the region of Bydgoszcz in 1961–2020.
Agriculture 11 00855 g006
Table 1. Meteorological drought classes according to the standardized precipitation index (SPI) [53].
Class of DroughtSPIGraphic Designation
Slightly dry−0.50–−0.991
Moderate dry−1.00–−1.492
Very dry−1.50–−1.993
Extremely dry≤−2.004
The colors illustrate the level of drought intensity.
Table 2. The number and frequency of meteorological droughts (mD) during the period of active plant growth in the region of Bydgoszcz in 1961–2020.
Class of mDmD in 1961–2020
MayJuneJulyAugustMay–JuneJune–JulyJuly–AugustMay–August
1611527757
2610596687
340223424
410312020
Total1721151418171718
% mD 1–428.335.025.023.330.028.328.330.0
% mD 3–48.30.08.35.08.36.76.76.7
The colors illustrate the level of drought intensity.
Table 3. Extreme values and regression equations characterizing changes in SPI values in the period 1961–2020 with correlation coefficients characterizing a linear dependence.
Month/PeriodMaxMinY–Intercept
(a)
Correlation Coefficient (r)
May1.77−2.320.00690.1208
June3.35−1.480.00110.0200
July1.62−2.540.01220.2138
August2.97−2.380.01260.2207
May–June2.67−2.290.00630.1109
June–July3.03−1.980.00820.1425
July–August2.15−2.360.01720.3003 *
May–August2.44−1.930.01560.2733 *
* correlation statistically significant at the p–level of 0.05.
Table 4. Extreme values and regression equations characterizing changes in the average air temperature in the period 1961–2020 with correlation coefficients characterizing a linear dependence.
Month/PeriodMaxMinY–Intercept
(a)
Correlation Coefficient (r)
May13.017.39.60.0226
June16.521.914.00.0145
July18.222.715.10.0358
August17.720.915.10.0304
May–June14.717.612.00.0186
June–July17.420.214.70.0253
July–August18.021.015.50.0331
May–August16.418.913.70.0259
Table 5. Extreme values and regression equations characterizing changes of the agricultural drought index (PAdef) in the period 1961–2020 with correlation coefficients characterizing a linear dependence.
Month/PeriodMaxMinY–Intercept
(a)
Correlation Coefficient (r)
May−22.436.0−75.30.1304
June−19.5192.0−86.80.0070
July−19.671.8−107.00.3056
August−28.5129.5−87.50.3208
May–June−41.9152.3−145.50.1374
June–July−39.2263.8−157.40.3126
July–August−48.1102.4−170.30.6263
May–August−90.0187.4−262.60.7637
Table 6. Regression equations allowing determination of the agricultural drought index based on the SPI with correlation coefficients characterizing the strength of a linear relationship.
Month/PeriodY–Intercept
(a)
Slope
(b)
Correlation Coefficient (r)
May29.517−22.3700.9540
June42.847−19.5390.9598
July40.514−19.6160.9686
August37.267−28.4880.9607
May–June50.264−41.9080.9609
June–July70.137−39.1550.9687
July–August56.497−48.1050.9750
May–August87.598−90.0130.9747
Publisher’s Note: MDPI stays neutral with regard to jurisdictional claims in published maps and institutional affiliations.

