Article

Optimization of Profit for Pasture-Based Beef Cattle and Sheep Farming Using Linear Programming: Young Beef Cattle Production in New Zealand

1
Animal Science, School of Agriculture and Environment, Massey University, Palmerston North 4442, New Zealand
2
Applied Biology, College of Natural and Computational Sciences, University of Gondar, Gondar P.O. Box 196, Ethiopia
*
Author to whom correspondence should be addressed.
Agriculture 2021, 11(9), 849; https://doi.org/10.3390/agriculture11090849
Submission received: 7 August 2021 / Revised: 2 September 2021 / Accepted: 2 September 2021 / Published: 5 September 2021
(This article belongs to the Section Farm Animal Production)

Abstract

:
In New Zealand, surplus dairy-origin calves not needed as replacement or for beef cattle farms requirements for finishing are commercially slaughtered within two weeks of age. This system has perceived ethical issues which can potentially negatively affect the dairy industry. Therefore, a young beef cattle production system to maximize the use of excess calves within the land size constraint is considered as an alternative to a traditional 18 to 33-months slaughtering system. The current study examined the effects of young beef cattle production with slaughter ages at 8 to 14 months on pasture utilization, farm profitability and selling policy on class 5, intensive finishing sheep and beef cattle farms in New Zealand. A linear programming model that had previously been developed for this farm class (optimized traditional beef cattle system) was modified to include a young beef cattle slaughter system and identified the carrying capacity for young and traditional beef cattle and the selling policy required to optimize pasture utilization and farm profitability. Systems with young beef cattle slaughtered at 8, 10, 12 or 14-months of age were simulated without (Scenario I) or with (Scenario II) decreasing the number of traditional beef cattle. Daily per head energy demand for maintenance and live weight change was estimated and converted to kg DM/head on a bimonthly basis. Carcasses from young beef cattle were processed as one class under manufacturing beef price (NZ$4.50). The modified young and traditional beef cattle slaughtering system maintained an extra 6% and 35% beef cattle in Scenario I and Scenario II respectively, and finished 90% and 84% of traditional beef cattle before the second winter. Pasture supplied 98% of the feed demand for the beef cattle activities and 79–83% of that was consumed. Mixed young and traditional beef cattle finishing scenarios returned 2% less gross farm revenue per hectare (GFR/ha). However, earnings before tax per hectare (ETB/ha) in Scenario I and Scenario II were 15–25% greater than that of the optimized traditional beef cattle system, respectively. Young beef cattle production increased pasture utilization and farm profitability and increased selling options for finished beef cattle. Therefore, the young beef cattle system is a viable option for farmers and will help to reduce the need to slaughter calves within two weeks of age.

1. Introduction

New Zealand produces an average of 679,000 tonnes of beef annually [1], of which more than 80% is exported [2]. This contributes to one percent of world beef production and six percent of global beef exports [3,4]. Cattle for beef production can be sourced from beef breeds or can be of dairy origin [4,5,6,7,8,9]. Dairy-origin cattle include cull cattle at the end of their primary productive life, and heifer, steer and bull calves that are transferred to beef-finishing farms [4,6,7,10,11,12,13,14]. Cattle of dairy origin contribute 73% of annual beef production in New Zealand [1,15] with more than 50% of calves for beef finishing being sourced from dairy farms [1,15].
Approximately 4.5 million calves are born annually on New Zealand dairy farms [1,16] with 28% retained as heifer and bull replacements [1,15,17]. Of the remainder, calves will be transferred to beef and sheep farms to be used for beef cow herd replacements or for beef production with slaughter at 18 to 33 months of age. However, the majority of the calves are slaughtered at 8 to 14 days of age directly from the dairy farm, as a means of disposal [4,10,16]. In New Zealand, surplus calves slaughtered before 2 weeks of age are called “bobby calves” [1,15,16,17]. In 2020, New Zealand processed 1.9 million bobby calves [1]. The processing of bobby calves has potential animal welfare and ethical issues [18] that will likely impose a risk for the market sustainability dairy cattle industry in New Zealand [16,17,19,20].
If more bobby calves entered into beef cattle systems, ethical issues related to the bobby calf production would be reduced [16,17,20] and more beef could be supplied to meet global meat demand [21,22]. This might also provide financial opportunities for both beef and dairy cattle farmers [5,16,17,23]. However, due to resource constraints in New Zealand, in particular for grazing land, it would be unmanageable to finish all surplus dairy calves for beef at the age of 18 to 33 months. Young beef production is a possible solution which can optimize land constraints and the number of animals finished for beef [5,13,16,17,23].
The concept of young beef production in a New Zealand setting would utilize dairy-origin cattle slaughtered less than 14 months of age [24,25,26]. It would potentially allow a greater number of cattle to be managed in grazing systems for beef production and provide a faster rotation of animals from birth to slaughter [27,28]. Young beef production also has potential to reduce the environmental footprint compared to traditional beef cattle finishing systems [13,28]. Animals of a similar age are already produced in Europe and marketed under different descriptions such as Jungrindfleisch (Austria, German), rose veal (Ireland), or carne de ternera (Spain) [10,29].
However, there is currently no study which examines the effects of young beef cattle production compared to the existing traditional beef cattle production systems in terms of feed consumption, animal productivity and farm profitability for pasture-based beef cattle finishing farms in New Zealand. Without this knowledge, farmers would not have the confidence to change to a young beef cattle system or a mix of young and traditional beef cattle on sheep and beef cattle farms.
Therefore, this study was initiated with specific objectives of examining feed demand and utilization, animal performance and farm profitability in a pasture-based production system that incorporates young beef cattle slaughtered at the ages of 8, 10, 12 or 14 months on Class 5 sheep and beef cattle farms. A profit maximization model that had previously been developed [30] for this farm class was modified to include young beef cattle with or without decreasing traditional beef cattle within the system to identify the optimum number of young and traditional beef cattle and the marketing policies for the given feed resources to optimize feed utilization and farm profitability. The output from this new model will provide insight to farm advisors and farmers regarding to the potential use of young beef cattle finishing system under New Zealand’s pasture-based farming conditions.

2. Material and Methods

A profit maximization farm model for a Class 5 pasture-based, intensive finishing sheep and beef cattle farm in the North Island of New Zealand was developed using linear programming [30]. Detail descriptions of the model development, input and output parameters were reported by [30]. Briefly, the model was developed for a one-year horizon using bimonthly periods. This allows nonlinear pasture growth rates to be transformed into linear rates, thereby creating linear relationships between feed supply and animal demand. This also enabled daily live weight gains of growing livestock to be combined into bimonthly periods. Thus, the model enabled the calculation of the number of beef cattle and sheep in bimonthly periods based on the carrying capacity of the given feed supply and the determination of the type and number of beef cattle and sheep that should be sold at any given bimonthly period. In the model, the sheep proportion of total farm feed intake was assumed to be constant and the sheep:beef cattle ratio was fixed (50:50 respectively), which allowed the study to focus on the beef cattle aspect of the enterprise [30].
Total kilograms of pasture dry matter mass (kg DM) was the sum of residual post-grazing pasture and the net pasture accumulation in bi monthly periods [31,32,33,34]. Utilizable kg DM of pasture was estimated as functions of maximum (i.e., 2500 kg DM for beef cattle and 1800 kg DM for sheep grazing) and minimum limits (i.e., 1500 kg DM for beef cattle and 800 kg DM for sheep grazing) of the total pasture mass and utilization percent [32,33,35]. Herbage above the maximum limits, when pasture supply exceeded animal demand, was conserved as silage and utilized during winter [35]. Silage was supplied to traditional beef cattle in their second winter and mature ewes at a maximum of 30% of the total feed intake to ensure that the allocated kg DM did not exceed gut-fill capacity [36].
The current study included a range of dairy-origin young beef cattle slaughtered at 8, 10, 12 or 14 months of age on the optimized Class 5 pasture-based, intensive finishing sheep and beef cattle farm model (optimized traditional beef cattle system). Holstein-Frisian (33.1%), Jersey (8.6%) and Holstein-Frisian-Jersey crossbreed (48.5%) are the main dairy cattle breeds in New Zealand [37,38]. Dairy-origin calves with greater than 14/16 Holstein-Friesian are defined as Holstein-Friesian calves and calves with greater than 14/16 Jersey are defined as Jersey calves [38,39,40]. Friesian bulls are favored for bull finishing systems in New Zealand; thus they were not considered in this study [9,41,42]. This study focused on uncastrated male calves born from Holstein-Frisian-Jersey crossbred dams and first calving heifers for young bull beef finishing and beef breed cross dairy breed calves for young heifer and steer beef cattle finishing [7,8,38,43].

2.1. Model Scenarios

Two scenarios were considered: either with or without decreasing the number of optimized traditional beef cattle. Scenario I was based on a competitive assumption where young and traditional beef cattle were mixed and competed for a limited feed resource. In this scenario, the number of weaners and slaughtering options for traditional beef cattle were maintained the same as the optimized traditional beef cattle model. This scenario examined which class(es) of young beef cattle from heifers, steers and bulls can integrate with the existing sheep and beef cattle farm system. The subsequent effect it would have on the marketing policies of traditional beef cattle, overall feed utilization efficiency and farm profitability was examined. Scenario II replaced 25% of traditional beef cattle number with young beef cattle and studied the variations on feed utilization and farm profitability. Similarly, the slaughtering options for traditional beef cattle were maintained the same as the optimized traditional beef cattle system. The number of young beef cattle and traditional beef cattle in each of the slaughtering options were optimized for farm profitability. This scenario examined the total number of young beef cattle that could be supported with feed resource consumed by 25% of traditional beef cattle and their effect on beef cattle marketing policies. Pasture utilization and farm profitability generated from the current model were compared with the optimized traditional beef cattle and sheep model [30]. In both scenarios, the proportion of sheep feed intake was maintained the same as per the base model [30].

2.2. Young Beef Cattle Activities

Previous studies have examined the growth performance and carcass quality of young steers slaughtered at the ages of 8, 10 and 12 months [24,25,26] and the growth and carcass performance of young steers vs bulls slaughtered at 11 months of age from dairy-origin cattle in New Zealand [44]. Young steers and bulls were shown to have the same growth rate and carcass weight [44]. Thus, this study utilized live weight information for steers [25] and assumed the same live weight gains for bulls. Dairy-origin heifers were assumed to have 10% lower weaning weight and live weight gain [29,45,46] compared to male calves. To utilize excess spring pasture supply, this study extended the slaughtering ages of young beef cattle to 14 months, based on live weight gain projected from 8-, 10- and 12-month-old young beef cattle.
Four potential slaughtering ages at 8, 10, 12 or 14 months were allowed for each class of young beef cattle. This added three constraints and 9 or 12 beef cattle activities in the existing model (Table 1). Steers slaughtered at the ages of 8, 10 and 12 months attained dressing out percentages of 47, 48 and 50% [24,25], respectively; the same values were assumed for young heifer and bull beef cattle [47,48]. Similarly, young beef cattle slaughtered at the age of 14 months were given a dressing out percentage of 50%. Carcasses from young beef cattle were processed as one carcass class [25] and based on the existing carcass weight classification system in New Zealand, those animal would earn the manufacturing schedule beef price per kg carcass weight (NZ$4.50/kg carcass) [49,50].

2.3. Feed Demand Estimation for Young Beef Cattle

Per head daily metabolizable energy requirements were estimated using equations from [33]. Energy requirement for maintenance was adjusted by plus or minus 7% for pasture where MJ ME/kg DM less than or greater than 10.5, respectively [33], as per the base model [30]. Similarly, energy requirement for average daily gain was adjusted by plus or minus 10% for pasture energy density less than or higher than 11.0 MJ ME/kg DM [33], respectively. The sum of energy for maintenance and live weight change was converted into kg DM (Table 1) using the energy density of the given feed resource and multiplied by the number of days in a bimonthly period to arrive at a per head bimonthly kg DM requirement. On average, young beef cattle were given four stock units (a stock unit in New Zealand is defined as the annual feed requirement of a 55 kg ewe weaning one 28 kg lamb consuming 550 kg DM per year) [36,51].
Annual sheep and beef farm expenditure for a Class 5 intensive finishing sheep and beef cattle farm from [49] was used to estimate per stock unit farm expenditure as per the base model [30]. The per stock unit production costs were evenly distributed across the bimonthly periods (Table 1). Total farm expenditure (TFE) was computed by multiplying the per stock unit expenditure with the number of young beef cattle in each slaughtering age, their associated stock units and the number of bimonthly periods (Table 2) plus the cost of purchasing weaners at three months age (NZ$450.00/head).
Per hectare carcass outputs in both scenarios and the optimized traditional beef cattle system were estimated as total carcass weight divided by the effective land size [52]. The gross farm revenue (GFR), was estimated as the sum of revenue from sheep and beef cattle activities including young beef cattle [30]. Total farm expenditure (TFE) was subtracted from GFR to determine farm earnings before tax (EBT/farm). From that figure, gross farm revenue per hectare (GFR/ha) and per stock unit (GFR/su), earnings before tax per hectare (EBT/ha) and per stock unit (EBT/su) were derived by dividing by the effective farm area (198 ha) and total stock units, respectively [30,49].

3. Results

Scenario I and Scenario II finished a total of 212 and 270 beef cattle per year which were 6% and 35% higher compared to the optimized traditional beef cattle system (Table 3). These scenarios finished 90% and 84% of the traditional beef cattle before the second winter, respectively. In Scenario I, there were no young heifer beef cattle while 67% of the young steer and bull beef cattle were finished at the age of 10 months. In Scenario II, 55% of young beef cattle were slaughtered at the age of 8 months (Table 3). There were no steers slaughtered at 30 months of age in Scenario I as per the optimized traditional beef cattle system.
Pasture available for beef cattle grazing in spring went up to 35 kg DM/ha/day and dropped below 10 kg DM/ha/day during the winter season. In Scenario I, pasture supplied 98% of feed requirements (Figure 1). Of the total feed available for beef cattle activities, 83% was consumed.
In Scenario II, where 25% of the traditional beef cattle were replaced with young beef cattle slaughtered at the ages of 8 to 12 months, there was a feed utilization efficiency of 79% (Figure 2). This was increased to 83% when the slaughtering age of young beef cattle extended up to 14 months of age (Figure 2). Pasture provided 98% of the feed requirements of beef cattle activity in Scenario II with the rest of feed provided by silage.
On average, the optimized traditional beef cattle system, Scenario I and Scenario II produced 544.19, 549.30 and 566.41 kg carcasses per hectare per year, respectively (data not shown). At these carcass outputs, Scenario I and Scenario II had 2% less GFR/ha than that of the optimized system (Table 4). However, the average EBT/ha in Scenario I and Scenario II were 15% and 25% higher than that of the optimized traditional beef cattle system (Table 4).

4. Discussion

Raising young (8 to 14 months of age) dairy-origin beef cattle is a new beef production system being considered in New Zealand and thus understanding their growth, productivity and profitability on sheep and beef cattle farms would benefit farmers and farm advisors. This study scrutinized the feed demand and pasture utilization, growth, productivity performance and farm profitability of young beef cattle slaughtered at the ages of 8, 10, 12, 14 months on Class 5 intensive finishing sheep and beef cattle farms in New Zealand. A linear programming profit optimization model which was developed for the traditional beef cattle finishing system of this farm class [30] was modified to include a young beef cattle production system and identified the total number of young and traditional beef cattle and marketing policies for the given feed resource to maximize farm profitability and pasture utilization.
Young animals need less total feed per day for maintenance and growth [33,53,54] which enabled Scenario I and Scenario II to finish 6% and 35% more beef cattle than the optimized traditional beef cattle system. This was achieved by finishing 70% to 83% young beef cattle under 10 months of ages and more than 90% (Scenario I) and 84% (Scenario II) of traditional beef cattle before the second winter. This meant that a higher number of lightweight beef cattle can be finished with the same amount of feed resource consumed by heavier beef cattle. Previous studies conducted by [27,28,55] also identified that the young beef cattle slaughtering system allowed higher stocking rate and greater throughput of beef cattle per hectare which increases per hectare productivity. This implies a mix of young and traditional beef cattle production system would allow farmers to run a greater number of beef cattle per hectare to increase their profitability.
The current model was developed at the farm level where the pasture mass for beef cattle grazing had minimum and maximum limits between 1500 and 2500 kg DM/ha following the modelling rules imposed in the optimized traditional beef cattle system [30]. The beef cattle continuously grazed throughout the farm. However, paddock-based rotational grazing allows more flexible maximum and minimum pasture limits than continuous grazing [56,57,58,59]. Thus, partitioning the whole farm into paddocks for rotational grazing would allow beef cattle grazing below 1500 kg DM/ha during winter in individual paddocks. This practice would allow feeding of a higher number of beef cattle during winter to increase spring pasture utilization.
Finishing of 1.9 million bobby calves [1] at an average age of 24 months, would require approximately 8360 million kg DM or 760,000 ha of extra land. Alternatively, these could be finished as young beef cattle, requiring 50% less kg DM of pasture for feed. Numerical and profitability outputs of Scenario II of the current study showed a pathway to more efficient and profitable young and traditional beef cattle production system in New Zealand. Similarly, [17] reported that processing a high number of beef-cross-dairy breed calves for beef provides a pathway to a more efficient and profitable beef production system in New Zealand. This would facilitate the need to increase the proportion of selected bull semen to breed with dairy cows to modify the genetic orientation of dairy-origin cattle for beef and to make sure that fast-growing dairy-origin calves are available for young beef production [16,17]. Progeny testing evaluation of Angus and Hereford sires on improving the live weight of dairy-origin cattle by [60] has shown the use of appropriate beef sires has a potential to increase live weight and growth of cattle born on dairy farms.
Older (two years old) beef cattle are a flexible stock class due to their ability to accommodate short term feed supply changes [33]. The current study provided silage for beef cattle in their second winter at a maximum of 30% of the total kg DM. In both Scenarios I and II, silage supplied 2% of the total feed demand for beef cattle activity. The total pasture utilization of Scenario I and Scenario II of the current study was nearly the same as total feed utilization of the optimized traditional beef cattle system. A study conducted by [52] identified that young beef cattle had higher pasture utilization than older cattle. This indicates that a young beef cattle production system could be an alternative to improve pasture utilization where conserving excess pasture as silage is impractical for the reasons of high processing cost or unsuitable landscape including hill and hard hill country sheep and beef cattle farms of New Zealand [35,61,62].
Conserving the excess spring pasture as silage/hay is costly [59] and practically difficult on the majority of sheep and beef cattle farm classes in New Zealand [35,63]. Spring-born three-month-old weaners coming into the beef finishing system in November of the current study increased pasture utilization. Buying earlier-born heavier weaners (for example, October weaners) would further increase spring pasture utilization, which would assist in controlling pasture quality. This would also help to make sure that animals attained the expected slaughter weight before the traditional pasture supply decline during the winter season [54]. The current study did not consider alternative feed sources such as buying supplementary winter feed [35,52], or growing winter forage, which may allow a higher number of young beef cattle to be considered [35,63].
Mixed young and traditional beef cattle slaughtering systems in Scenario I and Scenario II increased carcass outputs per hectare by 1% and 4% respectively than that of the optimized beef cattle system. At these carcass outputs, each scenario returned 2% lower GFR/ha, however, 15 and 25% higher EBT/ha in Scenario I and Scenario II respectively compared to the optimized beef cattle system. Similarly, [52] and [17] reported that young beef cattle production can improve farm profitability. Combined, this indicates that beef cattle farmers would improve their per hectare farm profitability with less production cost by rearing young and traditional beef cattle [42].
There is no carcass classification and grading system for young beef cattle in New Zealand [26] and the current study processed them as one class [25] at manufacturing beef price (NZ$4.50) [50]. A premium price of NZ$5.00 per kg carcass by targeting different markets was simulated [24]. At this price, GFR/ha in Scenario I remain unchanged, however, Scenario II returned nearly the same GFR/ha as the optimized traditional beef cattle system (data not shown). This can be explained by variations across scenarios, where Scenario II finished 90% more young beef cattle than that of Scenario I. Earnings before tax (EBT/ha) in Scenario I and Scenario II were increased by 15% and 29% compared to the optimized traditional beef cattle farm when a price of NZ$5.00 per kg carcass was modelled (data not shown).
Young beef cattle production enabled the supply of beef cattle staring from 8 months of age. This would allow farmers to supply beef year round when finished traditional beef cattle supply in New Zealand is scarce [41,64]. This practice may also favor young beef to earn a higher price per kg carcass, by reducing competition on the beef market with traditional beef cattle carcass at the periods of year when traditional beef in short supply [41].

5. Conclusions

Young beef production enabled the modelled farm to process a higher number of beef cattle per hectare and greater throughput of beef cattle from weaning to slaughter per hectare. Beef cattle farmers in New Zealand would be able to extend their beef cattle slaughtering pattern across the year and farm profitability by including young beef cattle slaughtered between 8 to 14 months of ages. This improved pasture utilization and decreased silage use. Both scenarios resulted in lower production costs, but, higher EBT compared to the optimized traditional beef cattle system. Further studies to understand the effect of young beef cattle production on sheep:cattle ratio and the complementarity of sheep and young beef cattle would be valuable.

Author Contributions

A.H.A., H.T.B., S.T.M., P.R.K. and N.M.S. contributed to the conceptualization, methodology, software, validation, formal analysis, investigation, data curation, original draft preparation, and review and editing. S.T.M., H.T.B., P.R.K. and N.M.S. contributed to the supervision, project administration, and funding acquisition. All authors have read and agreed to the published version of the manuscript.

Funding

This research and the APC were funded by Massey University (Massey Foundation). Addisu Addis was sponsored by Massey University doctoral scholarship. We would like to thank Massey University for the financial support.

Conflicts of Interest

The authors declare no conflict of interest.

References

  1. New Zealand Statistics. Agricultural Production Statistics. 2020. Available online: http://infoshare.stats.govt.nz/ (accessed on 26 January 2021).
  2. McDermott, A.; Smeaton, D.; Sheath, G.; Dooley, A. A model of the New Zealand beef value chain: Evaluating opportunities. In Proceedings of the New Zealand Grassland Association; New Zealand Grassland Association: Dunedin, New Zealand, 2005; pp. 81–86. [Google Scholar]
  3. B+LNZ (Beef and Lamb New Zealand). 2018. Available online: https://beeflambnz.com/data-tools (accessed on 10 September 2019).
  4. Morris, S. The New Zealand beef cattle industry. In Proceedings of the New Zealand Society of Animal Production; New Zealand Society of Animal Production: Hamilton, New Zealand, 2013; pp. 1–4. [Google Scholar]
  5. French, P. Beef production from the dairy herd. In Profitability of Beef Production from the Dairy Herd; Teagasc, Johnstown Castle Research Center: Wexford, Ireland, 2010; pp. 3–6. [Google Scholar]
  6. Fennell, R.; Haynes, W.; Lynch, R.; French, P. Dairy-beef performance under three stocking rate intensities. In Advancing Knowldge for An Evolving Industry; Teagasc Crops, Environment and Land Use Research Centre: Wexford, Ireland, 2019; pp. 16–19. [Google Scholar]
  7. Coleman, L.; Hickson, R.; Schreurs, N.; Martin, N.; Kenyon, P.; Lopez-Villalobos, N.; Morris, S. Carcass characteristics and meat quality of Hereford sired steers born to beef-cross-dairy and Angus breeding cows. Meat Sci. 2016, 121, 403–408. [Google Scholar] [CrossRef]
  8. Schreurs, N.; Hickson, R.; Coleman, L.; Kenyon, P.; Martin, N.; Morris, S. Brief communication: Quality of meat from steers born to beef-cross-dairy cows and sired by Hereford bulls. In Proceedings of the New Zealand Society of Animal Production, Hamilton, New Zealand, 24–26 June 2014; pp. 229–232. [Google Scholar]
  9. Martin, N.; Schreurs, N.; Morris, S.; McDade, J.; Craigie, C.; Hickson, R. Is it possible to produce good quality meat from Holstein-Friesian bulls? N. Z. J. Ani. Sci. Prod. 2018, 78, 194–199. [Google Scholar]
  10. Domaradzki, P.; Stanek, P.; Litwińczuk, Z.; Skałecki, P.; Florek, M. Slaughter value and meat quality of suckler calves: A review. Meat Sci. 2017, 134, 135–149. [Google Scholar] [CrossRef] [PubMed]
  11. Nogalski, Z.; Wielgosz-Groth, Z.; Purwin, C.; Sobczuk-Szul, M.; Mochol, M.; Pogorzelska-Przybytek, P.; Winarski, R. Effect of slaughter weight on the carcass value of young crossbred (‘Polish Holstein Friesian’ x ’Limousin’) steers and bulls. Chil. J. Agri. Res. 2014, 74, 59–66. [Google Scholar] [CrossRef] [Green Version]
  12. Nogalski, Z.; Pogorzelska-Przybyłek, P.; Sobczuk-Szul, M.; Nogalska, A.; Modzelewska-Kapituła, M.; Purwin, C. Carcass characteristics and meat quality of bulls and steers slaughtered at two different ages. Ital. J. Ani. Sci. 2017, 17, 279–288. [Google Scholar] [CrossRef] [Green Version]
  13. Lynch, R.; French, P. Profitable dairy-beef production systems. In Advancing Knowldge for An Evolving Industry; Teagasc Crops, Environment and Land Use Research Centre: Wexford, Ireland, 2019; pp. 12–15. [Google Scholar]
  14. Berry, D. Invited review: Beef-on-dairy—The generation of crossbred beef × dairy cattle. J. Dairy Sci. 2021, 104, 3789–3819. [Google Scholar] [CrossRef]
  15. Van Selm, B.; de Boer, I.; Ledgard, S.; van Middelaar, C. Reducing greenhouse gas emissions of New Zealand beef through better integration of dairy and beef production. Agric. Syst. 2021, 186, 102936. [Google Scholar] [CrossRef]
  16. Andrew, J. Bobby Calves: The Game Changers within New Zealand’s Supply Chain. 2016. Available online: https://ruralleaders.co.nz/bobby-calves-the-game-changers-within-new-zealands-supply-chain-andrew-jolly (accessed on 16 June 2019).
  17. Cook, A. The Hunt for the Missing Billion: New Zealand’s Dairy Beef Opportunity. 2014. Available online: http://researcharchive.lincoln.ac.nz/handle/10182/6713 (accessed on 14 June 2019).
  18. Boulton, A.; Kells, N.; Beausoleil, N.; Cogger, N.; Johnson, C.; Palmer, A.; O’Connor, C. Bobby Calf Welfare Across the Supply Chain-Final Report for Year 1. 2018. Available online: http://www.mpi.govt.nz/news-and-resources/publications/ (accessed on 1 September 2021).
  19. Ferguson, D.; Schreurs, N.; Kenyon, P.; Jacob, R. Balancing consumer and societal requirements for sheep meat production: An Australasian perspective. Meat Sci. 2014, 98, 477–483. [Google Scholar] [CrossRef]
  20. Rutherford, N.; Lively, F.; Arnott, G. A Review of Beef Production Systems for the Sustainable Use of Surplus Male Dairy-Origin Calves Within the UK. Front. Vet. Sci. 2021, 8. [Google Scholar] [CrossRef]
  21. Ward, F. Future requirements for expanded beef production in New Zealand. In Proceedings of the New Zealand Society of Animal Production; New Zealand Society of Animal Production: Hamilton, New Zealand, 1968; pp. 121–130. [Google Scholar]
  22. FAO. Meat Market Review. 2018. Available online: http://www.fao.org/3/CA2129EN/ca2129en.pdf (accessed on 26 March 2018).
  23. Byrne, N.; O’Riordan, E.; Fahy, D. Grange dairy calf-to-beef system evaluation. In Profitability of Beef Production from the Dairy Herd; Teagasc Crops, Environment and Land Use Research Centre: Wexford, Ireland, 2010; pp. 46–47. [Google Scholar]
  24. Hunt, J.; Tozer, P.; Kenyon, P.; Schreurs, N.; Pike, S.; Hickson, R.; Blair, H.; Garrick, D. Brief communication: Relative cost of producing carcasses from dairy-origin steers slaughtered at 8–12 months of age in New Zealand. N. Z. J. Ani. Sci. Prod. 2019, 79, 153–155. [Google Scholar]
  25. Pike, S.; Schreurs, N.; Hickson, R.; Hunt, J.; Kenyon, P.; Garrick, D.; Blair, H.; Morris, S. Brief Communication: Meat quality of light-weight, yearling steers of dairy origin. N. Z. J. Ani. Sci. Prod. 2019, 79, 156–158. [Google Scholar]
  26. Addis, A.; Blair, H.; Morris, S.; Kenyon, P.; Schreurs, N. Prediction of the Hind-Leg Muscles Weight of Yearling Dairy-Beef Steers Using Carcass Weight, Wither Height and Ultrasound Carcass Measurements. Animals 2020, 10, 651. [Google Scholar] [CrossRef] [Green Version]
  27. Kelly, P.; Crosson, P. Economics of Beef Production from Holstein/Friesian male calves. In Profitability of Beef Production from the Dairy Herd; Teagasc, Johnstown Castle Research Center: Wexford, Ireland, 2010; pp. 36–43. [Google Scholar]
  28. Herron, J.; Curran, T.; Moloney, A.; O’Brien, D. Whole farm modelling the effect of grass silage harvest date and nitrogen fertiliser rate on nitrous oxide emissions from grass-based suckler to beef farming systems. Agric. Syst. 2019, 175, 66–78. [Google Scholar] [CrossRef]
  29. Albertí, P.; Ripoll, G.; Goyache, F.; Lahoz, F.; Olleta, J.L.; Panea, B.; Sañudo, C. Carcass characterisation of seven Spanish beef breeds slaughtered at two commercial weights. Meat Sci. 2005, 71, 514–521. [Google Scholar] [CrossRef]
  30. Addis, A.; Blair, H.; Kenyon, P.; Morris, S.; Schreurs, N. Optimization of Profit for Pasture-Based Beef Cattle and Sheep Farming Using Linear Programming: Model Development and Evaluation. Agriculture 2021, 11, 524. [Google Scholar] [CrossRef]
  31. Ridler, B.; Stachurski, L.; Brookes, I.; Holmes, C. The use of a pastoral computer model—A learning experience. In Proceedings of the New Zealand Society of Animal Production; New Zealand Society of Animal Production: Hamilton, New Zealand, 1987; pp. 43–44. [Google Scholar]
  32. Litherland, A.; Woodward, S.; Stevens, D.; McDougal, D.; Boom, C.; Knight, T.; Lambert, M. Seasonal variations in pasture quality on New Zealand sheep and beef farms. In Proceedings of the New Zealand Society of Animal Production; New Zealand Society of Animal Production: Hamilton, New Zealand, 2002; pp. 138–142. [Google Scholar]
  33. Brookes, I.; Nicol, A. The Metabolisable energy requirments of grazing livestock. In Pasture and Supplements for Grazing Animals; Rattray, P., Brookes, I., Nicol, A., Eds.; Occassional Publication No.14; New Zealand Society of Animal Production: Hamilton, New Zealand, 2017. [Google Scholar]
  34. Li, F.; Snow, V.; Holzworth, D. Modelling the seasonal and geographical pattern of pasture production in New Zealand. N. Z. J. Agric. Res. 2011, 54, 331–352. [Google Scholar] [CrossRef] [Green Version]
  35. Lambert, M.; Paine, M.; Sheath, G.; Webby, R.; Litherlandr, A.; Fraser, T.; Stevens, D. How do sheep and beef farmers manage pasture quality? In Proceedings of the New Zealand Grassland Association; New Zealand Grassland Association: Dunedin, New Zealand, 2000; pp. 117–121. [Google Scholar]
  36. Trafford, G.; Trafford, S. Farm Technical Manual; Lincon Universty: Christchurch, New Zealand, 2011. [Google Scholar]
  37. LIC & DairyNZ (Livestock Imporvement Corporation and New Zealand Dairy Statistics). 2019. Available online: https://www.lic.co.nz (accessed on 17 July 2020).
  38. Coleman, L.; Blair, H.; Lopez-Villalobos, N.; Back, P.; Hickson, R. Breed variation in tongue colour of dairy and beef-cross-dairy calves. In Proceedings of the 22nd Conference of the Association for the Advancement of Animal Breeding and Genetics (AAABG), Townsville, Australia, 2–5 July 2017; pp. 473–476. [Google Scholar]
  39. Hickson, R.; Zhang, I.; McNaughton, L. Brief communication: Birth weight of calves born to dairy cows in New Zealand. In Proceedings of the New Zealand Society of Animal Production; New Zealand Society of Animal Production: Hamilton, New Zealand, 2016; pp. 257–259. [Google Scholar]
  40. Handcock, R.; Lopez-Villalobos, N.; McNaughton, L.; Edwards, G.; Hickson, R. Growth curves of New Zealand Holstein-Friesian, Jersey and Holstein-Friesian-Jersey crossbred heifers. In Proceedings of the New Zealand Society of Animal Production; New Zealand Society of Animal Production: Hamilton, New Zealand, 2017; pp. 64–68. [Google Scholar]
  41. O’Riordan, E.; Keane, M. Bull Beef Production from Holstein/Friesian Male Calves. In Profitability of Beef Production from the Dairy Herd; Teagasc, Johnstown Castle Research Cente: Wexford, Ireland, 2010; pp. 14–26. [Google Scholar]
  42. Muir, D.; Fugle, J.; Smith, B.; Ormond, A. A comparison of bull beef production from Friesian type and selected Jersey type calves. In Proceedings of the New Zealand Grassland Association; New Zealand Grassland Association: Dunedin, New Zealand, 2001; pp. 203–207. [Google Scholar]
  43. Collier, K.; Hickson, R.; Schreurs, N.; Martin, N.; Kenyon, P.; Morris, S. Growth rate and carcass characteristics of Simmental- and Angus-sired steers born to Angus and Angus-cross-dairy cows. In Proceedings of the New Zealand Society of Animal Production; New Zealand Society of Animal Production: Hamilton, New Zealand, 2015; pp. 15–19. [Google Scholar]
  44. Nakitari, J. Growth, Carcass and Meat Quality Atrributtes of Dairy-Beef Bulls and Steers Slaugthered at Eleven Months of Age. Master’s Thesis, Massey University, Palmerston North, New Zealand, 2021. under review. [Google Scholar]
  45. Albertí, P.; Panea, B.; Sañudo, C.; Olleta, J.L.; Ripoll, G.; Ertbjerg, P.; Christensen, M.; Gigli, S.; Failla, S.; Concetti, S.; et al. Live weight, body size and carcass characteristics of young bulls of fifteen European breeds. Liv. Sci. 2008, 114, 19–30. [Google Scholar] [CrossRef]
  46. Blanco, M.; Ripoll, G.; Delavaud, C.; Casasús, I. Performance, carcass and meat quality of young bulls, steers and heifers slaughtered at a common body weight. Liv. Sci. 2020, 240, 104156. [Google Scholar] [CrossRef]
  47. Hedrick, H.; Thompson, G.; Krause, G. Comparison of Feedlot Performance and Carcass Characteristics of Half-Sib Bulls, Steers and Heifers. J. Ani. Sci. 1969, 29, 687–694. [Google Scholar] [CrossRef]
  48. Zinn, D.; Durham, R.; Hedrick, H. Feedlot and Carcass Grade Characteristics of Steers and Heifers as Influenced by Days on Feed. J. Ani. Sci. 1970, 31, 302–306. [Google Scholar] [CrossRef]
  49. B+LNZ (Beef and Lamb New Zealand): Economic Service. 2019. Available online: https://beeflambnz.com/data-tools/benchmark-your-farm (accessed on 22 December 2019).
  50. Charteris, P.; Garrick, D.; Morris, S. New Zealand beef industry structure and opportunities to improve income. In Proceedings of the New Zealand Society of Animal Production; New Zealand Society of Animal Production: Hamilton, New Zealand, 1998; pp. 228–230. [Google Scholar]
  51. Farrell, L.; Tozer, P.; Kenyon, P.; Ramilan, T.; Cranston, L. The effect of ewe wastage in New Zealand sheep and beef farms on flock productivity and farm profitability. Agric. Syst. 2019, 174, 125–132. [Google Scholar] [CrossRef]
  52. Ashfield, A.; Wallace, M.; Prendiville, R.; Crosson, P. Bioeconomic modelling of male Holstein-Friesian dairy calf-to-beef production systems on Irish farms. Ir. J. Agric. Food Res. 2014, 53, 133–147. [Google Scholar]
  53. Do Prado, I.; Eiras, C.; Fugita, C.; Passetti, R.; Ornaghi, M.; Rivaroli, D.; Pinto, A.; Moletta, J. Animal Performance and Carcass Characteristics of Bulls (1/2 Purunã vs 1/2 Canchim) Slaughtered at 16 and 22 Months Old, and Three Different Weights. Asian-Aust. J. Ani. Sci. 2015, 28, 612–619. [Google Scholar] [CrossRef] [PubMed] [Green Version]
  54. Gibbs, S.; Saldias, B.; White, J.; Walsh, D.; Stocker, N.; Trotter, C.; Fisher, B.; Fisher, A.; Banks, B.; Hodge, S. A comparison of liveweight gain of two groups of weaners of different entry liveweight in an ad libitum fodder beet feeding system for finishing beef cattle. J. N. Z. Grassl. 2015, 77, 23–28. [Google Scholar] [CrossRef]
  55. McRae, A. Historical and practical aspects of profitability in commercial beef production systems. In Proceedings of the New Zealand Grassland Association; New Zealand Grassland Association: Dunedin, New Zealand, 2003; pp. 29–34. [Google Scholar]
  56. Boswell, C.; Cranshaw, L. Mixed grazing of cattle and sheepp. In Proceedings of the New Zealand Society of Animal Production; New Zealand Society of Animal Production: Hamilton, New Zealand, 1978; pp. 116–120. [Google Scholar]
  57. Smeal, M.; Nicholls, P.; Robinson, G.; Bowler, J.; Webb, R.; Walker, K. The effects of grazing management systems on growth and nematode infections of beef cattle. Aust. J. Agric. Res. 1981, 32, 825–837. [Google Scholar] [CrossRef]
  58. Conway, A.; Killen, L. A linear programming model of grassland management. Agric. Syst. 1987, 25, 51–71. [Google Scholar] [CrossRef]
  59. Undersander, D.; Albert, B.; Cosgrove, D.; Johnson, D.; Peterson, P. Pastures for Profit: A Guide to Rotational Grazing; Cooperative Extensiton Publications; University of Wisconsin-Extension: Madison, Wisconsin, USA, 2002. [Google Scholar]
  60. Martín, N.; Schreurs, N.; Morris, S.; López-Villalobos, N.; McDade, J.; Hickson, R. Sire Effects on Post-Weaning Growth of Beef-Cross-Dairy Cattle: A Case Study in New Zealand. Animals 2020, 10, 2313. [Google Scholar] [CrossRef]
  61. Gray, D.; Reid, J.; Kemp, P.; Brookes, I.; Horne, D.; Kenyon, P.; Matthew, C.; Morris, S.; Valentine, I. Controlling pasture quality on hill country-key decisions and techniques. Agron. N. Z. 2004, 34, 73–82. [Google Scholar]
  62. Daniell, D.; Buckley, S. How to optimise pasture production off uncultivatable hill country. J. N. Z. Grassl. 2015, 72, 57–60. [Google Scholar] [CrossRef]
  63. Carracelas, J.; Boom, C.; Litherland, A.; King, W.; Williams, I. Systems and economic analysis of use of maize silage within pasture-based beef production. In Proceedings of the New Zealand Society of Animal Production; New Zealand Society of Animal Production: Hamilton, Australia, 2008; pp. 63–66. [Google Scholar]
  64. Brennan, P. Bull Beef Production from Holstein/Friesian Male Calves. In Profitability of Beef Production from the Dairy Herd; Teagasc, Johnstown Castle Research Center: Wexford, Ireland, 2010; pp. 7–13. [Google Scholar]
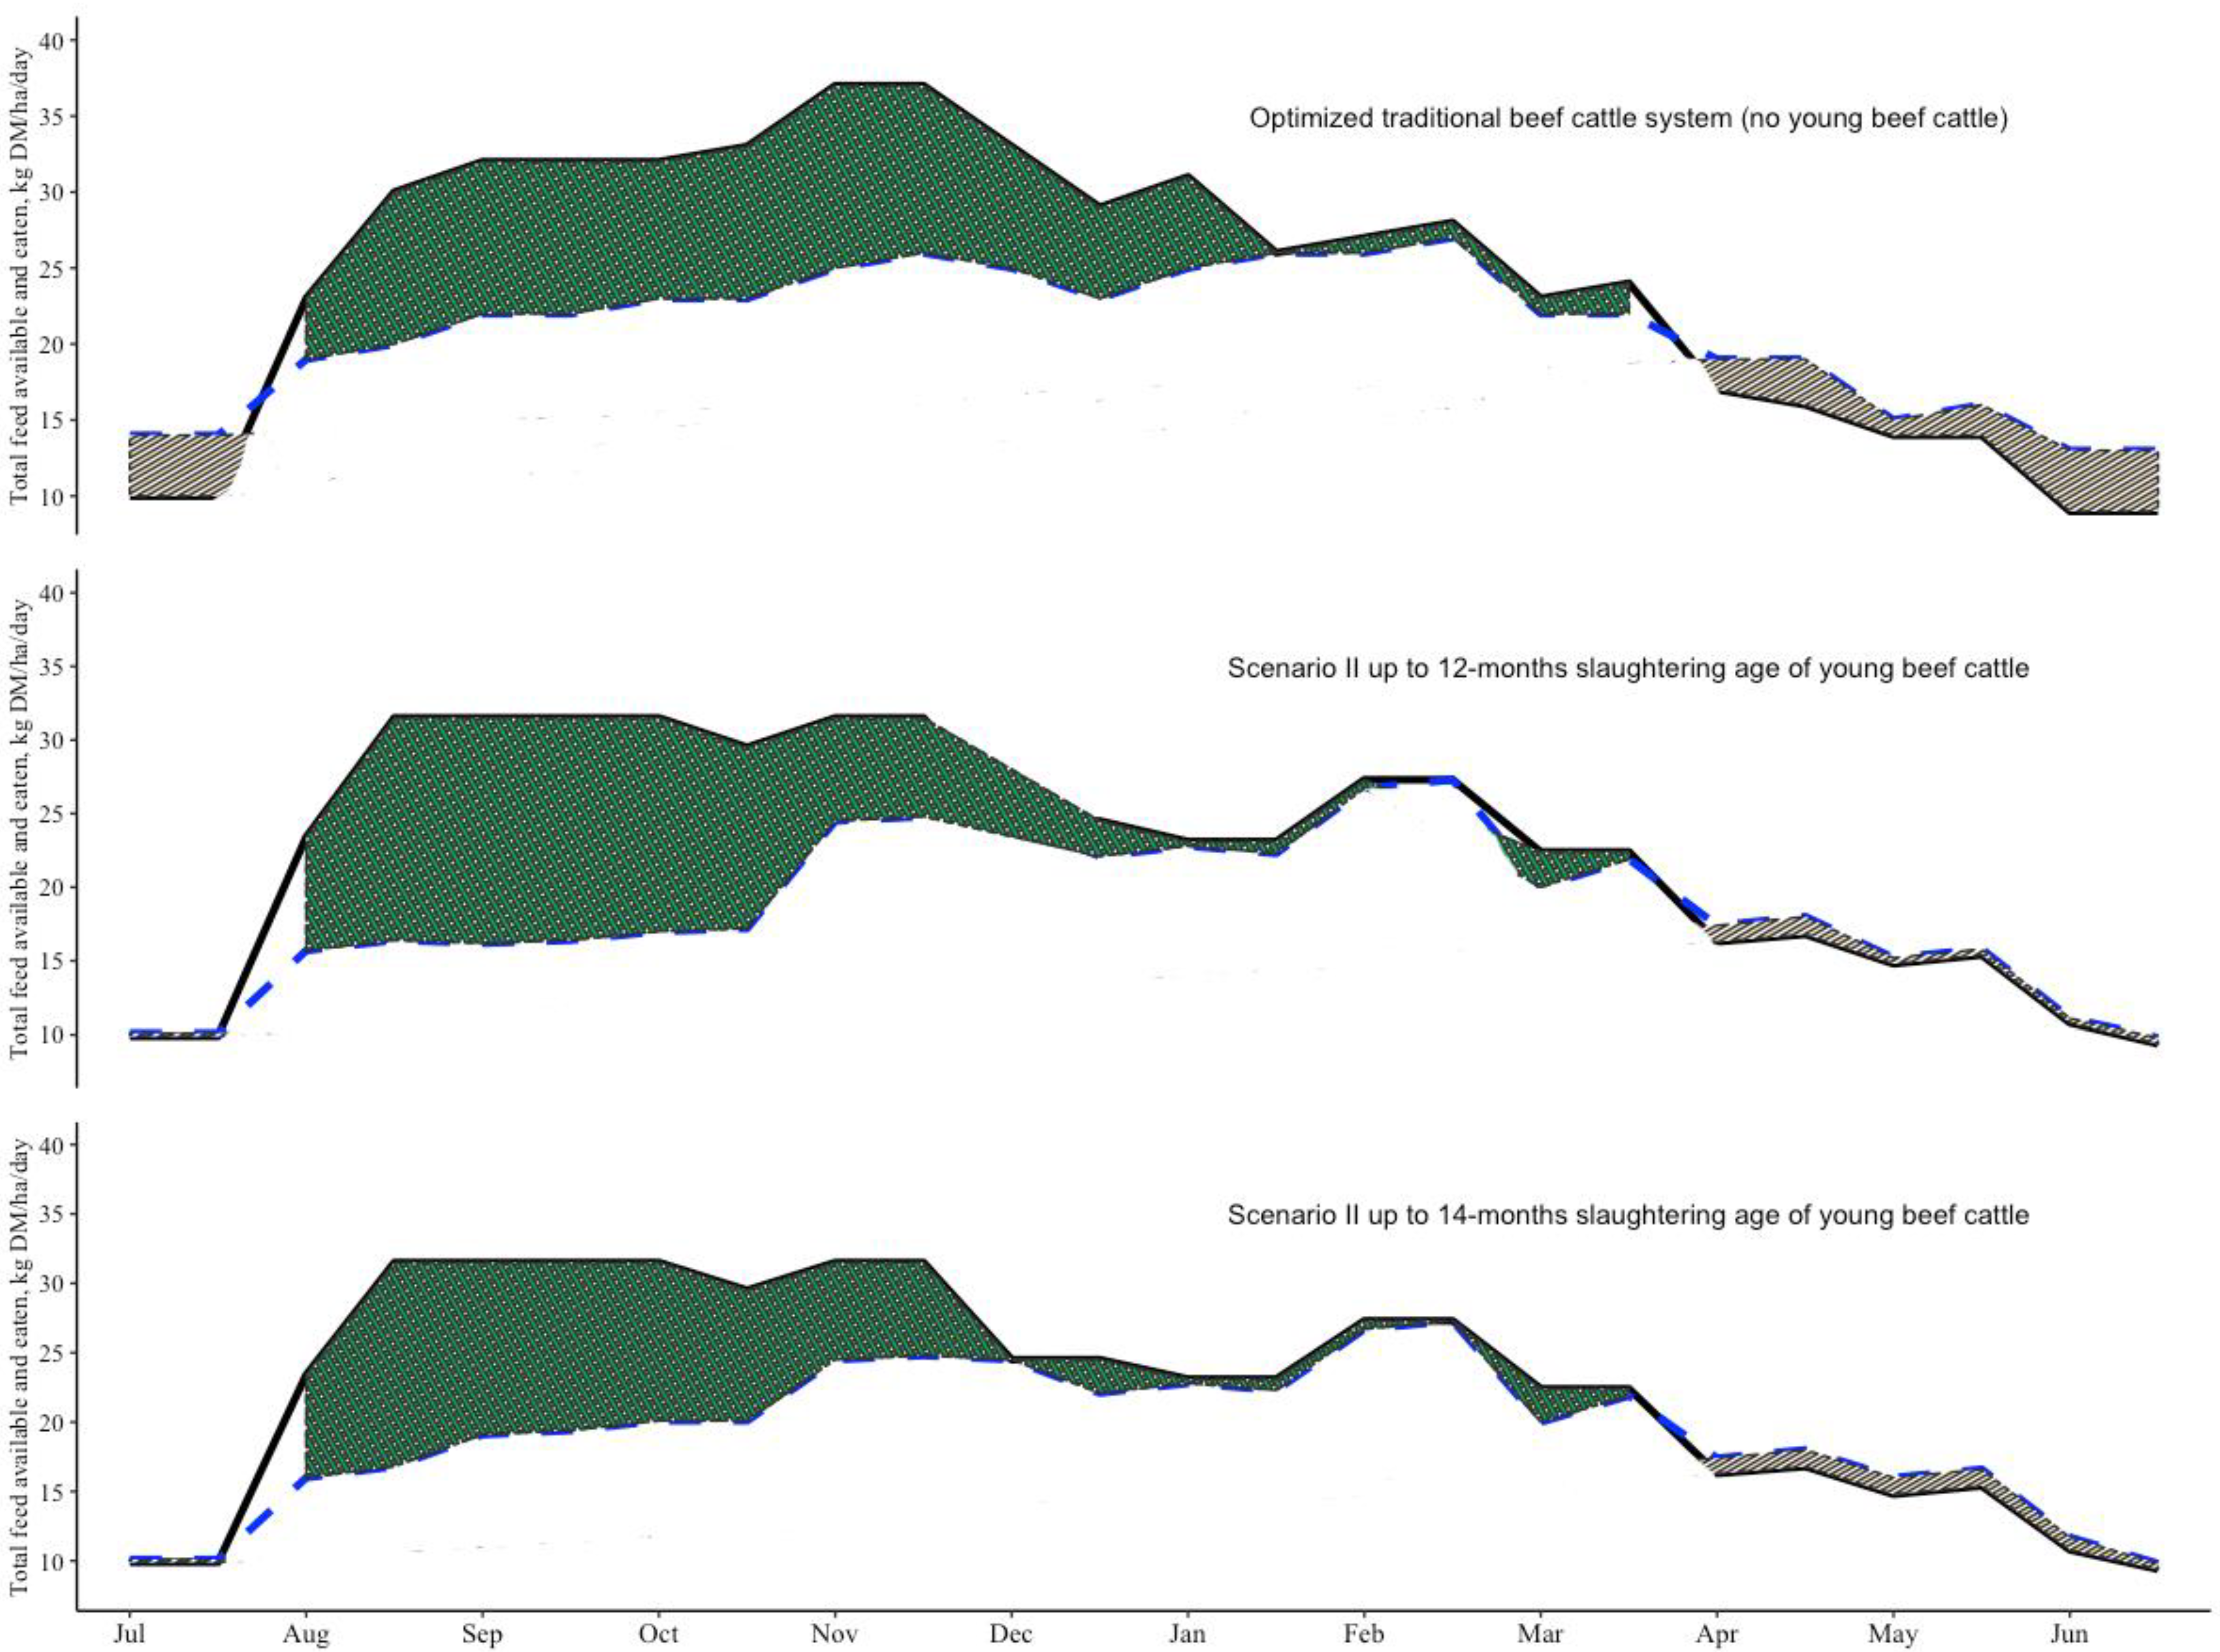
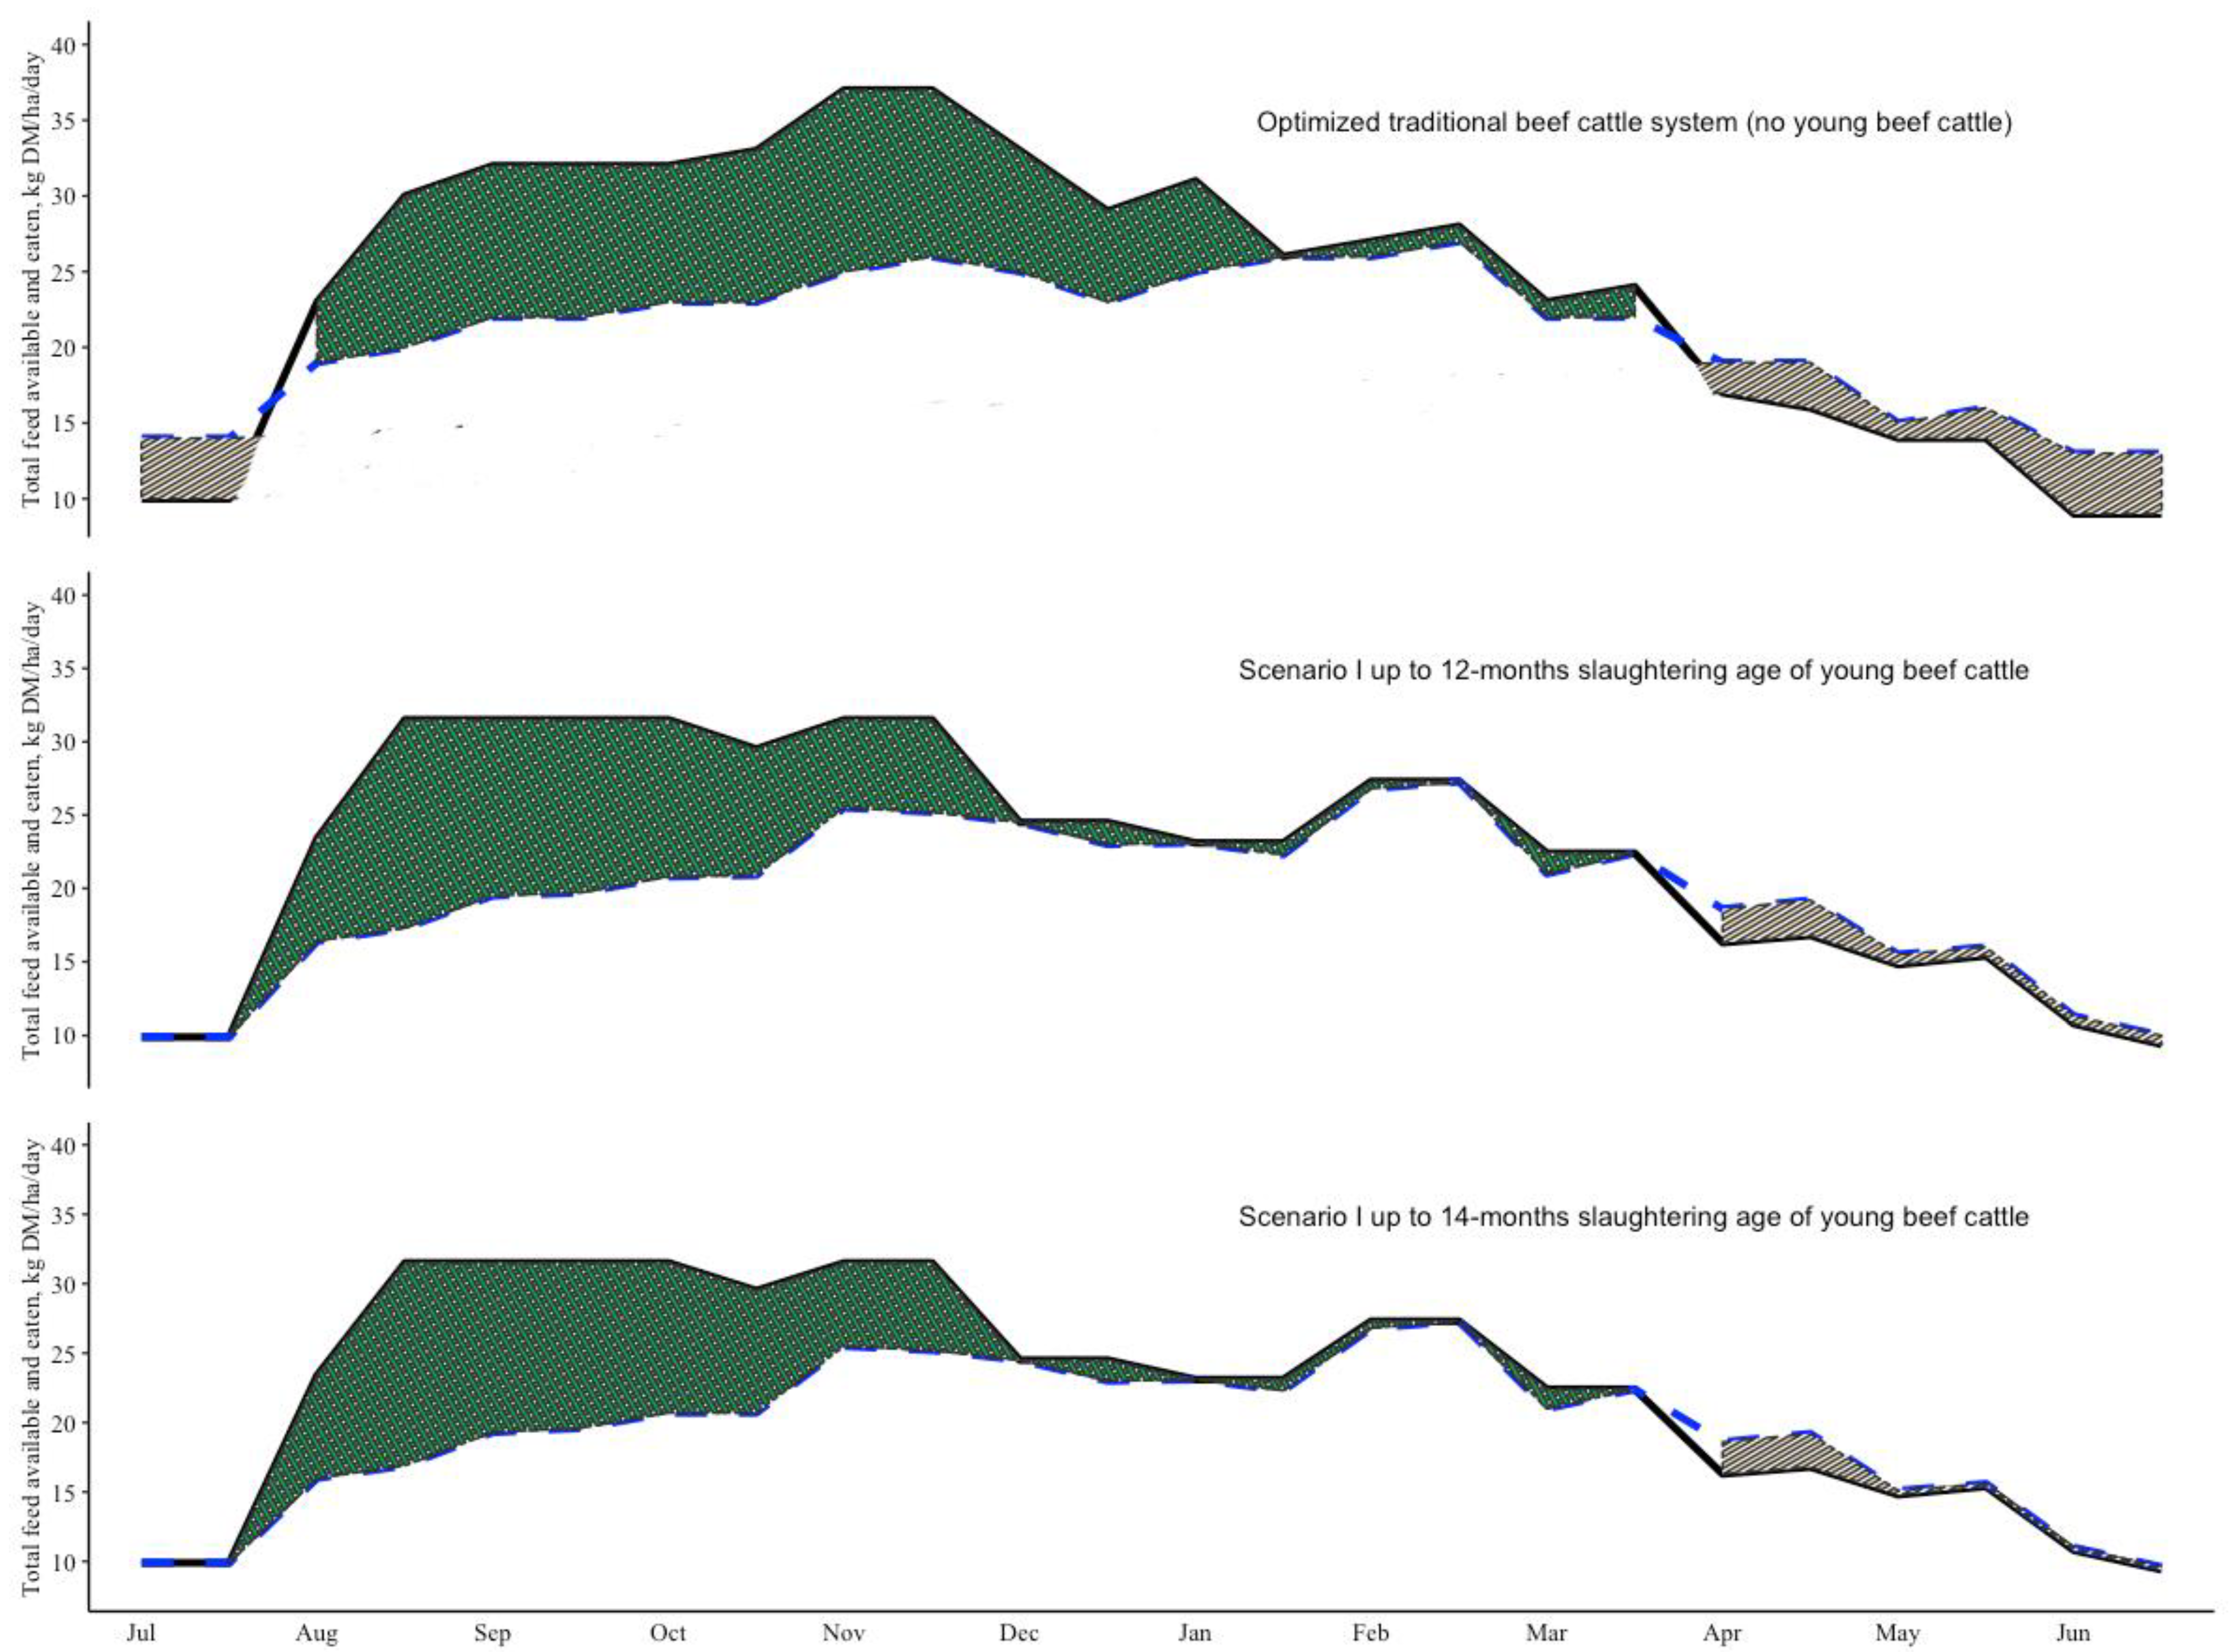
Figure 1. Utilizable pasture available (black line) and eaten by the beef cattle activity (blue dashed line which included silage) in the Optimized system and Scenario I throughout the year. The excess available herbage (i.e., neither utilized nor processed for silage) is indicated by the green shaded area and the deficient available herbage (i.e., where cattle requirements were greater than the available pasture) which was supplemented with silage as indicated by the striped area.
Agriculture 11 00849 g001
Figure 2. Utilizable pasture available (black line) and eaten by the beef cattle activity (blue dashed line which included silage) in the optimized system and Scenario II throughout the year. The excess available herbage (i.e., neither utilized nor processed for silage) is indicated by the green shaded area and the deficient of available herbage (i.e., where cattle requirements were greater than the available pasture) which was supplemented with silage is indicated by the striped area.
Agriculture 11 00849 g002
Table 1. Age, weight and daily per head feed demand for various classes of young beef cattle (kg DM/head/day).
Age (Month)* Average Weight (kg)HeiferSteerBull
Slaughter AgesSlaughter AgesSlaughter Ages
H-8H-10H-12H-14S-8S-10S-12S-14B-8B-10B-12B-14
31003.53.53.53.53.73.73.73.73.73.73.73.7
1153.83.83.83.84.04.04.04.04.04.04.04.0
41303.63.63.63.63.83.83.83.83.93.93.93.9
1423.83.83.83.84.04.04.04.04.14.14.14.1
51554.24.24.24.24.54.54.54.54.64.64.64.6
1645.55.55.55.55.75.75.75.75.75.75.75.7
61805.75.75.75.75.95.95.95.96.06.06.06.0
1945.45.45.45.45.65.65.65.65.75.75.75.7
72066.26.26.26.26.46.46.46.46.56.56.56.5
2226.56.56.56.56.86.86.86.86.86.86.86.8
82375.95.95.95.96.26.26.26.26.36.36.36.3
2496.16.16.16.16.46.46.46.46.56.56.56.5
9261 6.16.16.1 6.46.46.4 6.56.56.5
273 6.36.36.3 6.66.66.6 6.76.76.7
10286 4.64.64.6 5.85.85.8 6.06.06.0
293 4.74.74.7 5.95.95.9 6.16.16.1
11301 5.35.3 6.06.0 7.07.0
308 5.45.4 6.16.1 7.17.1
12316 6.76.7 7.67.6 8.48.4
331 6.96.9 7.87.8 8.68.6
13347 7.2 8.2 9.0
362 7.4 7.9 8.8
14377 7.7 8.2 9.2
392 7.1 8.4 9.4
* The average weights are for steers/bulls (the corresponding heifers weights can be estimated as 90% of these values). H: heifers, S: steers, B: bulls, 8: young beef cattle slaughtered at 8 months of age, 10: young beef cattle slaughtered at 10 months of age, 12: young beef cattle slaughtered at 12 months of age, 14: young beef cattle slaughtered at 14 months of age.
Table 2. Bimonthly per stock unit expenditure for various inputs of young beef cattle production.
Production Cost
Cattle
Young Cattle Slaughtered at 8 MonthsYoung Cattle Slaughtered at 10 MonthsYoung Cattle Slaughtered at 12 MonthsYoung Cattle Slaughtered at 14 Months
Seed0.610.811.011.22
Cultivation and sowing0.520.690.861.03
Feed and grazing1.261.682.102.53
Weed and pest0.670.901.121.35
Wages and salaries2.693.594.485.38
Animal health1.161.541.932.32
Fertilizer and lime3.775.036.297.55
Vehicles and fuel1.692.252.813.37
Electricity0.240.320.400.48
Other14.4719.2924.1128.94
Sum27.0736.0945.1154.14
Table 3. The number of weaner steers and bulls, finished steers (S-18, S-28, S-30) and bulls (B-16, B-18, B-20 and B-22) (sold for meat processing), young heifers, steers and bulls finished at 8, 10, 12 and 14 months of age and breeding ewes and rams, prime lambs (sold for meat processing) and store lambs (sold to other farmers for finishing) and prime and replacement hoggets (between 4 to 16 months of age, mated at 8 months of age) and their equivalent stock units in the optimized beef cattle system, Scenario I and Scenario II.
Beef Cattle and Sheep ClassesOptimized Traditional Beef Cattle System Scenario IScenario II
8–128–148–128–14
Steer weaners1001001007575
S-18551001005858
S-2845 1313
S-30 44
Bull weaners 1001001007575
B-167108
B-1844774747
B-20366374286
B-22132011 22
Young heifer weaners 4040
H-8 8
H-10 323
H-12
H-14 NA37
Young steer weaners 224040
S-8 2626
S-10 21414
S-12 2
S-14 NA NA
Young bull weaners 10104040
B-8 4040
B-10 810
B-12 2
B-14 NA NA
Total beef cattle number 200212270
Breeding ewes 11001100110011001100
Store lambs345345345345345
Prime lambs704704704704704
Replacement hoggets330330330330330
Rams 1111111111
Stock unit *31413170317332043204
Optimized traditional beef cattle system: The traditional steers and bulls optimized using linear programming developed by [30]. * Stock unit: average throughout the year; S-18: rising two-year steers (slaughtered at the age of 18 months); S-28 and S-30: rising three-year steers (slaughtered at the ages of 28 and 30 months); B-16, B-18, B-20 and B-22: rising two-year bulls (slaughtered at the ages of 16, 18, 20 and 22 months); H-8: heifers slaughtered at 8 months of age; H-10: heifers slaughtered at 10 months of age; H-12: heifers slaughtered at 12 months of age; H-14: heifers slaughtered at 14 months of age; S-8: steers slaughtered at 8 months of age; S-10: steers slaughtered at 10 months of age; S-12: steers slaughtered at 12 months of age; S-14: steers slaughtered at 14 months of age B-8: bulls slaughtered at 8 months of age; B-10: bulls slaughtered at 10 months of age; B-12: bulls slaughtered at 12 months of age; B-14: bulls slaughtered at 14 months of age; 8-12: young beef cattle slaughtered at the age of 8, 10 and 12 months; 8–14: young beef cattle slaughtered at the age of 8, 10, 12, 14 months of age; NA: no data reported.
Table 4. Total, per hectare, and per stock unit values of the gross farm revenue (GFR), total farm expenditure (TFE), and farm earnings before tax (EBT) of beef cattle and sheep activity for the optimized system, Scenario I and Scenario II.
SystemsBeef Cattle SheepTotalTotal per Hectare Total per Stock Unit
NZ$NZ$NZ$NZ$/haNZ$/SU
Optimized traditional beef system GFR297,700.39175,820.19473,520.572391.52150.78
TFE207,523.4973,789.22281,312.711420.7789.57
EBT90,176.90102,030.97192,207.86970.7561.20
Scenario I (8–12)GFR291,321.51175,820.19467,141.692359.30147.36
TFE172,114.9873,789.22246,522.811245.0677.77
EBT119,206.52102,030.97220,618.881114.2469.60
Scenario I (8–14)GFR289,300.37175,820.19465,120.562349.09146.59
TFE169,558.2373,789.22243,966.061232.1576.89
EBT119,742.15102,030.97221,154.511116.9469.70
Scenario II (8–12)GFR283,556.54175,820.19459,376.732320.08143.37
TFE148,076.5973,789.22222,484.421123.6669.44
EBT135,479.95102,030.97236,892.301196.4373.93
Scenario II (8–14)GFR291,775.45175,820.19467,595.642361.59145.93
TFE148,044.6873,789.22222,452.511123.4969.43
EBT143,730.77102,030.97245,143.131238.1076.50
Optimized traditional beef cattle system: The traditional steers and bulls identified using linear programming developed by [29]; 8–12: young beef cattle slaughtered at the ages of 8, 10 and 12 months; 8–14: young beef cattle slaughtered at the ages of 8, 10, 12, 14 months of ages.
Publisher’s Note: MDPI stays neutral with regard to jurisdictional claims in published maps and institutional affiliations.

