1. Introduction
The tropical fruit industry contributes to the most significant income source among food exports in the Philippines and Taiwan. Statistics from Taiwan’s Council of Agriculture showed that in the first quarter of 2020, despite the pandemic, Taiwan exported USD 1.2 billion worth of fruit. Taiwan’s banana export grew 27% in the first quarter of 2020 [
1]. In 2019, there was an estimated total of USD 14.7 billion of banana exports worldwide. The Philippines was ranked at number two for countries that exported the highest dollar value worth of bananas [
2]. Bananas, along with other high valued fruits, have shown an outstanding contribution to the export industry because of their excellent flavor, high nutritional content, and commercial value [
3,
4,
5].
Grading bananas for export is routinely performed through manual classification by large banana plantations in the Philippines and Taiwan. However, these soft fruits are prone to mechanical damage, such as bruises, cracks, abrasions, and puncture wounds, due to improper handling during harvest, grading, packaging, and transport. If the fruit is injured, it may substantially reduce its quality and increase its susceptibility to decay and microbial growth, thereby affecting consumer preference [
6,
7]. The damages resulting from harvest and subsequent handling and the increasing cost of sourcing skilled farm laborers or fruit graders in the agriculture industry may leave small profit margins [
8,
9].
Intelligent environments and ubiquitous computing had been the major trend in agriculture to increase productivity and make farming more efficient with the reduced impact caused by agricultural processes through sophisticated sensors that can monitor production and send alerts to farmers [
10,
11]. With the growing need to supply high-quality fruit products in a short time while ensuring food safety and security protocols and reducing food waste, managing farm products using manual systems only becomes more challenging. Hence, many countries in Europe, the USA, and Asia have upgraded to the automatic grading of agricultural products [
12,
13]. RGB images have been utilized and combined with image processing [
14], fuzzy logic [
15], machine learning [
16], and deep learning [
17,
18] techniques in classifying bananas in terms of size, quality, and ripeness.
Hyperspectral imaging (HSI) is a modern technology widely recognized as a non-destructive tool for many applications, such as in the early assessment of fruit ripeness to determine the optimal time of harvest and predict crop yield [
19]. Moreover, the use of spectral images has been utilized in clay prediction necessary for assessing soil fertility [
20], classification and safety inspection of fruits and vegetables [
21,
22], and prediction of quality of bananas based on internal factors, such as total soluble solids, moisture content, and firmness [
5]. With the integration of artificial intelligence (AI) and a robotic system, HSI technology provides superior performance compared to humans and even more physiological information about fruit than what a human can perceive without cutting/tasting the fruit; thus, reducing waste [
23].
The potential of RGB and hyperspectral imaging was highlighted in a study for grading apples, and results showed that hyperspectral imaging demonstrated better potential over conventional RGB imaging [
24]. In another study [
25], a real-time fruit quality grading system was proposed using RGB images for detecting the size, shape, volume, and defects of pears combined with near-infrared spectroscopy for detecting internal features of pears, such as sweetness, acidity, moisture, and firmness. The combination of RGB and hyperspectral imaging was also used in a study estimating the biomass and yield of potato crops [
26]. In their study, RGB imagery was used to detect crop height, while hyperspectral imagery was utilized to obtain the wavelength spectra and band vegetation in predicting the yield production. Furthermore, RGB-HSI was explored in a study about maturity classification of papaya [
27].
Manual grading of fruits involves the inspection of external qualities of the fruit as well as internal factors, but this method may be time-consuming and destructive. Unlike other agricultural crops (apples, pears, papayas, etc.), bananas are clustered or in tiers, making extraction of features and classification algorithm more complex [
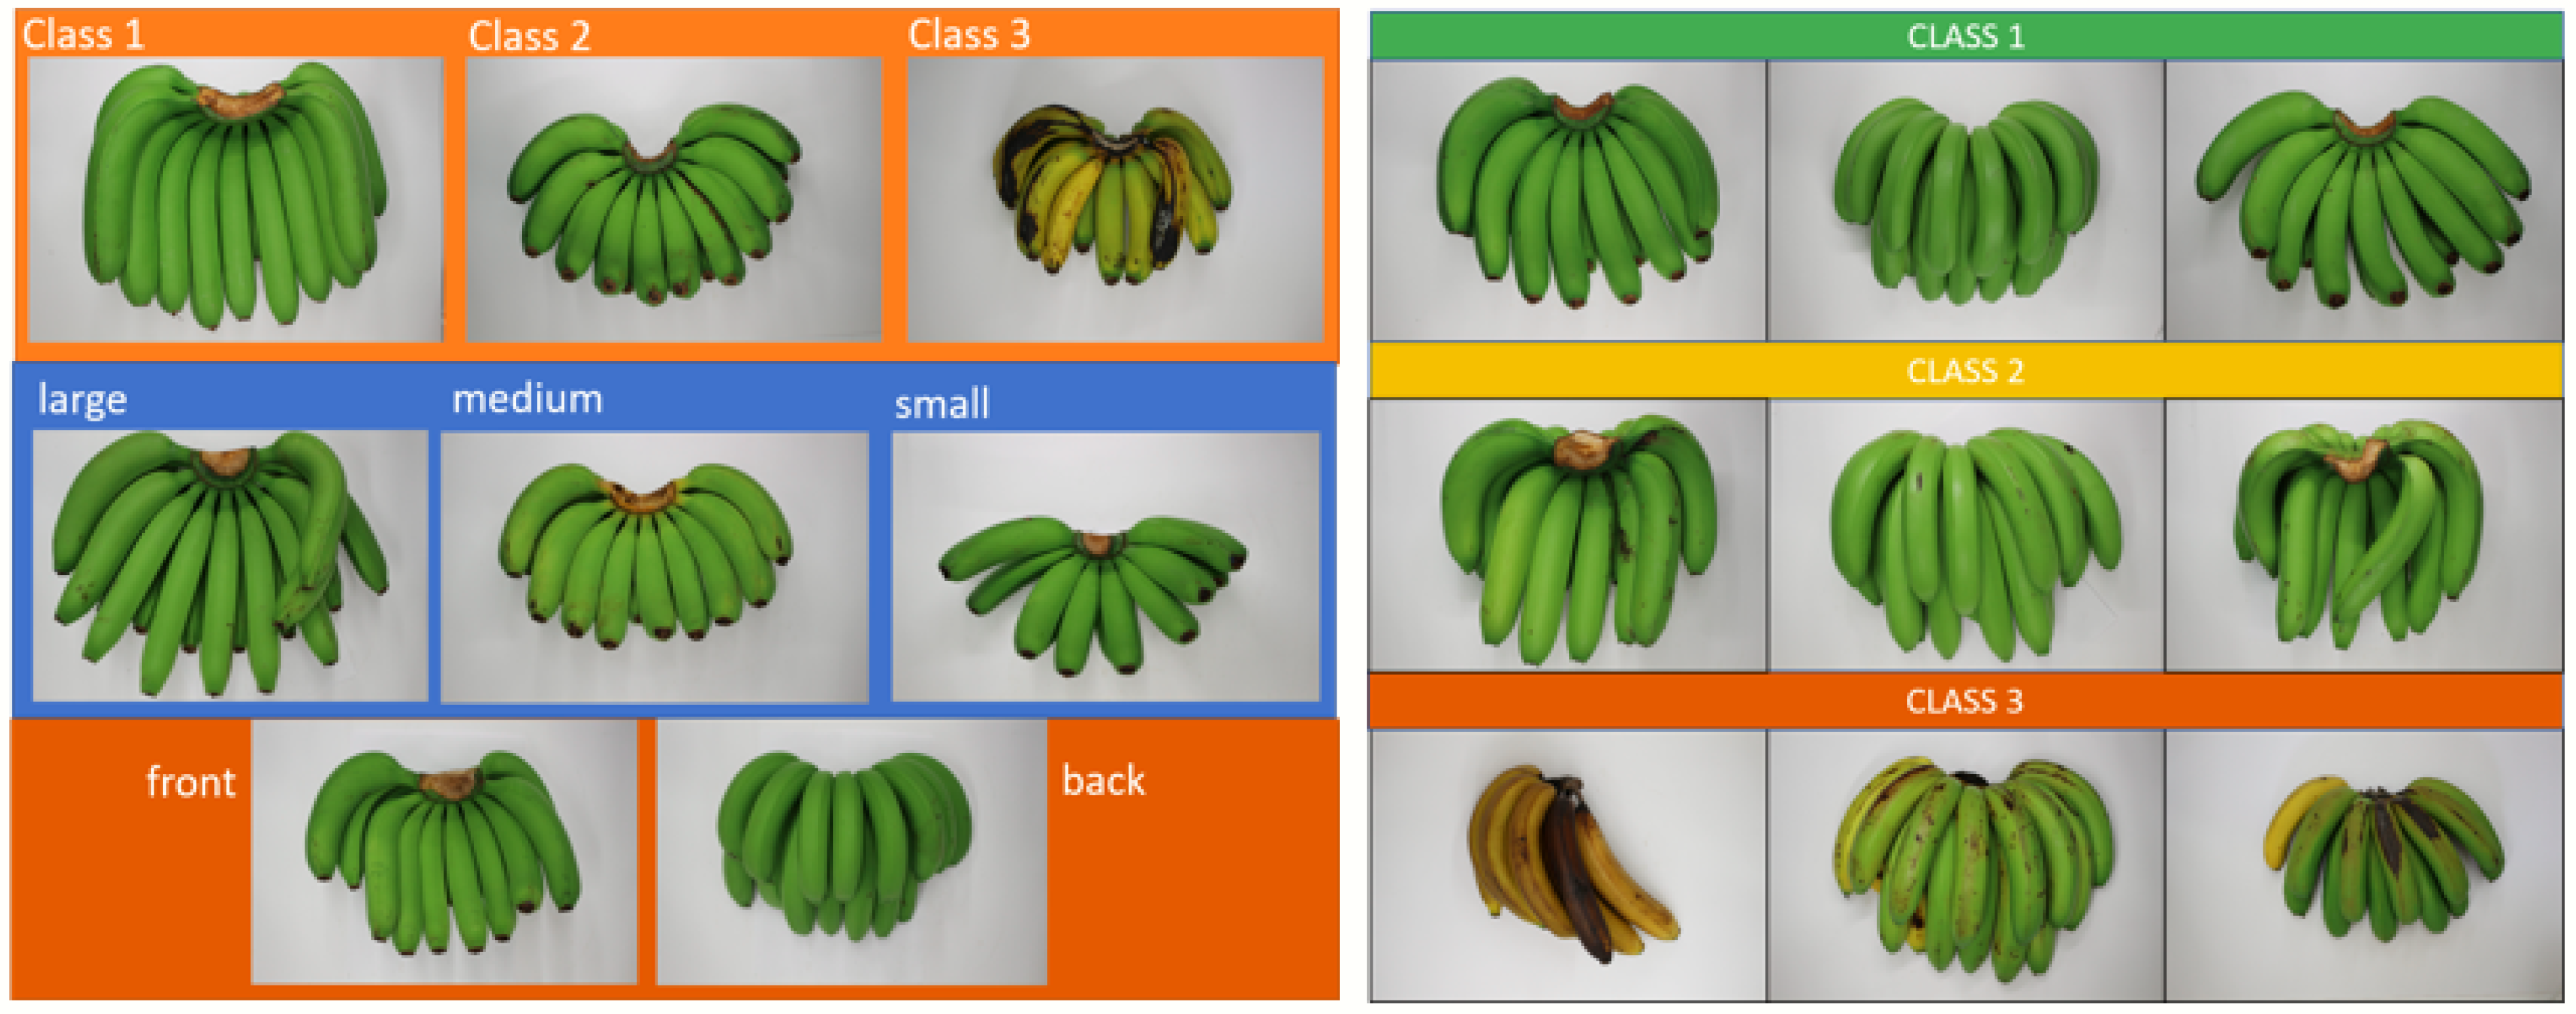
16]. Thus, the main objective of this study is to develop and present a deep learning model using a fusion of RGB and hyperspectral imaging for the non-invasive classification of banana tiers. Due to limited human resources for fruit grading and the inefficiency and bias of human perception on classification, an automated/AI-enabled system was implemented in this study that can automatically classify bananas into three grade classes (Class 1—bananas for export; Class 2—bananas for the local market; Class 3—reject bananas).
To the best of our knowledge, this study is the first multi-input combined approach of RGB and hyperspectral imaging for tier-based banana grading. RGB imaging will be used for the extraction of morphological changes in the fruit and hyperspectral imaging for providing additional information through the spectral signatures and reflectance values of bananas. The proposed architecture shows an entirely different architecture with multiple inputs extracted from the two most popular imaging modalities, which are RGB and hyperspectral imaging. Key contributions of this study are: (1) a novel multi-input approach of a combined Multilayer Perceptron (MLP) and Convolutional Neural Network (CNN) architecture for banana classification using the two modalities (RGB and HSI); (2) automatic prediction and inclusion of banana size in banana grade classification, which are only done manually in other methods reported in the literature, and (3) a database of RGB and hyperspectral images for the three banana grade classes. The multi-input model in this study will also serve as a paradigm for grading export quality fruits and other horticultural fruits and vegetables.
2. Materials and Methods
2.1. Comparison of Related Work
Table 1 shows a comparison of the proposed method with the other methods reported in the literature in terms of its classification, the number of samples used, features extracted, and the methods implemented. As observed from the table, most of the methods in the literature for banana classification involved only RGB or visible light imaging, which can only extract the morphological changes or external features of the fruit. Studies for the classification of pears and papaya involved two modalities, where RGB imaging is coupled with another modality, either Near-Infrared (NIR) Spectroscopy or Hyperspectral Imaging (HSI). Hyperspectral Imaging can extract spectral signatures and reflectance values that are highly correlated with a fruit’s internal properties [
5]. In Choi et al.’s [
25] study, NIR was used to extract the internal flavor factors of the fruit.
The table also shows the number of classes for the different fruit and vegetable classifications. Le et al.’s [
17] study is an extension of Piedad et al.’s [
16]. The study used the same image database and combined the three classes into one, which resulted in only two classifications. However, Le et al.’s [
17] study performed data augmentation to increase the sample size to twenty times and to improve its method’s accuracy. As evident from the table, this paper has the least number of samples used for its classification model.
The rest of the details for the proposed method in this study are explained in the following sections under
Section 2.2. Experimental Design, 2.3. Neural Network Topology and 2.4. Model Training. The evaluation of the performance of the proposed method is discussed in
Section 3. Results. A comparison of this study’s performance with regards to the performance of other methods in literature is explained in
Section 4. Discussion.
2.2. Experimental Design
In this study, data samples of export banana variants in Taiwan were collected and utilized. The samples were gathered and pre-classified by experts compliant with the international standards for banana classification [
28]. Two sides (front and back view) of the bananas were captured, making a total of five hundred sixteen (516) instances. Samples were classified into Class 1 (for export quality bananas), Class 2 (bananas for the local market), and Class 3 (for bananas with defects or the reject class). There were 70, 187, and 259 banana tiers per class, respectively (
Table 2).
The sizes of the banana fingers in terms of length were recorded and classified into three categories: small, medium, and large. These data and the image samples were used for training the model for the banana size classification. The sizes of bananas were automatically classified using only the RGB images fed on the AI models. Another feature that was also automated in this study is the banana view or side (whether the banana is facing upright on the platform or downward—front view or back view). Banana samples were captured using two cameras (1) RGB camera—an ordinary digital single-lens reflex camera (DSLR) (Canon EOS 100D manufactured in Tokyo, Japan, with 18.5 effective megapixels APS-C CMOS sensor) camera and (2) hyperspectral camera, which were for the extraction of external and internal features of bananas, respectively.
2.2.1. RGB Images Acquisition
RGB or commonly known as the Red, Green, and Blue Color Model, uses three channels of red, green, and blue that are added together in varied proportions that can produce an extensive range of colors. This model is a device-dependent color model mainly used for sensing, representation, display of images in electronic systems, and image processing.
RGB color space, which is the most widely used technique in image processing and computer vision, was used for extracting the colors and texture of bananas. The colors determine the ripeness of bananas, and the texture represents any discoloration or bruises on the peel.
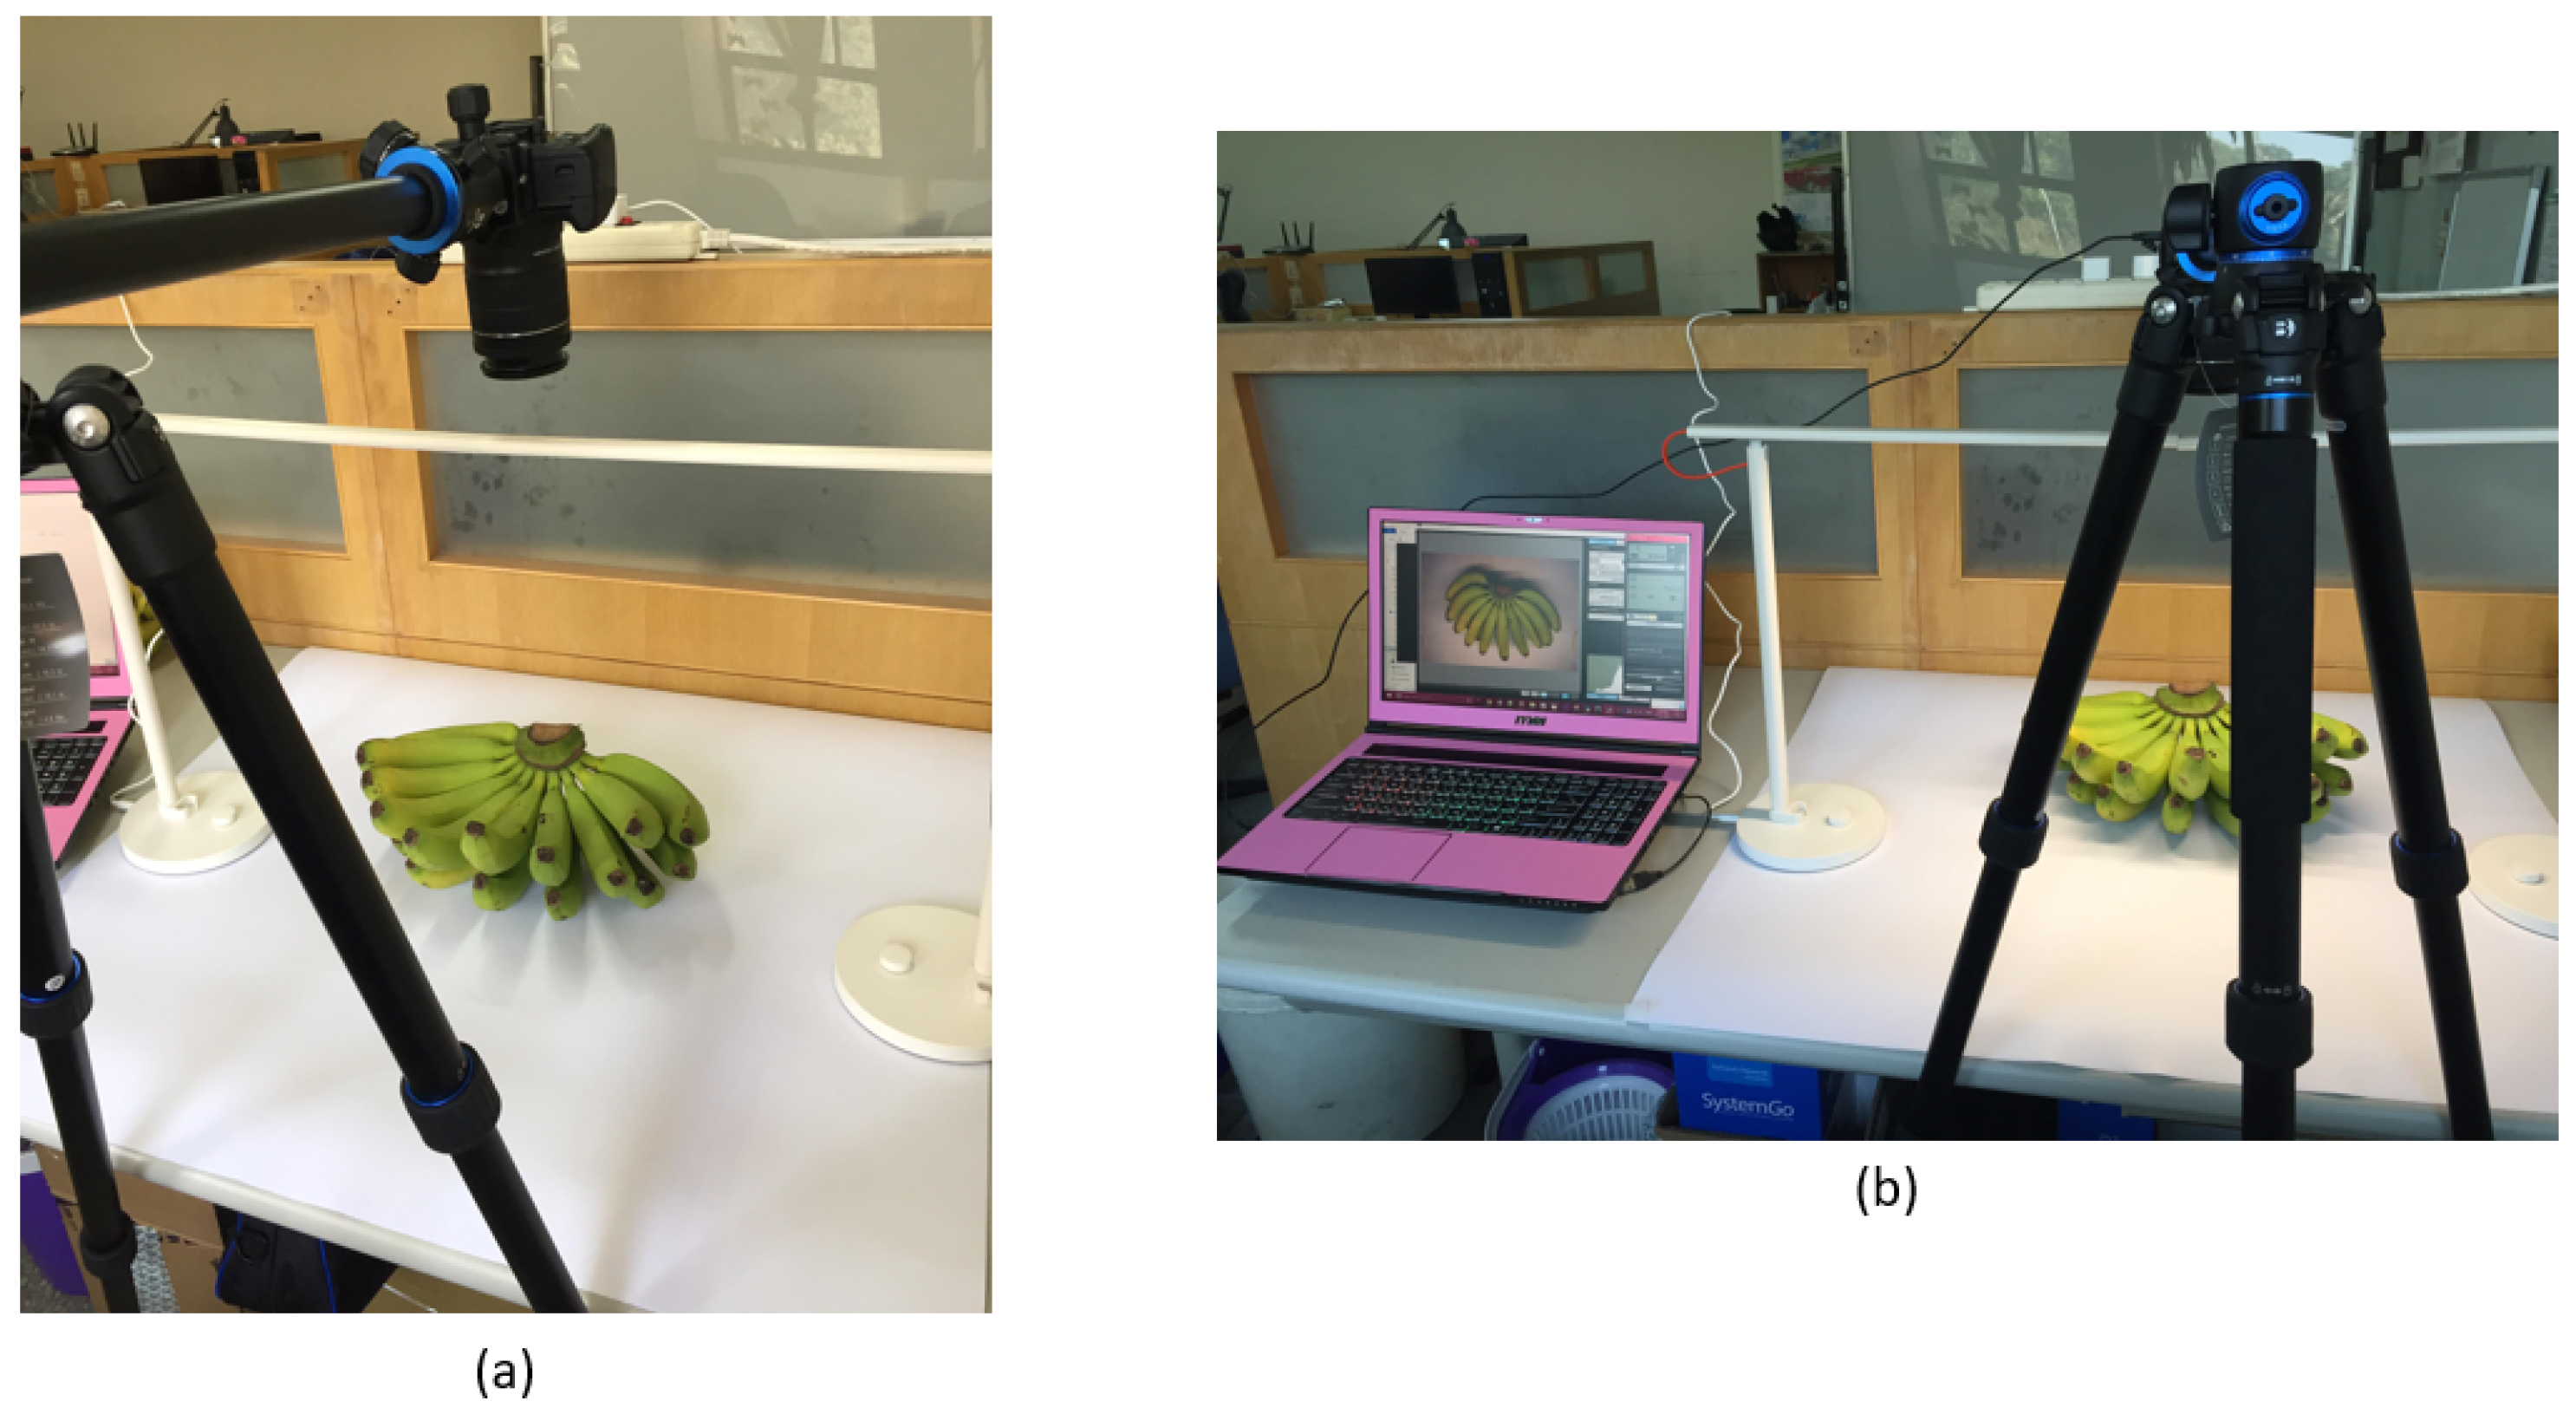
All samples were measured at a constant camera height, which was essential in determining the size estimation of the samples. The same camera distance and illumination were observed throughout the whole acquisition of RGB images. The same background color (white background) was used in all captured images to facilitate the banana image segmentation. The resolution of image samples from 5184 × 3456 was reduced to 320 × 213 to be used as input into CNN. The capture and preprocessing of image samples (image size reduction) were done using the built-in software of the DSLR camera. The setup for getting the RGB images is shown in
Figure 1.
Color and texture are the primary features extracted from the RGB jpeg file. Several features can be obtained from each pixel using the RGB color space. The color of the banana peel can be represented using the combination of primary colors (red, green, and blue). Class 1 bananas must have the green color of the peel with no or minimal dark spots and blemishes, while reject class, on the other hand, tends to have more dark or gray colors, which can be extracted from the RGB color space. The RGB image file was fed into a convolutional neural network responsible for the automatic extraction of additional external features of the banana through a series of convolutions.
Export quality fruit usually has green peel with a smooth, glossy texture; hence, texture feature was also extracted by the system. Defective fruits have bruises and dark spots that can be evident in their texture values. Haralick texture was the method used in extracting some external features of bananas. Haralick’s [
29] method utilizes gray level co-occurrence matrices (GLCM), which show how often a gray level occurs at a pixel in a fixed position relative to other pixels in the image. The method can discriminate bananas with smooth texture from those with defects. The mean texture value of the RGB image file was computed using the Haralick function from Python’s open-source libraries.
Other features extracted from the RGB image file are size and banana view. Five hundred thirty-nine (539) RGB image samples were used for training the model for size classification and 516 samples for banana view classification. Based on the international standards for grading bananas, size is measured based on the size of the middle finger of a banana tier [
14]. Recorded sizes were used as training data to implement the banana size classification model using the RGB image file as input to the neural network.
2.2.2. Hyperspectral Images Acquisition
Hyperspectral Imaging or HSI is a technique that contains several large dimensions of data with hundreds of channels. HSI is a technique that analyzes a broad spectrum of light wherein the light striking each pixel can be broken down into various spectral bands to provide more image information. Unlike RGB imaging that uses only three channels, namely, red, green, and blue, HSI delivers additional knowledge of imaging with hundreds to thousands of color bands, making it suitable for a wide variety of image analysis applications [
30].
With the use of a hyperspectral camera, reflectance values of objects can also be obtained, which are beneficial information for classification. Hyperspectral imaging can also be used in getting the spectral signature of objects since the mean reflectance values or band values can somehow generalize the spectral signature of objects. A study by Saputro et al. [
31] showed that reflectance values can represent firmness, moisture content, and total soluble solids in bananas. Furthermore, healthy plants have a high reflectance in the near-infrared, between 0.7 and 1.3 µm, which can discriminate healthy fruits from unhealthy ones [
32].
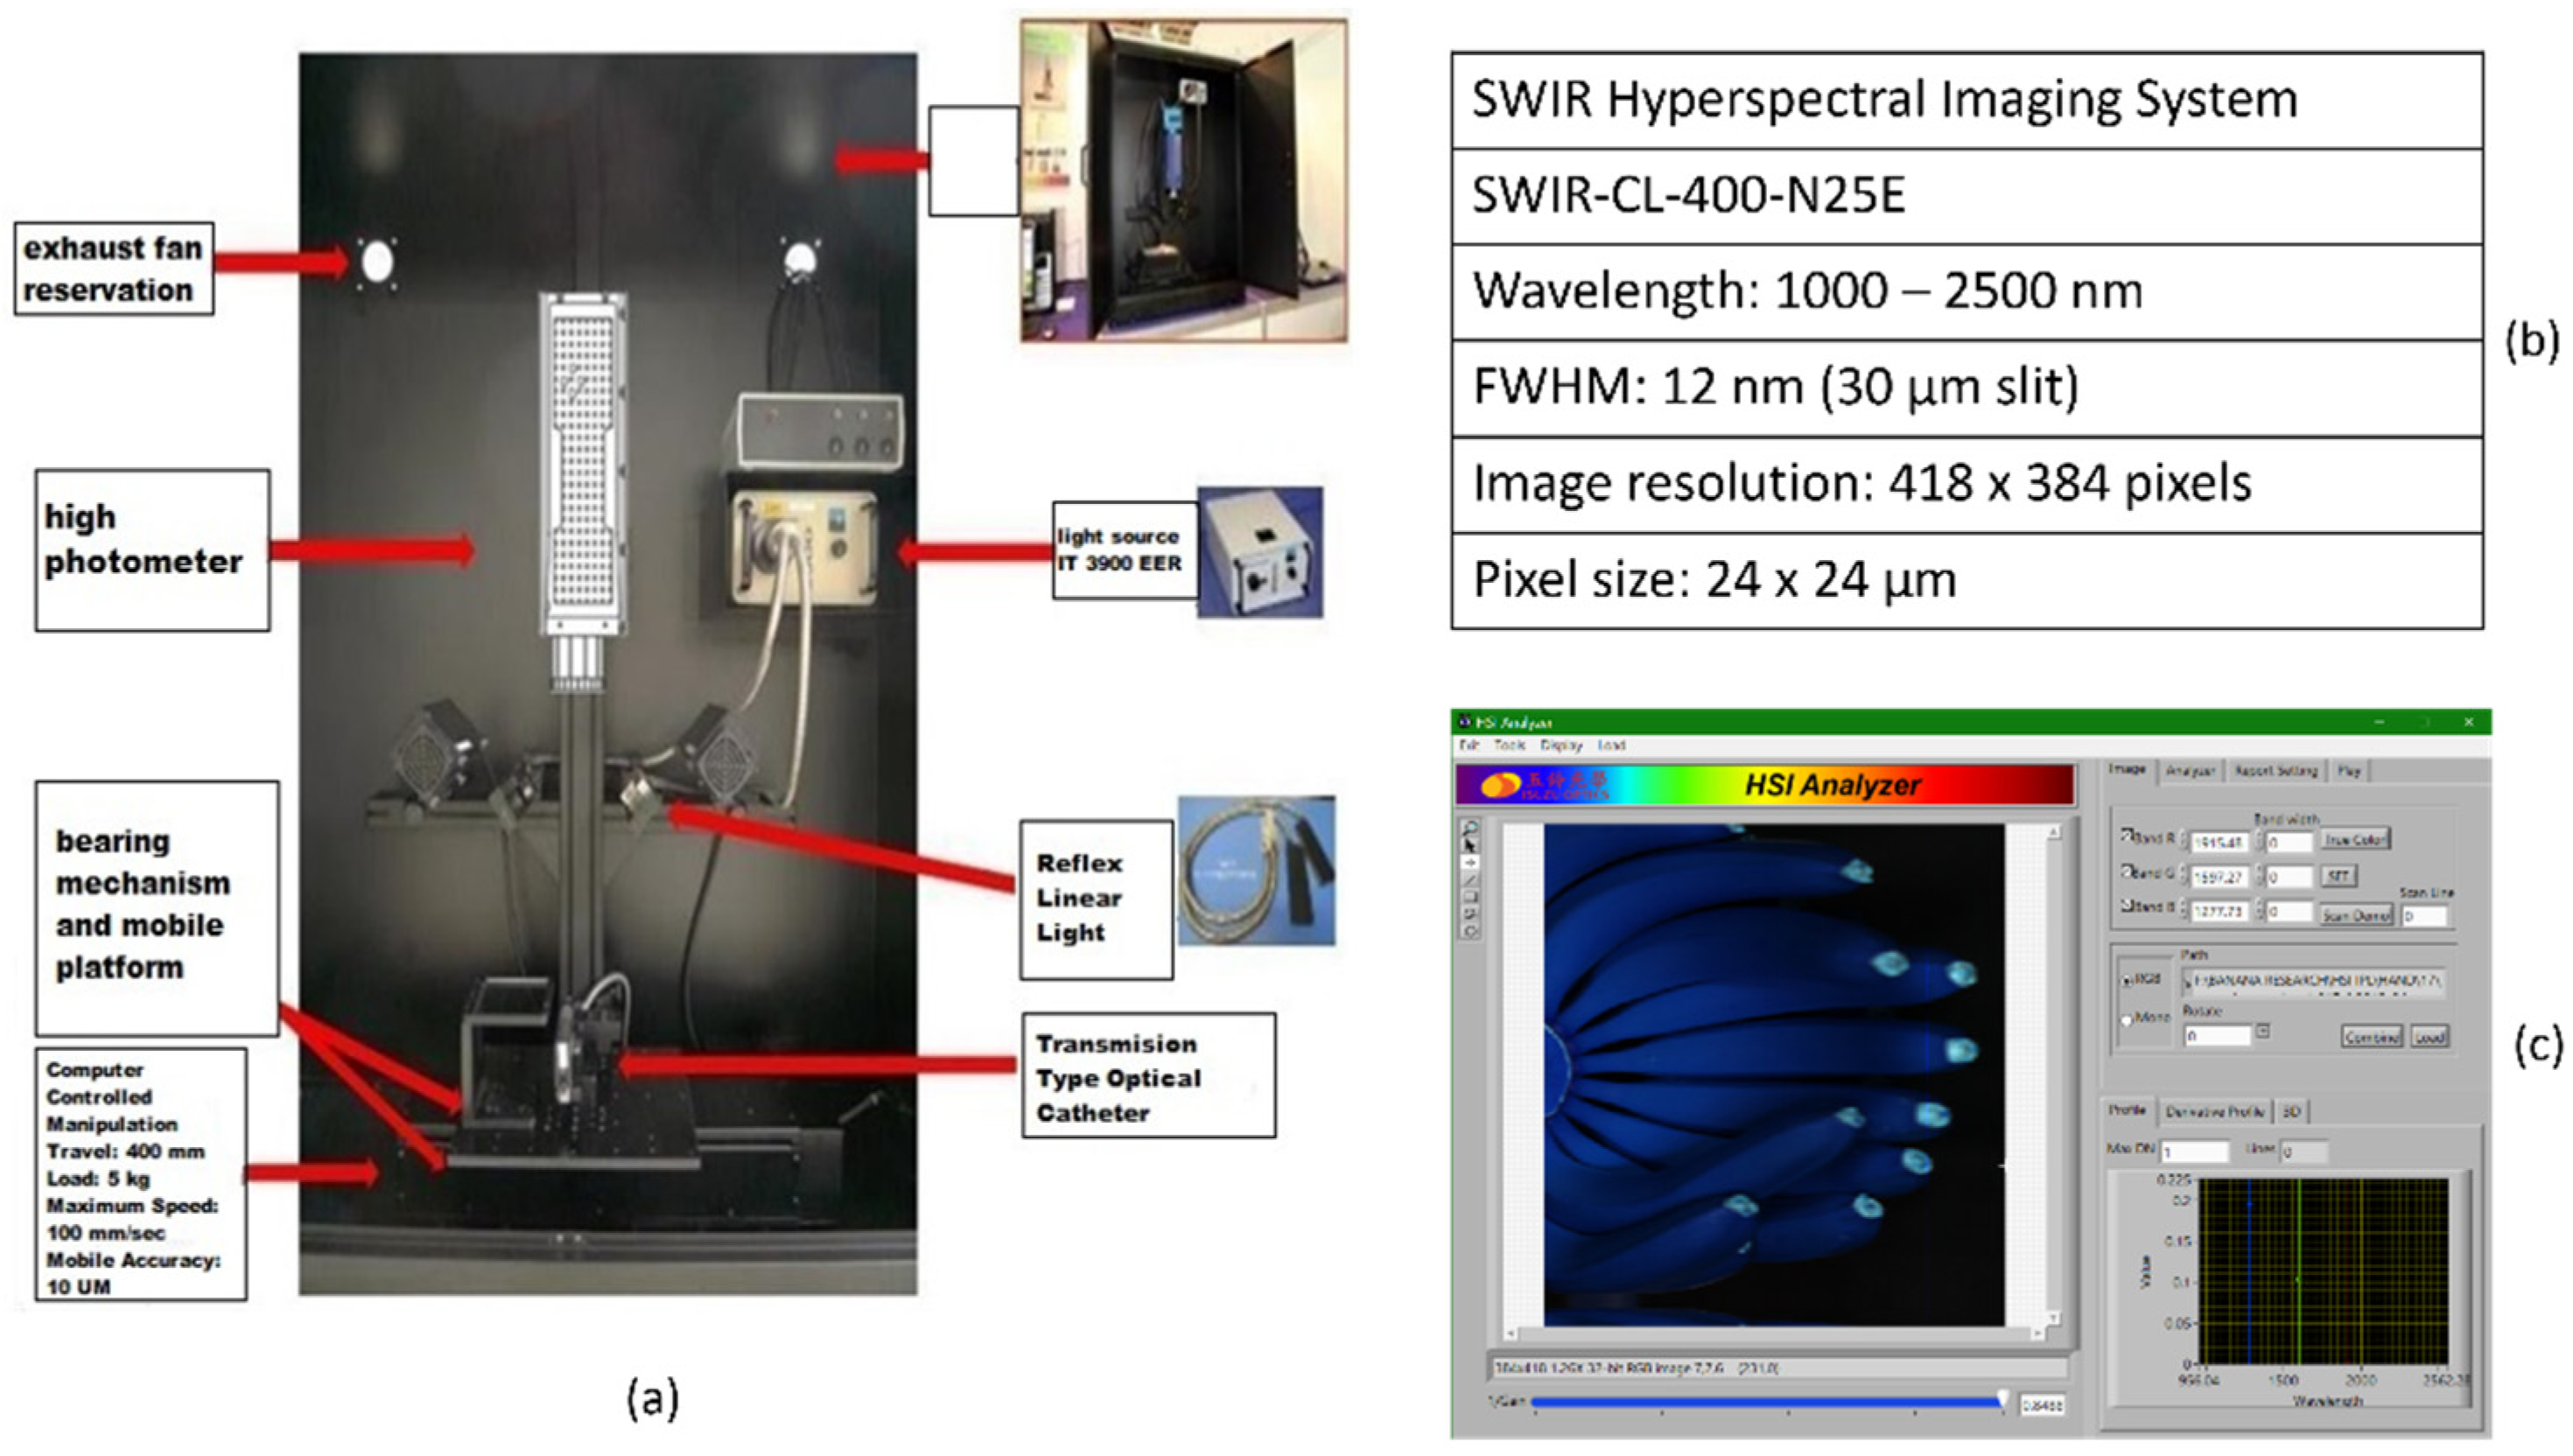
The hyperspectral imaging system, SWIR (short wave infrared) Imaging System, used in the study has 288 bands with wavelengths ranging from 1000 to 2500 nm. The equipment (SPECIM brand) was manufactured in Canada and assembled in Taiwan.
Figure 2a illustrates the hyperspectral imaging setup. The full specification of the HSI system used in this study is shown in
Figure 2b.
Figure 2c shows the proprietary software used for the acquisition of the hyperspectral data and the preprocessing of hyperspectral (HS) images. The output file of the HS camera was a HDR file that was used for feature extraction using the automated system.
The hyperspectral camera utilized in this study can produce an image file in the hdr file format. Spectral Python, a pure Python module, was used in reading and processing the hyperspectral image data. The mean reflectance values for every pixel in the HSI data for all 288 bands ranging from bandwidths 956 nm to 2562 nm were computed and recorded.
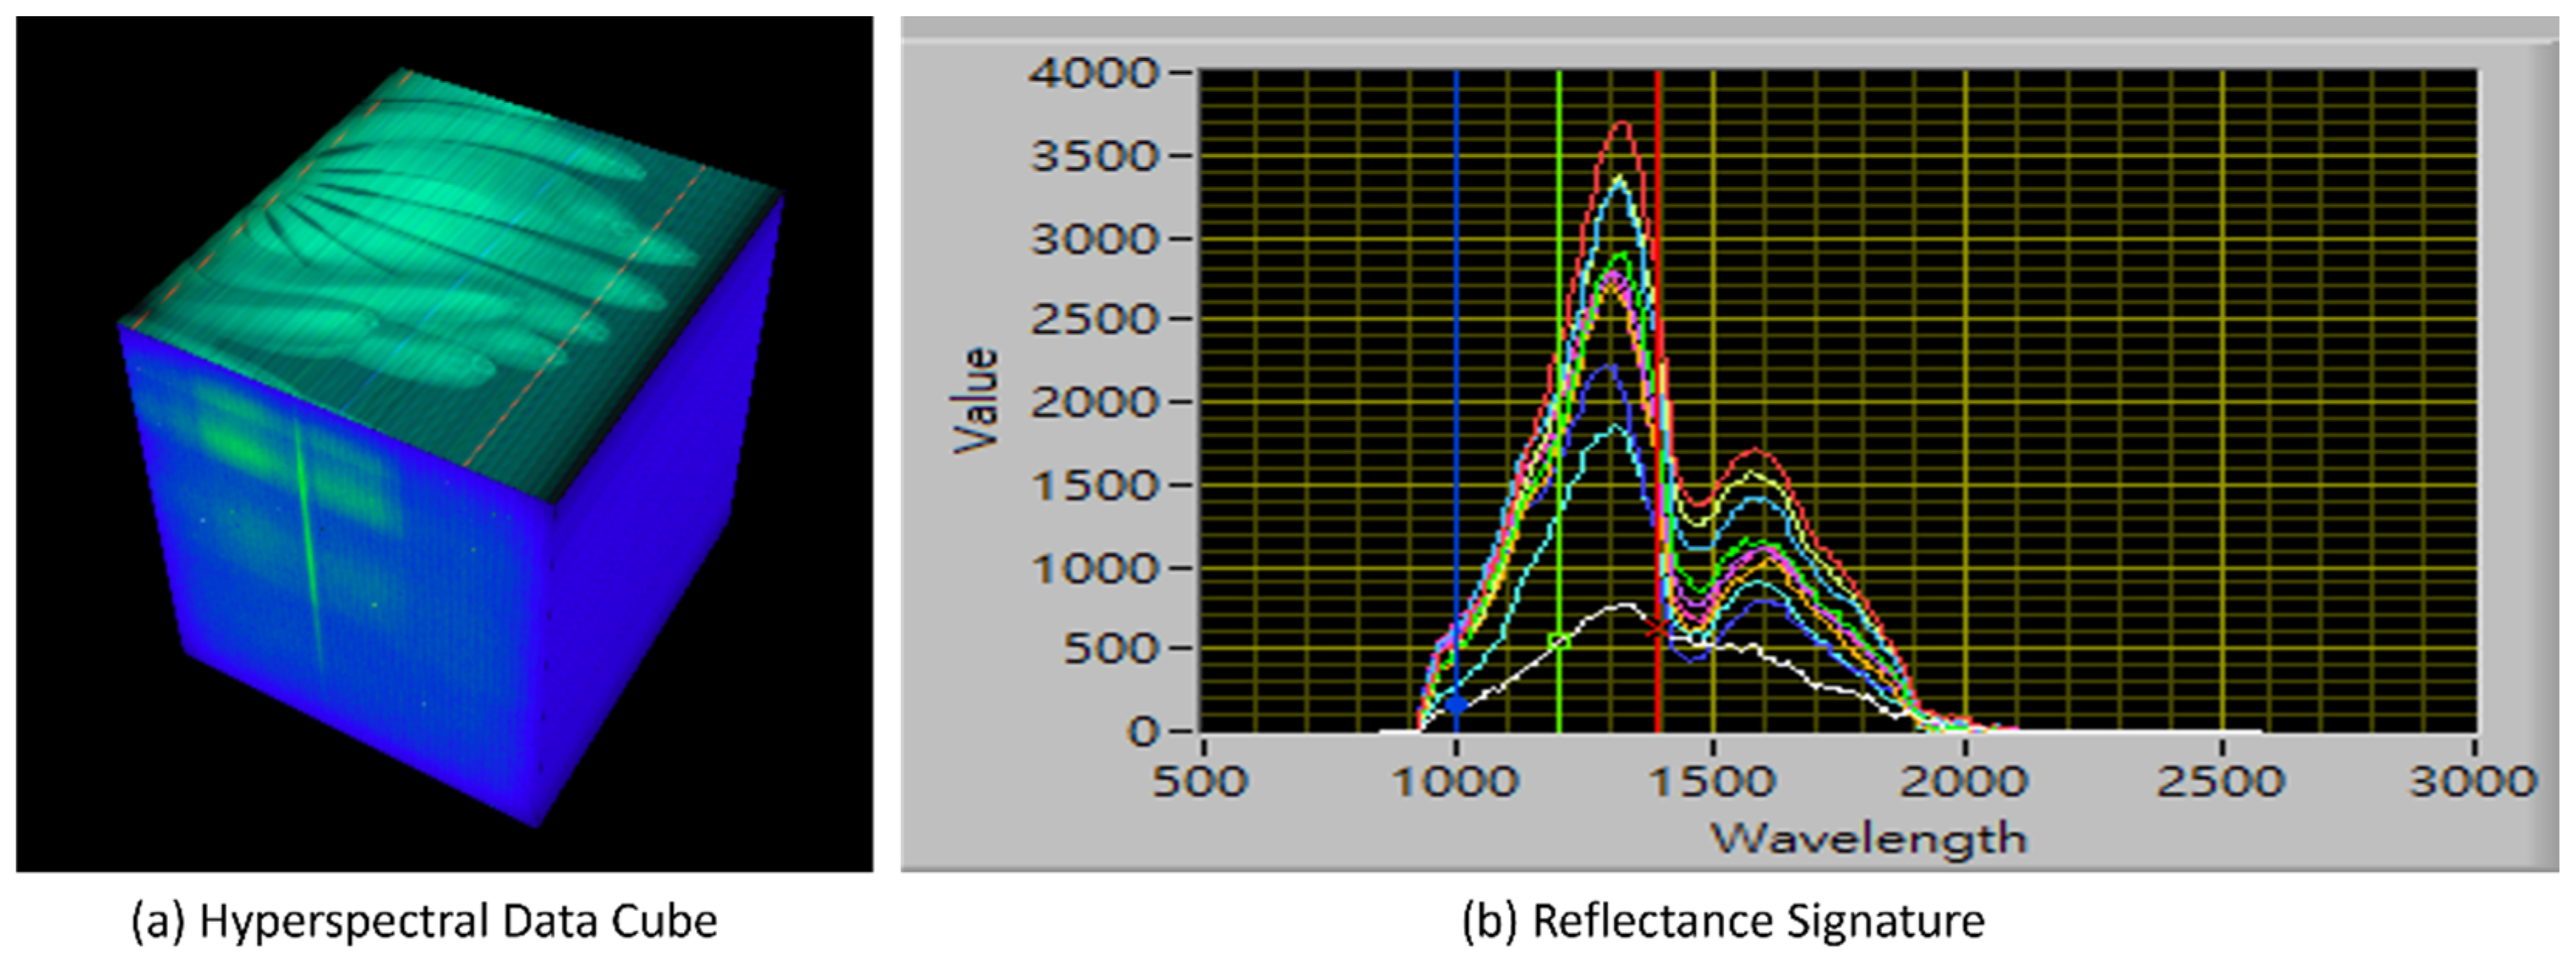
Figure 3a illustrates the hypercube data of a sample captured using the hyperspectral camera. The height of the cube refers to the number of bands, while the length and width of the cube are the dimensions of the HS image.
Figure 3b shows the reflectance values or reflectance signatures of several points in the hyperspectral data.
Hyperspectral Imaging has been used in several studies in the literature to extract features of objects that cannot be processed using visible-light imaging. Reflectance signatures are used to assess various leaf pigments and cellulose based on different wavelengths [
33]. Data from hyperspectral imaging can estimate the biophysical parameters of a rice crop using reflectance and hypercube data [
34]. For internal banana qualities, reflectance values were used in predicting the maturity level of bananas that were correlated with the banana’s moisture content, firmness, and chlorophyll content [
5]. In addition, wavelength bands in specific ranges are contributed to by the water content of the fruit, as well as the amount of total soluble solids, as evident in a study of predicting banana quality based on hyperspectral data [
31]. Thus, in this study, reflectance values and hypercube data were considered as features included in the neural network.
Due to the immense amount of hypercube data, using all the bands for feature extraction would need more memory resources, and therefore uneconomical and inefficient. Hence, wavelength selection was undertaken in this study. In reducing the high dimensionality of the spectral data, an optimal wavelength was selected, which can carry valuable information to represent the whole spectra. The manual selection of wavelength was used based on grayscale images derived from reflectance intensity at each band. The most discriminating band (1069.21 nm) was chosen, which showed brighter images. An image file in jpeg format was created at wavelength 1069.21 nm, and the mean reflectance values for all points in that same band were obtained.
As with RGB feature extraction, the Haralick value was also computed on the jpeg file constructed from the hyperspectral data. Four features were used as inputs using hyperspectral data. These were mean reflectance values for all bands, mean reflectance values at band 1069.21 nm, the mean texture value from the HS image, and the image file in jpeg format.
Table 3 shows the features extracted from RGB images, hyperspectral images, and data cubes. Texture value refers to the value obtained using the Haralick function. Size and view classifications refer to the banana size (large, medium, or small) and banana view (front and back view) obtained using the separate AI model implemented in this study. Aside from features automatically extracted by the system, the CNN was responsible for extracting other distinct features of the different banana classes using RGB and hyperspectral images acquired. Images will be fed into a CNN, while numerical and categorical values were subjected to a multilayer perceptron network (MLP).
2.3. Neural Network Topology
A neural network is a series of algorithms that mimic the human brain’s neural network. It is an architecture that can be thought of as a network of neurons organized in several layers—namely, an input layer, one or several hidden layers, and an output layer. A neuron in a neural network is a mathematical function that handles information depending on a specific architecture. The hidden layers fine-tune the weights of the input neurons to minimize the neural network’s margin of error.
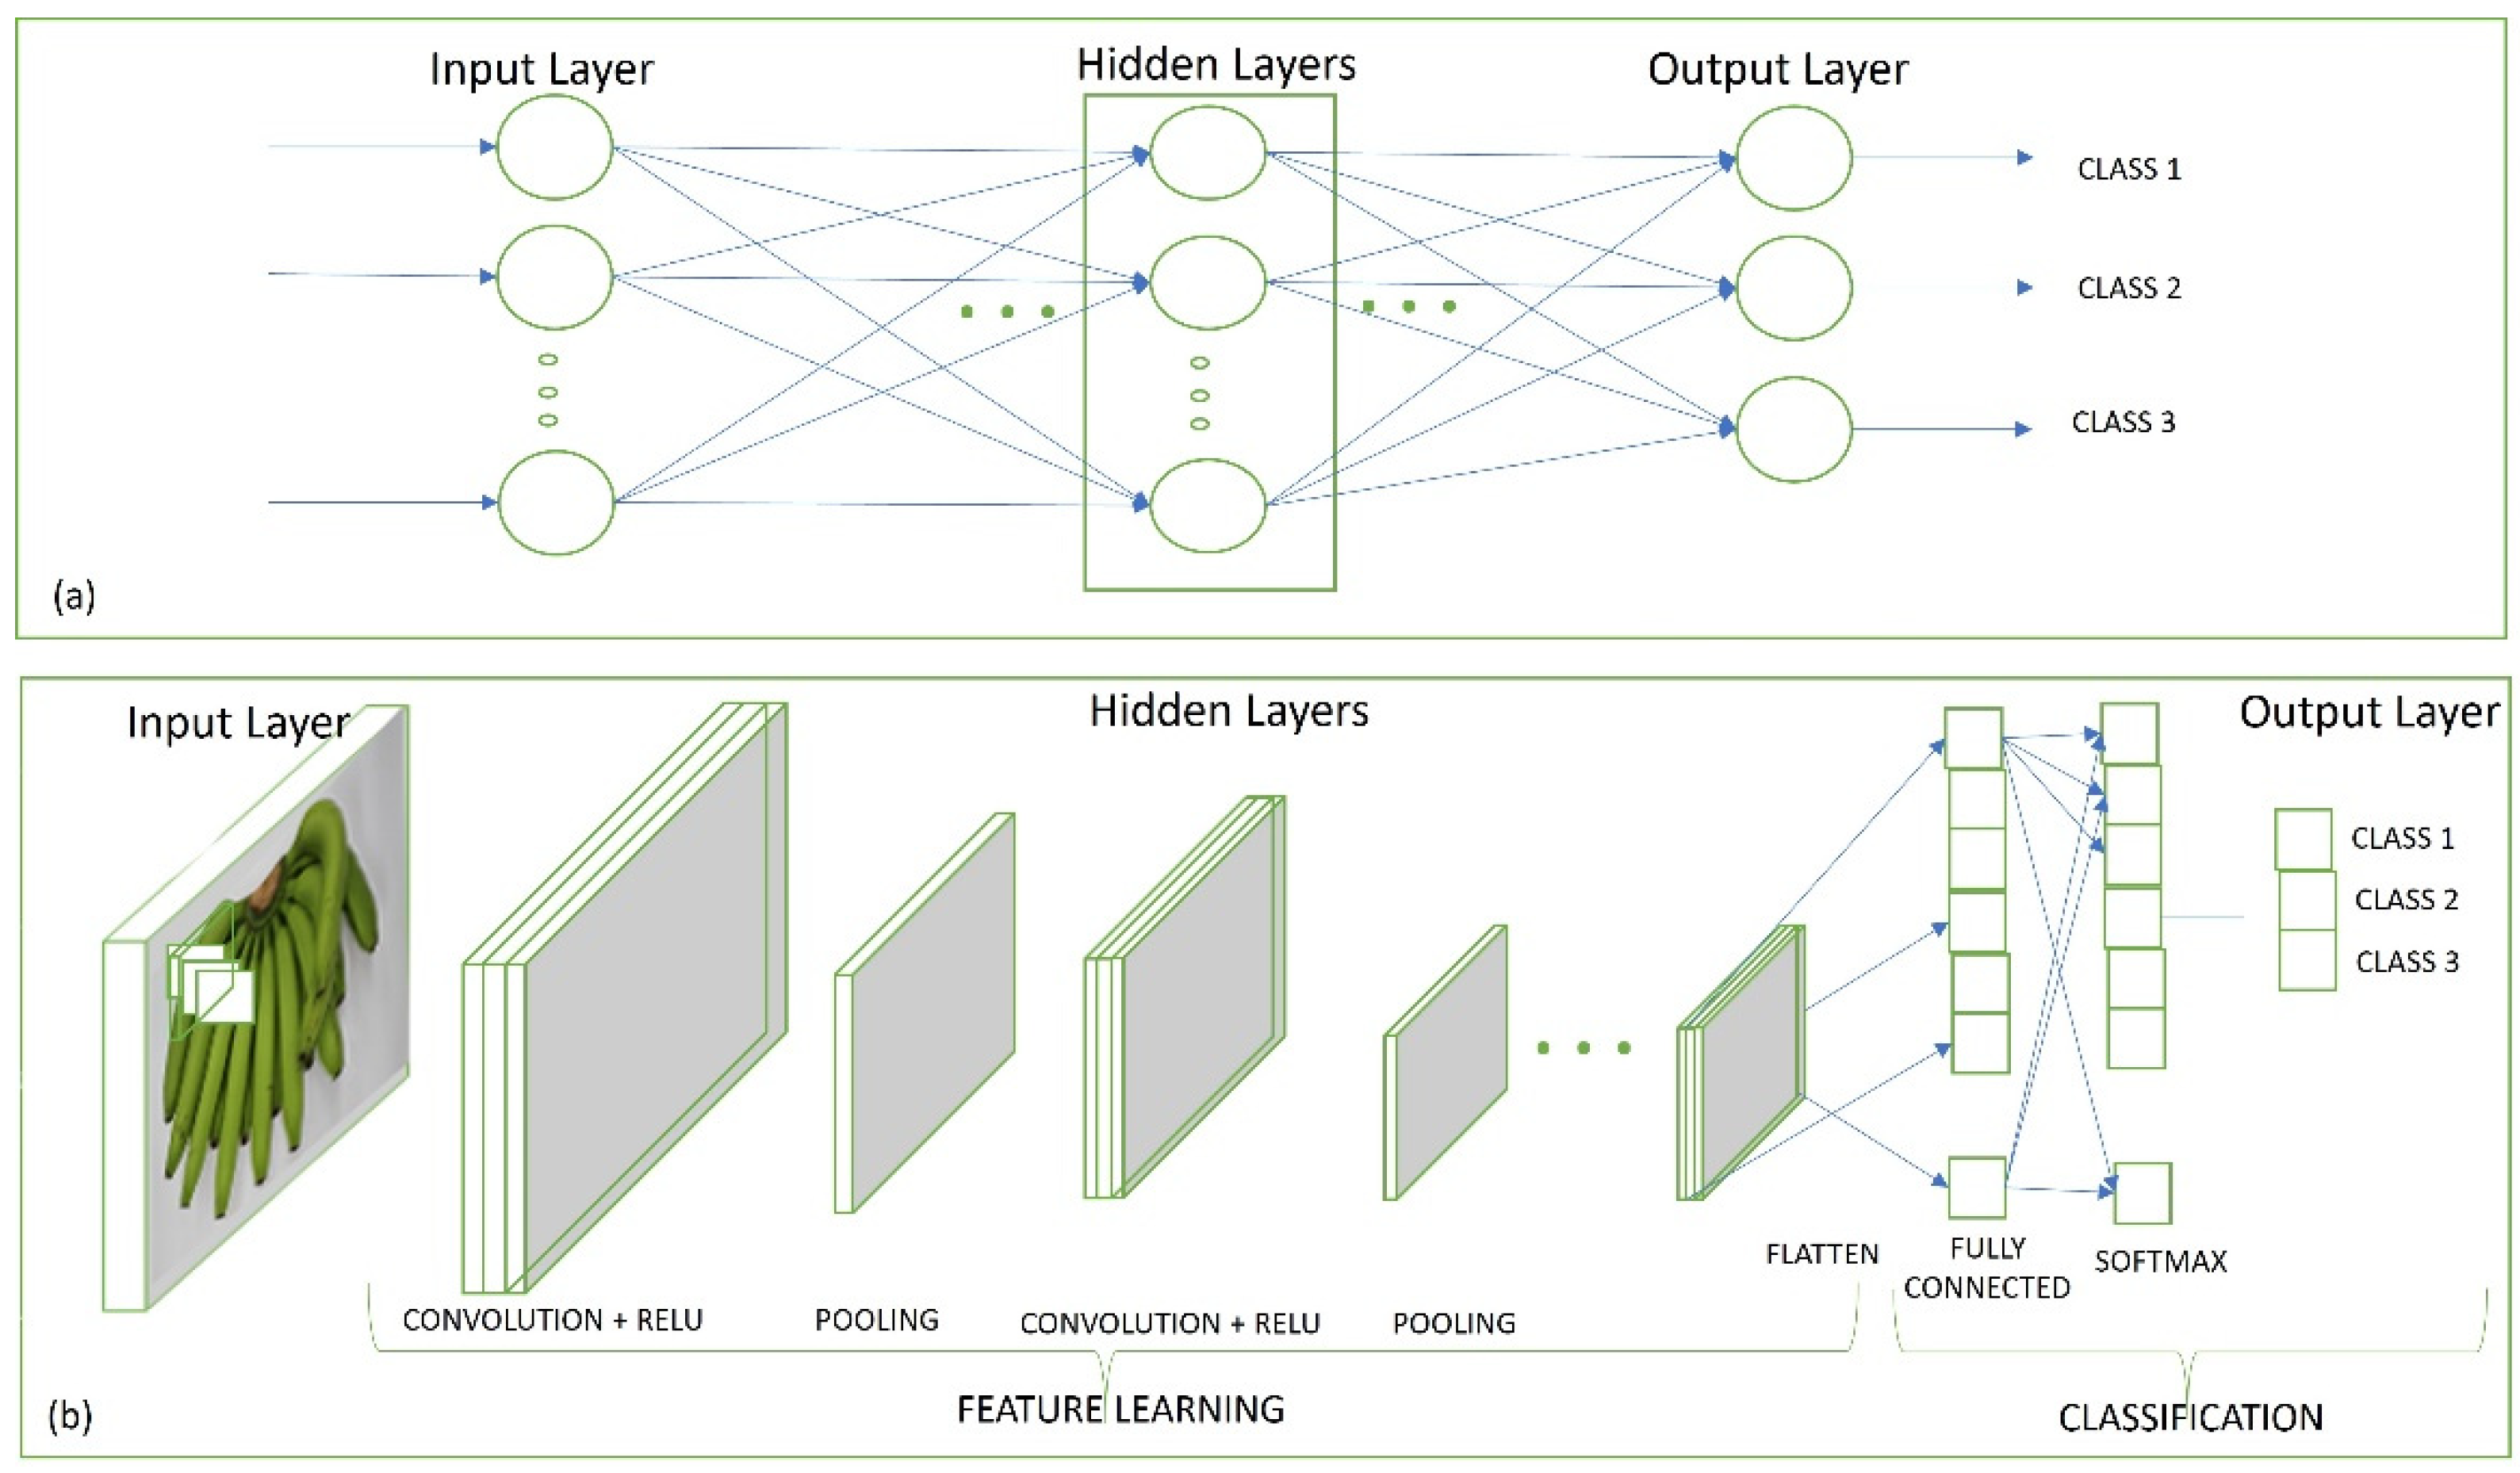
There are varied architectures of neural networks. Multilayer Perceptron (MLP) and Convolutional Neural Network (CNN) are some of the architectures commonly used for classification and were used in this study. MLP is a neural network of interconnected nodes, and wherein each node is a perceptron that feeds the signal produced by a multiple linear regression into an activation function that may be nonlinear. On the other hand, CNN is a class of deep neural networks primarily used in analyzing visual imagery. CNN’s are regularized versions of multilayer perceptrons. The model architecture for the neural networks used in this study is shown in
Figure 4.
CNN image classification takes an image as input, processes it, and outputs the result in the output layer. Convolution is the first layer, and the following hidden layers of CNN extract features from the input image. The convolution layer is followed by an activation function, such as ReLU (Rectified Linear Unit), which introduces non-linearity in the CNN. The ReLU function will output the result directly if it is non-negative; otherwise, it will output a zero. The pooling layer decreases the number of parameters or the dimensionality of each map but still retains vital information. After a series of convolutions and pooling layers, another layer flattens the matrix into a vector and is converted into a fully connected neural network. The fully connected layer is composed of the weights and biases of the neurons, which are then fed into an activation function called the softmax. The softmax function is usually preferred for multi-class classification, wherein the value returned by the softmax function is the probability member for each of the output classes.
2.3.1. Banana View and Size Classification
In obtaining the banana grade, features, such as size and view need, to be obtained first. The banana view and size classification were obtained using different CNN models. For the banana view classification, a CNN model combined with a multilayer perceptron (MLP) model was constructed. The image files were also resized to 224 × 224 pixels to match the input layer of the CNN (224 × 224 × 3). Data augmentation, such as rotation of images, was implemented for the banana view classification to increase the number of input data four times (i.e., 516 × 4 = 2064) samples for banana view classification). A sequential data model was added on top of VGG16 CNN architecture using functions from Keras libraries.
The convolutional neural network model was utilized for the size classification of bananas with VGG16 CNN architecture as the base model. The input layer for size classification comprises images with a resolution of 224 × 224 in three RGB channels (224 × 224 × 3). The model type implemented was a sequential model on top of the CNN base model type encoded using Keras open-source libraries. Summary models for both banana size and banana view classifications are shown in
Tables S2 and S3, respectively.
2.3.2. Banana Grade Classification
Various CNN architectures were experimented with in this study using different inputs. Some of the architectures implemented were VGGNet, ResNet, DenseNet, and other sequential types of CNN. Results of the preliminary experimentation of different CNN models are shown in
Table 4. Images derived from the RGB camera and hyperspectral camera were fed into different CNN models to determine which architecture will suit the data inputs. Validation accuracies for different architectures were recorded in the three runs, and the model with the best validation accuracy was chosen. Out of all the CNN models implemented, VGG16 showed promising results. Thus, VGG16 was used as a backbone CNN network for this study.
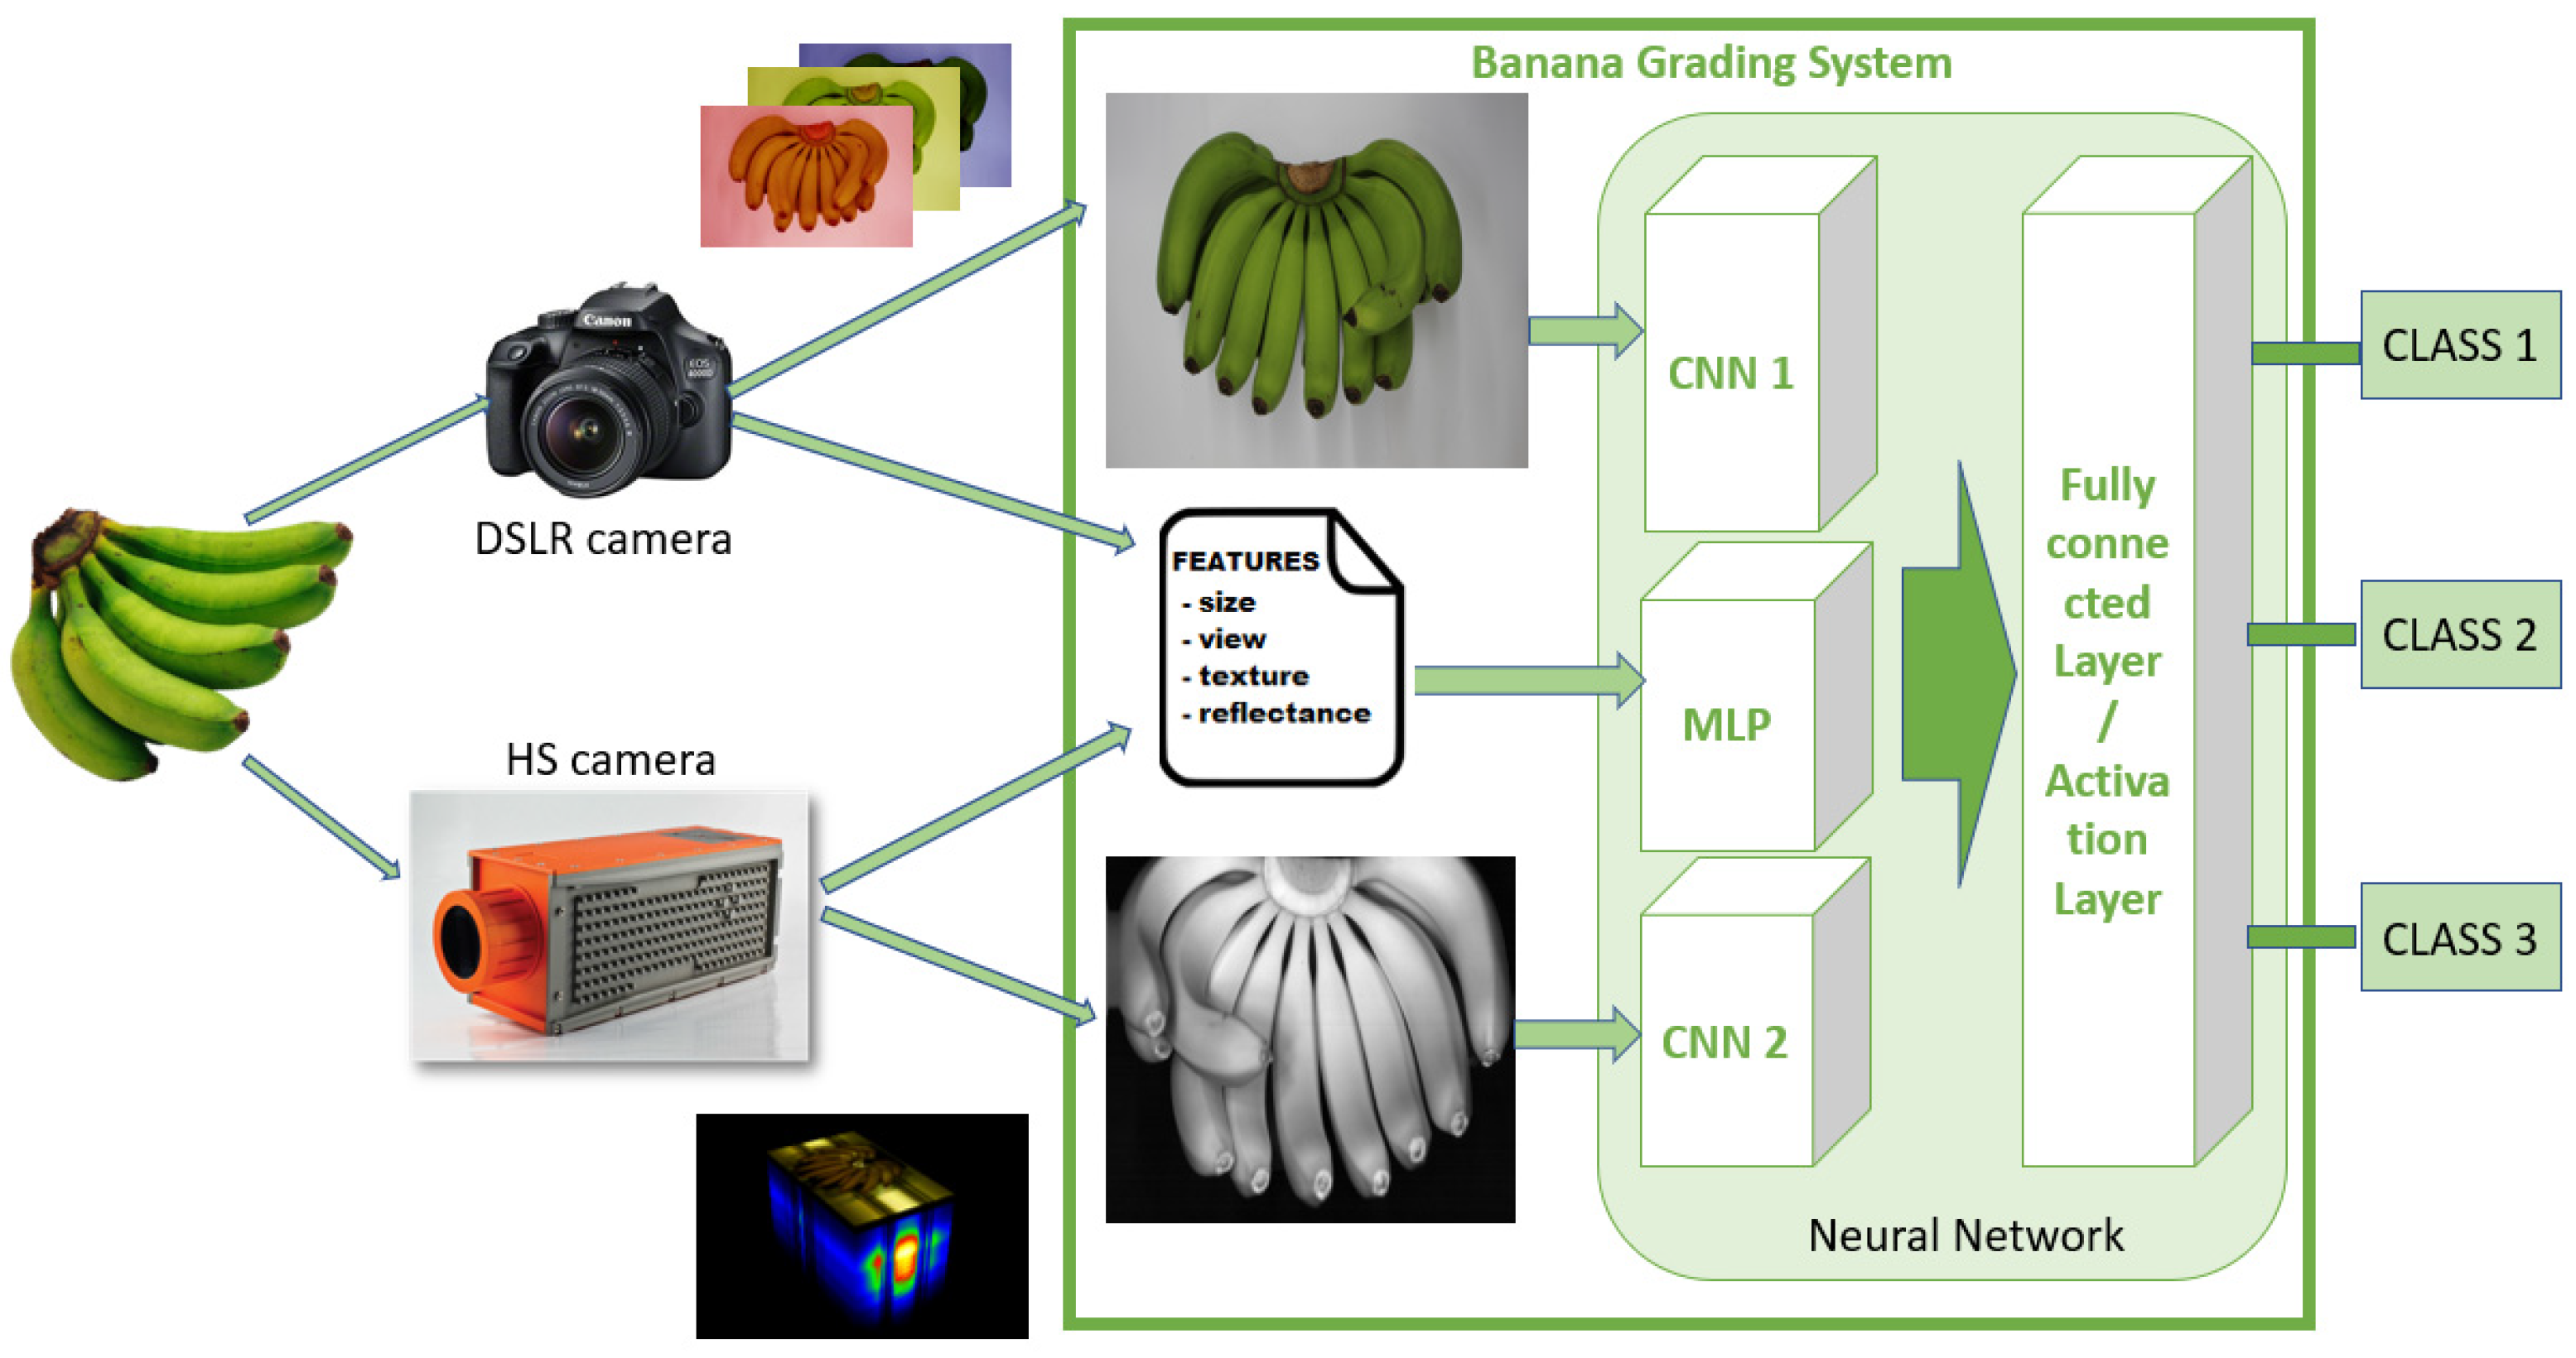
Figure 5 shows the overall architecture of the entire banana Grading System. As shown in the figure, the inputs were images captured using the two cameras. Features that were used as input in MLP were size (result from banana size classification), view (result from banana view classification), texture (using Haralick function), and reflectance (from HSI data). Images from RGB and HSI were fed into different convolutional network models. For RGB images, the CNN architecture (CNN1) used was a CNN with Conv2D, which was intended for convolutional filters, a ReLU function, and MaxPooling2D in Keras functions. The CNN architecture (CNN2) used for images derived from hyperspectral imaging was a Sequential model added on top of a VGG16 CNN architecture.
As illustrated in
Figure 5, the banana grading model was composed of two image files and a set of numerical data as input into different neural networks. The first CNN model accepted an RGB image (CNN1) and outputs results, which were then passed over into the fully connected layer. The image file generated from hyperspectral data was also fed into a convolutional network (CNN2) and then output the result as an input into the final fully connected layer. The categorical features, such as the size (small, medium, and large) and banana face (front and back), were converted into numerical values combined with the mean texture and the reflectance values. The numerical values obtained from the features extracted by the system were passed into a multilayer perceptron model (MLP). The coding of the multi-input model with mixed data (images and numerical) was implemented using Keras’ concatenate API function in merging the three sets of independent neural networks. The summary model for banana grade classification provided by Keras is shown in
Table S1.
2.4. Model Training
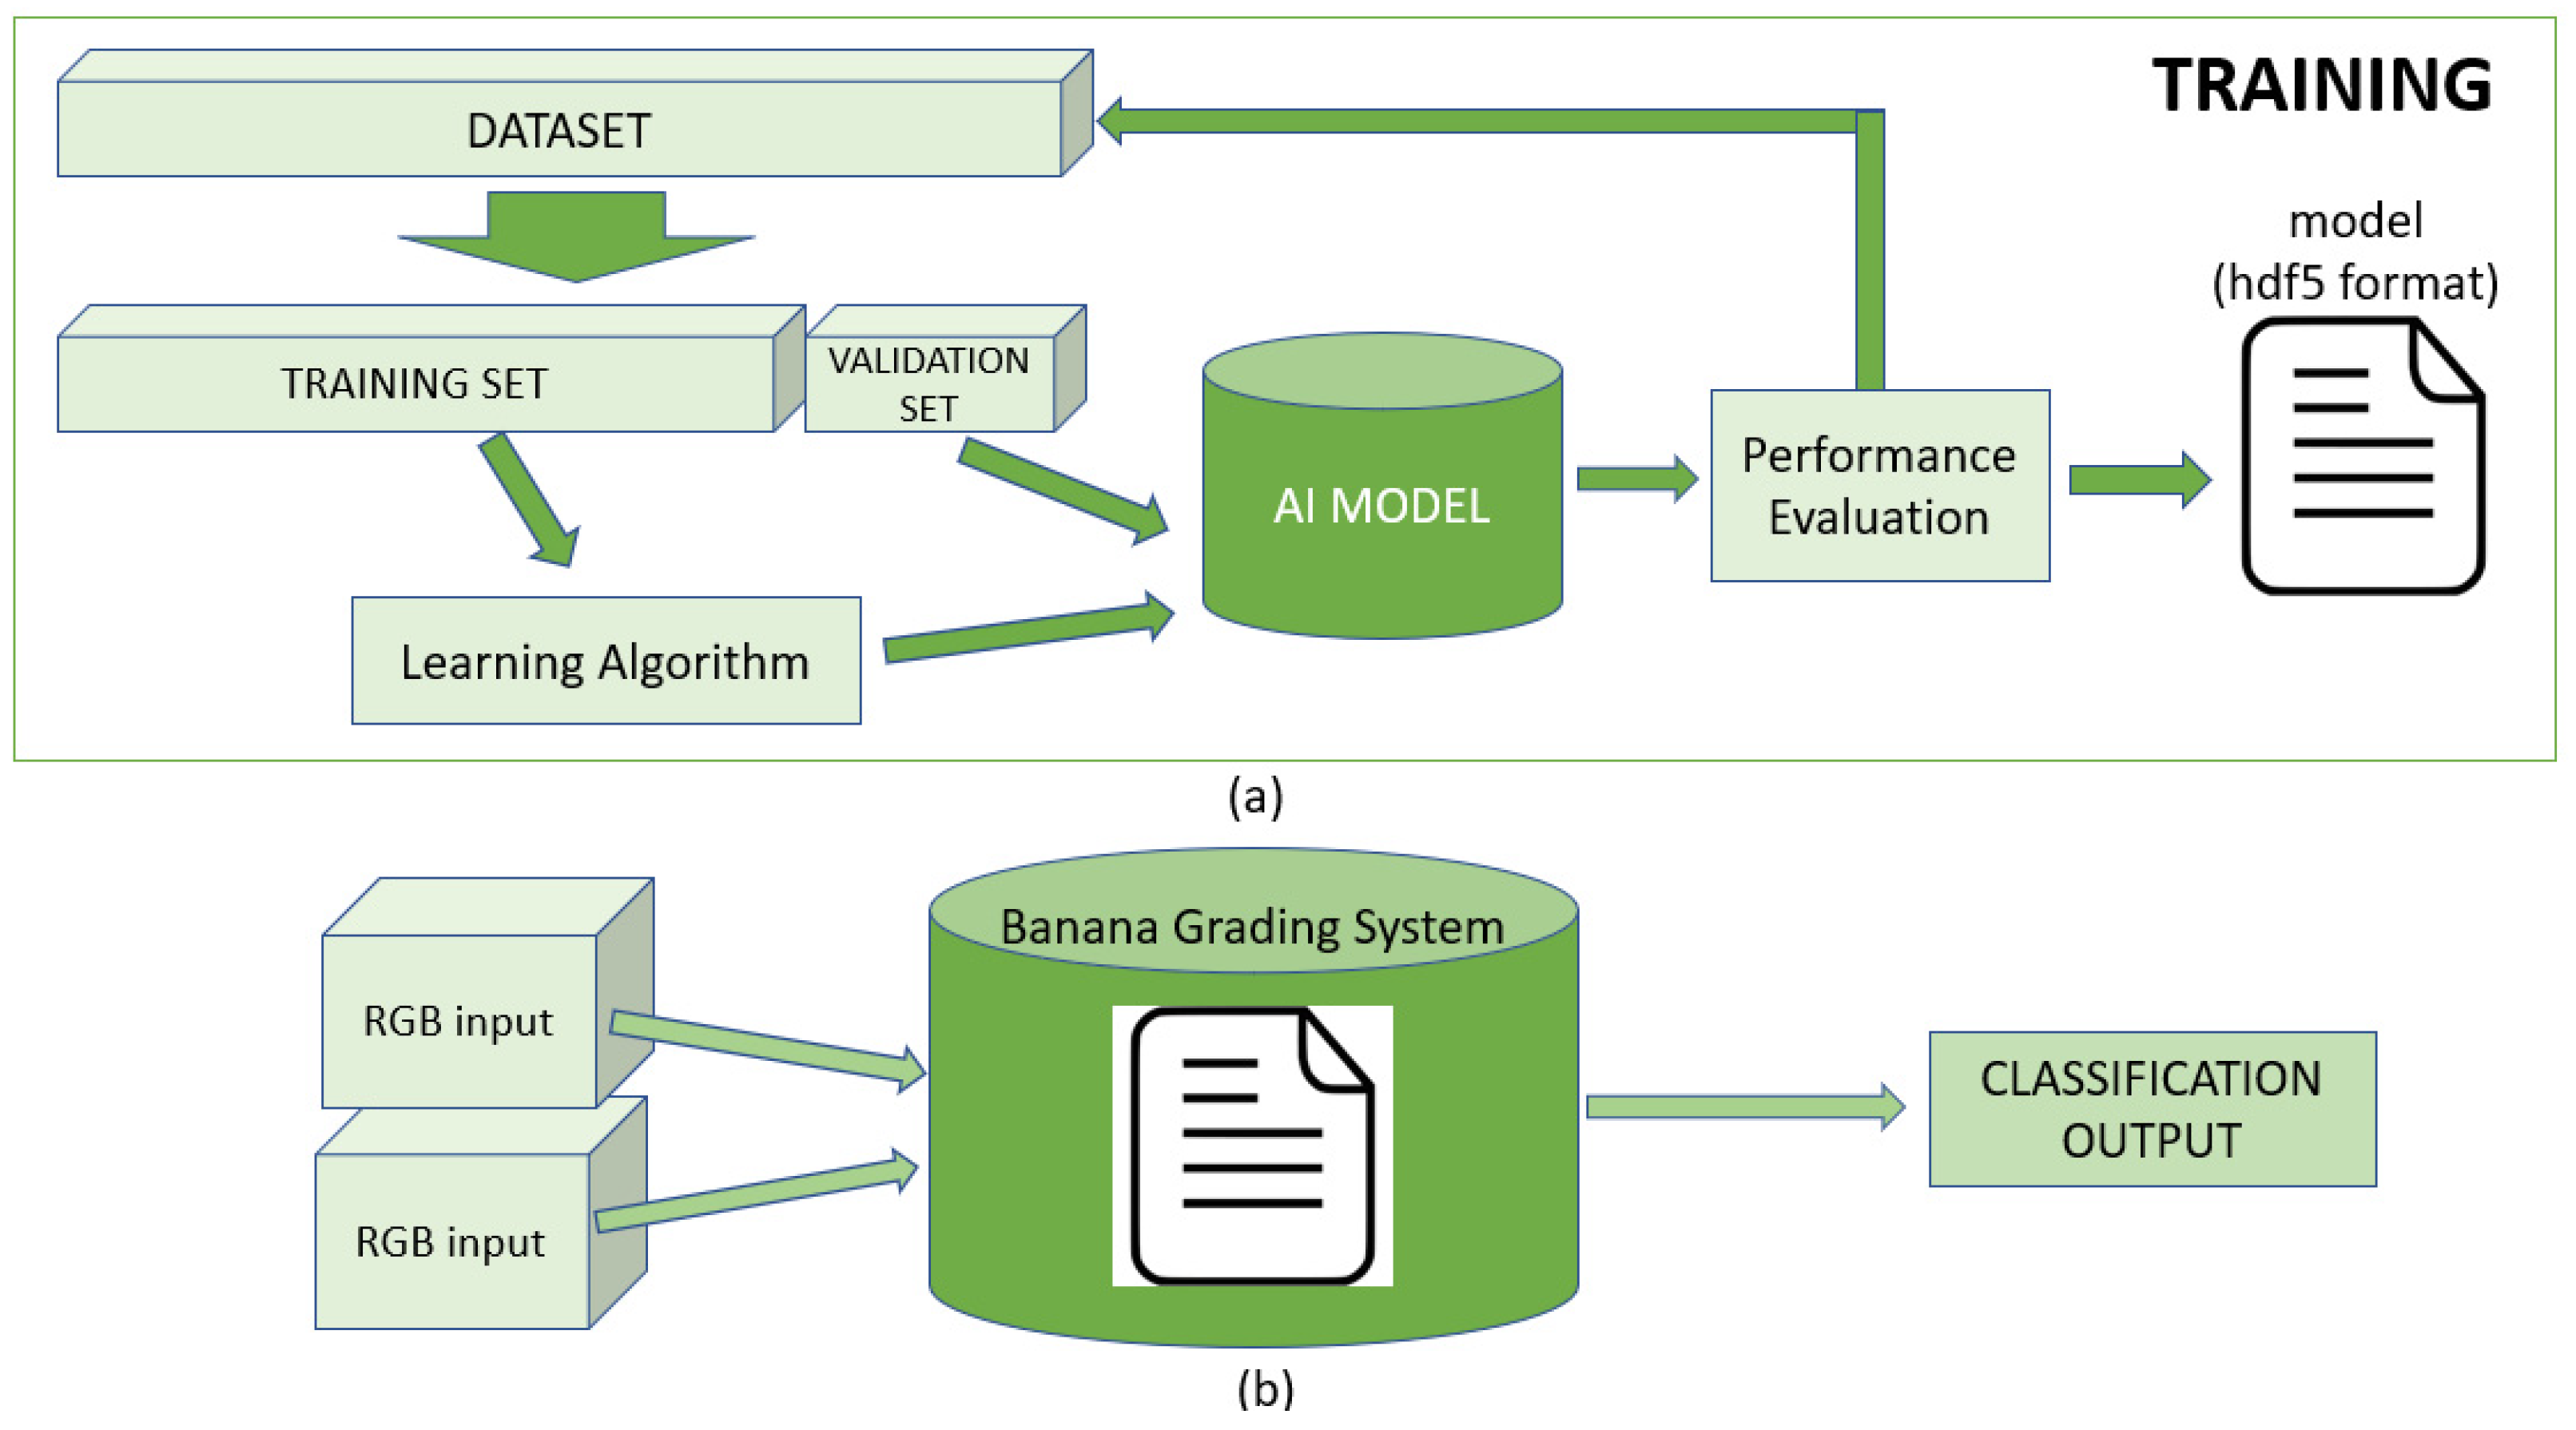
Eighty percent of the samples were used as training data, and the other twenty percent were for validation. The 80/20 rule is the most used distribution scheme for training models in data science. Using the different features obtained from RGB and HSI, which comprise the dataset, the AI model was iteratively trained and validated on these different sets, as shown in
Figure 6. Validation accuracy was calculated in every epoch, and the highest accuracy was recorded.
The hyperparameters of all the neural networks employed in this study were fine-tuned to attain satisfactory results. The program was run several times, and the best validation accuracy score was recorded using Keras’ checkpoint functions. The model with the best validation accuracy value from the checkpoints at different epochs was recorded, and the weights for the neurons in the neural network computations were generated and saved in an hdf5 file for the actual classification of bananas (
Figure 6a).
Python libraries from the Scikit-learn platform with Keras Models and Tensorflow as the backend were used in the implementation of this multi-input deep learning model. All coding plugins were performed using Python language, and data analysis was performed using Jupyter notebook.
All training processes implemented in the study were run using Tensorflow-GPU, meaning all computations of multiple parallel processes in the neural network were optimized using GPU processors. The computer specification of the machine used in this study was an i7 processor with a CPU speed of 2.6–3.5 GHz w/Turbo Boost, 16 Gb of RAM, and a CUDA-enabled Nvidia GeForce GTX 1060 with 6 Gb GDDR5 of video memory. The running time for training the models and the actual classification of the grading system were recorded and used for performance evaluation.
3. Results
In this paper, the multi-input deep learning model was evaluated and integrated into a real-time grading system for classifying bananas in terms of quality. Specifically, in this section, (1) the performance of the grading system was inspected, (2) the performance of the classifiers generated, and the multi-input architecture were examined, and lastly, (3) the performance of the different methods explored was compared.
3.1. Grading System Performance
The AI models produced in this study were able to create different classifiers for bananas, as shown in
Figure 7. These were size classification (small, medium, and large), view classification (front and back), and the main goal of the system, which is to identify the banana class or grade.
The Banana Grading System captured features obtained from RGB images and the HSI features, such as reflectance values and signatures obtained from hypercube data of the bananas. The system also considered the size component since bananas for export have a recommended size guideline to be followed. The automated system was able to predict the size and banana view (front—for the top view of the banana, back—for the bottom view of the banana).
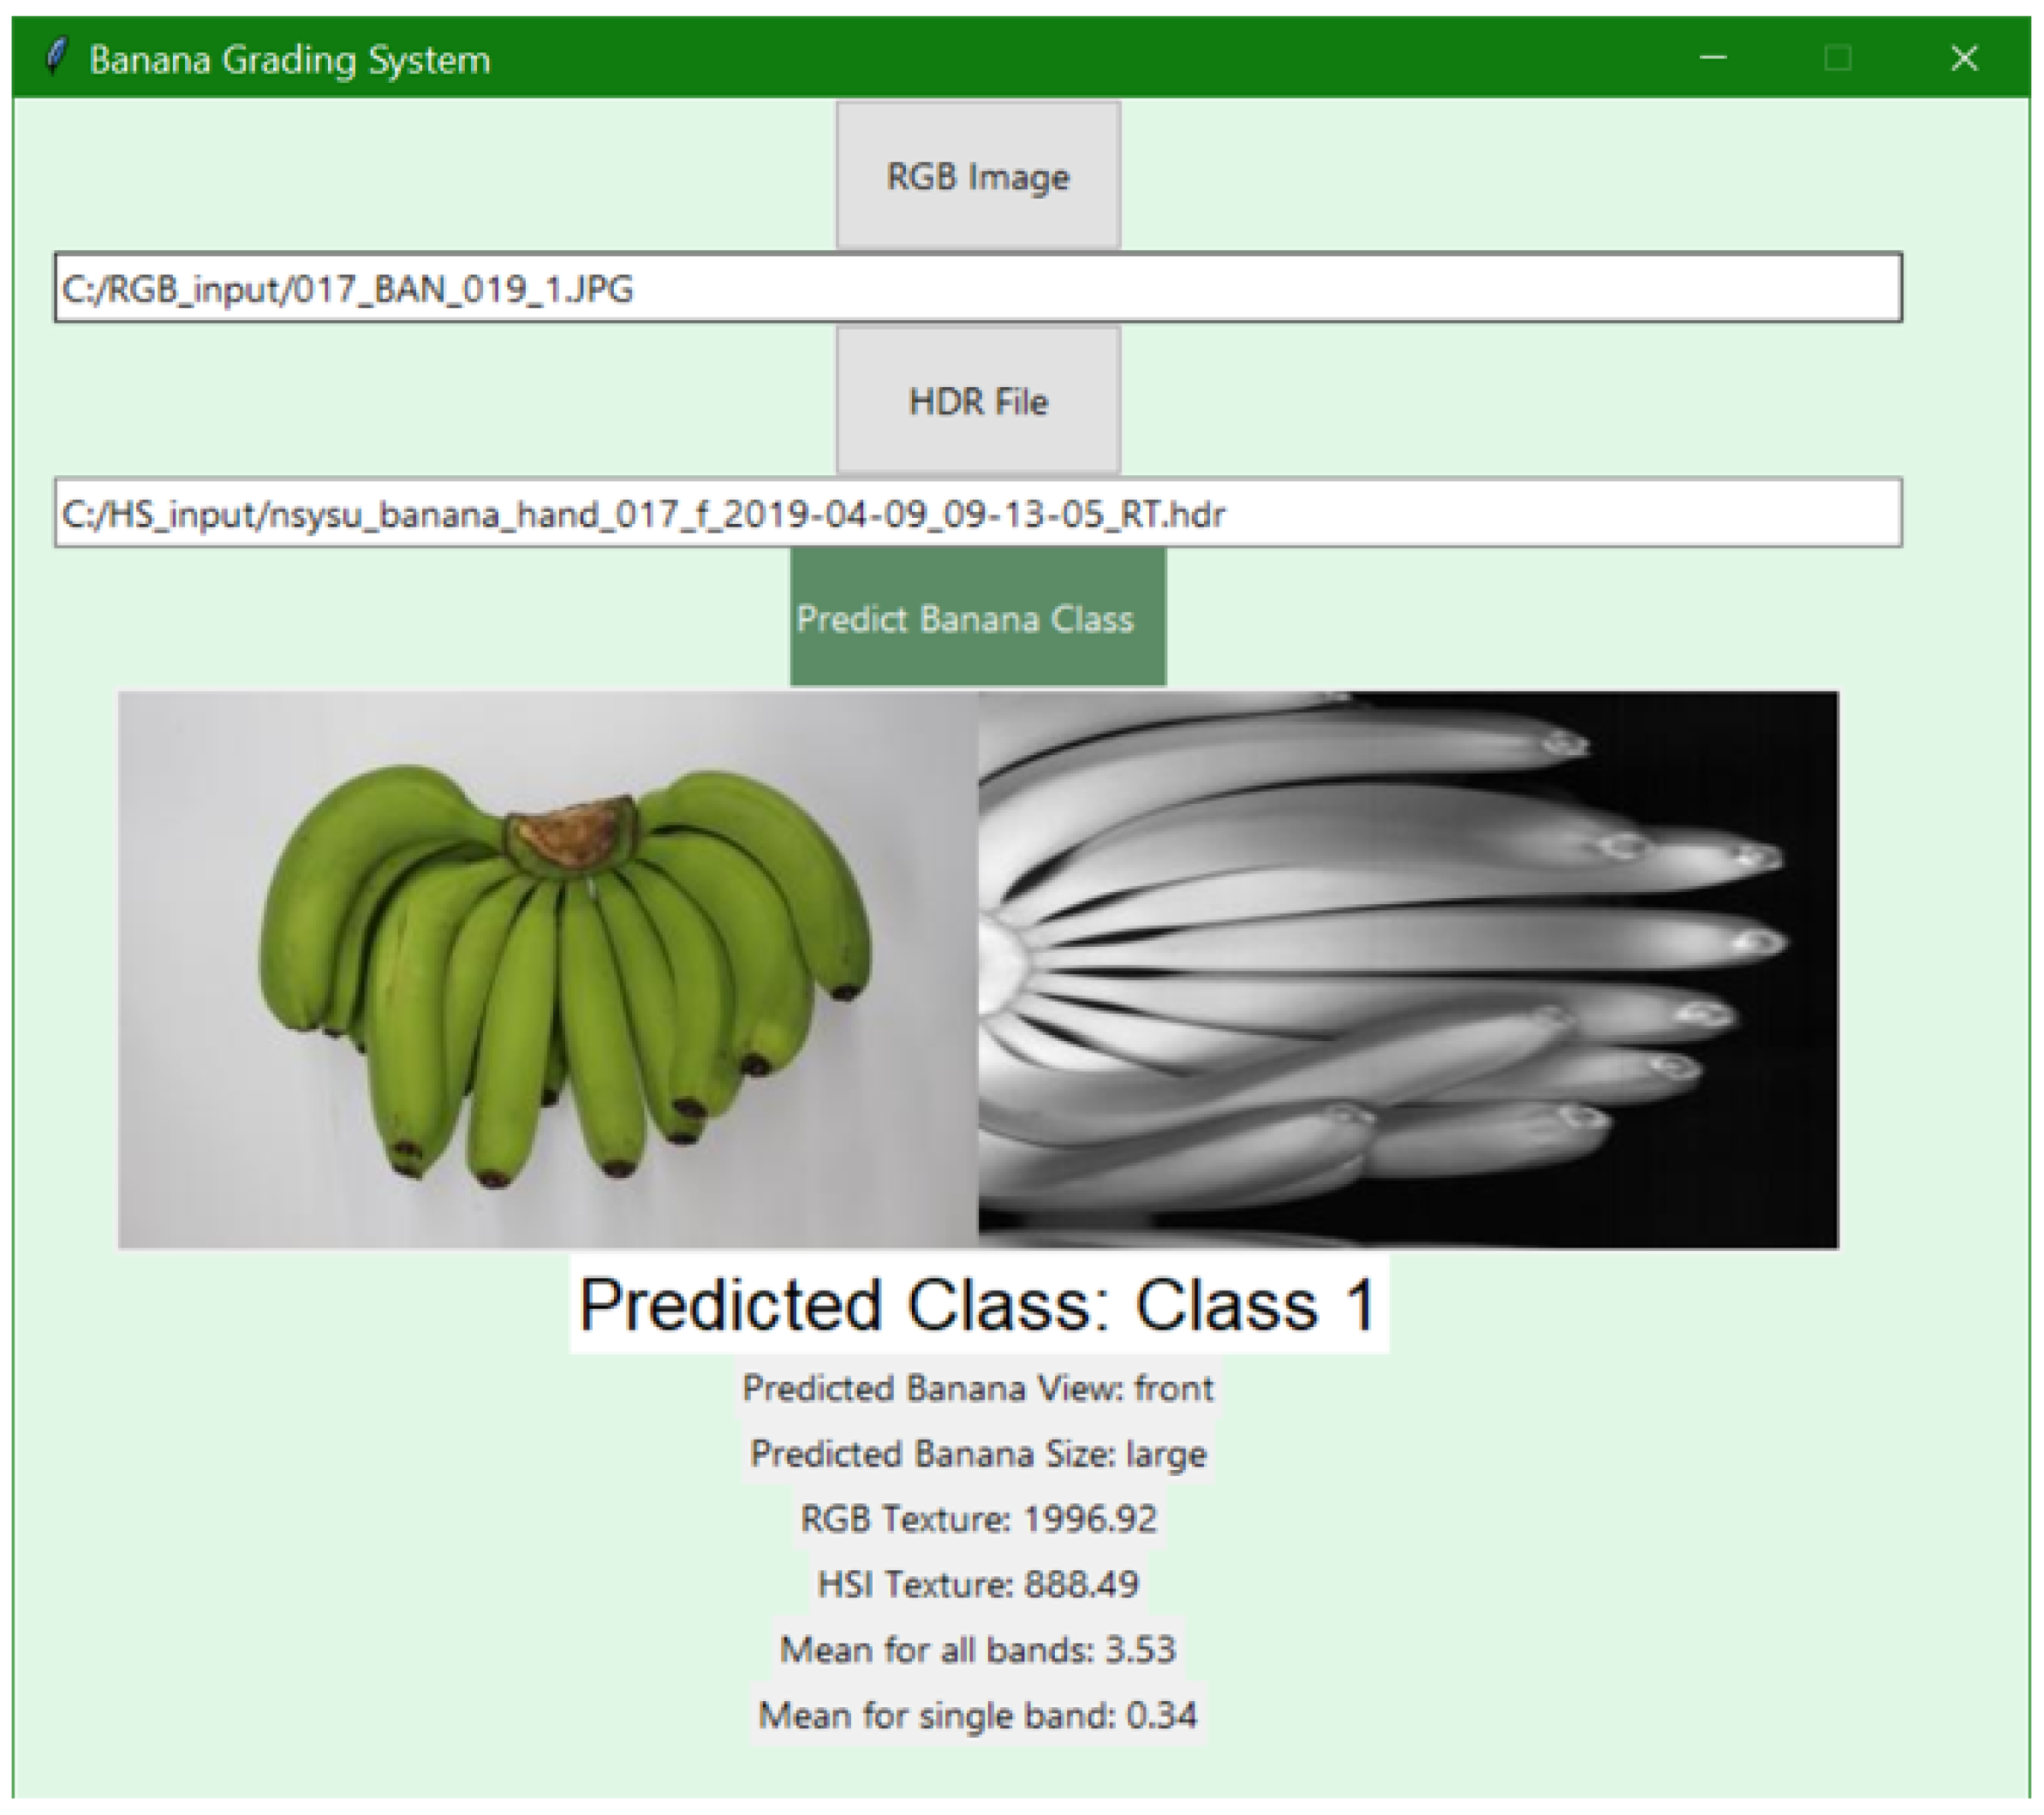
A screenshot of a sample output of the implemented grading system is presented in
Figure 8. The automated system will take two inputs. One is a jpeg file captured using RGB camera, and another is hyperspectral data in hdr format captured using a hyperspectral camera. The system can predict the class and display other features extracted using all the trained models of the system.
3.2. Performance Metrics
The evaluation metrics used were classification accuracy and confusion matrices. The classification accuracy is the percentage of correctly predicted banana class over the total number of data samples in the multi-input model. The best validation accuracy obtained from different runs of training the system was around 93.27%. The overall classification accuracy obtained by the system was the prediction accuracy computed using all the test samples fed on the AI model with saved weights during the final test run, which resulted in a high accuracy of 98.45%.
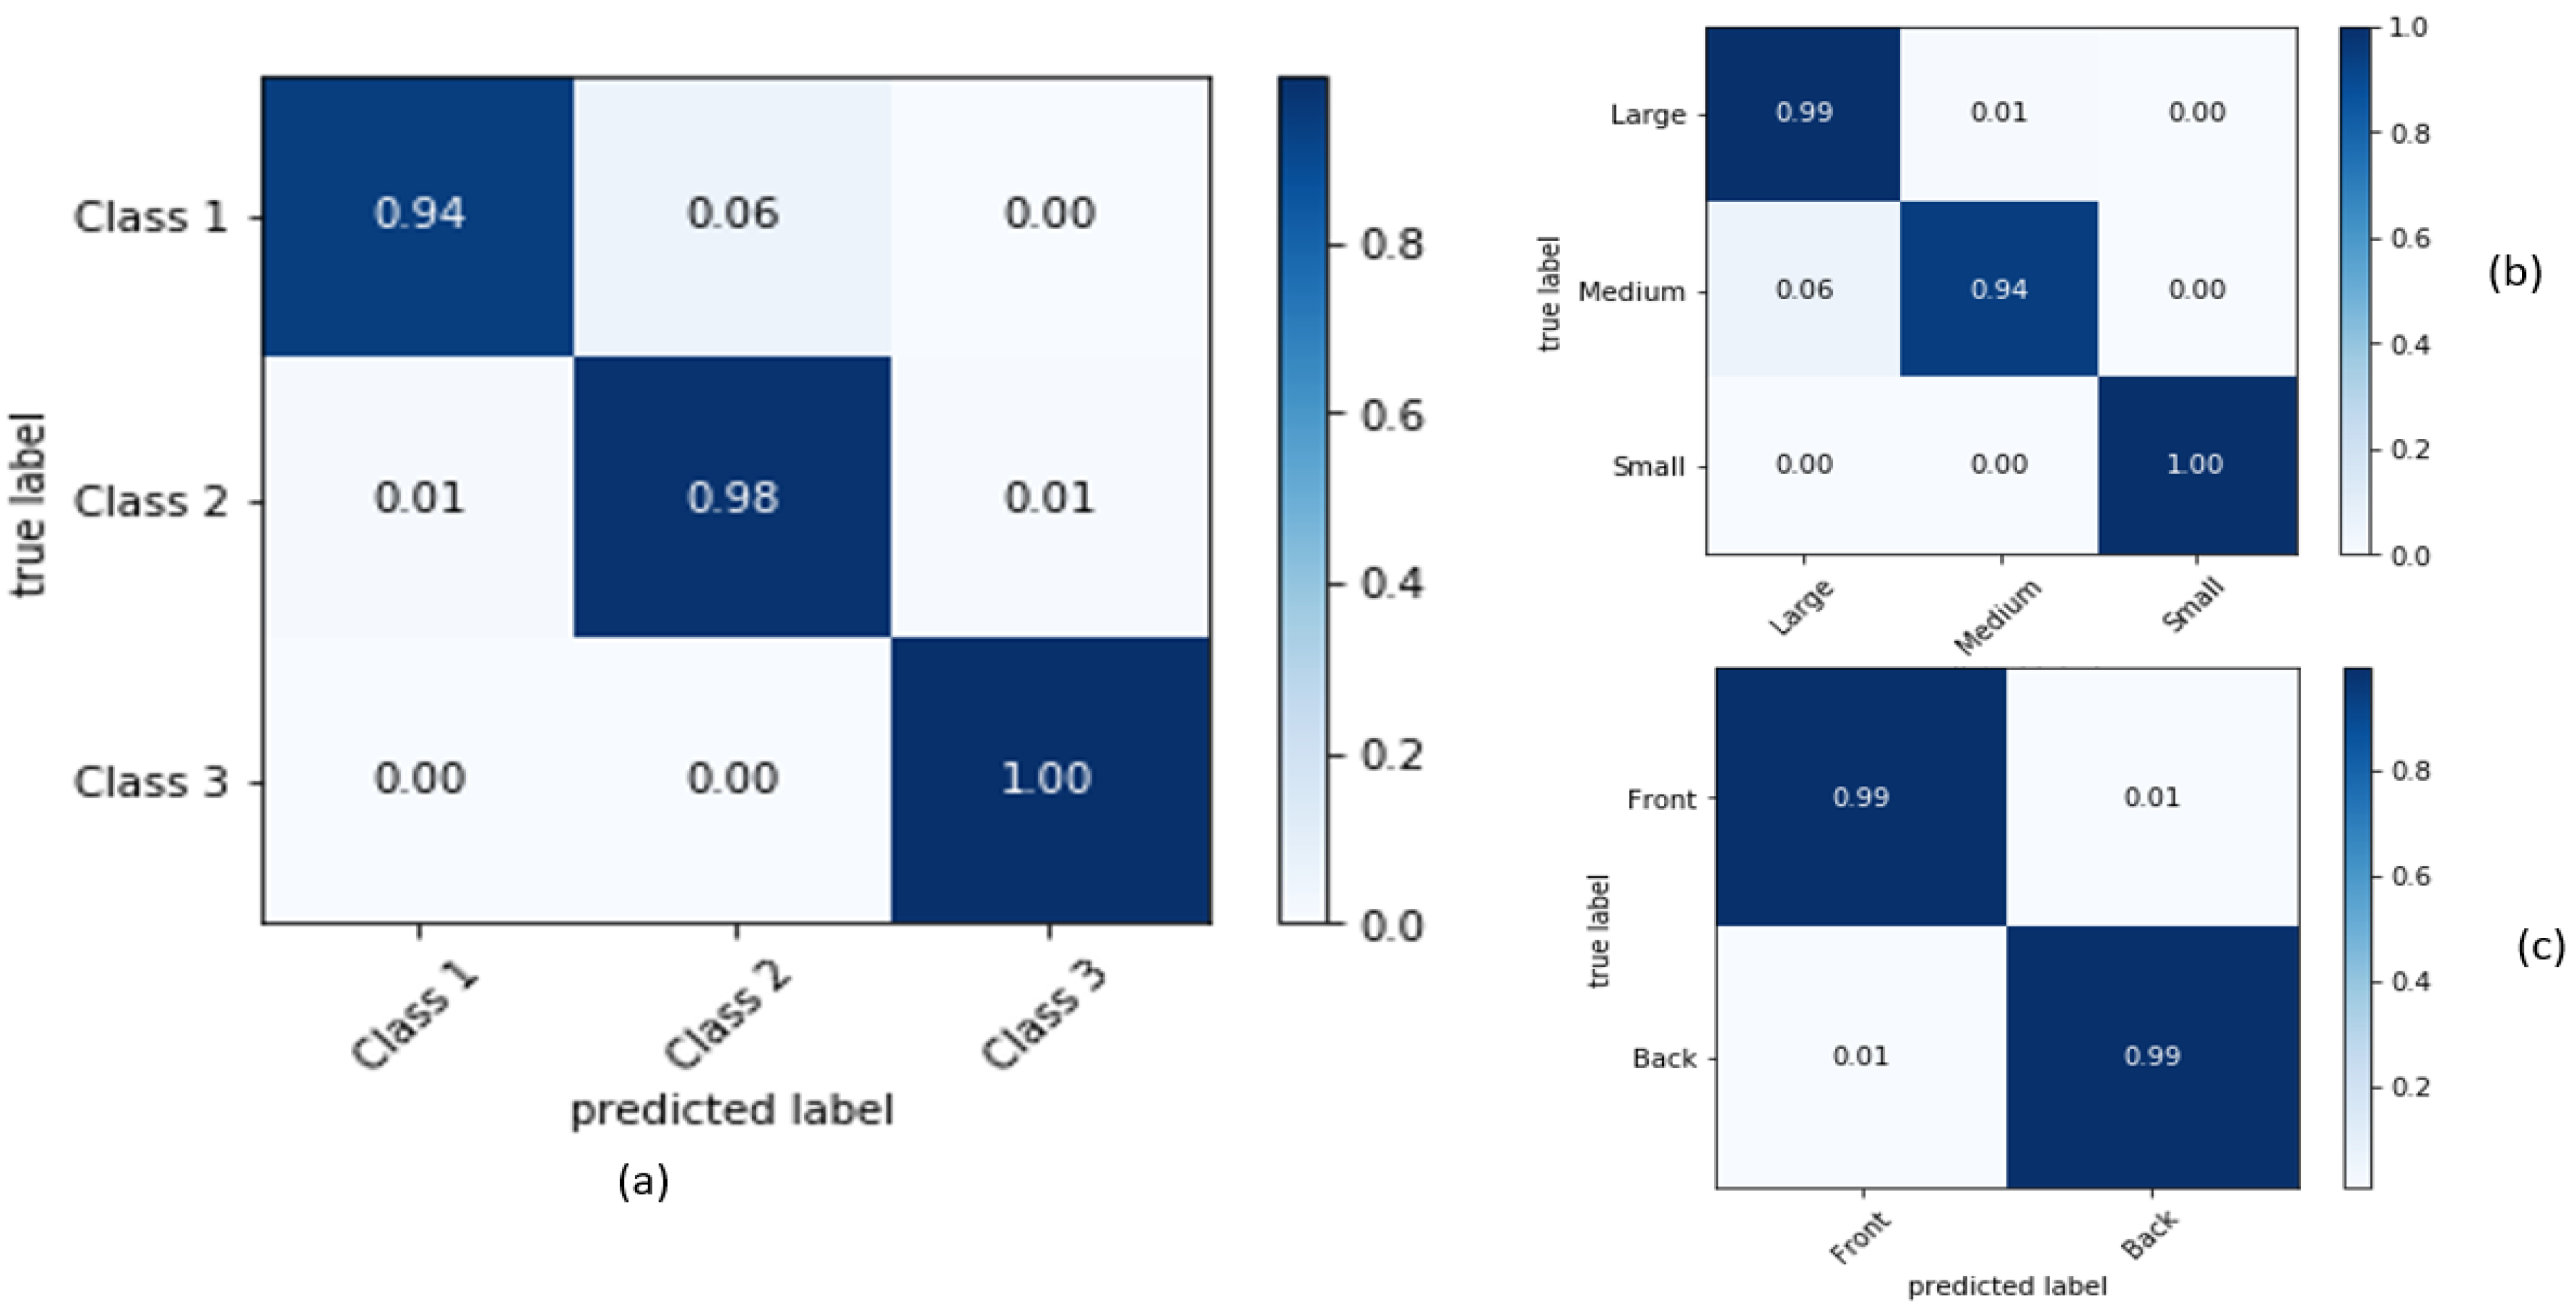
Another metric to evaluate the performance of the implemented multi-input model using all features from RGB and HSI was through the confusion matrices, which are shown in
Figure 9. The confusion matrix shows the actual labels as well as the predicted classification of the bananas. For size and banana view classification, the models performed very well with 99% confidence (
Figure 9b,c). All small bananas were predicted correctly, while medium bananas were predicted with 94% accuracy, and large bananas for export showed 99% accuracy. Size and view prediction accuracy must show good results since these are among the features needed for the actual banana grade classification.
As evident from the matrices (
Figure 9), the diagonal elements shown in blue boxes are the true positives (TP) or the correct prediction, while off-diagonal elements are misclassified by the model. The blue color indicates a high number of samples, which implied a high number of positive classifications.
In the banana grade classification model, the Reject Class was correctly recognized, while the Class 2 banana classifier performed well with 98% accuracy. For the export class or Class 1, a 94% accuracy was obtained, and this can be due to sampling size since Class 1 had the least number of samples compared to other classes. However, based on the confusion matrix (
Figure 9a), there was no Class 1 banana classified as Class 3 or Reject class and vice versa. The accuracy result for Class 1 was good since it remained within the guidelines on quality tolerances, as stated in the international banana standards. The codex states that for Class 1 bananas, a five percent by number or weight of bananas not meeting the requirements of the class, but satisfying those of Class 2, will still be considered [
35]. Class 1 bananas were classified as either Class 1 or 2 but not as Class 3 or the reject class.
Table 5 presents the metrics classification report for all three classifiers, generated using Scikit-Learn packages in Python. Due to the unbalanced number of samples per class, the macro average of precision, recall, and f1-score can better examine the performance of the classifiers developed. The three classifiers had a precision higher than 0.97, which means that the classifier was able to identify only the correct instances for each class. The result also indicates that the model produced only a few false positives. The recall for the three classes also showed good results of greater than 0.97, which conveys the capability of the classifier to find all correct instances per class. The f1-score, which is the weighted score of precision and recall, had a high score of above 97% for all classifiers with a slight difference from the accuracy scores. The multi-input model performed well with an accuracy of 98.45% and a macro average f1-score of 0.97570. The banana view classifier achieved the same score for all metrics, which can be attributed to the balanced number of samples per class for banana view classification.
3.3. Comparison of Different Methods
Several methods or algorithms were implemented using the same set of banana samples with different features as inputs and different modalities to evaluate the strength of the multi-input model using a fusion of RGB and hyperspectral imaging. Performance metrics performed were precision, recall, f1-score, and accuracy. The result of the various AI models is summarized in
Table 6. This study performed various methods, such as (1) RGB-only method, wherein only RGB images were used as inputs to a CNN; (2) HSI-only method, wherein the hyperspectral data were fed into a convolutional neural network model; (3) Machine Learning methods wherein the numerical and categorical features of banana were fed into known machine learning techniques. The best accuracy for every method employed was recorded and compared to the multi-input model developed in this study.
Different machine learning methods, such as Logistic Regression, Decision Tree, K-Nearest Neighbors, Gaussian Naïve Bayes, SVM, and Random Forest, were also implemented using different features (RGB color values, texture, and reflectance values) extracted from the system. However, the methods did not perform well. Only Linear Discriminant Analysis showed a higher accuracy of 57%, which comprises the accuracy of the Machine Learning method shown in
Table 6. The technique using only the hyperspectral image had an 82% accuracy, while on the other hand, the method using only RGB images had a bit higher accuracy of 89%. The multi-input model with three sets of inputs—RGB image file, HS image, and the group of numerical and categorical features (texture, size, banana view, and reflectance values) extracted from the system showed the best performance results in terms of the precision, recall, f1-score, and accuracy.
In terms of the performance of the grading system with the embedded multi-input deep learning model, the running time of the machine was computed. The coding and implementation of the final automated system were done using Python open-source libraries with TKinter for the graphical user interface. The running time for predicting the banana class using the user interface took only an average of 15 s. For the training of the AI models, which was done on Jupyter notebook tool, the process took an average of 2650 s, given that there were 516 samples trained and validated at 200 epochs and implemented using Python running on Tensorflow-GPU.
4. Discussion
The multi-input model involved a concatenation of CNN architectures for processing images obtained from RGB and hyperspectral cameras and MLP network for processing categorical and numerical features extracted, such as the banana size, banana view, and reflectance values. Fine-tuning of the VGG16 architecture network based on the pre-trained ImageNet model was implemented in this study for the CNN part. After training the models, three classifiers—quality classifier (the three classes), banana size classifier, and banana view classifier were generated in this study.
The performance of the AI model developed in this study was also compared to similar studies of grading bananas. Although this study used a new dataset, the overall accuracy of 98.45% accuracy still outperforms the two methods in [
16,
17]. In Piedad et al.’s study [
16], a satisfactory result of 94.2% was obtained using the Random Forest classifier with four features of banana tiers, the three RGB color values, and the length size of the top middle finger of the banana, which was manually acquired. A similar study by Le at al. [
17] which used the same image database as Piedad et al.’s study [
16] but with only two classifications (normal and reject), achieved an improved 96.1% accuracy using Mask R-CNN. The high accuracy result of 98.45% in this study showed the potential of the combined strengths of RGB and HSI features as compared to methods that used RGB-only imaging by previous studies. This study further improves the result in [
36] with the same set of RGB images for the classification and grading of cavendish bananas using only RGB imaging, which had an overall accuracy of only 91.6%.
With the two popular imaging techniques (RGB and hyperspectral), the multi-input model in this study can classify bananas with high accuracy compared to using only one imaging technique. The reflectance values retrieved using hyperspectral imaging also added to the essential features of bananas. Because of the high dimensionality of channels captured by hyperspectral imaging, the image produced at a specific wavelength can provide more features than only using the red, green, and blue channels. Hyperspectral imaging was able to classify bananas based on their mean reflectance values and reflectance values at specific wavelengths, which cohere to studies involving hyperspectral imaging [
5,
31]. These studies showed that reflectance values could discriminate healthy from unhealthy bananas and showed a correlation on the reflectance values at different wavelengths with the banana’s internal quality, such as firmness, moisture content, and TSS. RGB imaging, on the other hand, was able to extract external features of the fruit, such as color, texture, size, and other features extracted by CNN, which are proven in studies for classifying bananas using RGB images and neural networks [
16,
17,
36]. Banana size classification also performed well since the tier-based bananas were captured with a uniform distance from the capturing device to the base of the platform used.
The findings in this paper adhere to other studies that combined RGB with other imaging techniques (i.e., infrared and hyperspectral imaging). In Choi et al.’s study [
25], RGB imaging was used to detect external features of pears, such as shape, volume, size, and discoloration, while near-infrared (NIR) spectroscopy was used for detecting internal flavor factors. Their model achieved an accuracy rate of 97.4%. In Manliguez and Chiang’s study [
27], RGB imaging was combined with hyperspectral imaging in determining the maturity stages of papaya with a promising f1-score of 0.90. The lack of depth and the in-efficiency of the sensing capability of RGB lead to the combination of RGB with near-infrared modality in a study by Sa et al. [
37] to further improve the sensing capability of the model in fruit detection. Similar to the results of this study’s multi-input model, the comparisons used in [
37], such as the RGB-only method, performed better than another modality, which is NIR, and the combined approach improve the results with an f1-score of 0.838. The multi-input model in this study improved the hyperspectral-only approach (0.824) when combined with RGB only approach (0.898) and resulted in the RGB-HSI fusion with improved accuracy of 0.984.
The multi-input model proposed in this study solved high computing cost and resource allocation problems by selecting only one band to be fed on the CNN and extracting the necessary features from hyperspectral imaging, such as reflectance values and texture obtained from the hyperspectral image file, unlike in [
27] which utilized all bands. As evident from the running time obtained, the model training and the actual classification of the grading system are fast and reliable, which is needed to automate agricultural processes.
This study presents a pioneering approach for automated size classification of banana tiers and a novel approach of merging RGB and hyperspectral features and images for quality grading of banana tiers. The model developed outperformed other methods using only RGB images of bananas. Export class bananas were classified with 94% accuracy, while Class 2 were correctly identified with 98% accuracy. Rejects were discriminated from those healthy banana tiers (Class 1 and Class 2) with almost perfect accuracy of 100%. The high result can also be attributed to the large sample size of bananas in the reject class. However, the model for banana grade classification can still be improved to solve any overfitting of the model. It is recommended for future studies to increase samples for both the export and Class 2 bananas. The result is still in compliance with the standards for grading bananas [
35].
Non-invasive inspection methods have been widely distributed in agricultural processes combined with other emerging technologies [
13]. The automation of postharvest processes is the future of agriculture. With machine vision technology and spectral imaging techniques, fast and reliable inspection for fruit and vegetables can be achieved. High-value fruits for exports, such as mangoes, papayas, apples, and pears, can be utilized and trained using the multi-input model, wherein a non-destructive approach can reduce food losses and increase productivity and profitability. The multi-input model in this study was used in grading banana tiers, which is an example of clustered fruit; thus, the model will show good potential for grading other clustered fruits, such as grapes and cherries and even for quality inspection of vegetables.
5. Conclusions
A novel multi-input deep learning model was developed in this study using RGB imaging, hyperspectral imaging, and deep learning techniques. External features of the banana, such as size, color, and texture, can be easily measured using RGB imaging, while spectral signatures or reflectance values that are highly correlated with the internal properties of fruits can be extracted using hyperspectral imaging. Using combinations of CNN and MLP applied to features extracted using RGB and hyperspectral imaging, the multi-input model was able to classify tier-based bananas with an overall accuracy of 98.45% and an f1-score of 0.97570. The non-invasive grading system could classify bananas into three groups (Class 1—bananas for export; Class 2—bananas for the local market; Class 3—reject bananas). The AI system could also predict the size (large, medium, and small) and view (front or back part) of banana tiers with 99% accuracy. This study highlighted the combined strengths of RGB and Hyperspectral Imaging in agricultural applications using only a minimal number of samples (516 samples). The fast-processing time of the multi-input model developed can be advantageous when it comes to actual farm postharvest processes.
The banana grading system is still in its initial phase; however, it could lead to the development of a bespoke automated system for sorting bananas or other clustered fruits. As future work, data augmentation can be performed both on RGB and HS images to solve the possible overfitting of the model. Another recommendation for future studies is that the model can be trained and tested using RGB and HS images of other fruits or agricultural crops. A more advanced camera system with features that can extract both RGB and hyperspectral images can also be explored for future work to reduce the processing time and cost of using two separate cameras. Furthermore, the multi-input model can be incorporated with robotics and mechatronics to create an automated system in an assembly line environment for real-time sorting and non-invasive classification of fruits in large plantations.


