1. Introduction
Agricultural sectors in most countries have experienced considerable structural changes over the years. These include labor migration out of the sector, changes in the product mix and specialization, changes in the level of commercialization and marketing patterns, and changes in food value chains and contractual arrangements. A key aspect of these structural change process is the pattern of farm exits and farm growth. A well-known stylized fact in agricultural economics is that the number of farms in developed economies declines over time while the size of the average farm increases. These trends have been documented and analyzed for the U.S. (e.g., [
1,
2,
3,
4,
5]), Canada [
6], Britain [
7], Italy [
8], Germany [
9], Austria [
10], The Netherlands [
11], Sweden [
12], Hungary [
13,
14], Slovenia [
15], and Israel [
16,
17], among other countries. This structural change process has been attributed to a multiplicity of factors ranging from innovation and technological progress to policy reforms, trade liberalization and resource mobility [
18,
19].
The existing literature has used various regression specifications to estimate the determinants of average farm size. Some of the applications allowed farm growth to depend on initial farm size, thereby allowing for differential growth rates for farms of different sizes. The results show trends of an increased concentration of farm sizes in several cases and trends of increased dispersion of farm sizes in other cases, while in some other cases, no significant effect of farm size on farm growth was found.
The limitation of this line of literature is the reliance on a parametric regression model that allows for a limited class of distributional changes. Two alternatives have been proposed in the literature. Chavas and Magand [
20] and Zepeda [
21] used a Markov analysis to estimate transition probabilities between size classes. Alternatively, Kostov et al. [
22] and Bakucs and Fertő [
14] estimated the farm growth equation by quantile regression, thereby allowing different growth rates in different parts of the size distribution. These methods allow for more flexible changes in farm growth rates across the farm size distribution. Still, they do not capture the entire change in the farm size distribution over time.
The purpose of this article is to propose a method for examining the changes over time of the entire farm size distribution, and to identify determinants of these changes. Wolf and Sumner [
23] examined the changes in the farm size distribution using kernel density estimates but did not go further than a visual inspection of the density plots. We take this approach a step further. Our proposed method analyzes the changes in the size distribution of farms by decomposing the change in the density function into changes in subgroup shares and changes in subgroup densities, after dividing the farm population into subgroups according to some key characteristics. The changes in subgroup densities are decomposed further, as suggested by Jenkins and van Kerm [
24], into changes in the location (mean), spread (variance), and higher moments of the distribution. This allows for the identification of types of farms that contribute to the changes in the farm size distribution in specific ways. This approach is nonparametric in nature, and is superior to regression-based parametric approaches, such as the one proposed by Miljkovic [
25], who used a regression framework to analyze the determinants of an index of farm size inequality. Several semiparametric alternatives have been proposed in the literature. For example, Melly [
26] used a quantile regression in order to decompose inequality into the share of covariates, the share of coefficients and the share of residuals. This allows for a richer set of covariates than the Jenkins and van Kerm [
24] procedure, but it relies on a parametric assumption about the dependence of conditional quantiles on the covariates.
The Israeli family farming sector was chosen as a case study for this research, because its unique institutional structure and the rapid institutional changes that have occurred over the years made the process of farm exit and growth much more rapid than in most other countries. The period of analysis encompasses those institutional changes. We chose to divide the sample into two subgroups: full-time farms and part-time farms. A full-time (part-time) farm is a farm whose operator does not work (works) off the farm. Separating the sample into full-time and part-time farms enables us to examine the interaction between part-time farm status and the change in the farm size distribution. Previous research has shown that off-farm work is one of the most important determinants of farm growth [
7,
10,
16].
We used cross-sectional data on Israeli family farms for three different time periods. The first two are derived from the Censuses of Agriculture of 1971 and 1981, which include the entire population of farm households. The third data source is the 1995 farm survey, covering about 10% of the farms. All three data collection efforts were conducted by the Central Bureau of Statistics in Israel. (The latest agricultural census was conducted in 2019, but the data are not yet available.) We focused on family farms in cooperative villages (
Moshavim), because for these we have the most detailed information. Using data from three periods allows us to analyze the changes in the farm size distribution in two sub-periods: 1971 to 1981 and 1981 to 1995. This is particularly important in the case of Israel, since the 1970s were a relatively stable and favorable period for Israeli farmers, while the latter period was characterized by much turmoil, including high inflation, a debt crisis, and hired labor shortages due to security issues. Therefore, we expect quite different trends in the farm size distribution in these two sub-periods.
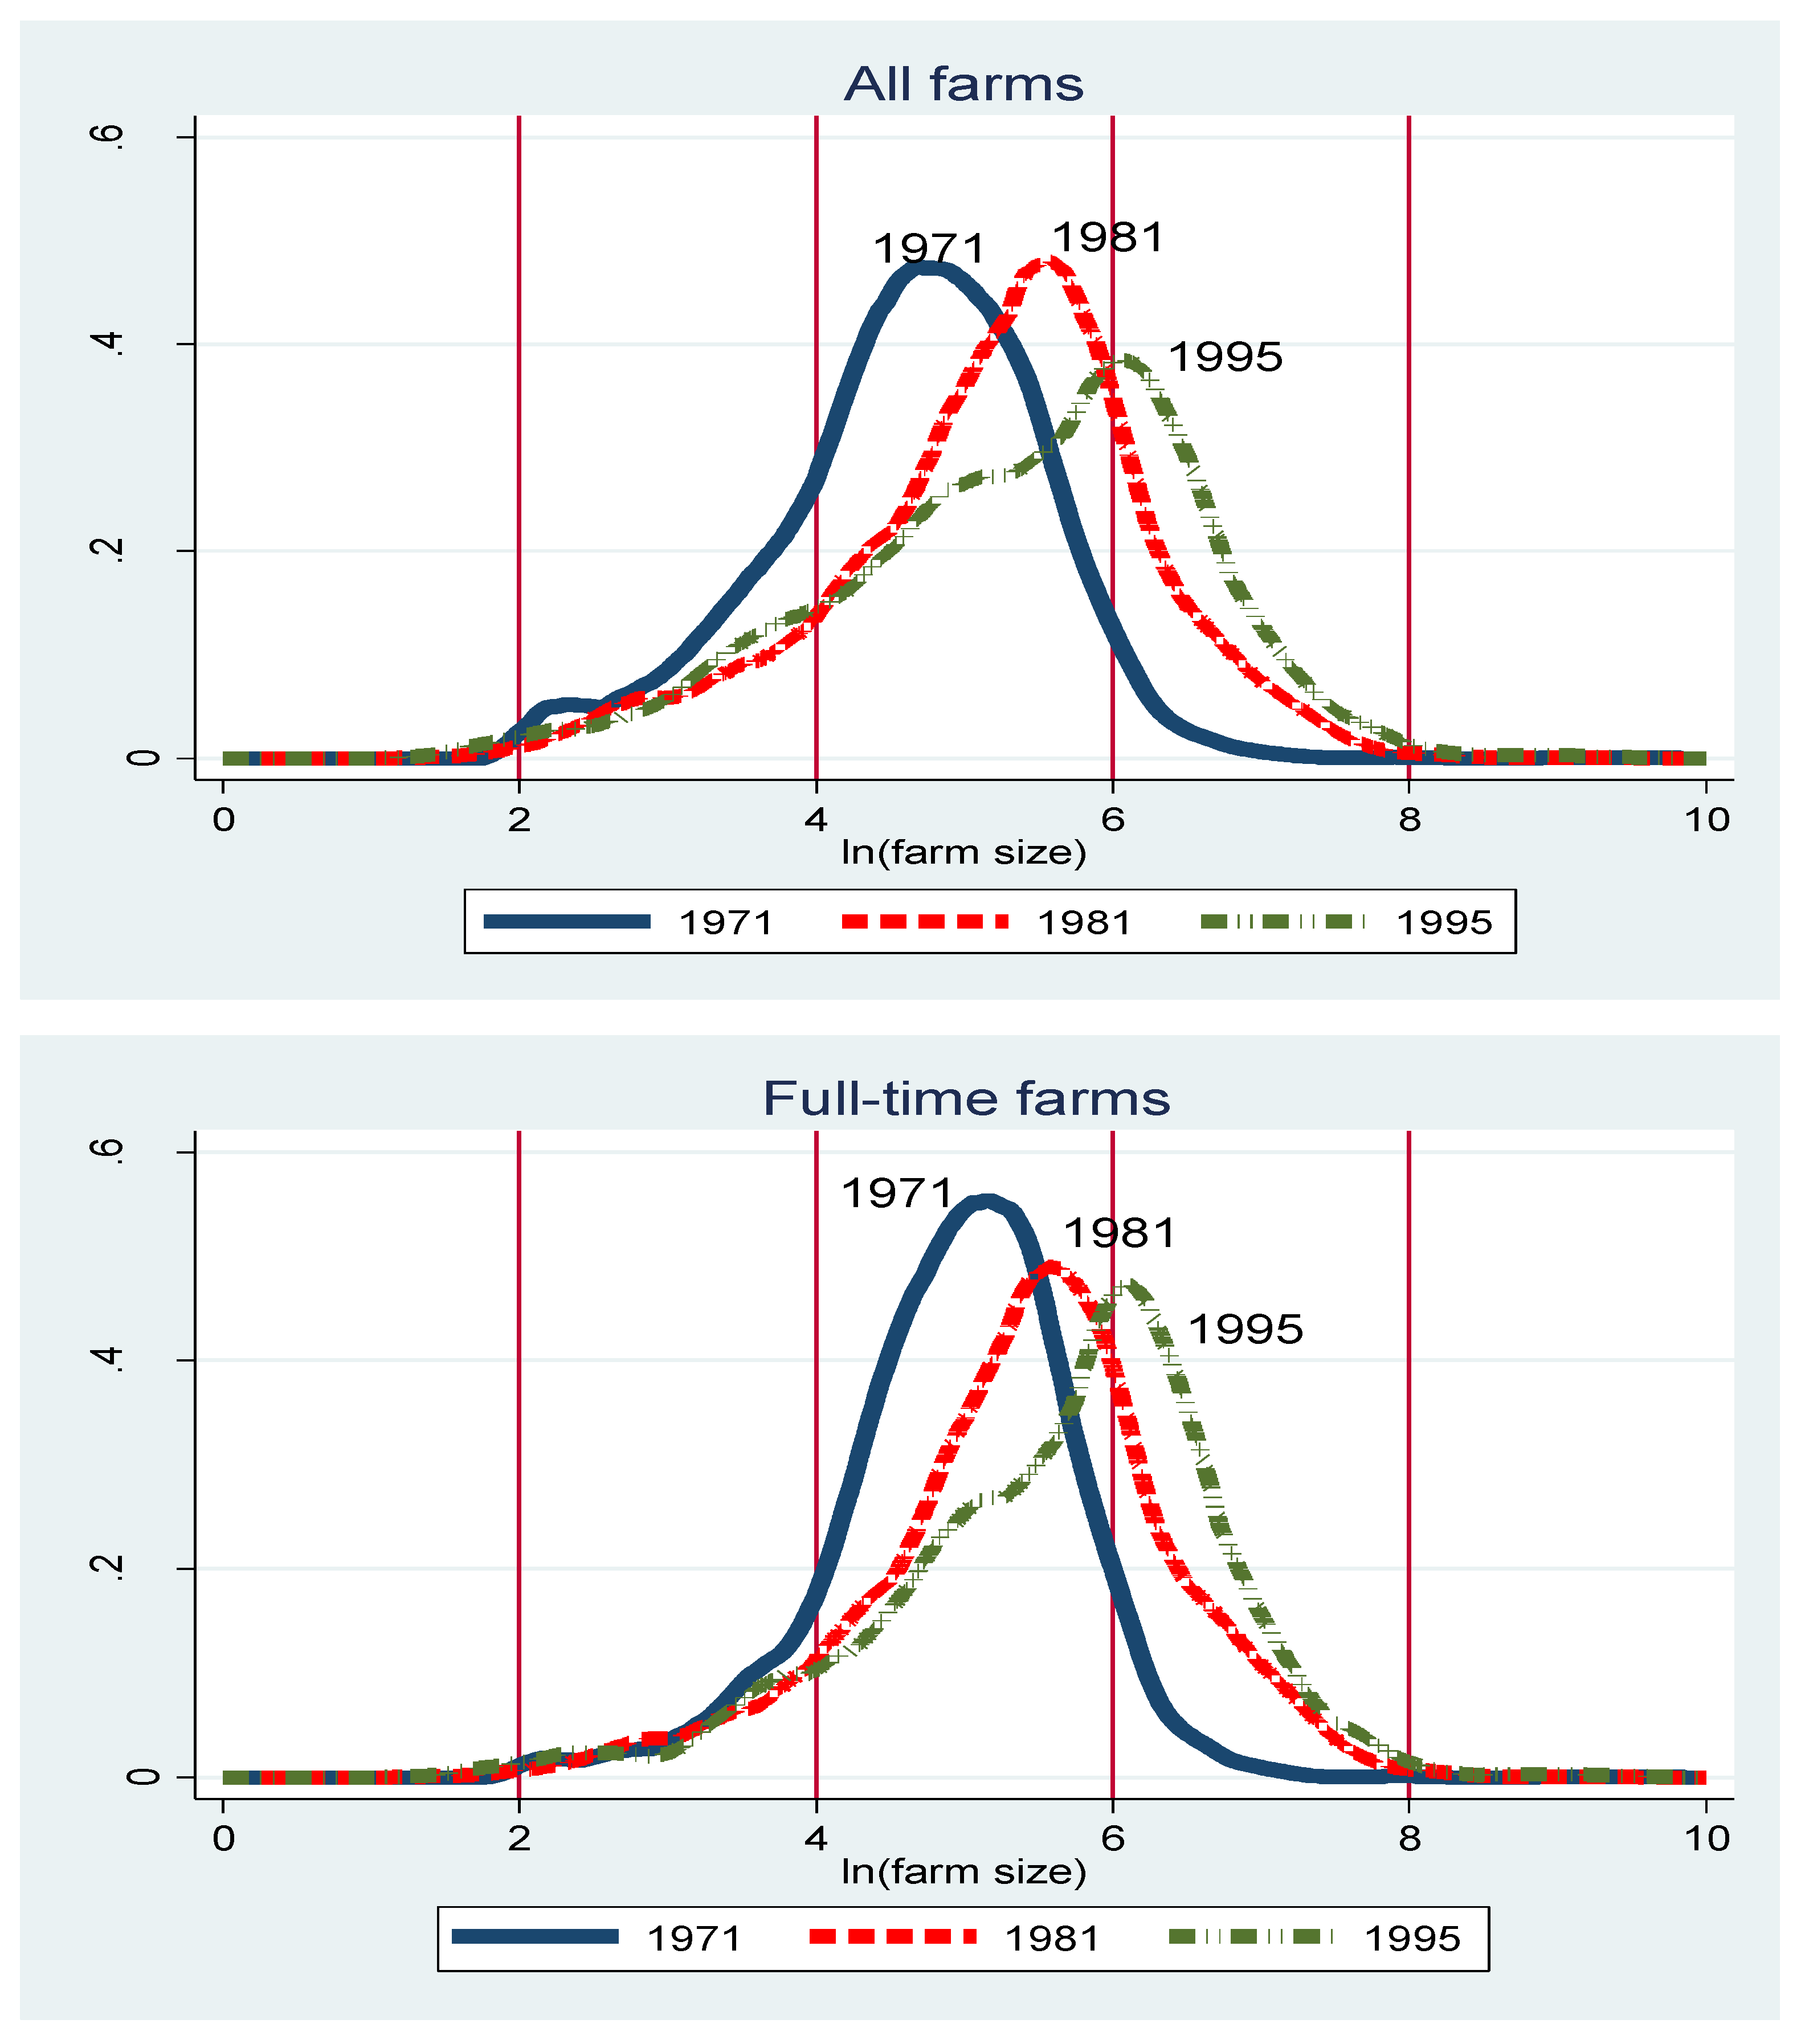
Figure 1 confirms this expectation. The top panel presents the kernel density plots of farm size distributions in the three time periods. While the change from 1971 to 1981 seems to mostly involve a shift to the right of the entire distribution, reflecting an increase in the average farm size but little change in dispersion, the change from 1981 to 1995 involves an increase in both the mean and the dispersion of farm size. The two other panels in
Figure 1 present the kernel density plots of full-time farms and part-time farms, respectively, where a part-time farm is defined as a farm whose operator engages in a non-agricultural income-generating activity. It can be seen that the shift to the right of the farm size distribution between 1981 and 1995 is entirely due to full-time farms, while the increase in the dispersion of the farm size distribution between those years is mostly due to part-time farms. Since the fraction of part-time farms went down from 44% in 1971 to 37% in 1981 and 28% in 1995, the changes in the farm size distribution could be rooted in the intensive margin and/or in the extensive margin. In the empirical section of this paper, we will further decompose the distributional changes and assess their relation to the full-time/part-time dichotomy.
In the next section, we present a more detailed background on the structural changes in Israeli agriculture over the years. In the following section, we describe the density decomposition methodology. After that, we provide a more detailed description of the data we use and the measurement of farm size. Then, we present the decomposition results. The final section summarizes the findings.
2. Institutional Background
Agriculture was one of the most important foundations on which the state of Israel was established. Since the end of the 19th century, Jewish settlers in Israel saw agriculture as a channel through which the link between the Jewish people and their ancient homeland can be re-established. Cooperation has been the key to the success of settlement and agricultural production. The two dominating types of cooperative settlements have been the Kibbutz and the Moshav. The Kibbutz was a commune in which each member produced according to his ability and consumed according to his needs. The Moshav was a semi-cooperative village made of individual family farms, in which certain activities such as purchasing, marketing, and financing were handled jointly in order to exploit economies of scale in these activities. Ideologically, the cooperative settlements explicitly highlighted farming as a way of life and not only as a way of making a living. Economically, agriculture constituted a major fraction of national income and exports in particular for many years. Socially, the cooperative agricultural sector provided a generation of political, cultural and military leaders.
During its early years of independence, Israel had to feed the massive wave of immigrants that arrived from all parts of the world. Thus, massive public investments have been made in infrastructure, research, and extension. Thanks to these investments and other government support measures, and to the innovative and entrepreneurial nature of farmers, agricultural production increased dramatically and Israel became self-sufficient in fresh agricultural produce by the 1960s. The continued output growth was partly directed to export markets, but it also led to a fall in domestic prices. The change in government in 1977 has led to a much less favorable public policy towards agriculture, and the extremely high interest rates that prevailed during the 1985 anti-inflationary reform made it almost impossible for most farmers to prevail. Most farm cooperatives were in heavy debt during those years, due to the cheap and subsidized credit that prevailed in the late 1970s, and the sharp rise in the interest rate made it impossible for them to service their debt. Despite a debt-restructuring reform that was initiated by the government in subsequent years, many farm cooperatives collapsed financially and the remaining farmers had to cope with the situation without the safety net and support system provided by the cooperatives [
27,
28,
29]. This has been perhaps the most extreme institutional change ever experienced by the Israeli farm sector, and it happened over a very short time, making it very difficult for farmers to adjust.
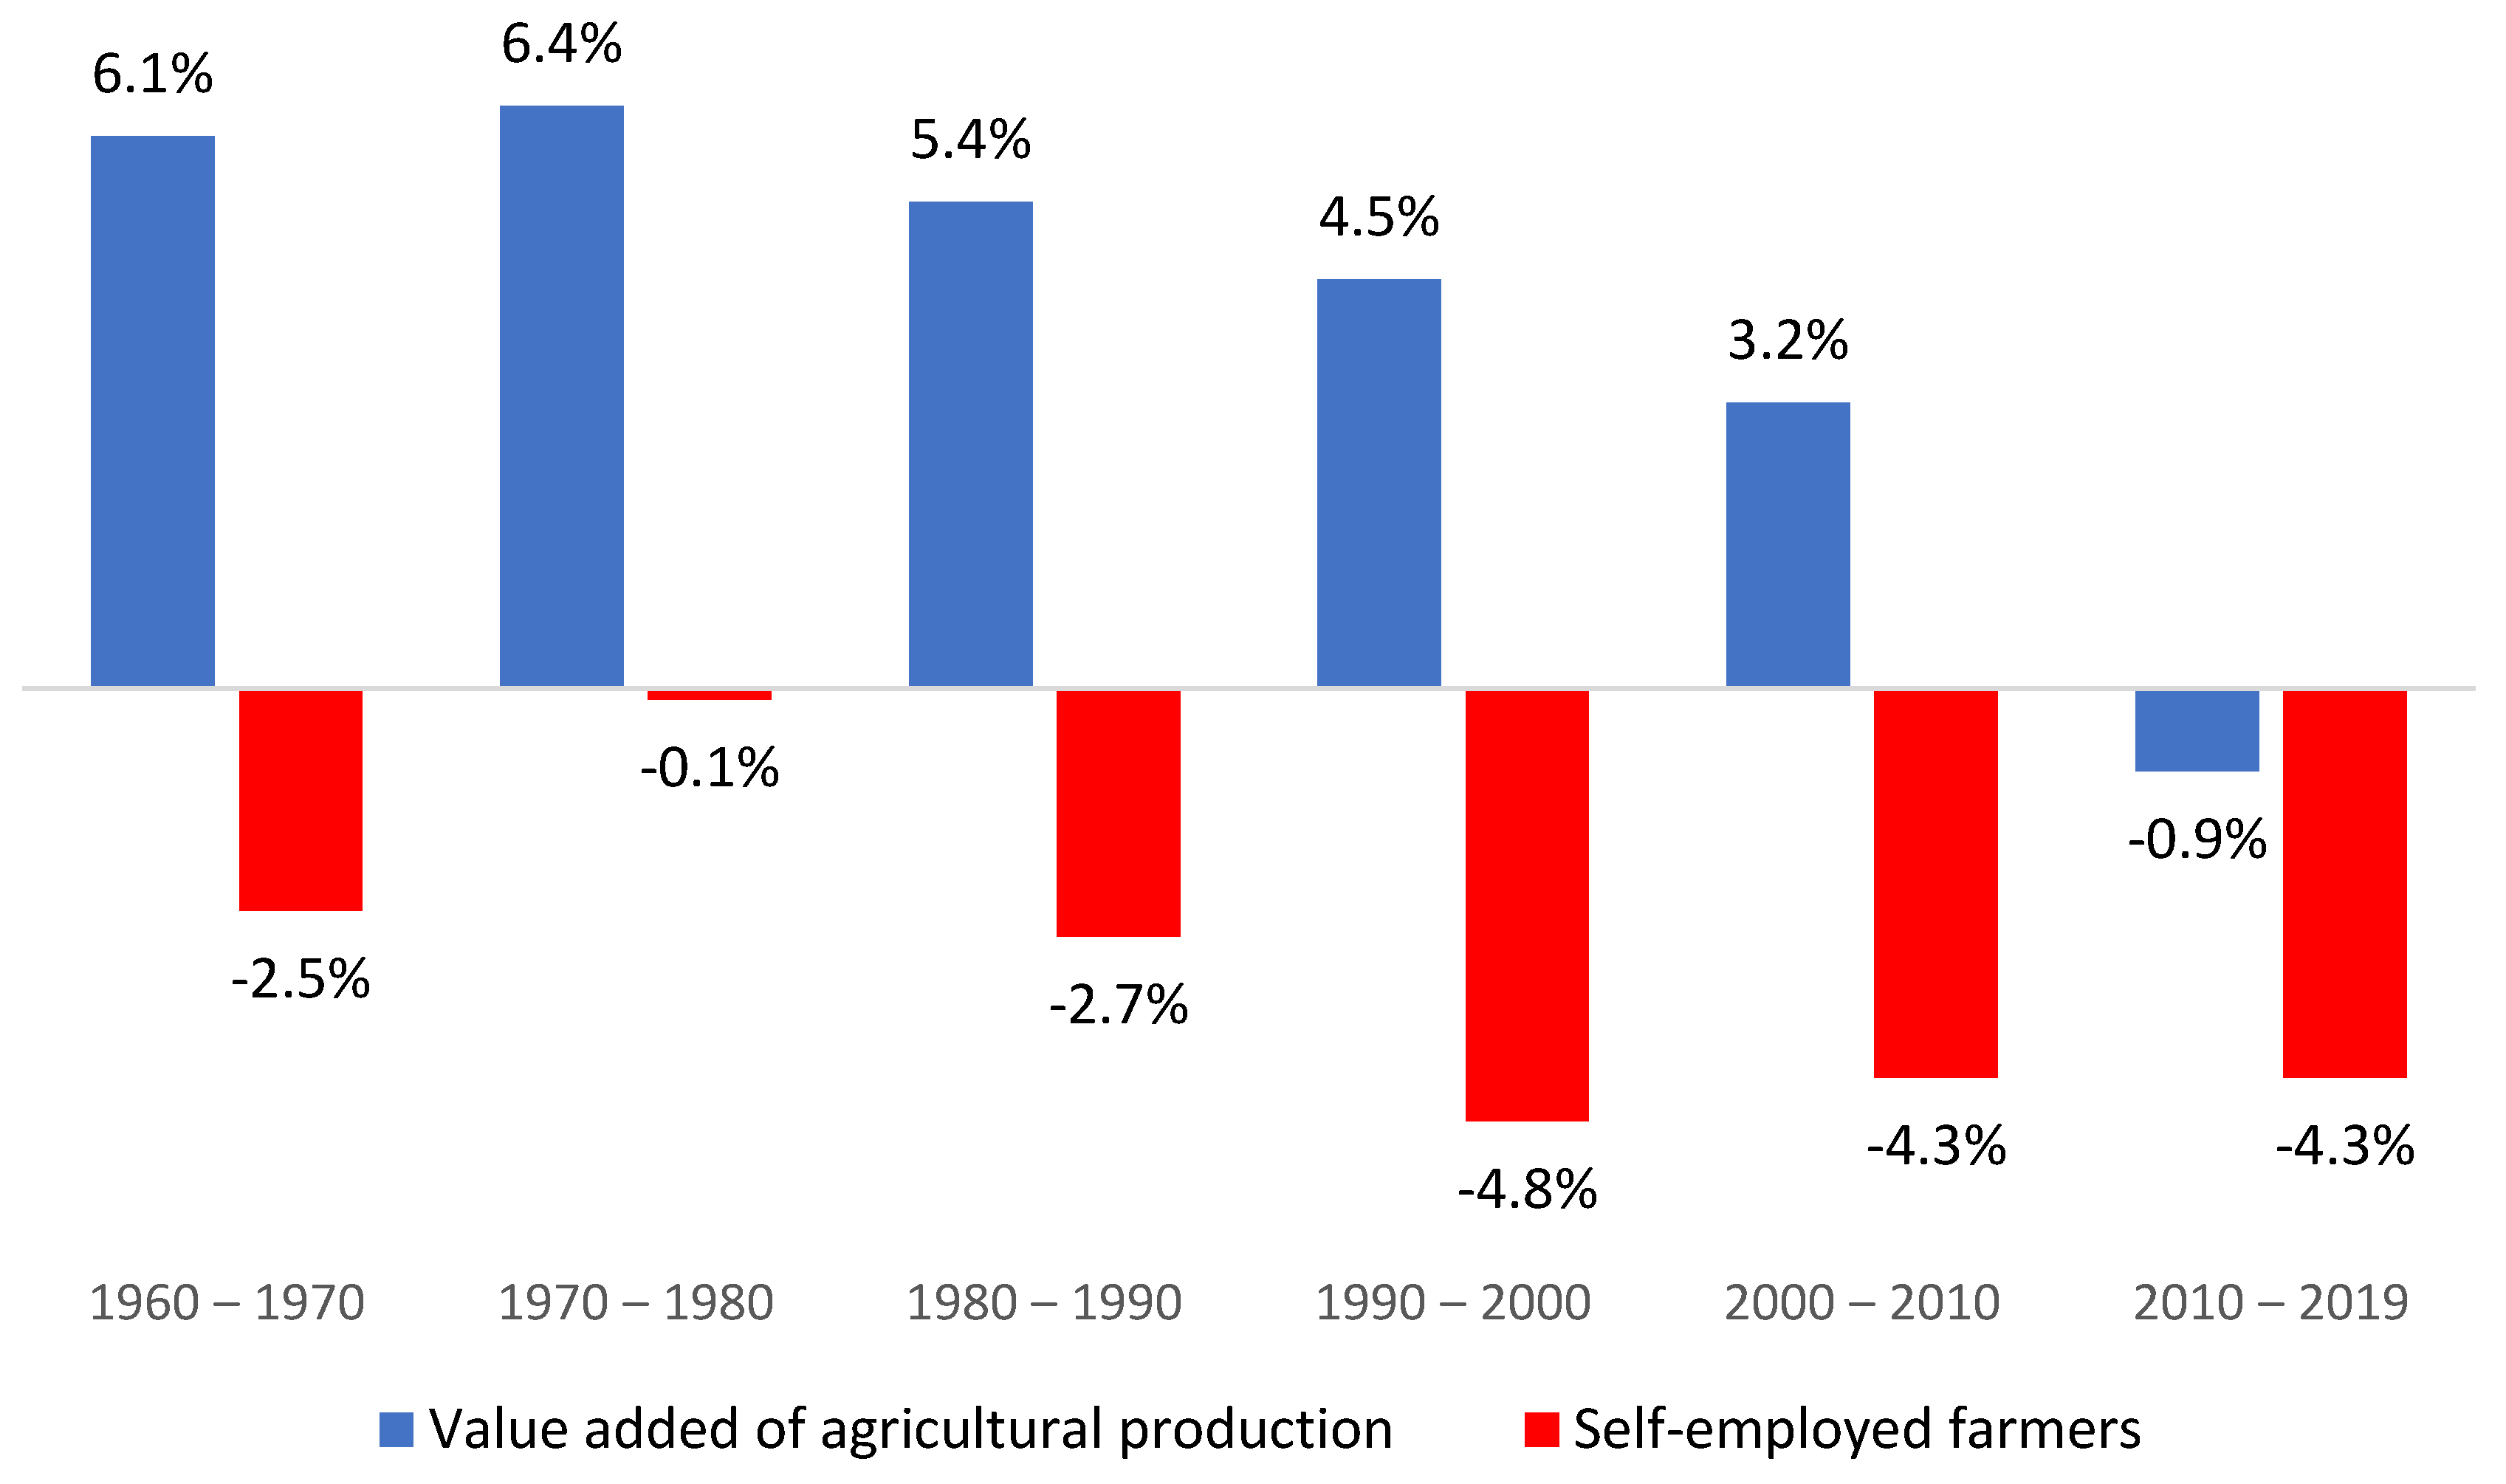
Not surprisingly, the number of farms, which was already decreasing gradually, took a dive after 1985, reaching a record of almost 5% decline annually in the 1990s, and the rate of growth of agricultural value added, which reached a peak of 6.4% annually during the 1970s, and declined gradually over the years to a record low of −0.9% in the last decade (
Figure 2).
Figure 2 also highlights the difference between the first period of our analysis, 1971 to 1981, with high output growth and almost no exit from farming, and the second period, 1981 to 1995, with much lower output growth and rapid exit of farmers. Other differences between the two periods are worth mentioning.
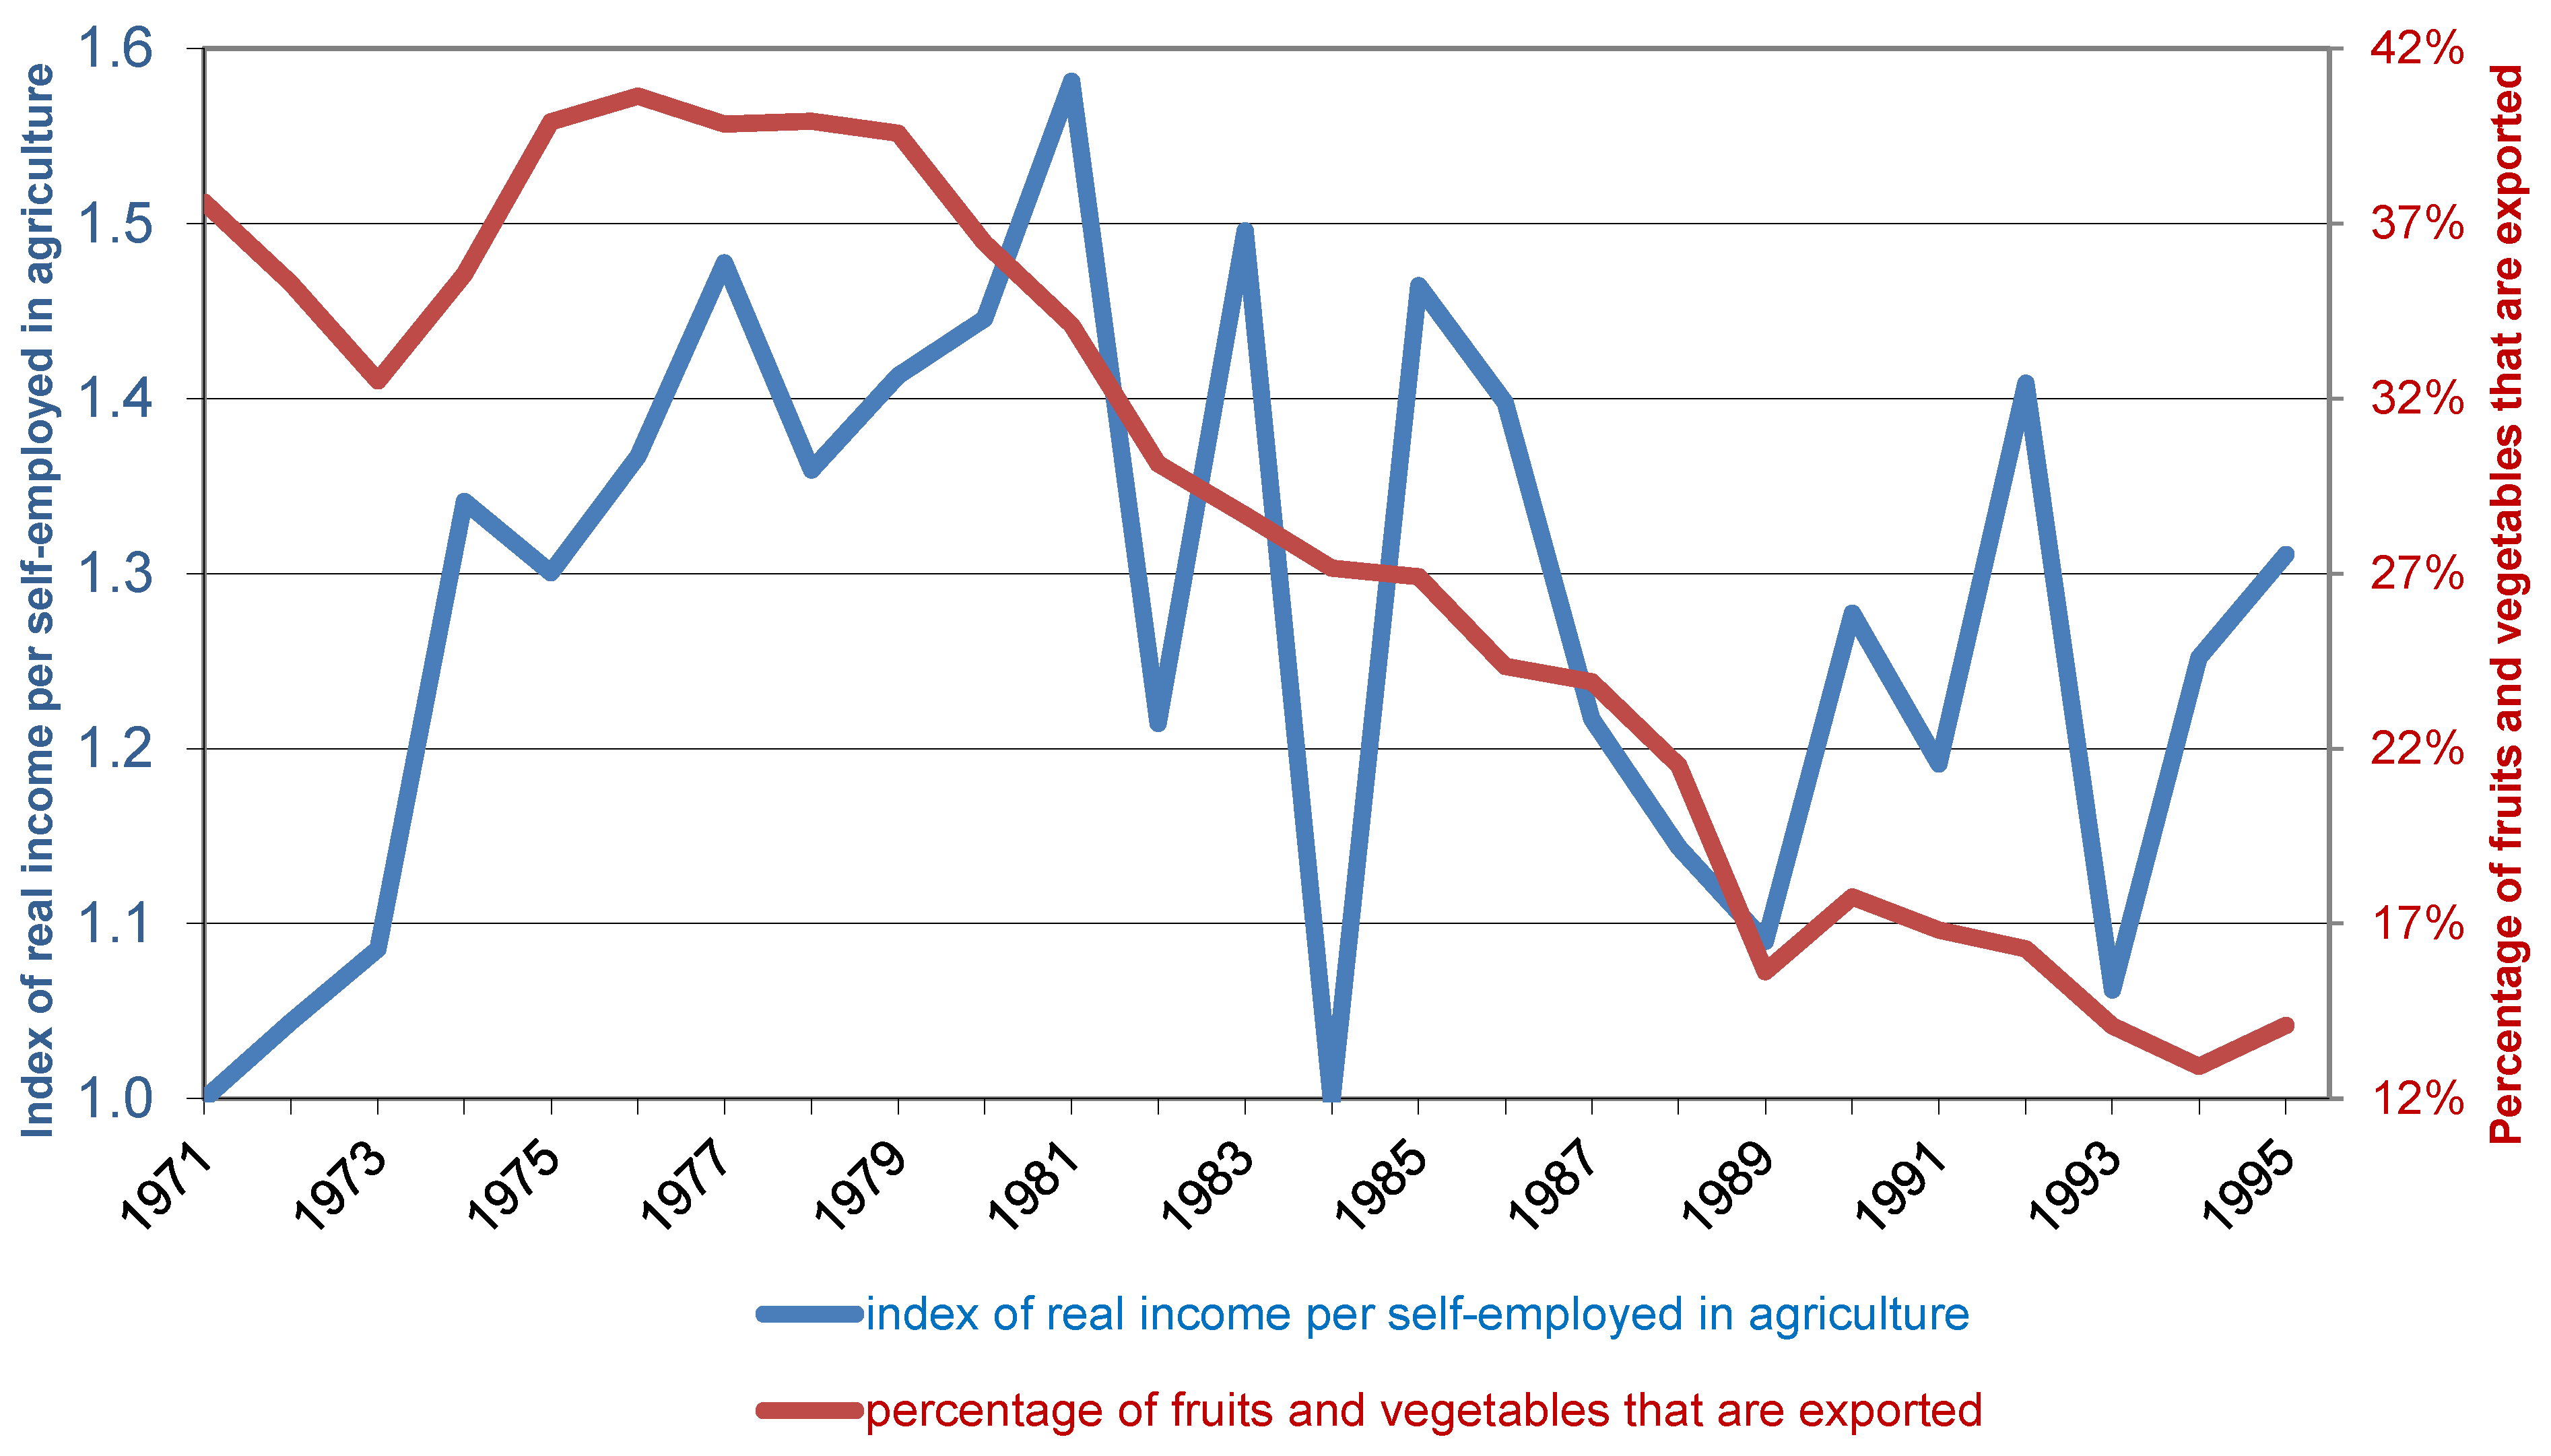
Figure 3 shows that agricultural income per farmer increased more than 50% in real terms between 1971 and 1981, and started declining afterwards, while also exhibiting large fluctuations. This explains the increase in farm exits during the second period. Additionally, farm exports of fruits and vegetables, which ranged between 32% and 40% of the production of these crops during the first period, dropped during the second period to a low of 13%. This is one of the causes of the decline in farmers’ income.
It should be noted that despite the collapse of cooperation, land regulations remained intact. These include the inability to sell land to existing farmers, so if a Moshav member wants to sell, it should be to an outsider. Land rentals are allowed only within each Moshav. In practice, most farm were and are still characterized by existing farmers renting their land to their neighbors, thereby creating the strong link between farm exit and farm growth.
The exit of farmers was accompanied by a tendency of the remaining farmers to diversify their income sources through non-agricultural activities, either on or off the farm [
30,
31,
32] (despite the fact that cooperatives historically tried to discourage farmers from working off the farm [
33]. This was particularly advantageous for the high-ability farmers, who were able to both manage an expanding farm business and engage in additional income-generating activities [
16]. While off-farm income enabled most farmers to remain in business during the 1970s [
34], this was not sufficient in the subsequent period, which was much less economically favorable to farmers (
Figure 3). As farm size and off-farm work are closely related [
16], our empirical analysis will highlight the role of part-time farming in affecting the changes in the farm size distribution.
3. Methodology
Suppose that the farm population can be divided into K different subgroups indexed 1 …
K (This section draws heavily on Jenkins and van Kerm [
24]). The density function of the farm size distribution can be written as:
where
f(
x) is the density function of farm size (
x) over the entire farm population,
is the population share of subgroup
k, and
(
x) is the density function of farm size within subgroup
k. In addition, the change in the density function between time period 0 and time period 1 can be written as:
where
is the contribution of the changes in subgroup densities,
is the contribution of the changes in the subgroup shares, and the weights
wk and
zk(
x) are defined as:
where 0 ≤
π ≤ 1 can be chosen arbitrarily. In our application, we use
π = 0.5.
Following Jenkins and van Kerm (2005), we now move to further decompose the change in subgroup densities
into three components: sliding, stretching and squashing. Sliding reflects a horizontal shift of the entire density function. Stretching reflects an increase in the spread of the density without changing the mean. Squashing reflects all other changes in the density function, holding the mean and the spread constant. We begin by assuming the existence of a subgroup-specific function (
gk) that describes end-period farm size (
x1) as a function of beginning-period farm size (
x0):
. Using the inverse of
gk, we can express the end-period density as:
By using specific functional forms for
gk, we can construct specific approximations of the changes in the farm size density. For example, suppose that we choose a linear function:
Under the linearity assumption, our approximation for the farm size density is:
Now suppose that we impose the constraint βk = 1. The linear transformation gk now reflects an additive increase of a constant number of units, αk, in the size of all farms in subgroup k. In terms of the density function, this is reflected in a horizontal shift of the entire function, which is denoted as sliding. Calibrating to the increase in average farm size, we obtain . Using these parameters, (7) is now denoted as , where the subscript “0” of the standard deviation means that we keep the spread of the initial period, and the subscript “1” of the mean of the distribution means that the approximated distribution has the same mean as the actual distribution in the final period.
We now move to an alternative parameterization of (6): βk = s, . It is easy to verify that this transformation does not change the mean of farm size, but increases the standard deviation by a factor of s. Hence, the calibration to the final-period standard deviation requires setting . Using these parameters, (7) is now denoted as , where the subscript “0” of the mean of the distribution means that we keep the mean of the initial period, and the subscript “1” of the standard deviation means that the approximated distribution has the same standard deviation as the actual distribution in the final period.
We can also merge these two transformations into a single transformation that allows changes in both mean and standard deviation. Calibration to the final-period mean and standard deviation requires setting
βk =
and
. The resulting approximated density based on (7) is denoted as
. We are now in the position to decompose the change in the subgroup density function of farm size into the three components: sliding, stretching and squashing. Note that both sliding and stretching can be obtained in two ways. Sliding, for example, is the change in the mean, but it can be conditioned on the standard deviation of either the initial period or the final period. Similarly, stretching is the change in the standard deviation, but it can be conditioned on the mean of the initial period or the final period. We solve this problem by weighting each of these possibilities in a way that leaves squashing as a residual. The resulting decomposition is:
The weight η is set at 0.5 in the empirical analysis. Once computed, (8) can be plugged into (2) to obtain the overall decomposition.
4. Data
The 1971 Israeli Census of Agriculture dataset includes 19,147 observations on family farms in cooperative villages, while the 1981 Census dataset includes 18,614. The 1995 representative farm survey covered 2049 farms, representing a population of 15,546 farms. This latter survey focused on active farms, and hence only farms with annual value added of more than NIS 3000 were included. Therefore, we trimmed the 1971 and 1981 samples accordingly, with thresholds that reflect the changes in the consumer price index. The resulting number of farms in 1971 and 1981, are, respectively, 19,005 and 18,499.
We measure farm size by the real value of output. This is the simplest measure that was available for all three data sets. The value of output is computed “normatively”, in a way that is similar to the computation of standard gross margin by the European Commission. Specifically, for each type of crop or livestock, the plot size or the number of farm animals is multiplied by an average coefficient of output, derived from specific field surveys, that varies only by geographic location. In this sense, this normative measure of output reflects the volume of inputs used on the farm and the choice of output portfolio rather than actual output. In particular, it does not reflect individual farm productivity or price heterogeneity. Hence, it can legitimately be considered a measure of farm size. This is particularly important because most family farms in Israel are diversified, and therefore simpler measures of size such as operated land or number of animals are not adequate. We would have preferred to use value added rather than output to measure farm size [
35]; unfortunately value added was not computed in the 1971 census. We did repeat the 1981 to 1995 decomposition using value added instead of value of output, and the results were quite similar.
5. Results
In this section, we report the results of apoplying the decomposition methodology described above to the case of changes in the farm size distribution in Israel.
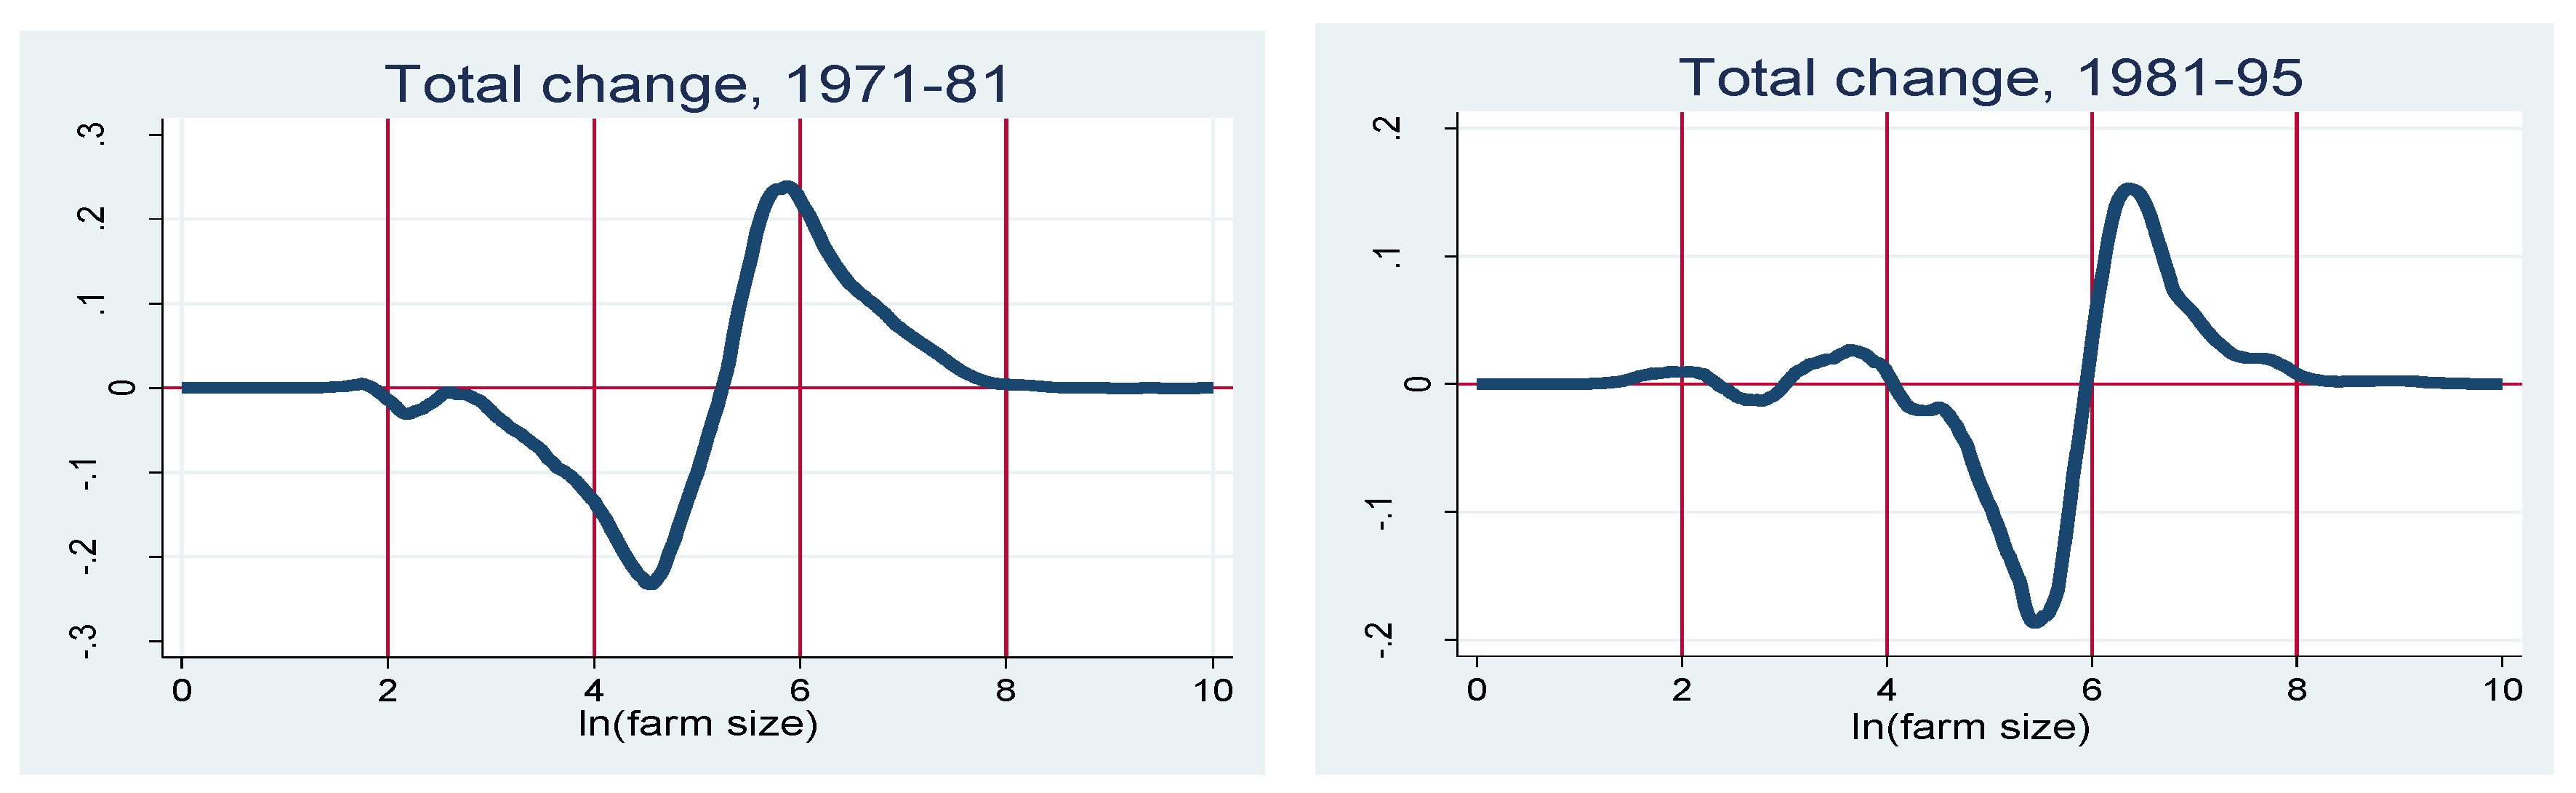
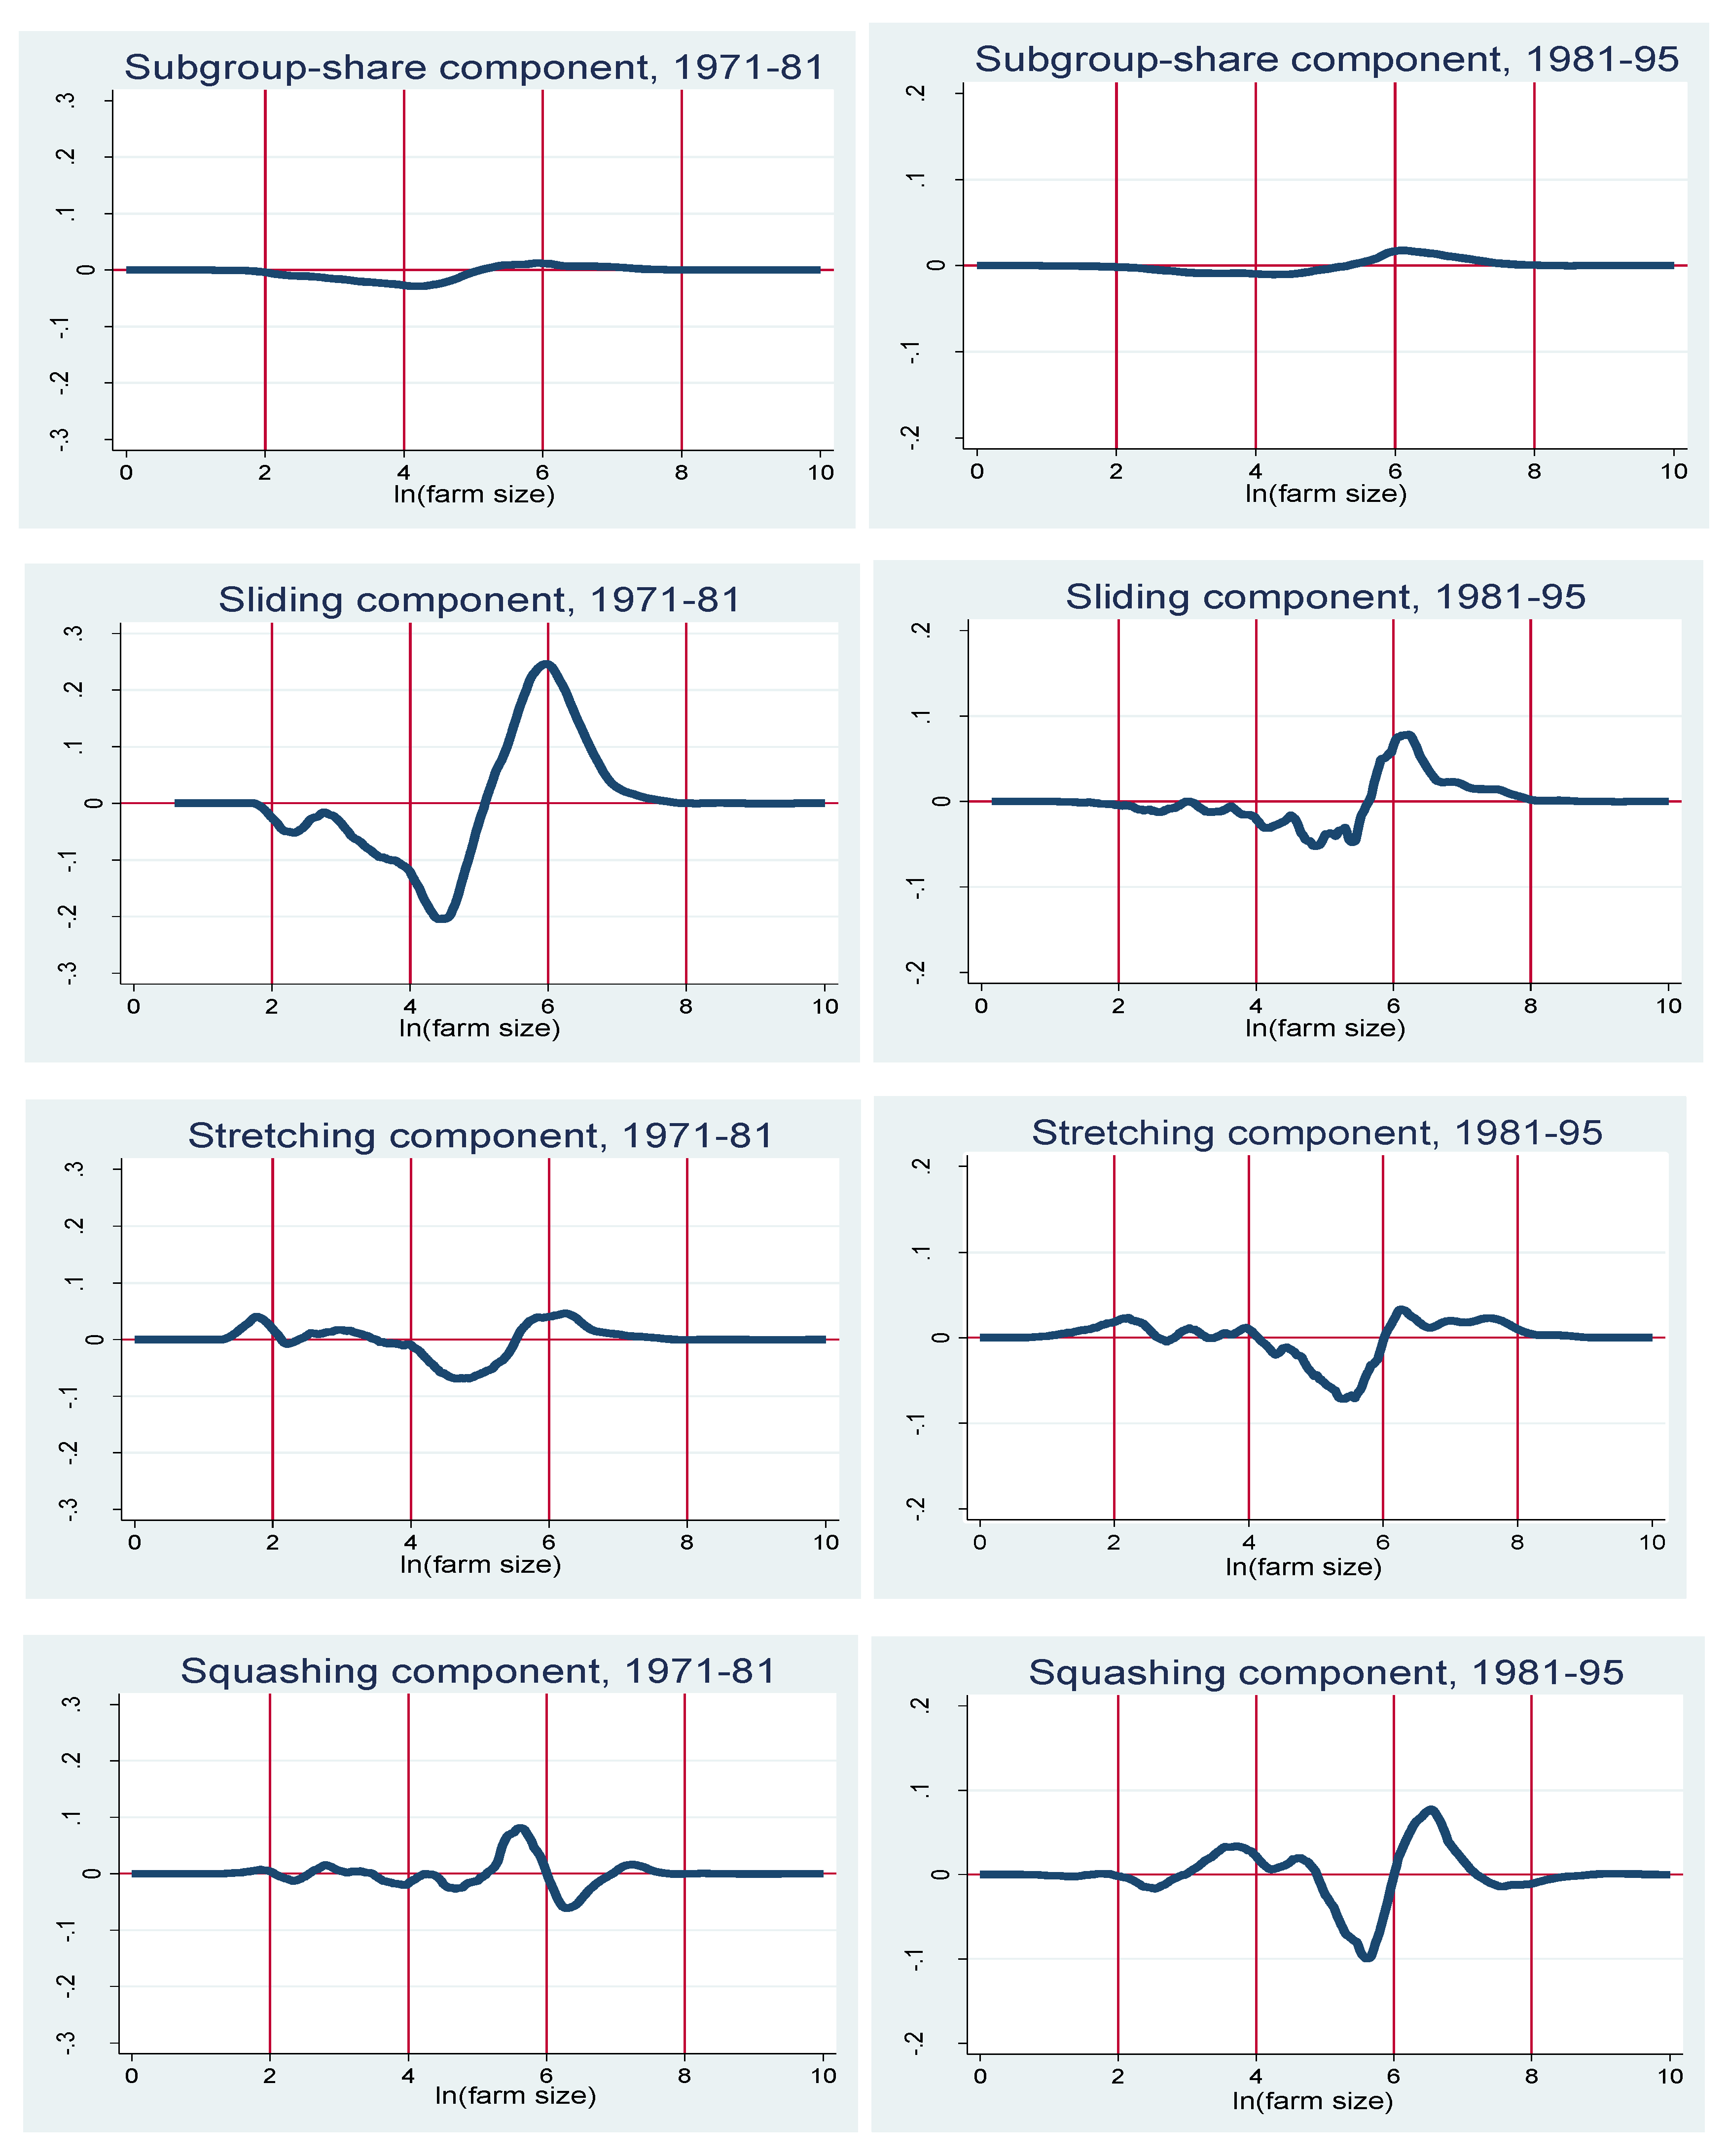
Figure 4 shows the decomposition of the changes in the farm size distribution, for the two sub-periods, 1971 to 1981 and 1981 to 1995. The top panel shows the total change in the distribution. The total change is a simple vertical subtraction of the initial-period density function from the end-period density function. For both sub-periods, the top panel indicates that the farm size distribution has shifted to the right: relatively small farm sizes show mostly negative values, while relatively large farm sizes show mostly positive values. This is just a replication of what we saw in
Figure 1 (note that the vertical scales of the 1971 to 1981 and 1981 to 1995 graphs are not identical; hence, the changes in 1981 to 1995 are smaller in magnitude than the changes in 1971 to 1981.)
The remaining panels show the relative importance of the different components of the distributional changes, in each sub-period. The first observation is that the component of the share of each subgroup in the farm population is negligible. This implies that farm size transitions are driven by factors other than farms changing from full-time to part-time or the other way around. Secondly, we can see that between 1971 and 1981, the sliding component is very similar in shape to the overall change, indicating that the remaining two components are (jointly) much less important in this case. Specifically, we observe that in the 1971 to 1981 period, the stretching component and the squashing component have considerably lower magnitudes compared to the sliding component, and they also effectively cancel each other out in most ranges of the farm size distribution.
The situation is different in the case of the change in the farm size distribution between 1981 and 1995. Here, the magnitudes of the sliding, stretching and squashing components are not very different from each other. While the sliding component still indicates that farms became larger on average, the stretching and squashing components indicate that a non-negligible number of farms actually got smaller. This is similar to the conclusions in [
17]. Hence, the phenomenon of the “disappearing middle” of the farm size distribution was much more important during the 1980s and beginning of the 1990s than during the 1970s. This is explained by the relatively unfavourable conditions facing Israeli farmers during the latter period.
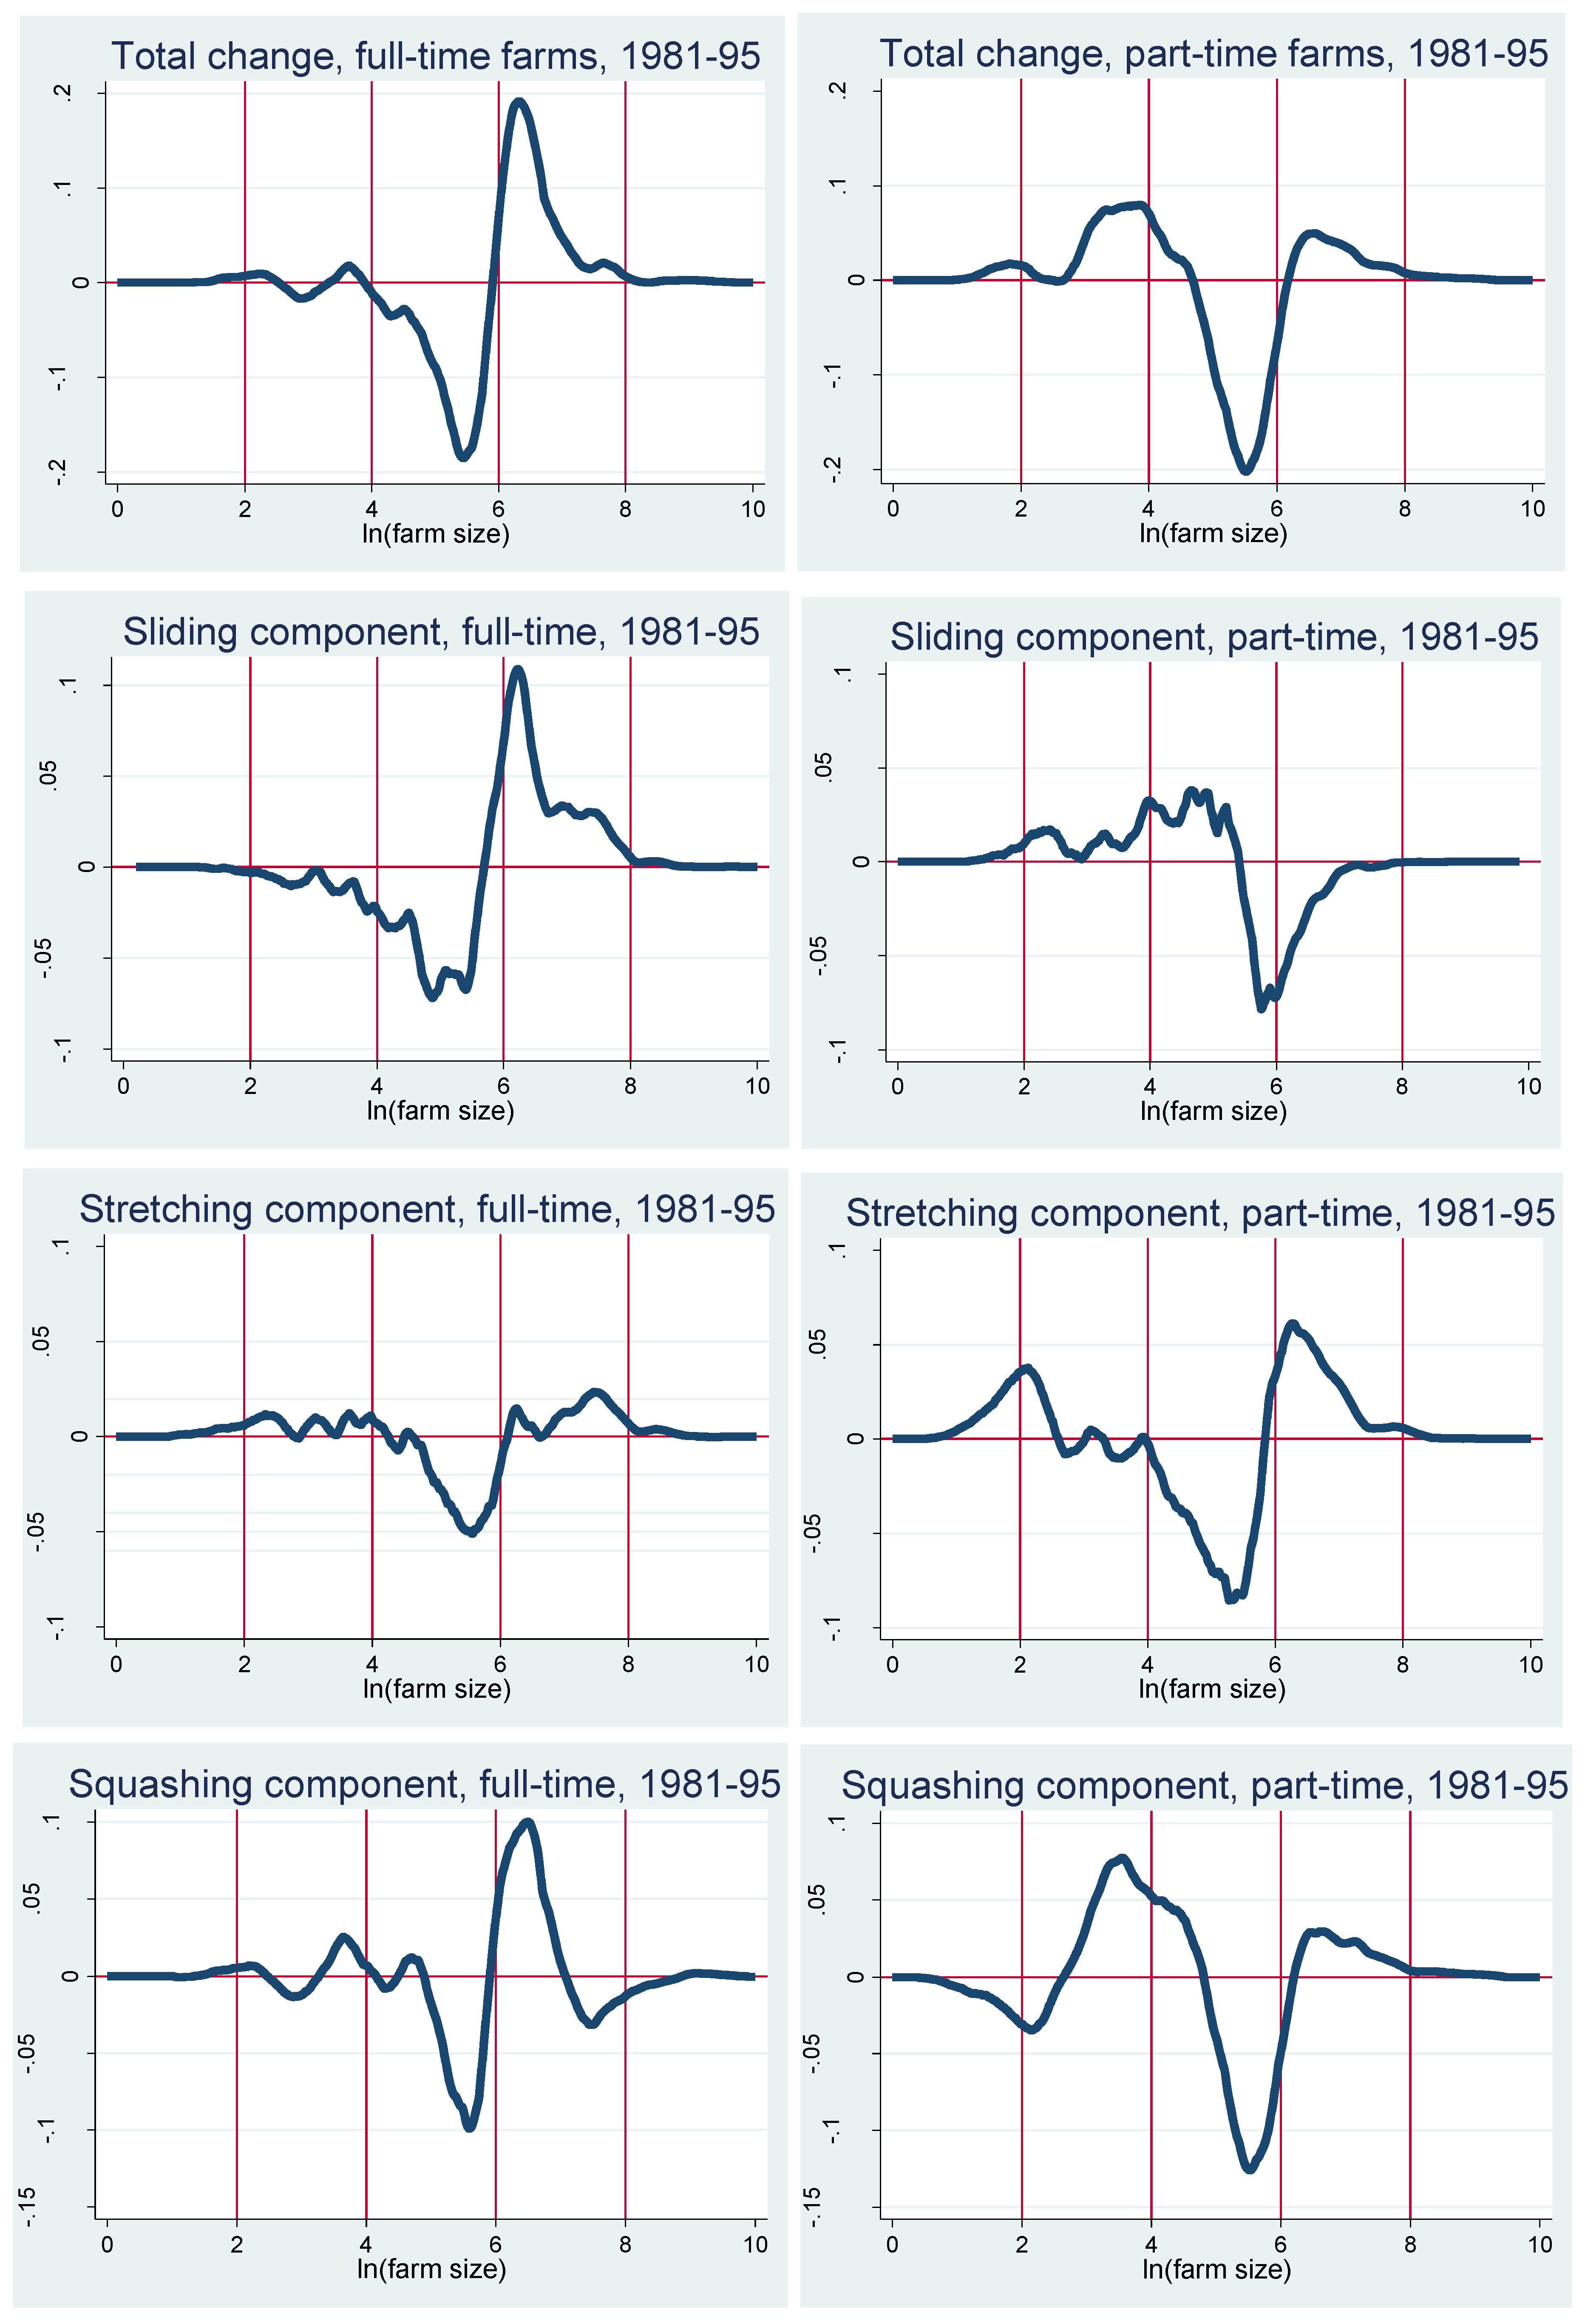
Figure 5 and
Figure 6 separate the components of the decomposition into the contributions of full-time farms and part-time farms. In
Figure 5, we can see that the dominant sliding components of the distributional change between 1971 and 1981 are not very different for full-time and part-time farms, although for part-time farms the changes due to sliding seem to be spread relatively more evenly along the range of farm sizes. The same is true for the stretching components. However, in
Figure 6, we can see that the different components of the distributional changes between 1981 and 1995 are quite different for full- and part-time farms. In particular, the top panel shows that while it is quite clear that the average size of full-time farms has increased during the period, we observe a “disappearing middle” among part-time farms; i.e., the size distribution of part-time farms became flatter between 1981 and 1995, confirming our earlier conclusion from
Figure 1. The sliding component and the squashing component seem to be responsible for most of the increase in the average size of full-time farms, while for part-time farms, the sliding component and the squashing component seem to reflect a decrease in farm size and the stretching component seems to reflect the “disappearing middle” phenomenon.
This implies that part-time farmers and full-time farmers exhibit different behavioral responses to the changing economic and institutional conditions (that became more adverse between 1981 and 1995). While full-time farmers must increase the size of their operation in order to provide their families with adequate living resources, part-time farmers have more options. Their diversified income portfolio makes their choice set more diversified. Some of them may decide to increase the size of their operation, relying on their off-farm income as an insurance mechanism, while others may decide to decrease the size of their operation, perhaps specializing in their most profitable output, while increasing their reliance on off-farm income. Some of these farmers may even be considered as “hobby farmers”, deriving utility for farming but relying much less on farming as an income source. It should be noted that Israel is a very small country and the vast majority of farmers are located within commuting distance to a major employment center. Hence, increasing their reliance on off-farm income is not very complicated (recall that we do not follow the same farms over time, so we do not account for the transition from full-time to part-time status; however, our results above indicate that the change in the fraction of part-time farms does not account for an important component of the changes in the farm size distribution). Decreasing the size of the farming operation is simply not an option for full-time farmers—they have to rely on farm production for a living and simply cannot survive with a smaller operation.
6. Conclusions
Analyses of changes in farm size distributions should be based on minimal distributional assumptions. This article proposes a nonparametric analysis in which the change in the distribution between two periods is decomposed into sliding, stretching and squashing components, as well as a subgroup component if the farm population is broken down to several subgroups. We apply this method to the case of Israeli family farms and analyze the changes in the farm size distribution in two separate time periods that are characterized by very different economic conditions. In particular, we focus on the different contributions of full-time farms and part-time farms to the overall distributional changes.
Our analysis shows that between 1971 and 1981, a period characterized by stability and prosperity of the Israeli farm sector, the change in the farm size distribution was almost entirely attributed to the sliding component; i.e., the whole distribution has shifted to the right with relatively minor changes in higher moments of the distribution. In addition, the difference between the contributions of full-time farms and part-time farms to the change in the size distribution is quite small.
The change in the distribution between 1981 and 1995 was much different. This period was unfavorable to Israeli farmers, with sharp changes in the economic and institutional environment leading to lower and more volatile farm incomes. It is therefore not surprising that the change in the distribution was much more complex between 1981 and 1995 than in the earlier period. In particular, while the overall change in the size distribution of farms was smaller in magnitude, the contribution of higher moments of the size distribution were not less important than the contribution of the sliding component. In addition, full-time and part-time farms contributed quite differently to the change in the farm size distribution, with full time farms contributing mostly to the growth in the average farm size, while average farm size among part-time farms actually decreased, and their contribution to the dispersion of farm sizes was quantitatively larger.
The policy implications of these results are not clear. There is no overall agreement among researchers and policymakers about the advantages and disadvantages of the related structural processes of farm exit and farm growth. On the one hand, a farm sector characterized by fewer and larger farms may be favorable in terms of its willingness and ability to adopt new production technologies, thereby contributing to the expansion of fresh produce availability and the reduction in the cost of living. On the other hand, smaller family farms tend to stabilize the supply of produce over time because they are less likely to quit or change their crop portfolios as a result of changing economic conditions. Smaller farms also tend to rely more heavily on labor rather than machinery, thereby contributing to rural employment.
It would be interesting to return to this analysis once more recent data become available. The economic environment of Israeli farms kept changing in subsequent years. Perhaps the most prominent change is the inflow of foreign labor that was banned until the early 1990s. There is some evidence that the increased availability of hired workers affected the farm sector in various ways [
36] that could favor certain types of farms differently, with possible ramifications for the farm size distribution. In particular, the inflow of cheap labor is theoretically predicted to create an advantage for larger farms, perhaps accelerating the shift to the right and the “disappearing middle” of the farm size distribution. Aggregate data indeed show that the number of self-employed farm operators continues to decline, indicating that the process of farm exits continues beyond the period covered by this research. Since agricultural production continues to increase and the operated farmland area is not declining much, the remaining farmers much be increasing in size. Data from specific sub-sectors, e.g., the dairy sector [
37], point in this direction as well.
The method proposed in this article proved to be quite useful, but it is still limited in its ability to examine multiple determinants of the distributional change. Of course, one can separate the sample into multiple subgroups that reflect more than one determinant, but this still falls short of a complete multivariate analysis. In fact, the analysis of changes in the average farm size already exists in the relevant literature (e.g., [
17]). For the analysis of changes in farm size inequality, one might apply two methods that have been in use for analyzing income inequality: the decomposition of inequality by population sub-groups, and the regression-based inequality decomposition that allows for the evaluation of the contribution of different characteristics to inequality (e.g., [
38]). This task is left for further research.


