Article

Wide–Narrow Row Planting Pattern Increases Root Lodging Resistance by Adjusting Root Architecture and Root Physiological Activity in Maize (Zea mays L.) in Northeast China

1
Key Laboratory of Mollisols Agroecology, Northeast Institute of Geography and Agroecology, Chinese Academy of Sciences, Changchun 130102, China
2
University of Chinese Academy of Sciences, Beijing 100864, China
*
Author to whom correspondence should be addressed.
Agriculture 2021, 11(6), 517; https://doi.org/10.3390/agriculture11060517
Submission received: 18 March 2021 / Revised: 28 May 2021 / Accepted: 30 May 2021 / Published: 3 June 2021
(This article belongs to the Section Crop Protection, Diseases, Pests and Weeds)

Abstract

:
Root lodging (RL) in maize can reduce yield and grain quality. A wide–narrow row planting pattern can increase maize yield in the growing regions of northeastern China, but whether it can improve RL resistance is not clear. Therefore, in this study, the root architecture distribution, root physiological activity, and root lodging rate under planting pattern 1 (uniform ridge of 65 cm, east–west ridge direction) and pattern 2 (wide–narrow rows, 40 double narrow rows and 90 wide rows, north–south ridge direction) were studied. The results showed that the RL rate under pattern 2 was significantly lower than that under pattern 1. The number and diameter of nodal roots on the upper node, the root failure moment, and the root bleeding sap intensity at the 3 weeks after VT under pattern 2 were significantly higher than those under pattern 1. Root length density in the 0–40 cm soil layer tended to be inter-row distributed. Therefore, the RL resistance of maize under pattern 2 was increased through an adjustment in the root architecture distribution and root physiological activity in northeastern China.

1. Introduction

Maize is a major food crop both globally and in China. In China, farmers have increased the planting density of maize in order to obtain higher grain yields. However, the risk of root lodging increases with increasing planting density in maize [1,2]. Root lodging (RL), especially after flowering, significantly reduces grain yield and quality in maize [3].
Keeping the shoot upright is one of the most important functions of the root system of maize. RL occurs due to the failure of root anchoring, and the shoot is permanently displaced from a vertical position at the base of the stem [4,5]. Root lodging resistance (RLR) is affected by the root architecture distribution in the soil [6,7]. Generally, plants with more and thicker roots and a larger root extension angle have stronger RLR [4,7,8]. Root architecture distribution is affected by the planting pattern. Sharratt and McWilliams compared the root distribution of maize planted under three row spacings (0.38, 0.57, and 0.76 m) and concluded that, compared with wide row spacing (0.76 cm), the root distribution under narrow row spacing (0.38 cm) was more uniform [9]. San Oh et al. reported that the root number and root length density (RLD) of rice varied between one plant or three plants per hill [10]. Wu et al. reported a difference between the root morphology and angle of maize between one plant or two plants in each hole [6]. These researchers studied the effect of the planting pattern on root architecture distribution and attempted to identify an optimal root architecture distribution with an appropriate planting pattern in order to increase the RLR ability of crops under the premise of ensuring that the roots could adequately absorb water and nutrients [11].
Roots are responsible for absorbing water and nutrients such as inorganic salts and minerals from the soil and for the synthesis of compounds such as amino acids and hormones; some of them are transported from roots to shoots through the xylem sap for the growth and development of shoots and grain yield [12,13,14]. Therefore, the root-bleeding sap intensity and its composition are considered to be effective indices for the evaluation of the physiological activity of roots [15,16,17]. Guan et al. found that the nitrate nitrogen, ammonium nitrogen, and potassium delivery rates in the root bleeding sap of maize were higher under plowing tillage compared with no tillage [13]. Liang et al. reported that the concentration of free amino acids in root-bleeding sap was higher when there was one plant in each hole compared with two plants in each hole [18]. Previous studies have shown that the intensity of the root-bleeding sap and the contents of nitrate nitrogen, ammonium nitrogen, potassium, and free amino acids in root bleeding sap differed with different planting patterns. However, there is limited literature on the causes of the difference in root-bleeding effusion caused by planting patterns.
A planting pattern with wide–narrow rows is popular due to its ability to increase grain yield, optimize the crop canopy structure, improve ventilation and light transmission within the canopy, and delay leaf senescence at the late growth stage in northeastern China [19,20,21]. However, limited studies are available on root architecture distribution, the physiological activity of roots, and RLR under this planting pattern. Therefore, in the present study, the root architecture distribution, root physiological activity, and the RLR under a planting pattern with wide–narrow rows in field-grown maize were evaluated.

2. Materials and Methods

2.1. Materials and Cultivation of Plants

The experiment was carried out in the experimental field of the Northeast Institute of Geography and Agroecology, Chinese Academy of Sciences, China (125°33′ E, 44°12′ N). The soil type in the field is Phaeozems (FAO-WRB classification system, 2014). Temperature and precipitation during the growth season in 2016 and 2017 are shown in Figure 1.
Planting pattern 1 was a uniform ridge with a ridge spacing of 65 cm. The ridge direction was east to west. Pattern 2 was a pattern of wide–narrow rows in which the distance between adjacent wide rows was 90 cm, the distance between double narrow rows was 40 cm, and the ridge direction was north to south (Figure 2B). Considering that the ridge direction may affect the growth of maize [20], we designed east-west and north-south ridge directions. The maize variety was Beiyu; the length of its vegetation period is 120 days. Plant spacing was 23.6 cm under both pattern 1 and pattern 2. Sowing was conducted on 1 May in 2016 and 2017. A one-time fertilizer application was conducted before sowing that consisted of 225 kg N ha−1, 80 kg K2O ha−1, and 80 kg P2O5 ha−1 for both treatments without topdressing [22]. The width of each plot was 10.4 m, and the length was 10 m. Plots were randomly arranged with three replications. Plant protection, including herbicide and insecticide application, was applied as part of the usual practices. The experiment was performed under dry farming conditions.

2.2. Number and Diameter of Nodal Roots

The root system along with the soil of each plant in each plot was excavated, and the soil was washed away with running water during the flowering period in 2016 and 2017. The number of nodal roots per whorl was recorded. The first whorl roots of the coleoptile were recorded as the nodal roots of the first whorl, and the second whorl roots were recorded as the nodal roots of the second whorl [7]. A digital vernier caliper was used to measure the diameter of the nodal roots 10 cm below the junction of the stem and roots.

2.3. Root Length Density (RLD)

For analyzing root morphological traits and the vertical and horizontal distributions, root samples were taken at VT. Generally, the RLD is at its maximum value at this stage in maize [23]. In each plot, four trenches with a depth of 1.0 m and a width of 0.6 m were dug around each plant. The center of these four trenches was one soil column with a length, width, and height of 23.6 cm, 65 cm, and 100 cm, respectively. The distance between two adjacent intra-row plants was 23.6 cm, and the average row spacing in patterns 1 and 2 was 0.65 m. The soil column did not loosen because the black soil in the experimental field is viscous and heavy. After the maize shoots were cut off, the soil columns with roots were obtained according to different horizontal (Figure 2C,D) and vertical distances from the plants according to Böhm [24]. The soil had a cuboid geometry and was divided according to the different horizontal and vertical distances from the plants.
In the vertical direction, there were five layers of each soil column extending to 100 cm below the soil surface. These layers were recorded as 0–20, 20–40, 40–60, 60–80, and 80–100 cm. The height of each layer of the soil column was 20 cm. In the horizontal direction, in each layer, the soil column in pattern 1 was divided into three sub-soil columns with a special implement: one central sub-soil column (23.6 cm × 40 cm × 20 cm) and two sub-soil columns of the outer 20–32.5 cm (23.6 cm × 12.5 cm × 20 cm). Therefore, we obtained 15 sub-soil columns with five layers per plant in pattern 1 (Figure 2C). In pattern 2, in each layer, the soil column was divided into two sub-soil columns: one central sub-soil column (23.6 cm × 40 cm × 20 cm) and one outer sub-soil column (23.6 cm × 25 cm × 20 cm). Therefore, we obtained 10 sub-soil columns with five layers per plant (Figure 2D). Three repeats were obtained for each plot.
Each sub-soil column was placed in a special mesh bag and then soaked in water and washed. The root samples were collected using a 0.4 mm sieve. The total root length of samples was analyzed using WinRHIZO 4.0 (Regent Instruments Ins., Quebec City, QC, Canada). While scanning, the root sample was placed in a transparent plexiglass rectangular dish (200 mm × 150 mm) with a layer of water about 5 mm deep to minimize root overlap. When necessary, to fit the rectangular dish, the root was separated into subsamples. RLD was calculated using Equation (1): [4]
RLD (cm cm−3) = root length/soil value

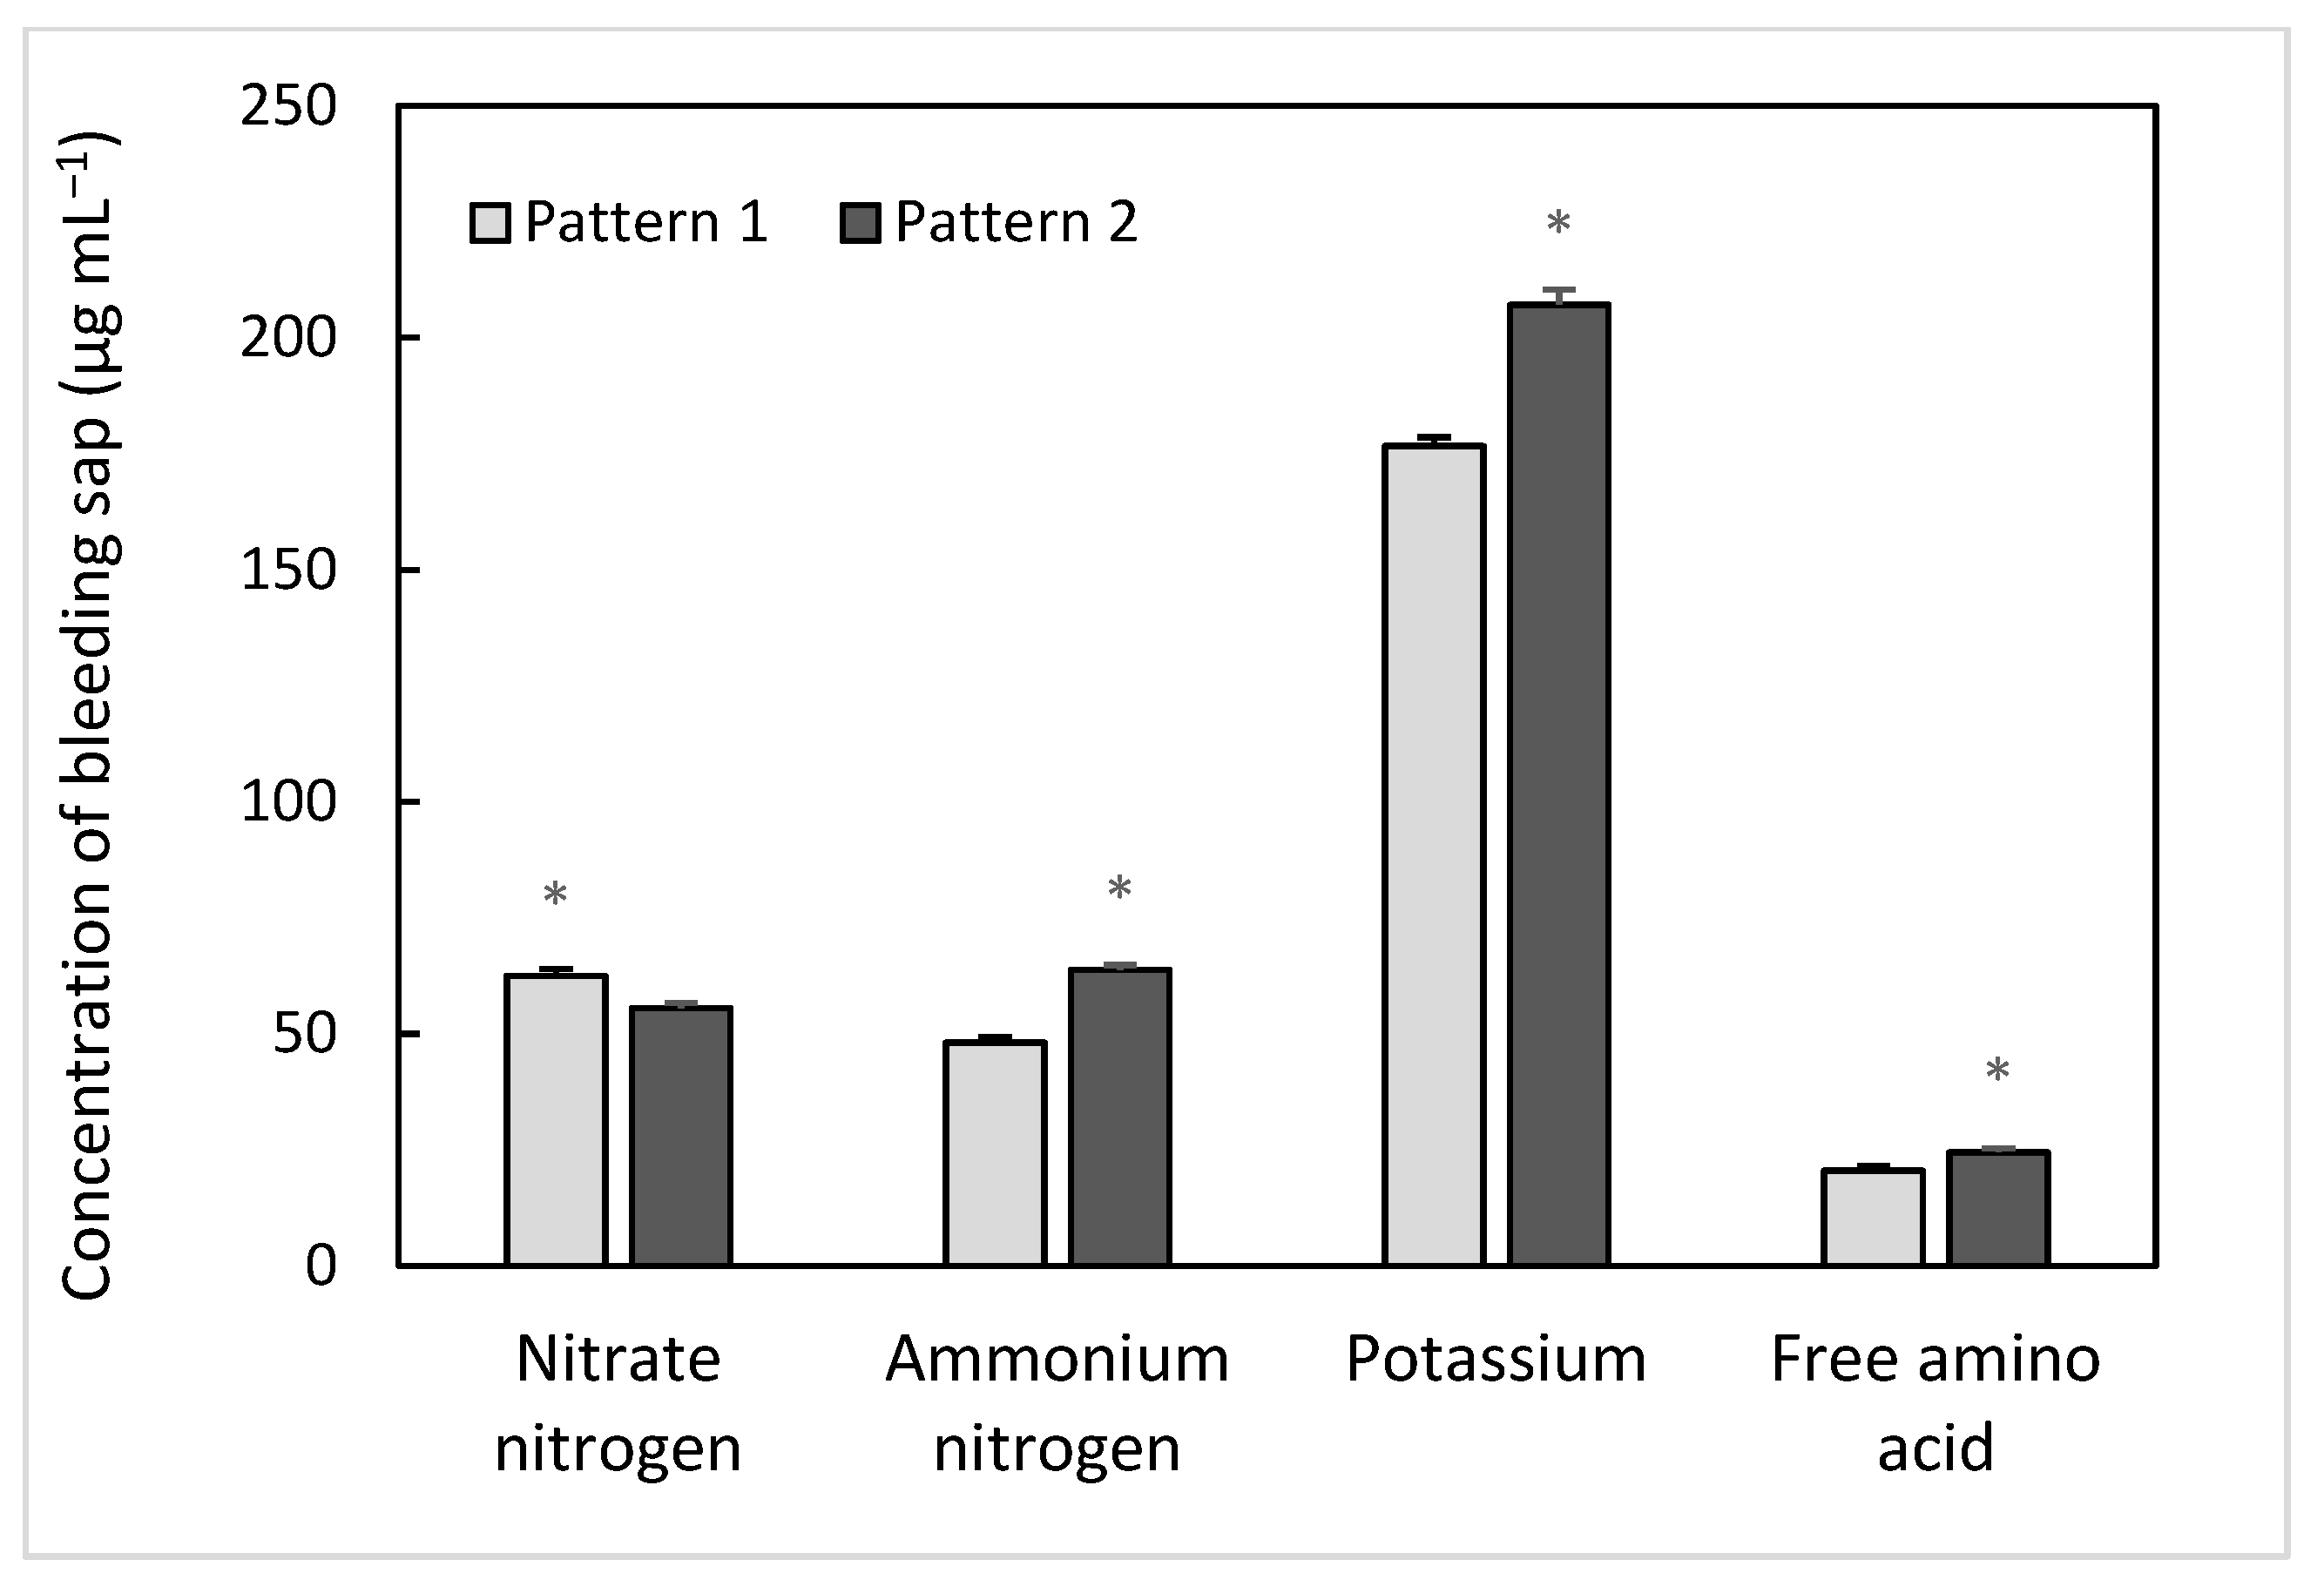
2.4. Root Bleeding Sap Intensity, Nitrate Nitrogen, Ammonium Nitrogen, Potassium, and Free Amino Acid Concentration of Root Bleeding Sap

Root bleeding sap intensity was measured at V12, VT, and 3 weeks after VT. Five plants were selected in each plot. A clean knife was used to remove the shoot; an incision was made at the base of the shoot of each plant, and the incision was washed with distilled water and dried using filter paper. Before collection of the root bleeding sap, dry absorbent cotton and a plastic bag were prepared in advance and weighed. The weight of dry absorbent cotton and a plastic bag was recorded as W0; then, the absorbent cotton was placed over the stem incision, covered with the plastic bag, and fixed with a piece of string to collect the root bleeding sap. Collection was conducted from 8:00 to 20:00. Then, the string was removed, and the weight of the absorbent cotton and plastic bag was measured using a balance and recorded as W. The root bleeding sap intensity was calculated using Equation (2) [25]:
Root bleeding sap intensity (g h−1 plant−1) = (WW0)/12
The absorbent cotton with root-bleeding sap collected at VT was centrifuged to obtain the root bleeding sap. In 2017, the total free amino acid concentration was measured using the ninhydrin staining method [25], the ammonium nitrogen concentration was determined using the indophenol blue spectrophotometric method of van Staden and Taljaard [26], the nitrate nitrogen concentration was determined using ultraviolet spectrophotometry [25], and the potassium concentration was measured using ICP-OES (Shimadzu, Kyoto, Japan).

2.5. Natural Root Lodging Rate and Root Failure Moment (Rfm)

The number of natural RLs of maize was defined and calculated as the permanent displacement of the whole stem per plant from the vertical position at the base of the plant on October 8 in 2016 and 2017, and the RL rate was calculated as the number of root lodgings divided by the total number per plot [27].
Rfm was measured at 3 weeks after VT. RL is prone to occur during this period [7]. The soil in each plot was pre-wet two days before the measurement. The horizontal pushing test was conducted on 15 plants per variety (three replicates with five plants each). After removal of the leaf sheaths and the cutting of the stems 0.4 m above the soil surface, the plants were manually pushed 0.20 m above the soil surface. The maximal force (in N) of the push, measured by an ergometer, and the angle, determined by a protractor, between the horizontal soil surface (a) and the slanting stem during exertion of the maximal force were recorded. The Rfm (root failure moment) was calculated by Equation (3): [28]
Rfm = Fmax × cos(a) × h
where Rfm is the root failure moment (in Nm), Fmax is the maximal force (in N) of the push, and h is 0.2 m.

2.6. Grain Yield

On October 10, the two middle rows of each plot were harvested to determine the grain yield. Grain yield was measured and calculated when the water content of the grain was 14%.

2.7. Statistical Analysis

The mean and standard deviation were calculated using Microsoft Excel 2007 (Microsoft Corporation, Redmond, DC, USA). Analysis of the difference was conducted on the number and diameter of nodal roots in patterns 1 and 2, which were compared using t-tests (p < 0.05). The root bleeding sap intensity and the nitrate nitrogen, ammonium nitrogen, potassium, and free amino acid concentrations of the root bleeding sap in patterns 1 and 2 were compared using t-tests (p < 0.05). Analysis of the difference was conducted on the RLD of each soil layer in patterns 1 and 2, which were compared using t-tests (p < 0.05). Linear regression analysis between the weighted average root diameter and root bleeding sap intensity, between the root-bleeding sap intensity and grain yield, and between RLD and the natural RL rate were analyzed using SPSS 16.0 software (SPSS Inc., Chicago, IL, USA).
The mean and standard deviation were calculated using Microsoft Excel 2007 (Microsoft Corporation, Redmond, Washington, USA). Analysis of the difference was conducted on the number and diameter of nodal roots in patterns 1 and 2, which were compared using t-tests (p < 0.05). The root bleeding sap intensity and the nitrate nitrogen, ammonium nitrogen, potassium, and free amino acid concentrations of the root bleeding sap in patterns 1 and 2 were compared using t-tests (p < 0.05). Analysis of the difference was conducted on the RLD of each soil layer in patterns 1 and 2, which were compared using t-tests (p < 0.05). Linear regression analysis between the weighted average root diameter and root bleeding sap intensity, between the root-bleeding sap intensity and grain yield, and between RLD and the natural RL rate were analyzed using SPSS 16.0 software (SPSS Inc., Chicago, IL, USA).

3. Results

3.1. Number and Diameter

The number of nodal roots of the seventh and eighth whorls of maize under pattern 2 was significantly higher than that under pattern 1, but no significant difference was observed in the number of nodal roots from the first to sixth whorls between pattern 1 and pattern 2 in 2016. The number of nodal roots of the eighth whorl in 2017 and the diameter of nodal roots of the eighth whorl in 2016 and 2017 were significantly higher than those in pattern 1; however, no significant difference was observed in the number and diameter of nodal roots from the first to seventh whorls between pattern 1 and pattern 2 (Figure 3).

3.2. RLD

The RLD values in the central columns in the 20–40 cm soil layer and the RLD values in the outer columns in the 0–20 cm and 20–40 cm soil layers in 2016 and 2017 under pattern 2 were higher than those under pattern 1 (Figure 4). The RLD values in the central columns in the 0–20 cm soil layer and the RLD values in the central and outer columns in the 40–60 cm, 60–80 cm, and 80–100 cm soil layers were not significantly different in 2016 and 2017.

3.3. Root Bleeding Sap Intensity and Its Composition

The root bleeding sap intensity at 3 weeks after VT under pattern 2 was significantly higher than that under pattern 1, while the root-bleeding sap intensity at V12 and VT was not significantly different (Figure 5).
The nitrate nitrogen concentration of root bleeding sap under pattern 1 was significantly higher than that under pattern 2 at VT. The ammonium nitrogen, potassium, and free amino acid concentrations of root bleeding sap under pattern 2 were significantly higher than those under pattern 1 (Figure 6). Compared with pattern 1, the nitrate nitrogen concentration of root bleeding sap was decreased by 11.11%, the ammonium nitrogen, potassium, and free amino acid concentrations of root bleeding sap under pattern 2 were increased by 32.55%, 17.20%, and 19.15%, respectively.

3.4. Grain Yield, Rfm, and Root Lodging Rate

The grain yield and Rfm under pattern 2 were significantly higher than those under pattern 1 in 2016 and 2017. The RL rate under pattern 2 was significantly lower than that under pattern 1 (Figure 7).

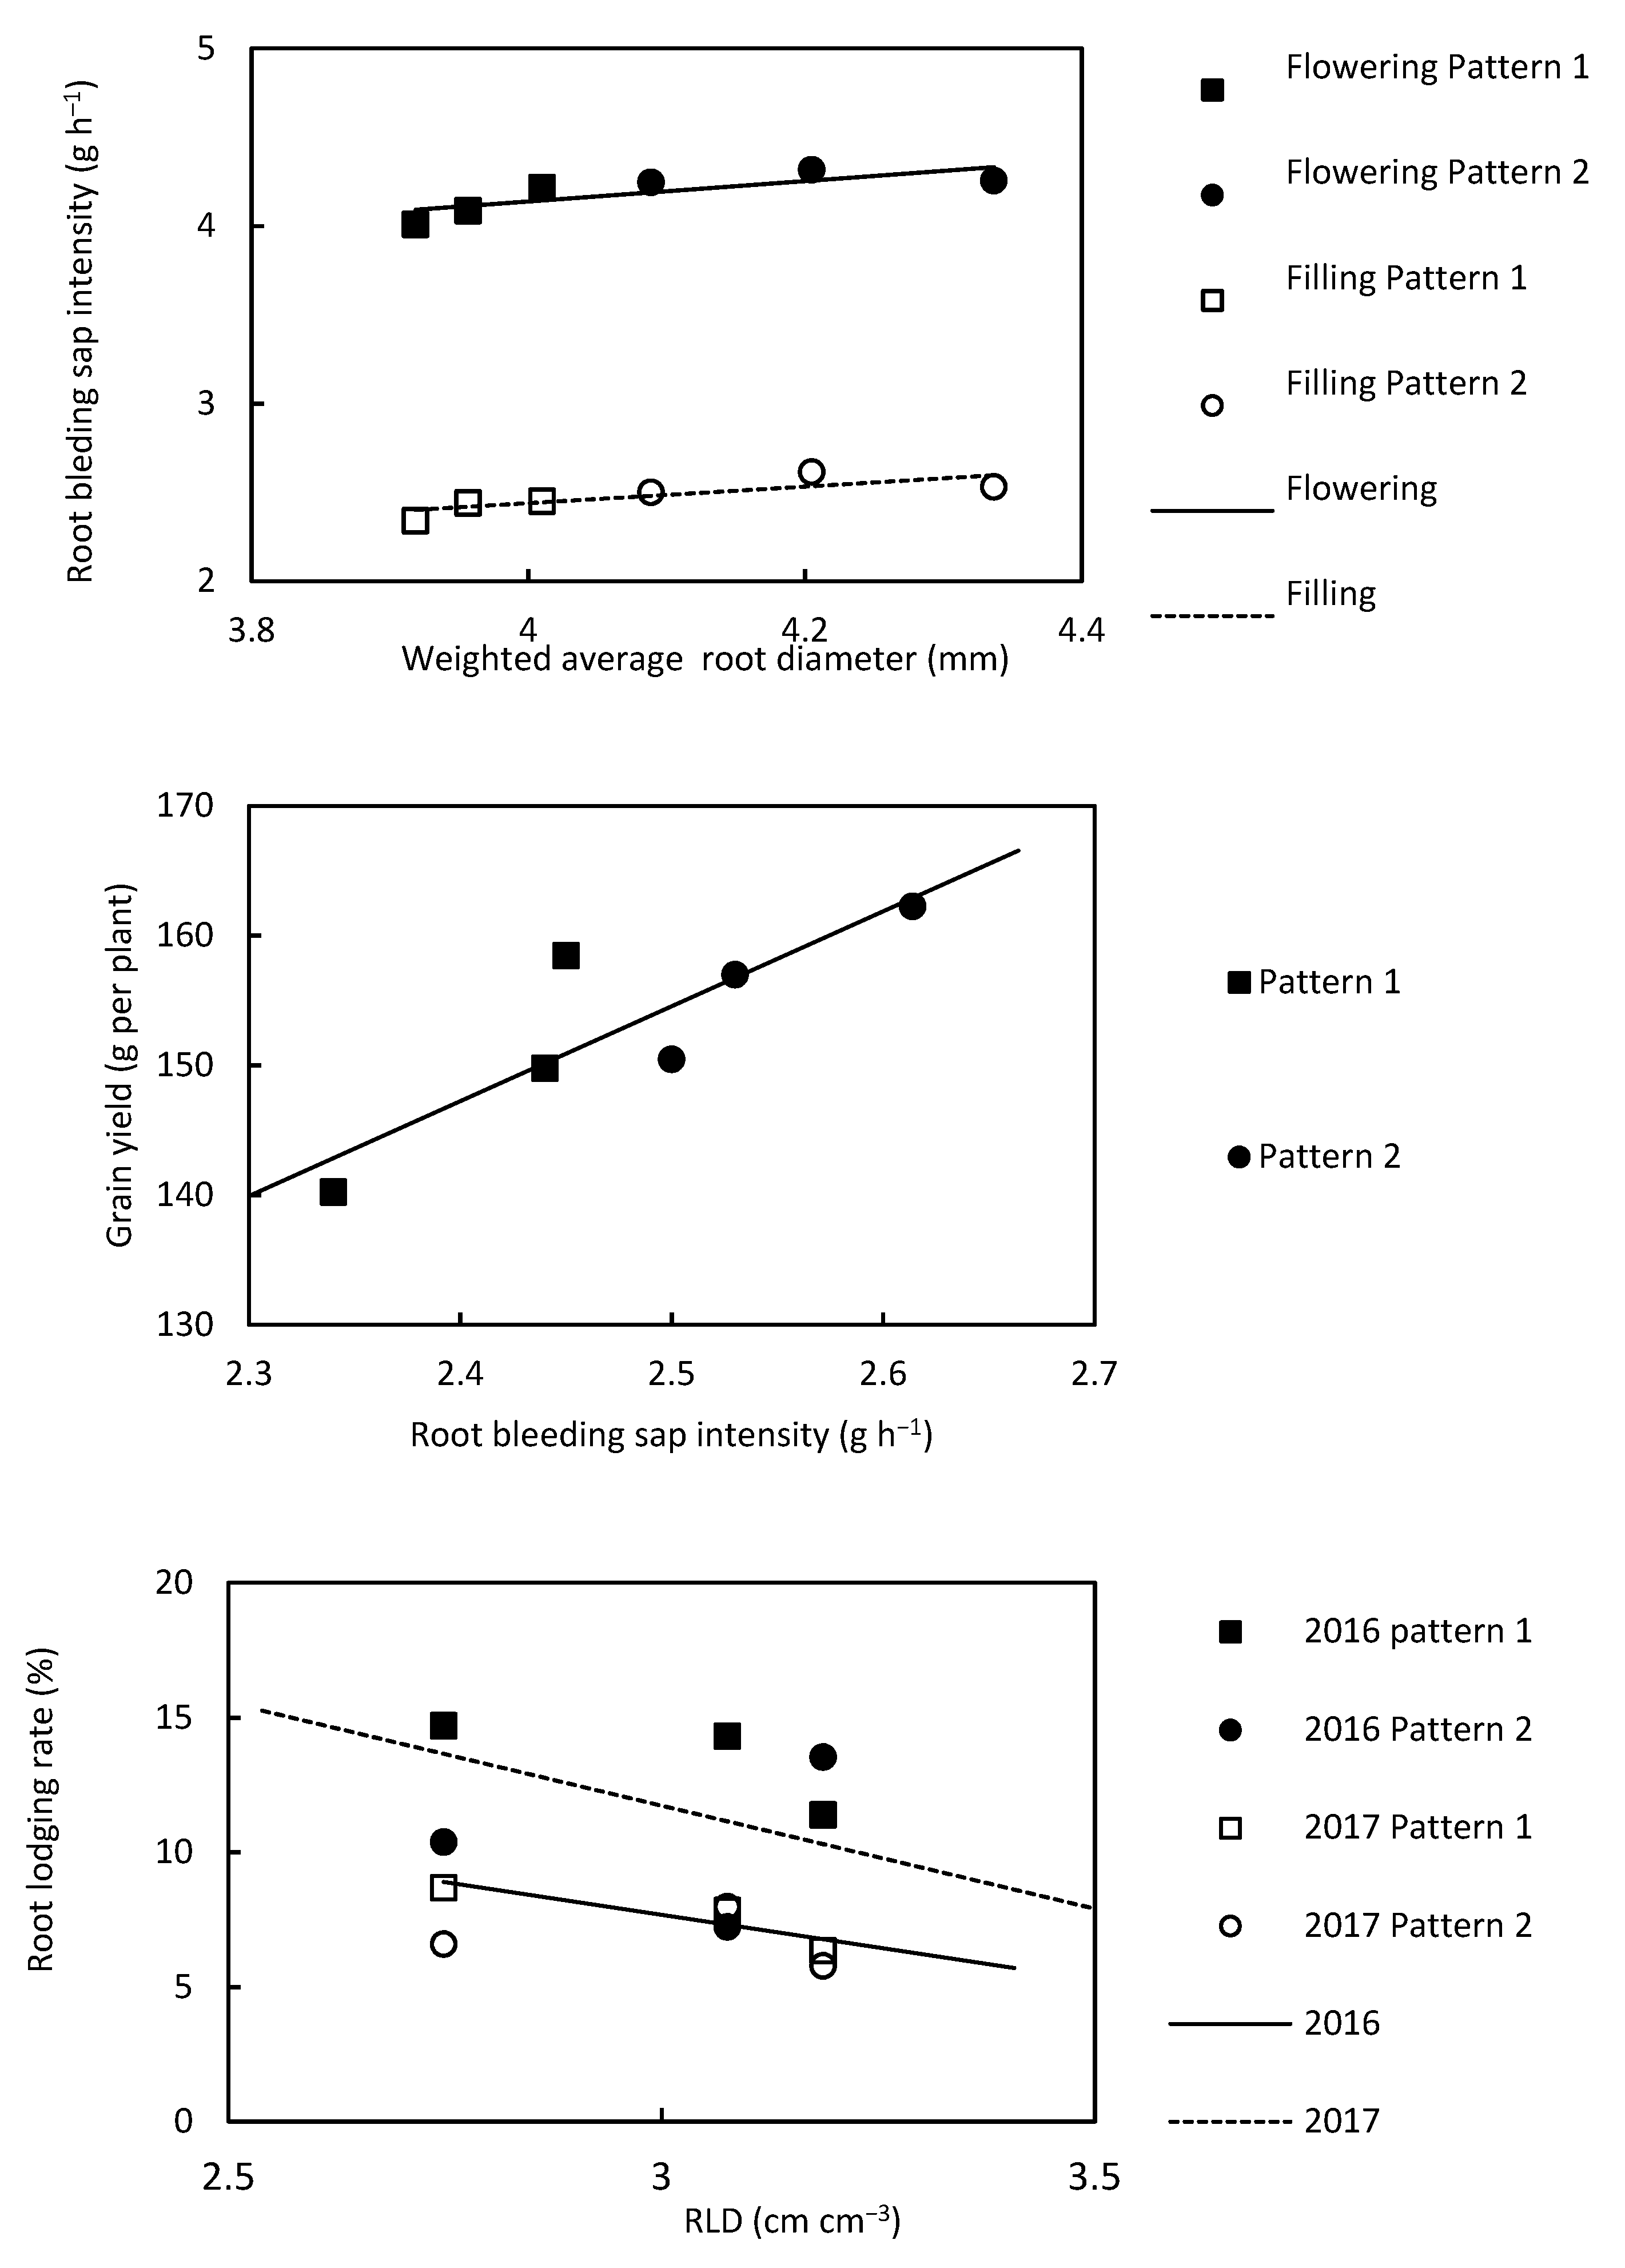
3.5. Relationships between the Root Diameter and Root-Bleeding Intensity, the Root-Bleeding Intensity and Grain Yield, and the RLD and Root Lodging Rate

The weighted average root diameter had a significant positive linear correlation with root-bleeding sap intensity at VT (R2 = 0.64) and 3 weeks after VT (R2 = 0.62) under pattern 1 and pattern 2. The root-bleeding sap intensity had a significant positive linear correlation with grain yield (R2 = 0.74). The RLD of the horizontal distance 0–20 cm from the plant intra-row direction in the 0–20 cm soil layer and the RL rate had a significant negative linear correlation in 2016 (R2 = 0.86) and 2017 (R2 = 0.87) (Figure 8).

4. Discussion

In the present study, the RL rate under pattern 2 was lower than that under pattern 1, and the Rfm under pattern 2 was higher than that under pattern 1. This indicated that RLR was strong under pattern 2. Root architecture is affected by planting patterns [29,30]. RLD is an important parameter in root architecture. In the present paper, the planting pattern also affected the number and diameter of nodal roots on the upper node of the stem base. The plants under pattern 2 had more and thicker nodal roots. Roots play an important role in anchoring maize and resisting RL. Our previous research showed that Rfm was positively correlated with the number and diameter of nodal roots on the upper nodes of the stem base [7].
Under not optimal conditions, plants with higher RLD have better water and nutrient absorption efficiency, resulting in higher dry matter accumulation and yield [31,32]. In the present paper, the planting density under pattern 1 and pattern 2 was the same, and the planting distance intra-row of both pattern 1 and pattern 2 was 23.6 cm, but the row spacing between them was different. The row spacing of pattern 1 was uniform; therefore, the differences in root distribution were mainly caused by the distance from the plants. However, the row spacing of pattern 2 was uneven, and the distance between the two seedling bands in narrow rows was closer, while the distance between the wide rows was farther. Therefore, in order to reduce competition, the roots tended to be distributed inter-row under wide row spacing [22]. The RLD of the horizontal distance 20–45 cm from the plant inter-row direction in the wide row in the 0–20 cm and 20–40 cm soil layers under pattern 2 was higher than that under pattern 1. This result is consistent with previous research results [22] and indicated that the roots were distributed in the inter-row under pattern 2.
In the present paper it was shown that the weighted average root diameter had a positive linear correlation with the root bleeding sap intensity. Therefore, for a single nodal root, thicker roots may have more lateral roots and can absorb more water and mineral nutrients and synthesize more compounds. This increased the ammonium nitrogen, potassium and free amino acid concentrations in the root bleeding sap under pattern 2. The root system of pattern 2 provided more substances for the growth and development of the maize shoots, which was conducive to the accumulation of more carbohydrates, so the grain yield of pattern 2 was higher. Therefore, the root bleeding sap intensity has a positive correlation with the grain yield. Widdicombe and Thelen reported that the grain yield of maize under narrow row spacing increased compared with wider row spacing [33]. In contrast, some researchers have reported that narrow rows did not increase or decrease maize yield [34]. In the present paper, the grain yield under pattern 2 was higher than that under pattern 1.
The composition of root bleeding sap contains organic matter synthesized by roots, which is transported from the roots to the aboveground parts [35]. Maize roots mainly absorb NO3, part of which is reduced to NH4+ by nitrate reductase and nitrite reductase [36]. Moreover, some of NH4+ is transported upward through the xylem, while the remainder is assimilated into organic nitrogen [37]. In this paper, compared with pattern 1, the ammonium nitrogen and free amino acid concentrations were significantly higher under pattern 2. This finding indicates that roots have a strong ability to synthesize ammonium nitrogen and amino acids during 3 weeks after VT under pattern 2. The potassium concentration in the root-bleeding sap under pattern 2 was higher than that under pattern 1. A higher potassium concentration can enhance the breaking-resistant strength of stem and improve lodging resistance [11].
The grain yield, Rfm and RL rates varied from 2016 and 2017. This was related to differences in rainfall because our experimental plots relied on natural precipitation and no irrigation. Compared with the two-year precipitation amount, the precipitation amount was relatively high in May, June, and September in 2016, while it was relatively high in July and August in 2017. In 2016, maize was in the vegetative growth stage in May and June, and excessive rain was not good for root growth [38]. In addition, maize was in the late grain filling and physiological maturity stage in September 2016, and a large amount of rainfall could easily induce RL in this period [8]. Therefore, the Rfm and RL rate in 2016 were higher than those in 2017.
In the present study, the number of nodal roots of the eighth whorl in 2017 and the diameter of nodal roots of the eighth whorl in 2016 and 2017 were significantly higher than those in pattern 1. This may be related to the different leaf photosynthesis and its assimilate supply to the root due to the different canopy structure between patterns 1 and pattern 2 [20,21], but it has not been reported in the literature.

5. Conclusions

Planting patterns affect root architecture distribution and root physiological activity. Under a planting pattern with wide–narrow rows and a north–south ridge orientation, maize plants adjusted their root growth in the intra-row and inter-row direction to accommodate uneven row spacing, and the root physiological activity was improved, compared with that of the planting pattern with uniform ridge and east–west ridge orientation. Finally, the plant resistance to RL was improved, compared with that of the planting pattern with uniform ridges and an east–west ridge orientation.

Author Contributions

Writing—original draft preparation, Y.W.; data collecting, X.L. and S.L.; writing—review and editing, S.J.; experimental design, S.L.; project administration, S.L.; funding acquisition, S.L. All authors have read and agreed to the published version of the manuscript.

Funding

This research was funded by the National Natural Science Foundation of China, grant number 31971850 and Open Project of CAS Key Laboratory of Mollisols Agroecology, grant number 2020ZKHT–01.

Institutional Review Board Statement

Not applicable.

Data Availability Statement

Not applicable.

Conflicts of Interest

The authors declare no conflict of interest.

References

  1. Zhang, S.H. The comparison about maize breeding ideas and technical level between China and American. Beijing Agric. 2007, 14, 13–16. [Google Scholar]
  2. Bian, D.; Jia, G.; Cai, L.; Ma, Z.; Eneji, A.E.; Cui, Y. Effects of tillage practices on root characteristics and root lodging resistance of maize. Field Crop. Res. 2016, 185, 89–96. [Google Scholar] [CrossRef]
  3. So, Y.S.; Adetimirin, V.O.; Kim, S.K. Observational study on the recovery from root lodging at flowering time and yield reduction in maize (Zea mays L.). Plant Bleeding Biotechnol. 2013, 1, 171–177. [Google Scholar] [CrossRef] [Green Version]
  4. Crook, M.J.; Ennos, A.R. The mechanics of root lodging in winter wheat Triticum aestivum L. J. Exp. Bot. 1993, 44, 1219–1224. [Google Scholar] [CrossRef]
  5. De Dorlodot, S.; Forster, B.; Pagès, L.; Price, A.; Tuberosa, R.; Draye, X. Root system architecture: Opportunities and constraints for genetic improvement of crops. Trends Plant Sci. 2007, 12, 474–481. [Google Scholar] [CrossRef]
  6. Wu, K.; Zhou, F.; Zhou, S.; Zhang, X.; Wu, B. Enhancing root lodging resistance of maize with twin plants in wide-narrow rows: A case study. Plant Prod. Sci. 2020, 23, 286–296. [Google Scholar] [CrossRef] [Green Version]
  7. Liu, S.; Song, F.; Liu, F.; Zhu, X.; Xu, H. Effect of planting density on root lodging resistance and its relationship to nodal root growth characteristics in maize (Zea mays L.). J. Agric. Sci. 2012, 12, 182–189. [Google Scholar] [CrossRef] [Green Version]
  8. Berry, P.M.; Griffin, J.M.; Sylvester-Bradley, R.; Scott, R.K.; Spink, J.H.; Baker, C.J.; Clare, R.W. Controlling plant form through husbandry to minimize lodging in wheat. Field Crop. Res. 2000, 67, 59–81. [Google Scholar] [CrossRef]
  9. Sharratt, B.S.; McWilliams, D.A. Microclimatic and rooting characteristics of narrow-row versus conventional-row corn. Agron. J. 2005, 97, 1129–1135. [Google Scholar] [CrossRef] [Green Version]
  10. San-Oh, Y.; Sugiyama, T.; Yoshita, D.; Ookawa, T.; Hirasawa, T. The effect of planting pattern on the rate of photosynthesis and related processes during ripening in rice plants. Field Crop. Res. 2006, 96, 113–124. [Google Scholar] [CrossRef]
  11. Zhang, S.; Yang, Y.; Zhai, W.; Tong, Z.; Shen, T.; Li, Y. Controlled-release nitrogen fertilizer improved lodging resistance and potassium and silicon uptake of direct-seeded rice. Crop Sci. 2019, 59, 2733–2740. [Google Scholar] [CrossRef]
  12. Noguchi, A.; Kageyama, M.; Shinmachi, F.; Schmidhalter, U.; Hasegawa, I. Potential for using plant xylem sap to evaluate inorganic nutrient availability in soil: I. Influence of inorganic nutrients present in the rhizosphere on those in the xylem sap of Luffa cylindrica Roem. Soil Sci. Plant Nutr. 2005, 51, 333–341. [Google Scholar] [CrossRef]
  13. Guan, D.; Al-Kaisi, M.M.; Zhang, Y. 2Tillage practices affect biomass and grain yield through regulating root growth, root-bleeding sap and nutrients uptake in summer maize. Field Crop. Res. 2014, 157, 89–97. [Google Scholar] [CrossRef]
  14. Zhang, H.; Xue, Y.; Wang, Z.; Yang, J.; Zhang, J. Morphological and physiological traits of roots and their relationships with shoot growth in “super” rice. Field Crop. Res. 2009, 113, 31–40. [Google Scholar] [CrossRef]
  15. Cui, X.; Dong, Y.; Gi, P.; Wang, H.; Xu, K.; Zhang, Z. Relationship between root vigour, photosynthesis and biomass in soybean cultivars during 87 years of genetic improvement in the northern China. Photosynthetica 2016, 54, 81–86. [Google Scholar] [CrossRef]
  16. Kato, C.; Ohshima, N.; Kamada, H.; Satoh, S. Enhancement of the inhibitory activity for greening in xylem sap of squash root with waterlogging. Plant Physiol. Biochem. 2001, 39, 513–519. [Google Scholar] [CrossRef]
  17. Wang, H.; Xu, R.; Li, Y.; Yang, L.; Shi, W.; Liu, Y.; Chang, S.; Hou, F.; Jia, Q. Enhance root-bleeding sap flow and root lodging resistance of maize under a combination of nitrogen strategies and farming practices. Agric. Water Manag. 2019, 224, 105742. [Google Scholar] [CrossRef]
  18. Liang, X.; Guo, F.; Feng, Y.; Zhang, J.; Yang, S.; Meng, J.; Li, X.; Wan, S. Single-seed sowing increased pod yield at a reduced seeding rate by improving root physiological stage of Arachis hypogaea. J. Integr. Agric. 2020, 19, 1019–1032. [Google Scholar] [CrossRef]
  19. Tian, C.; Han, J.; Li, J.; Zhen, G.; Liu, Y.; Lu, Y.; Wang, Y.; Wang, Y. Effects of row direction and row spacing on maize leaf senescence. PLoS ONE 2019, 14, e0215330. [Google Scholar] [CrossRef]
  20. Liu, S.; Wang, Y.; Song, F.; Qi, X.; Li, X.; Zhu, X. Responses of leaf architecture traits and yield in maize to different row orientation and planting patterns in northeast China. Rom. Agric. Res. 2017, 34, 243–254. [Google Scholar]
  21. Liu, T.; Song, S.; Zhu, X. Light interception and radiation use efficiency response to narrow-wide row planting patterns in maize. Aust. J. Crop Sci. 2012, 6, 506–513. [Google Scholar]
  22. Shao, H.; Xia, T.; Wu, D.; Chen, F.; Mi, G. Root growth and root system architecture of field-grown maize in response to high planting density. Plant Soil 2018, 430, 395–411. [Google Scholar] [CrossRef]
  23. Durieux, R.P.; Kamprath, E.J.; Jackson, W.A.; Moll, R.H. Root distribution of corn: The effect of nitrogen fertilization. Agron. J. 1994, 86, 958–962. [Google Scholar] [CrossRef]
  24. Böhm, W. Methods of Studying Root Systems. Ecological Studies; Springer: Berlin, Germany, 1979; Volume 33, pp. 20–25. [Google Scholar]
  25. He, Z.; Xu, B.; Liu, B.; Yao, B.; Wang, H.; Chen, Z.; Li, D.; Bai, Z.; Zhang, Z. Relationship between photosynthesis, bleeding-sap mass, and bleeding components in maize hybrids and corresponding parents in northern China. Photosynthetica 2019, 57, 698–704. [Google Scholar] [CrossRef] [Green Version]
  26. van Staden, J.F.; Taljaard, R.E. Determination of ammonia in water and industrial effluent streams with the indophenol blue method using sequential injection analysis. Anal. Chim. Acta 1997, 344, 281–289. [Google Scholar] [CrossRef]
  27. Pinthus, M.J. Lodging in wheat, barley and oats: The phenomenon, its causes, and preventive measures. Adv. Agron. 1974, 25, 209–263. [Google Scholar]
  28. Fouéré, A.; Pellerin, S.; Duparque, A. A portable electronic device for evaluating root lodging resistance in maize. Agron. J. 1995, 87, 1020–1024. [Google Scholar] [CrossRef]
  29. Yu, G.; Zhuang, J.; Nakayana, K.; Jin, Y. Root water uptake and profile soil water as affected by vertical root distribution. Plant Ecol. 2007, 189, 15–30. [Google Scholar] [CrossRef]
  30. Nakamoto, T. Effect of soil water content on the gravitropic behavior of nodal roots in maize. Plant Soil 1993, 152, 261–267. [Google Scholar] [CrossRef]
  31. Wang, C.; Liu, W.; Li, Q.; Ma, D.; Lu, H.; Feng, W.; Xie, Y.; Zhu, Y.; Guo, T. Effects of different irrigation and nitrogen regimes on root growth and its correlation with above-ground plant parts in high-yielding wheat under field conditions. Field Crop. Res. 2014, 165, 138–149. [Google Scholar] [CrossRef]
  32. Wang, Z.; Ma, B.; Gao, J.; Sun, J. Effects of different management systems on root distribution of maize. Can. J. Plant Sci. 2015, 95, 21–28. [Google Scholar] [CrossRef]
  33. Widdicombe, W.D.; Thelen, K.D. Row width and plant density effects on corn grain production in the northern Corn Belt. Agron. J. 2002, 94, 1020–1023. [Google Scholar] [CrossRef]
  34. Pedersen, P.; Lauer, J.G. Corn and soybean responses to rotation sequence, row spacing, and tillage system. Agron. J. 2003, 95, 965–971. [Google Scholar] [CrossRef] [Green Version]
  35. Ansari, T.H.; Yamamoto, Y.; Yoshida, T.; Sakagami, K.; Miyazaki, A. Relation between bleeding rate during panicle formation stage and sink size in rice plant. Soil Sci. Plant Nutr. 2004, 50, 57–66. [Google Scholar] [CrossRef] [Green Version]
  36. Zhang, J.; Li, S.; Cai, Q.; Wang, Z.; Cao, J.; Yu, T.; Xie, T. Exogenous diethyl aminoethyl hexanoate ameliorates low temperature stress by improving nitrogen metabolism in maize seedlings. PLoS ONE 2020, 15, e0232294. [Google Scholar] [CrossRef] [PubMed]
  37. Husted, S.; Hebbern, C.A.; Mattsson, M.; Schjoerring, J.K. A critical experimental evaluation of methods for determination of NH4+ in plant tissue, xylem sap and apoplastic fluid. Physiol. Plant 2000, 109, 167–179. [Google Scholar] [CrossRef]
  38. Tiwari, P.; Srivastava, D.; Chauhan, A.S.; Indoliya, Y.; Singh, P.K.; Tiwari, S.; Fatima, T.; Mishra, S.K.; Dwivedi, S.; Agarwal, L.; et al. Root system architecture, physiological analysis and dynamic transcriptomics unravel the drought-responsive traits in rice genotypes. Ecotox. Environ. Saf. 2020, 207, 111252. [Google Scholar] [CrossRef]
Figure 1. Monthly average temperature and precipitation amount in 2016 and 2017.
Agriculture 11 00517 g001
Figure 2. Schematic of planting patterns (A,B) and root sampling (C,D). (A) pattern 1 (uniform ridge, distance between adjacent ridges was 65 cm, ridge direction was east to west); (B) pattern 2 (wide–narrow rows, distance of adjacent wide rows was 90 cm and that of double narrow rows was 40 cm, ridge direction was north to south). (C) sampling profile with roots at a soil depth from 0 to 100 cm under pattern 1; (D) sampling column with roots at a soil depth from 0 to 100 cm under pattern 2.
Agriculture 11 00517 g002
Figure 3. Number and diameter of nodal roots under pattern 1 (uniform ridge, distance between adjacent rows was 65 cm, ridge orientation was east to west) and pattern 2 (wide–narrow rows, distance of adjacent wide rows was 90 cm and that of double narrow rows was 40 cm, ridge orientation was north to south) in 2016 and 2017. The vertical bars denote the mean ± the standard error of the mean (n = 3). * represents significant differences between pattern 1 and pattern 2 (p < 0.05).
Agriculture 11 00517 g003
Figure 4. Inter-row RLD (root length density). Center in the sub-figure denotes the 0–20 cm horizontal distance from the plant intra-row direction in pattern 1 (uniform ridge, distance between adjacent ridges was 65 cm, ridge orientation was east to west) and pattern 2 (wide–narrow rows, distance of adjacent wide rows was 90 cm and that of double narrow rows was 40 cm, ridge orientation was north to south). Side in the sub-figure denotes the two horizontal distances 20–32.5 cm from the plant intra-row direction in pattern 1 and the horizontal distance 20–45 cm from the plant intra-row direction of the wide row in pattern 2. The vertical bars denote the mean ± the standard error of the mean (n = 3). * represents significant differences between patterns 1 and patterns 2 (p < 0.05).
Agriculture 11 00517 g004
Figure 5. Root bleeding sap intensity during V12, VT, and 3 weeks after VT under pattern 1 (uniform ridge, distance between adjacent ridges was 65 cm, ridge orientation was east to west) and pattern 2 (wide–narrow rows, distance between adjacent wide rows was 90 cm and that between double narrow rows was 40 cm, ridge orientation was north to south). The vertical bars denote the mean ± the standard error of the mean (n = 3). * represents significant differences between pattern 1 and pattern 2 (p < 0.05).
Agriculture 11 00517 g005
Figure 6. Nitrate nitrogen, ammonium nitrogen, potassium, and free amino acid concentrations in the root bleeding sap at VT under pattern 1 (uniform ridge, distance between adjacent ridges was 65 cm, ridge orientation was east to west) and pattern 2 (wide‒narrow rows, distance of adjacent wide rows was 90 cm and that of double narrow rows was 40 cm, ridge orientation was north to south). The vertical bars denote the mean ± the standard error of the mean (n = 3). * represents significant differences between pattern 1 and pattern 2 (p < 0.05).
Agriculture 11 00517 g006
Figure 7. Effect of planting pattern on the grain yield, RL rate, and Rfm. Pattern 1 (uniform ridge, distance between adjacent ridges was 65 cm, ridge orientation was east to west) and pattern 2 (wide-narrow rows, distance between adjacent wide rows was 90 cm and that between double narrow rows was 40 cm, ridge orientation was north to south). * represents significant differences between pattern 1 and pattern 2 in each year (p < 0.05).
Agriculture 11 00517 g007
Figure 8. Relationships between the weighted average root diameter and root bleeding sap intensity, the root bleeding sap intensity and grain yield, and the RLD (root length density) of the horizontal distance 0–20 cm from the plant intra-row direction in the 0–20 cm soil layer and the root lodging rate under pattern 1 (uniform ridge, distance between adjacent ridges was 65 cm, ridge orientation was east to west) and pattern 2 (wide–narrow rows, distance of adjacent wide rows was 90 cm and that of double narrow rows was 40 cm, ridge orientation was north to south).
Agriculture 11 00517 g008
Publisher’s Note: MDPI stays neutral with regard to jurisdictional claims in published maps and institutional affiliations.

