Article

Evaluation of the Nutrients Uptake by Tomato Plants in Different Phenological Stages Using an Electrical Conductivity Technique

1
Department of Sciences, “Ion Ionescu de la Brad” University of Agricultural Sciences and Veterinary Medicine, 700440 Iasi, Romania
2
Integrated Center of Environmental Science Studies in the North Eastern Region (CERNESIM), The “Alexandru Ioan Cuza” University of Iasi, 700506 Iasi, Romania
3
Department of Horticultural Technologies, “Ion Ionescu de la Brad” University of Agricultural Sciences and Veterinary Medicine, 700440 Iasi, Romania
*
Author to whom correspondence should be addressed.
Agriculture 2021, 11(4), 292; https://doi.org/10.3390/agriculture11040292
Submission received: 30 January 2021 / Revised: 24 March 2021 / Accepted: 24 March 2021 / Published: 29 March 2021

Abstract

:
Nutrient consumption by plants depends on the growth stage and environmental conditions. In general, plants take up species of elements at different speeds. We monitored and recorded the electrical charge flow through xylem sap of tomato plants (Brillante F1) using femto/picoammeter equipment (Keysight B2981A). This technique evaluates the nutrient uptake of tomato treated with the most common macronutrients (KNO3; KH2PO4; Ca(NO3)2; KCl) by monitoring the electrical conductivity for 24 h. The electrical conductivity of each treatment correlated with the plant growth and development stages. The results showed that the tomato plants had a high consumption of nutrients in the vegetative stage, while in other stages, they had a specific consumption, like phosphorus for bulb formation, potassium for increasing the number of flowers and water for the ripening of fruits. The quantitative evaluation of the ions absorbed by the plant was based on the magnitude and shape of the electrical conductivity curves. Our technique is an efficient method to determine nutrient consumption and is useful in predicting the deficiency of a certain element in tomato plants.

1. Introduction

The growth and development of plants depend on the continuous uptake of essential nutrients found in soil in the form of different mineral compounds, which are used for the synthesis of biomolecules [1]. Among the most important elements for higher plants are nitrogen (N), potassium (K), phosphorus (P), calcium (Ca), magnesium (Mg) and sulfur (S) [2]. The procuring of nutrients from soil is ensured by specialized transporters and channels situated in roots that are influenced by the environmental factors, the metabolism, the availability of nutrients [3] and water in the soil [4]. If one of the abovementioned nutrients is in a low concentration or missing, then the regulatory system will adjust the growth of the plant by triggering specific electrical signals [5]. These complex signals are responsible for both metabolic adjustments and root tissue morphological changes. Although the signal transduction networks for the deprivation of each nutrient are not completely understood, the involvement of signaling molecules and ion sensors [6], microRNAs [7], mobile polypeptides [8] and phytohormones acting as local and long-distance signals to control the responses of the entire plant was demonstrated [9].
Plant root morphology is mainly influenced by the availability of N and P in soil [10]. Thus, while a relatively high concentration of nitrate increased the density of root hairs [11], P deficiency leads to root hair development [12], with a decrease in primary root growth and an increase in lateral ones [13]. The opposite effect of the deficiency of the two nutrients on the root architecture implies two different signaling pathways, possibly related to different types of electrical signals propagating in a different way or generated in other epithelial cell types. Moreover, the existing information generally refers to the fact that during the growth and development cycle, plants need specific concentrations of elements. Additionally, the uptake of nutrients during various growth stages is different [14]. However, there is some consensus on the influence of different nutrients on tomato phenological stages. For instance, in the sprout stage, the seed contains all the nutrients necessary for germination. Starting with the seedling stage, plants absorb nutrients for further growth. During vegetative growth, the nutrient uptake is higher than that when plants approach maturity [15]. For tomatoes, a few studies have shown that in the vegetative period, plants require mostly N, followed by K, P, Ca, Mg and S [16,17,18,19]. In this stage, N is important for chlorophyll formation, which is responsible for root, stalk and leaf development. N promotes the growth of plant height, leaf area and the number of flowers. At maturity, excess nitrogen has inhibitory effects, such as decreasing fruit size or delaying ripening. P stimulates the growth and development of tomato plants, but is also used for flowering because it is responsible, in particular, for flower initiation and fruit ripening [17]. K is equally important for the aboveground and underground plant organs, enhancing their growth, Ca stimulates plant growth in height and the number of formed leaves, Mg (like P) accelerates the growth of plants and S is important for ensuring plant vigor [15,18]. At the end of the vegetative period, the need for K increases, being the nutrient with the highest demand, followed by N, P, Ca and Mg. For flowering, tomato plants need large amounts of P (responsible for the number of flowers and buds formed) and K (promotes flower initiation), while during fruiting, K (stimulates flowers to mature and to form fruits) is the most required element [17,18]. At the full maturity of fruits in the ripening stage when all nutrients are absorbed, there is a hydration period in which the plant consumes water.
For plants, it is important that the electrical long-range signals carrying information about external stimuli are transmitted to distant tissues and impact their activities accordingly. The velocity of these electrical signals is millimeters per second, being generated by various ion species traversing the plant and inducing systemic responses [20]. Any change in the surrounding environment or in plant requirements is reflected in the electrical signal characteristics. For instance, electrical signals can be used to investigate the photosynthetic processes [21,22], and the effects of environmental factors, including different level of irrigation [23,24]. It was demonstrated that changes in the nutritional consumption were correlated with the physiological activity of plants [25]. This could further be the basis of a system in charge of automatic adjustments in a greenhouse environment to ensure the appropriate growth of plants, depending on the nutrient consumption in each phenological stage.
Electrical conductivity is an increasingly widely used method for determination of the salt and electrolyte concentrations in solution [26,27,28] and soil [29]. A recent study shows that there is a direct relationship between the electrical signals and the physiological processes, implicitly with circadian rhythm [25]. In the present study, we used this hypothesis of observing the modifications in the electrical signals (ESs) due to the physiological activity of the circadian rhythm in order to evaluate each type of nutritional consumption in the growth and development stages of tomato planta. As such, we propose a new approach based on the electrical current measured through the xylem of tomatoes. The approach is an indirect method to evaluate the electrical conductivity (EC) through steam. Since the magnitude of the plant electric signal is very low, femto/picoammeter equipment able to record very small electric currents was used. The electrical conductivities of the different types of nutrients are correlated with the phenological stages.

2. Materials and Methods

2.1. Plant Materials and Experimental Design

The experiment, for the quantitative determination of electrical charge flow of nutrition solution through the stems, was performed on tomato plants grown under controlled conditions. In this study, we used tomato plants due the high hydraulic conductivity. The tomato cultivar investigated in this experiment was the “Brillante F1” from Hazera Genetics (Brurim, Israel); type known for its resistance to various pathogenic agents (Verticillium sp., Fusarium sp. or Tomato mosaic virus) and for providing high yields. The study was carried out in a greenhouse of the “V. Adamachi” Research Farm of the University of Agricultural Sciences and Veterinary Medicine of Iasi, Romania, from February to July for two years.
Seeds of tomato were germinated in plastic seedling trays, at 22 °C, 10 h—10,000 Lux, 75% relative humidity (Rh), in a growth chamber. The substrate used for sowing was Kekilla peat with the following characteristics: 0–6 mm size; 5.5–5.8 pH; NPK complex 14–16–18+ microelements; wetting agent; EC = 2.5 dS·m−1. At the occurrence of their first leaf, the seedlings were transferred into 540 cm³ plastic pots filled with the same substrate. When plants were 21 days old, the pots were moved into the greenhouse, under the following conditions: 20–23 °C/16–18 °C day/night temperature; 14 h/10 h light/dark length; 76% mean Rh. At 42 days old, the tomato plants were transferred into 12 L plastic pots containing the same substrate and 4 different treatments with macroelements were applied.
The treatments consisted in a single macroelement application (KNO3, Ca(NO3)2, KH2PO4 or KCl). The final concentration of the treatments was 1 g/plant/day. The treatments were applied daily at 10 a.m., for 21 days, in an amount of 30 mL. Five minutes later, an amount of 500 mL to 1 L of water was applied to each plant. Weekly, a foliar treatment of microelements (Na2MoO4, Na2[B4O5(OH)4]·8H2O, Cu, Mn, Zn, Fe) with a final concentration of 0.02 g/plant was applied.
The control was treated only with water. During the experiment, growing practices (training, pruning and treatments for pests and diseases) were applied to all the plants [30]. The experiment was organized in a split-plot design with four replicates per treatment.

2.2. The Measurements of Nutrient Electrical Signals through Tomato

In plants, the bioelectric signals are difficult to measure due to their low magnitudes that can be difficult to separate from the noise. Furthermore, it is very hard to measure the flow of nutrients in the stems of live plants. In this paper, we propose a new method for measuring the electrical signal generated by the electrical charges through the stems of plants. The determination of the intensity of the electrical current generated by the free electrical charge flow, which migrates under the electrical field generated by the electrical potential of direct current (DC), is based on Ohm’s law.
The electrical circuit of this method consisted of two stainless steel electrodes, a 9 V DC source, a Keysight B2981A femto/picoammeter (fA) (Santa Rosa, CA, USA) and a computer (Figure 1). The electrical signals were monitored and recorded by the femto/picoammeter, which is able to measure currents in the range of 0.01 fA–20 mA. We preferred to use this type of device in order to avoid the major problems generated in an electronic circuit used to amplify electrical signals. The computer had the role of setting up the recording parameters and collecting the data.
The hardest challenges in measuring low-intensity currents are the internal and external noises that occur in electrical circuits. In our electrical set up, we limited the noises by connecting the circuits at the standard grounding socket of the power supply system. This connection had the role of filtering the parasitic currents from the measurements.
The electric current recorded in the plant was collected by using two electrodes inserted into the stem of the tomato and which crossed the xylem of the stem. The negative electrode (E−) was inserted 1 cm below the most bottom node of the tomato and the positive electrode (E+) 60 cm above, in the internode area. In the experiment, stainless steel electrodes with a diameter of 0.5 mm were used due to their biocompatibility properties with living cells and tissue. In addition, these electrodes are electrochemically stable, which circumvents the transfer of ions from the electrode to the plant, as happens in copper, zinc or microelectrodes with Ag-Cl buffer electrodes.
The experimental set up described in Figure 1 was used to monitor and record the electric signals from plants. The experiment involved an indirect method to determine the electrical conductivity (EC) through the plant’s stem.

2.3. Determination of Electrical Conductivity through Plants

The electrical conductivity is determined based on the measured electrical signal, using Ohm’s law:
E = I × R ,
where E is the electric potential, I is the intensity of the electric current through the plant’s stem and R is the resistance of the tomato stem between the two electrodes. The electrical conductivity (λ) for each type of nutrient can be determined based on Equation (2):
λ = I E × l A
and depends on the geometrical parameters of the tomato stem; the length between electrodes (l) and the cross-section area of the stem (A). The proposed method is effective for the evaluation of EC without causing major injuries to the plant.

2.4. Monitoring and Recording the Electrical Signals

The electrical signals were measured during an intermediate period of time. To assess the uptake of nutrients by plants, electrical signals were monitored for 24 h for the most common macronutrients used as fertilizers in horticulture. For each type of treatment, the recording of the electrical signals started at 9.30 a.m. every day. The data sets were taken for all the treatment variants applied, in order to be able to correlate the shapes and magnitudes of the signals with each growth and development stage. The nutrient monitoring using this indirect method of determining EC is only suitable for adult plants, starting with the vegetation stage, because young plants are affected by electrode-induced wounds. Additionally, the method cannot be used for very long periods of time because the plant begins to form a callus around the electrode, which leads to changes in the electrical signals. The 24 h electrical signals are sufficient, because they provide useful information on the physiological changes given by the circadian rhythm [25], maintain signal quality and avoid the injury to the plant.
This study was focused on the influence of mineral nutrition on EC characteristics in different phenological stages of tomato plants: vegetative growth stage (vegetative, 305–309), budding stage (budding, 501–5XY), flowering stage (flowering, 601–6XY) and ripening stage (ripening, 801–809) [31,32].

2.5. Statistical Analysis

The EC data obtained for all treatments were analyzed using the Pearson’s correlation coefficient (r). In our statistical analysis, for the same phenological stage, each treatment recorded for 24 h was considered as a variable. The data were grouped in pairs of two variables and compared with each other to evaluate if there was any correlation between the shapes of the EC curves. r was calculated as the rate between covariance and the product of standard deviations of the two variables (“treatment1, treatment2”) analyzed. The correlation coefficient has either a positive association if the two variables react in the same way or a negative one when there is an opposite relation between the two variables. When r ∈ [0.5; 0.6] it is considered that the two variables are moderately correlated, highly correlated if r is in the range of [0.7; 0.9], very highly correlated for r > 0.9 and perfectly associated for r = 1 [33].
To evaluate the difference between the treatments, one-way ANOVA and Tukey’s post hoc test were carried out. One-way ANOVA was used to see the influence of the treatments on the EC parameter. The significant differences between treatments were established by using Tukey’s post hoc test with a degree of confidence of 95% (p < 0.05).

3. Results and Discussion

In plants, the mineral uptake can differ depending on the ion species. For instance, phosphate, nitrate, potassium or manganese ions are more easily taken up than magnesium, calcium or sulfate ions, which are known to be taken up more slowly [18]. However, at a given developmental stage, the delay disappears due to the ion equilibration. This delay between the absorption of primary and secondary macronutrients is the key to our method, because it allows for monitoring the elements in steps.
The measurement of cation and anion concentrations in xylem sap can be evaluated by EC investigation. The values and shapes of 24 h ECs achieved by using the measurements of the electrical signals through tomato stems give useful information on nutrient consumption. The EC is a good method to evaluate the nutrient content in solution or soil, but to measure it in living tissues or plants is a much more complex and difficult process than in solution or in vitro [34]. The results obtained for the main macronutrients from the fertilizers used in horticulture, correlated with phenological stages, open the way to a new research direction.
In electrolytic cells, the DC current flow is given by the diffusion of the electrical charges. In biological systems, the electrical charges are given by anions (−) migrating to the cathode and cations (+) in the opposite direction. The electrical charge flow depends on the electrical potential applied to the two electrodes, the concentration gradient, the distance between electrodes and the properties of electrodes [35].
The nutrients dissolved in water must be well balanced, otherwise high salinity affects the plants’ growth. Apparently, the electrical resistance of the plant is influenced only by the temperature, not by the xylem sap flow. Temperature is responsible for changing the pH and the EC. To diminish these variations, the study was performed on plants grown under controlled conditions.

3.1. Electrical Signals of the Nutrients

The magnitudes and shapes of the electrical signals measured in stems by using an electrical circuit (Figure 1) depended on the nutrient consumption and the circadian rhythm of the plants [25]. In our experiment, the magnitudes of the electrical signals of ion flows in xylem increased during the day and decreased during the night. This fluctuation was evidently observed in vegetative stage, but only slightly in budding, flowering or ripening stages (Figure 2). After the insertion of the electrodes into the plant, the signals varied greatly due to the plants’ response to injuries (Figure 2 and Figure 3).

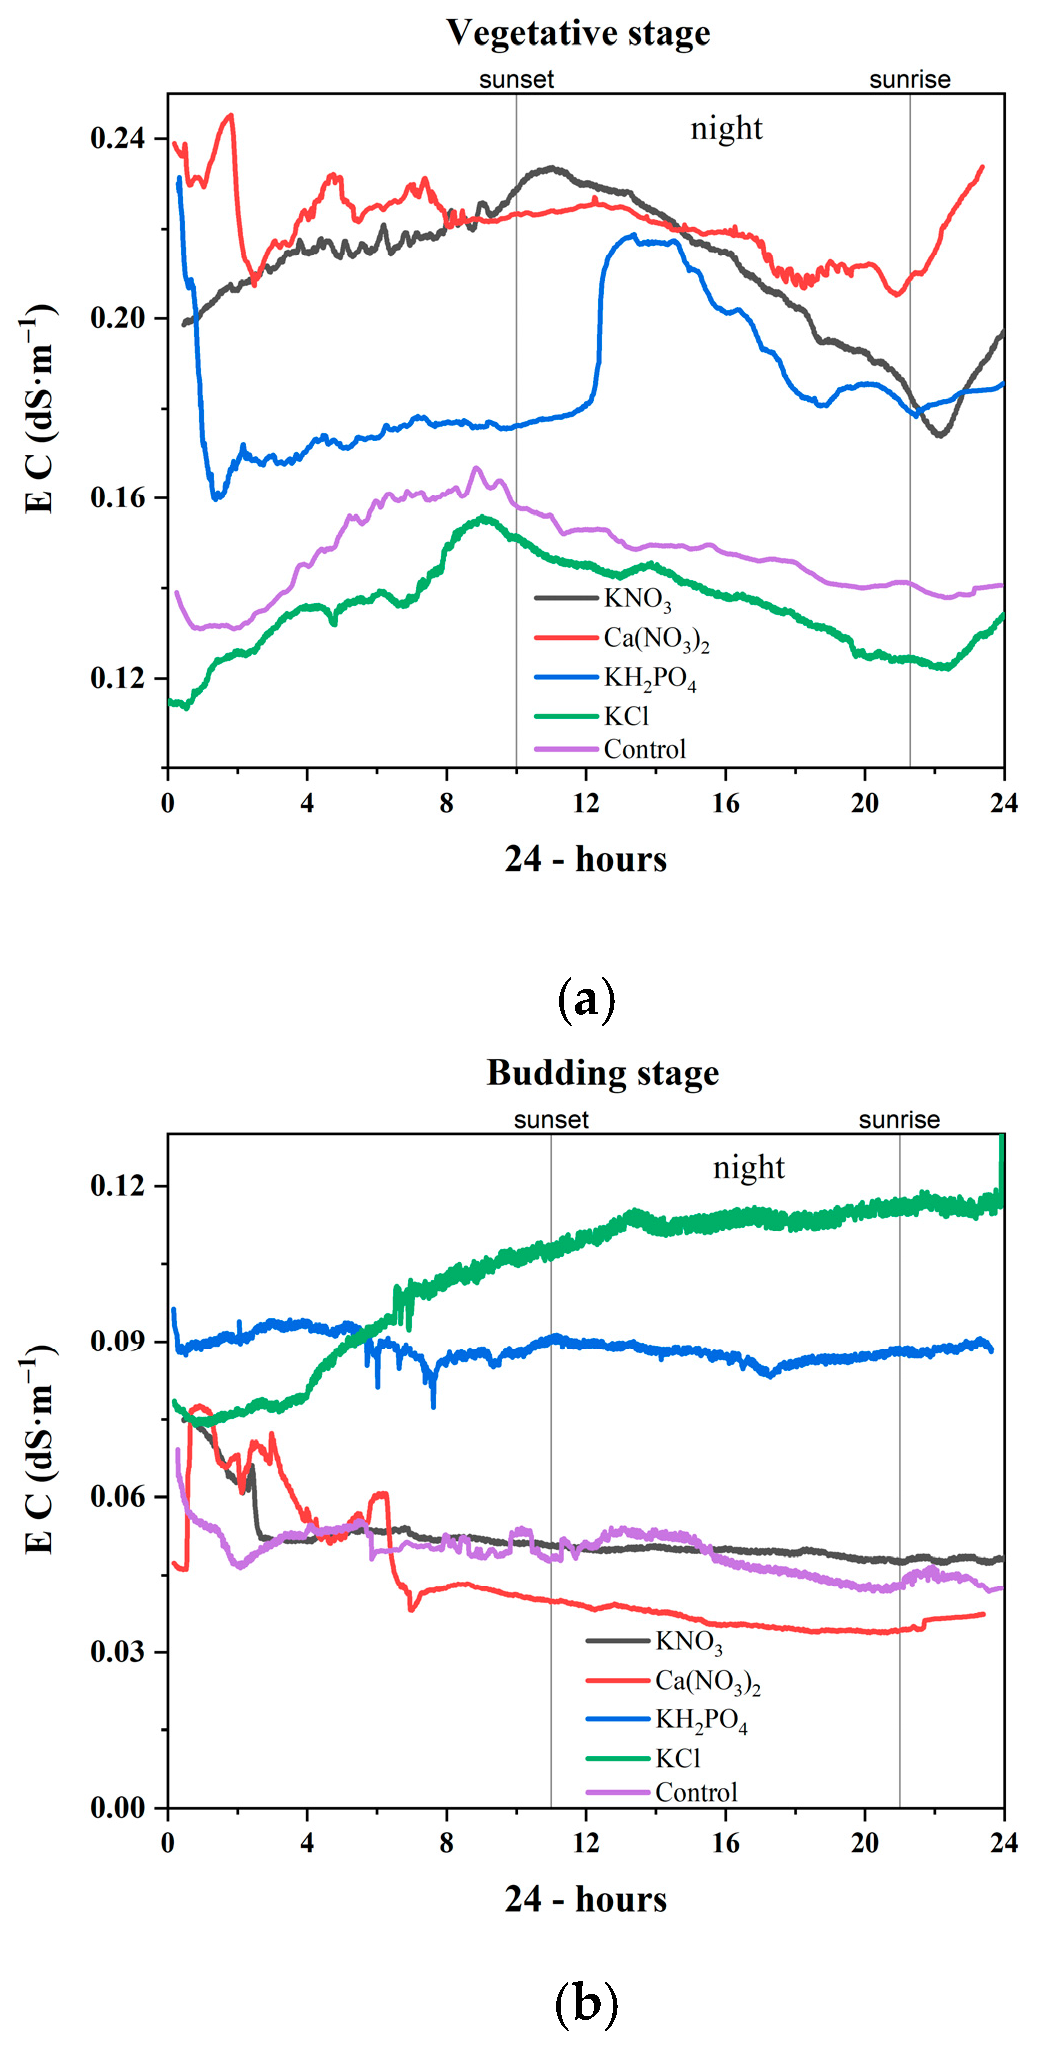
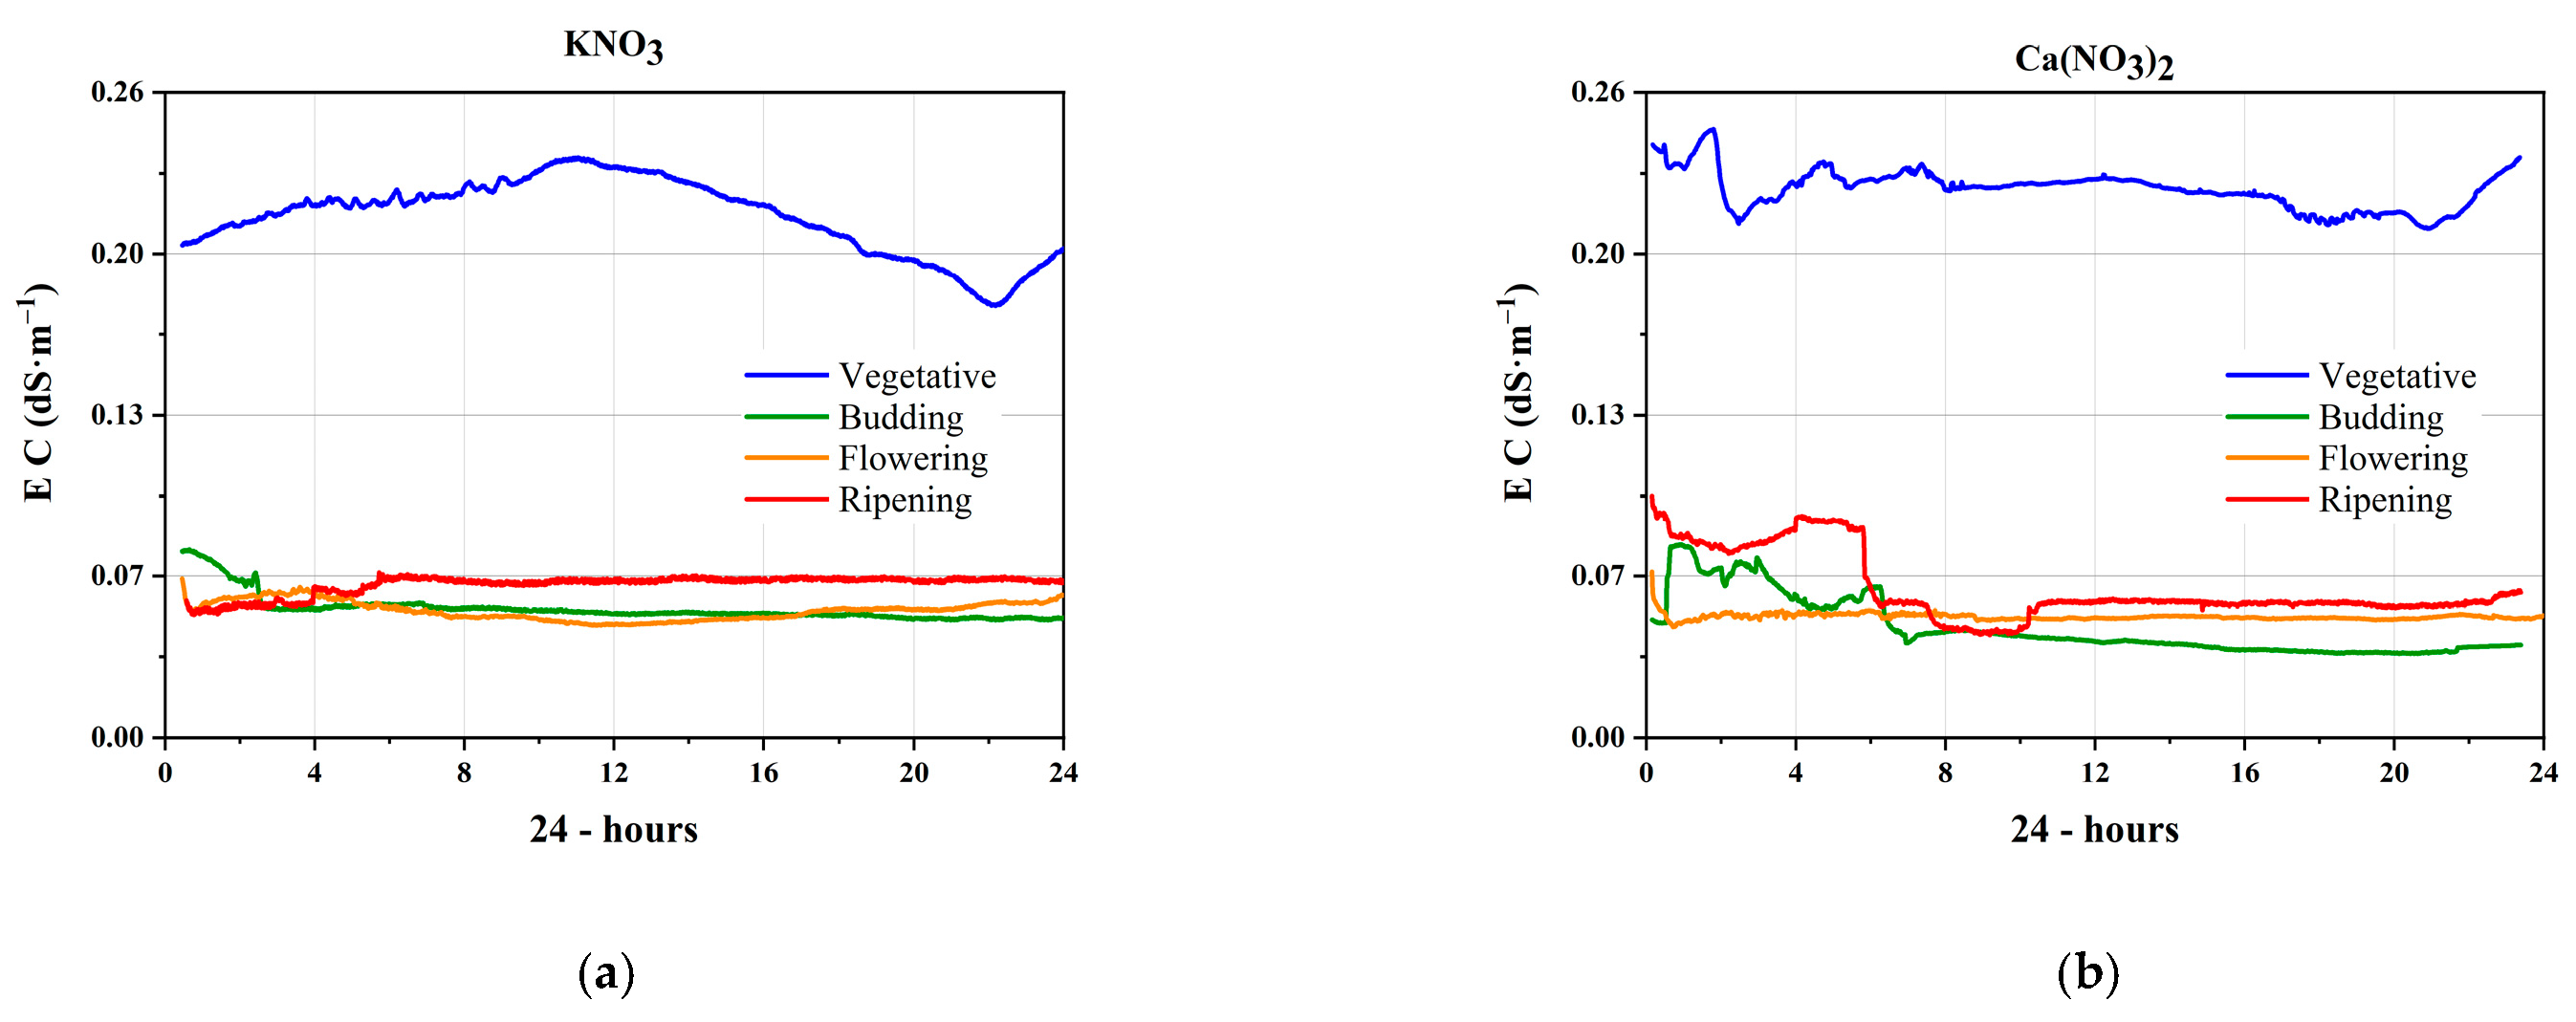
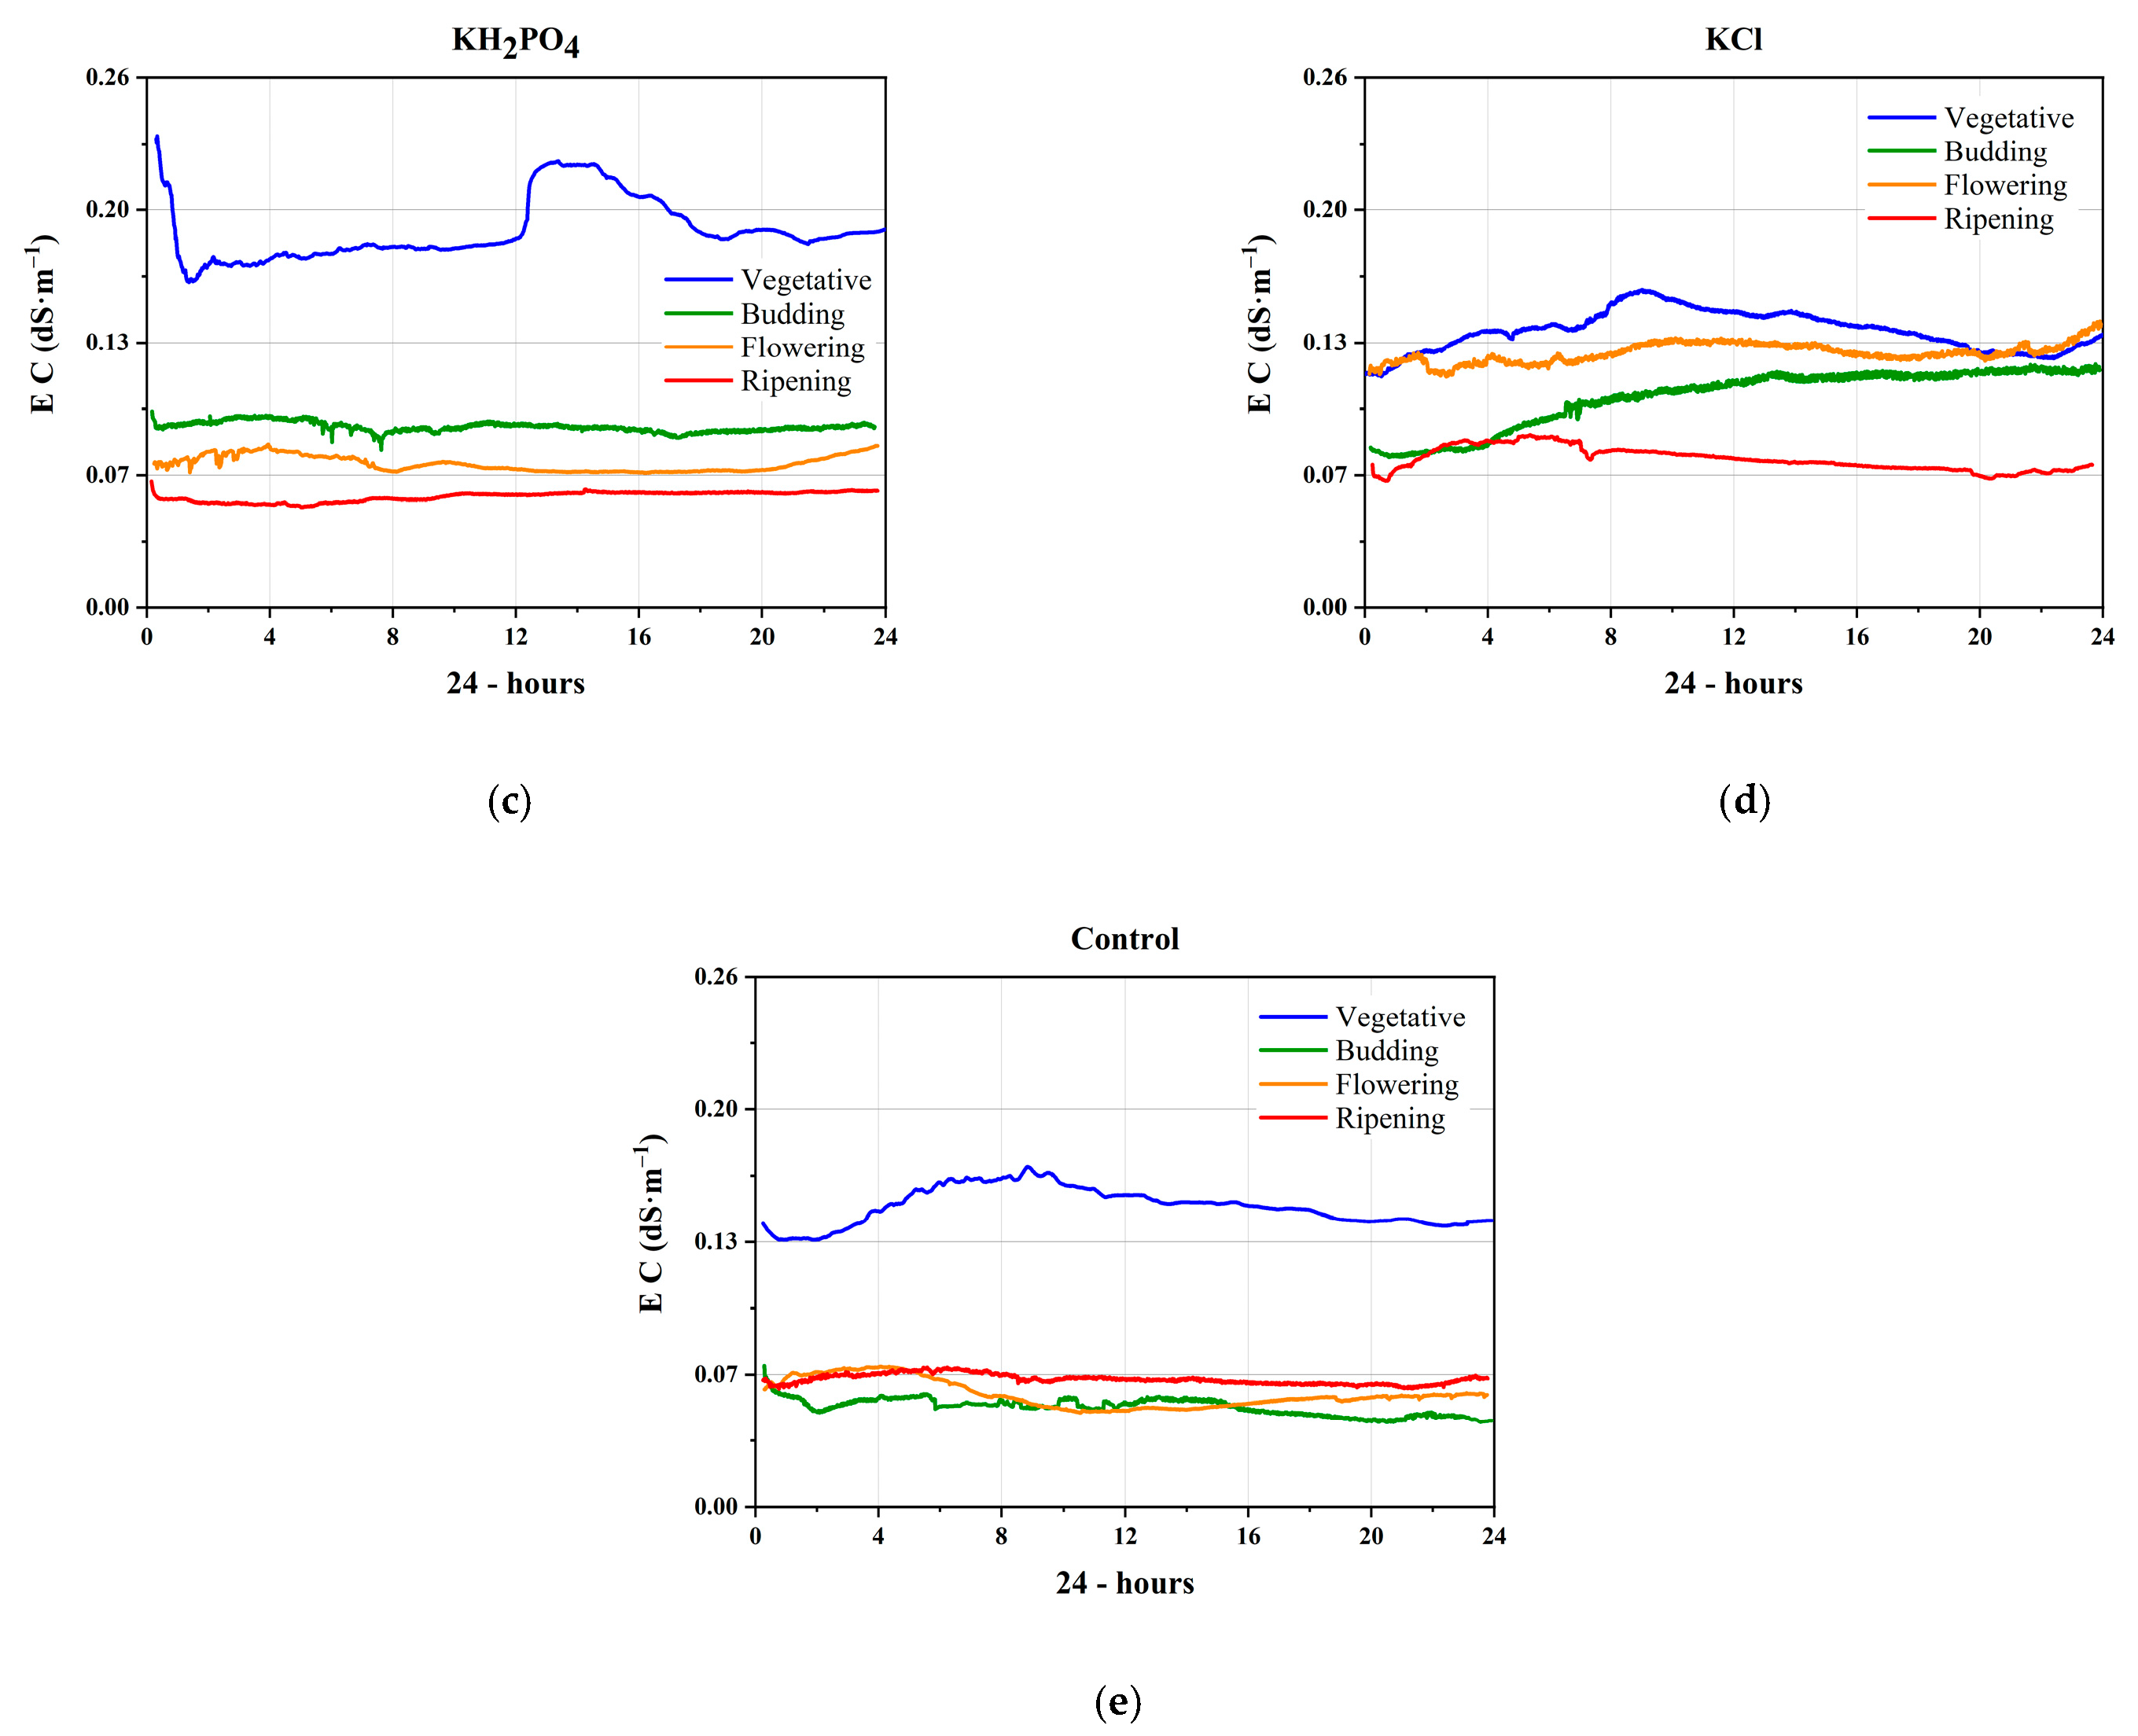
3.2. Electrical Conductivity in the Phenological Stages

The electrical signals measured in tomato depended on the nutritional consumption and phenological stage (Figure 3).

3.2.1. Vegetative Stage

The magnitudes and shapes of the electrical signals depended on the amounts of anions and cations in each macroelement solution. In the vegetative growth stage, the electrical conductivity recorded for all treatments had much higher values than in other phenological stages, due to the higher need of plants for nutrients during this growth stage (Figure 3). In our proposed method, only the EC had a physical significance.
The study focused on primary macronutrients (N, K, P) since these are essential for plant growth. Tomato plants in the vegetative growth stage need all the nutrients, but especially nitrogen for elongation and leaf formation. In inorganic fertilizers, the most widely used sources of N consist in potassium nitrate and calcium nitrate. Accordingly, we investigated the EC of these treatments in order to understand the specific features of each growth stage. The EC of potassium nitrate treatment had different values, which depended on the growth stage (Figure 3a). The daily average values of EC were: 0.211 dS·m−1 in the vegetative growth stage, 0.051 dS·m−1 in the budding stage, 0.051 dS·m−1 in the flowering stage and 0.061 dS·m−1 in the ripening stage. The daylight, night and day average values of EC for all treatments for vegetative, budding, flowering and ripening stages are presented in Table 1. The results of Tukey’s analysis showed that during the vegetative stage for daily average treatment (day), significant differences were registered between all the treatments applied and the control, and also between KNO3 or Ca(NO3)2, for which the highest values were recorded, and KH2PO4 or KCl (Table 1). Additionally, during this stage, a high correlation between the EC curves of potassium nitrate treatments and the control (r(KNO3 – Control) = 0.77) was obtained using the Pearson method. The data of this treatment presented a high correlation with the EC curve obtained for KCl treatment (r(KNO3 – KCl) = 0.84). The values of EC obtained for the above treatments increased during the day and reached a maximum at twilight. During the night, the signal decreased slowly till the sunrise (Figure 2). These aspects confirm the hypothesis that EC curves in plants depend on physiological processes.
Likewise, for calcium nitrate treatment, the magnitude of the EC in the vegetative growth stage was much higher than in the other phenological stages analyzed [18] (Figure 3b). The EC measured for all stages presented a strong variation during the day, being much higher than during the night. Calcium nitrate treatment provides calcium cations and nitrate anions to the tomato plants [2]. The results obtained by applying Equation (2) to the electrical signals (Figure 3b) were almost similar to those obtained for potassium nitrate treatments (0.22 dS·m−1—vegetative stage, 0.043 dS·m−1—budding stage, 0.049 dS·m−1—flowering stage and 0.058 dS·m−1—ripening stage).
The characteristics of the EC confirmed the hypothesis that in the vegetative stage, the plant consumes a larger amount of N. High nitrogen consumption was also confirmed by the EC of calcium nitrate. The EC in the vegetative stage was four times higher than in the ripening stage.
Calcium is important for tomatoes in all the phenological stages, because it is responsible for plant height and leaf count. A calcium concentration higher than 40 mg·L−1 in the nutrient solution provides an optimal calcium content to the plant. In tomato plants, lower concentrations cause calcium deficiency and induce a physiological disorder [18], called blossom end rot (Figure 4). Calcium deficiency can be caused by fine and coarse texture of the soil, high compactness of the soil, a high content of soluble salts and specific nutrients (N, Mg, K, Cu), high soil acidity in association with low relative humidity, high temperature, drought stress or large fluctuations in soil moisture.

3.2.2. Budding Stage

The EC curves recorded in the budding stage showed a high variation during the day and became smooth during the night. In this stage, the tomato plant needs phosphorus (P), which is extremely important at the beginning of the reproduction cycle when the bulbs are formed. For this experiment, we used a treatment with potassium dihydrogen phosphate (KH2PO4) as a source of phosphorus and potassium for tomatoes.
In the vegetative stage, the EC of potassium dihydrogen phosphate treatment was almost linear during daylight, but suffered a sudden rise when it got dark (Figure 3c). An interesting change occurred for the budding stage, with the EC increasing far beyond the subsequent phenological stages. This change was due to higher consumption of P, which is necessary to form the buds [18]. The electrical conductivity values for this treatment remained high during the vegetative stage (0.185 dS·m−1) and decreased in the budding stage (0.089 dS·m−1), flowering stage (0.07 dS·m−1) and ripening stage (0.055 dS·m−1) (Table 1). The EC of the potassium dihydrogen phosphate treatment was highly negatively correlated with the EC curve of calcium nitrate (r(KH2PO4 – Ca(NO3)2) = −0.79).
During the budding stage, it was interesting to observe that the EC values of the KCl curve recorded during the night were higher than those for the daylight (Figure 2b). Moreover, for this treatment, the EC values registered, regardless of the time of the day, were the highest compared with the rest of the treatments, with significant differences being registered (Table 1). These results suggest that beside phosphorus, potassium is also a very important element for tomato plants during the budding stage.

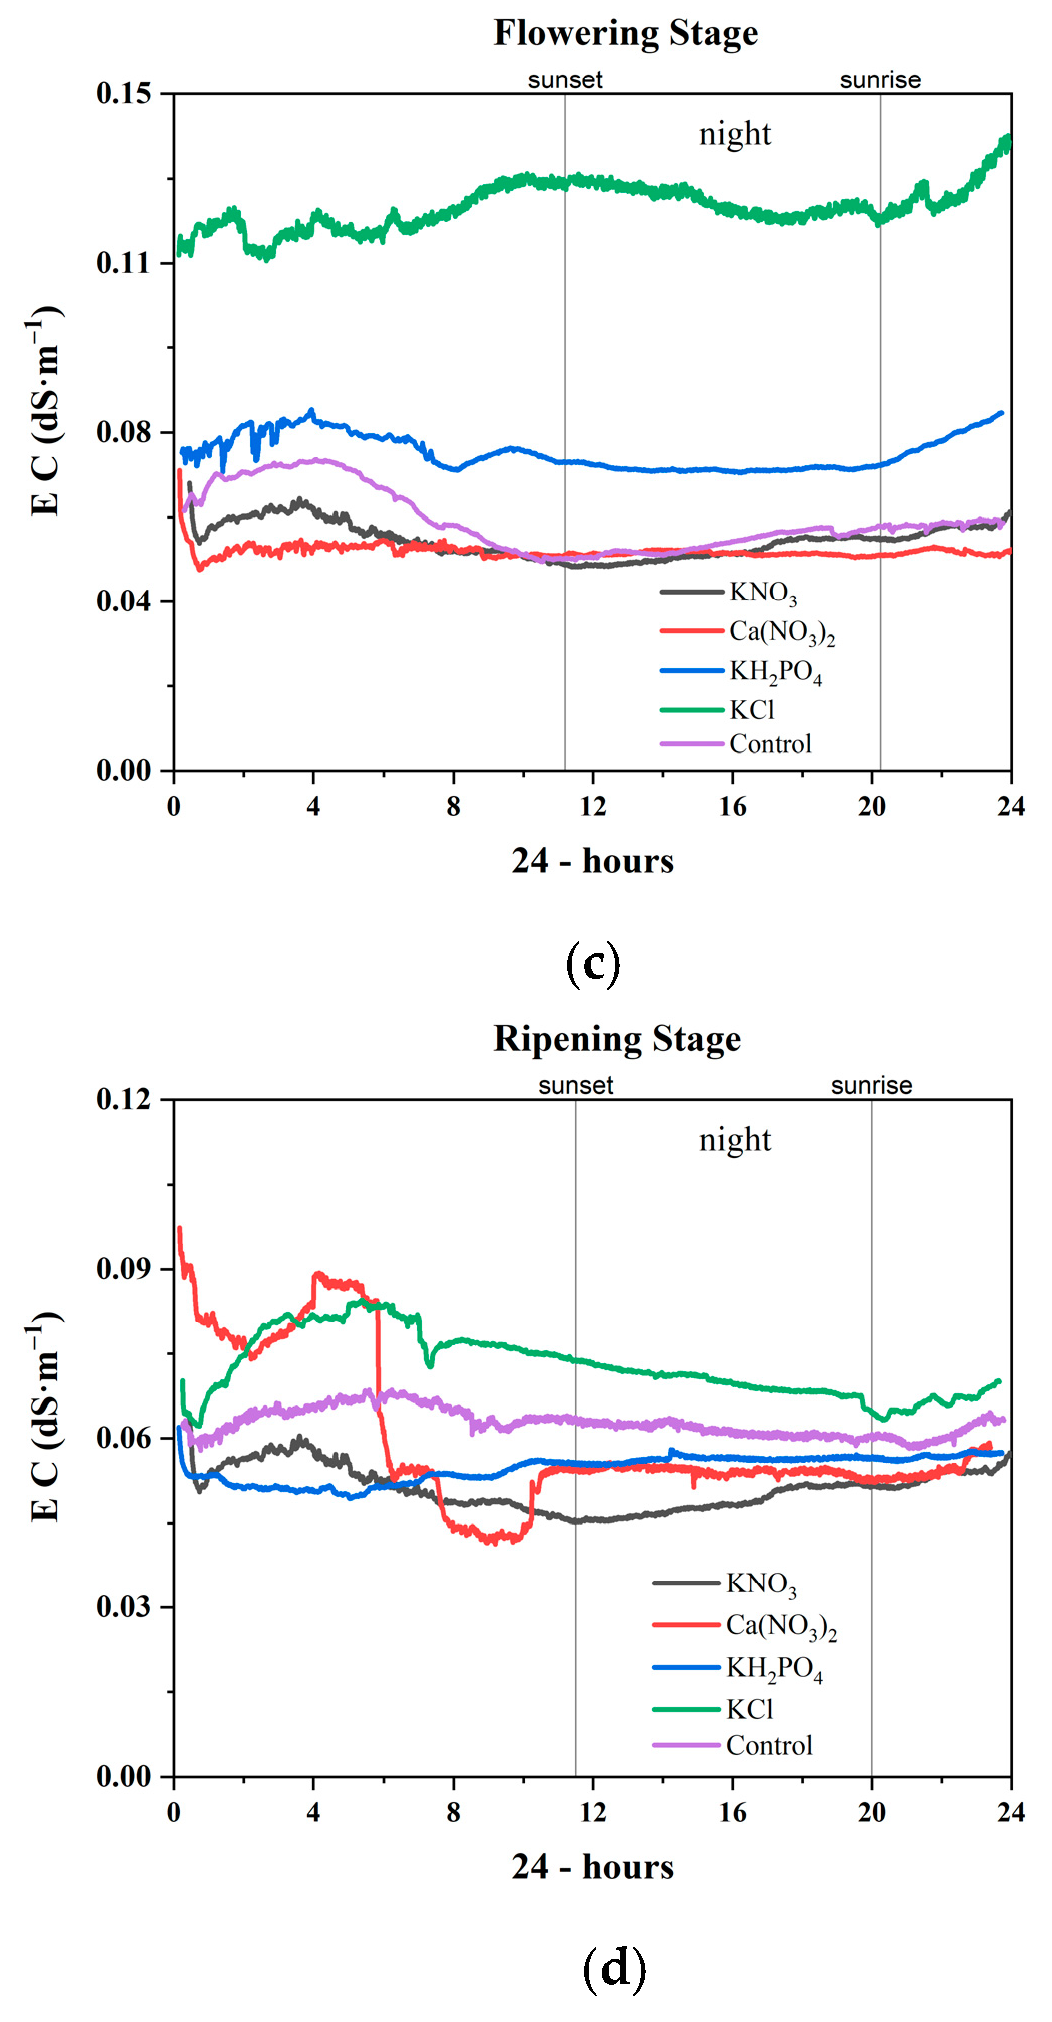
3.2.3. Flowering Stage

In the flowering stage, the values of electrical signals became higher for nutrients containing K, in this case obtained from the treatment with KCl. Increasing the level of K has a small effect on the number of flowers, but the proportion of flowers that reach maturity and the production of commercial-level fruits is 30% higher if K is at an optimal level. The optimal level of K in peat substrate is 120–200 mg·L−1 [18].
The EC for the potassium chloride nutrient (Figure 3c) increased greatly in the flowering stage (0.105 dS·m−1), even if the value was lower compared to the one from the vegetation stage (0.137 dS·m−1). Significant differences were registered between KCl and the rest of the treatments, including the control, regardless of the time of day (Table 1). In addition, it was noteworthy that the EC also increased in the budding stage, especially during the night (0.124 dS·m−1 average by daylight and 0.126 dS·m−1 at night). Additionally, in this growth stage, a high correlation between the EC curves of the samples treated with macroelements containing K (r(NO3 – KH2PO4) = 0.77, r(KNO3 – KCl) = −0.74 and r(KH2PO4 –KCl) = −0.82) was obtained.
There are many macroelements used as potassium precursors, but we only focused on KCl to eliminate other primary nutrients from this research. As can be seen in Figure 3c, the consumption of K+ was increased in all stages, but in the flowering stage, it was comparable to the vegetative value. In fact, for this treatment, the curves of EC were the closest among all the macroelements analyzed.

3.2.4. Ripening Stage

The shapes of the curves recorded during the budding–ripening stages showed that the values of EC reached a maximum during the daylight, as opposed to the vegetative stage, when the maximum was at twilight (Figure 2b–d). These aspects will be extensively presented in a separate paper.
In water, a negative charge is given by hydroxide (OH ions), while a positive charge is given by hydrogen ions (H+), but these cannot exist as free elements due to the hydration forms, the oxonium, also called hydroxonium. Even if there are free electric charges in the water, the EC of water is low, σ = 4·10−5 (dS·m−1) at 20 °C [34]. However, our results obtained for the EC of the control were much higher (Figure 3e), which contradict the hypothesis that in this stage, the nutrient consumption is very low. This aspect can be explained by the fact that in nature, many salts are dissolved in water, increasing the conductivity. It should be noted that our approach cannot assess the actual amounts of nutrients consumed by the plant, but only the types of nutrients transported by the xylem sap through the stem.
Using the technique proposed by us, the water consumption by the tomato plants in all phenological stages was evaluated by analyzing the EC of the control, which was just watered. Figure 3e shows that water consumption was very high during the vegetative stage (0.148 dS·m−1), followed by the stage of fruit ripening (0.063 dS·m−1). The plants treated only with water showed a higher value of the EC in the fruit ripening stage compared to the budding and flowering stages. During the ripening of fruits, the EC curves of all treatments showed moderately or even highly negative or positive correlations (r(NO3 – KH2PO4) = −0.61; r(KNO3 – KCl) = 0.55; r(KH2PO4 – KCl) = −0.51 and r(NO3 – Ca(NO3)2) = −0.75; r(KH2PO4 – Ca(NO3)2) = −0.51; r(Ca(NO3)2 – KCl) = −0.67), but they had weak correlations with the EC curves of the control. The highest EC value during the ripening stage was registered for KCl, for which significant differences were registered compared with the rest of the treatments, except the control.
The 24 h EC technique is effective for intermediate periods of time, because immediately after the insertion of the electrodes, plants generated a response to injury, which was manifested as a variation of the electrical signal [25]. In general, the variation was described by a decrease in values that took place from a few minutes to two hours (Figure 2 and Figure 3).
The obtained results, in the present study, are useful for monitoring and controlling the nutrients consumed by plants at an optimal level in each of the growth or development stages. The results are essential for the incorporation of this method in a smart nutrient monitoring system working in accordance with the physiological consumption of the plant and not based on the availability of the elements in the substrate, as it is currently done.

4. Conclusions

The 24 h electrical conductivity technique is a new method of investigation of plant nutrient consumption based on measuring the electrical signals generated by the flow of electrical charges dissolved in the sap of xylem. The characteristics of the electrical conductivity curves in each phenological stage are in accordance with the knowledge in the field of tomato plant physiology. The study on tomato (Brillante F1 cv.) presents conclusive results which validate this method.
The magnitudes and shapes of the electrical signals confirm the hypothesis that in the vegetative stage, the plant consumes large amounts of all nutrients. The electrical conductivity of tomato treated with nitrogen-containing macronutrients (KNO3 and Ca(NO3)2) showed high values of nitrogen consumption during the vegetative stage. In this stage, the EC of all treatments present the highest values because the plants need nutrients and water for growth.
In the budding stage, the electrical conductivity values of the variant treated with potassium dihydrogen phosphate (KH2PO4) increased due to the increasing need for phosphorus. Additionally, for the potassium chloride (KCl) treatment, the electrical conductivity increased in the flowering stage, when the consumption of K for flowering and fruiting is higher.
The proposed technique is useful because it is able to provide information about the nutrient consumption and plant needs at a specific stage of development, which can be further used as input data for a smart dosing system. This system can be implemented as a future innovative concept for monitoring and controlling the growth of plants in soil and soilless cultures.

Author Contributions

Conceptualization, I.B.; methodology, I.B., G.-C.T.; G.M. and V.S.; validation, I.B., V.S. and A.C.; investigation, I.B., G.M., V.A. and G.-C.T.; resources, V.S.; data curation, I.B. and V.A.; writing—original draft preparation, I.B., G.M. and A.C.; writing—review and editing, I.B., V.S., G.M., G.-C.T. and A.C.; supervision, V.S., G.-C.T. and A.C.; funding acquisition, V.S. All authors have read and agreed to the published version of the manuscript.

Funding

This research was supported by the project PN-III-P1-1.2-PCCDI-2017-0560 (no. 41/2018) financed by UEFISCDI from Romania.

Institutional Review Board Statement

Not applicable.

Informed Consent Statement

Not applicable.

Conflicts of Interest

The authors declare no conflict of interest.

References

  1. Maathuis, F.J. Physiological functions of mineral macronutrients. Curr. Opin. Plant Biol. 2009, 12, 250–258. [Google Scholar] [CrossRef] [PubMed]
  2. Kirkby, E. Chapter 1—Introduction, Definition and Classification of Nutrients. In Marschner’s Mineral Nutrition of Higher Plants, 3rd ed.; Marschner, P., Ed.; Academic Press: San Diego, CA, USA, 2012; pp. 3–5. ISBN 978-0-12-384905-2. [Google Scholar]
  3. Giehl, R.F.; Von Wirén, N. Root Nutrient Foraging. Plant Physiol. 2014, 166, 509–517. [Google Scholar] [CrossRef] [PubMed] [Green Version]
  4. Bodale, I.; Stancu, A. Reversible and Irreversible Processes in Drying and Wetting of Soil. Materials 2019, 13, 135. [Google Scholar] [CrossRef] [PubMed] [Green Version]
  5. Schachtman, D.P.; Shin, R. Nutrient Sensing and Signaling: NPKS. Annu. Rev. Plant Biol. 2007, 58, 47–69. [Google Scholar] [CrossRef]
  6. Ho, C.-H.; Lin, S.-H.; Hu, H.-C.; Tsay, Y.-F. CHL1 Functions as a Nitrate Sensor in Plants. Cell 2009, 138, 1184–1194. [Google Scholar] [CrossRef] [PubMed] [Green Version]
  7. Vidal, E.A.; Araus, V.; Lu, C.; Parry, G.; Green, P.J.; Coruzzi, G.M.; Gutiérrez, R.A. Nitrate-responsive miR393/AFB3 regulatory module controls root system architecture in Arabidopsis thaliana. Proc. Natl. Acad. Sci. USA 2010, 107, 4477–4482. [Google Scholar] [CrossRef] [Green Version]
  8. Ohkubo, Y.; Tanaka, M.; Tabata, R.; Ogawa-Ohnishi, M.; Matsubayashi, Y. Shoot-to-root mobile polypeptides involved in systemic regulation of nitrogen acquisition. Nat. Plants 2017, 3, 17029. [Google Scholar] [CrossRef]
  9. Kiba, T.; Kudo, T.; Kojima, M.; Sakakibara, H. Hormonal control of nitrogen acquisition: Roles of auxin, abscisic acid, and cytokinin. J. Exp. Bot. 2010, 62, 1399–1409. [Google Scholar] [CrossRef]
  10. Gruber, B.D.; Giehl, R.F.; Friedel, S.; Von Wirén, N. Plasticity of the Arabidopsis Root System under Nutrient Deficiencies. Plant Physiol. 2013, 163, 161–179. [Google Scholar] [CrossRef] [Green Version]
  11. Canales, J.; Contreras-López, O.; Álvarez, J.M.; Gutiérrez, R.A. Nitrate induction of root hair density is mediated by TGA1/TGA4 and CPC transcription factors in Arabidopsis thaliana. Plant J. 2017, 92, 305–316. [Google Scholar] [CrossRef] [Green Version]
  12. Péret, B.; Clément, M.; Nussaume, L.; Desnos, T. Root developmental adaptation to phosphate starvation: Better safe than sorry. Trends Plant Sci. 2011, 16, 442–450. [Google Scholar] [CrossRef]
  13. Shahzad, Z.; Amtmann, A. Food for thought: How nutrients regulate root system architecture. Curr. Opin. Plant Biol. 2017, 39, 80–87. [Google Scholar] [CrossRef]
  14. Ddamulira, G.; Idd, R.; Namazzi, S.; Kalali, F.; Mundingotto, J.; Maphosa, M. Nitrogen and Potassium Fertilizers Increase Cherry Tomato Height and Yield. J. Agric. Sci. 2019, 11, 48. [Google Scholar] [CrossRef]
  15. Benton, J.J. Plant Nutrition and Soil Fertility Manual; CRC Press: Boca Raton, FL, USA, 2012; ISBN 978-0-429-13081-6. [Google Scholar]
  16. Pineda-Pineda, J.; Ramírez-Arias, A.; Sánchez del Castillo, F.; Castillo-González, A.M.; Valdez-Aguilar, L.A.; Vargas-Canales, J.M. Extraction and Nutrient Efficiency during the Vegetative Growth of Tomato under Hydroponics Conditions. In Proceedings of the Acta Horticulturae, Leuven, Belgium, 30 April 2011; International Society for Horticultural Science (ISHS); pp. 997–1005. [Google Scholar]
  17. de Moraes, C.C.; Factor, T.L.; de Araújo, H.S.; Purquerio, L.F.V. Plant growth and nutrient accumulation in two tomato hybrids under tropical conditions. Aust. J. Crop Sci. 2018, 12, 1419–1425. [Google Scholar] [CrossRef]
  18. Adams, P. Mineral nutrition. In The Tomato Crop: A Scientific Basis for Improvement; Atherton, J., Rudich, J., Eds.; Springer: Dordrecht, The Netherlands, 1986; pp. 281–334. ISBN 978-0-412-25120-7. [Google Scholar]
  19. Petropoulos, S.A.; Fernandes, Â.; Xyrafis, E.; Polyzos, N.; Antoniadis, V.; Barros, L.; Ferreira, I.C. The Optimization of Nitrogen Fertilization Regulates Crop Performance and Quality of Processing Tomato (Solanum lycopersicum L. cv. Heinz 3402). Agronomy 2020, 10, 715. [Google Scholar] [CrossRef]
  20. Choi, W.-G.; Hilleary, R.; Swanson, S.J.; Kim, S.-H.; Gilroy, S. Rapid, Long-Distance Electrical and Calcium Signaling in Plants. Annu. Rev. Plant Biol. 2016, 67, 287–307. [Google Scholar] [CrossRef] [PubMed]
  21. Hlaváčková, V.; Krchňák, P.; Nauš, J.; Novák, O.; Špundová, M.; Strnad, M. Electrical and chemical signals involved in short-term systemic photosynthetic responses of tobacco plants to local burning. Planta 2006, 225, 235–244. [Google Scholar] [CrossRef] [PubMed]
  22. Gallé, A.; Lautner, S.; Flexas, J.; Fromm, J. Environmental stimuli and physiological responses: The current view on electrical signalling. Environ. Exp. Bot. 2015, 114, 15–21. [Google Scholar] [CrossRef]
  23. Grams, T.E.E.; Koziolek, C.; Lautner, S.; Matyssek, R.; Fromm, J. Distinct roles of electric and hydraulic signals on the reaction of leaf gas exchange upon re-irrigation in Zea mays L. Plant. Cell Environ. 2007, 30, 79–84. [Google Scholar] [CrossRef]
  24. Rios-Rojas, L.; Tapia, F.; Gurovich, L.A. Electrophysiological assessment of water stress in fruit-bearing woody plants. J. Plant Physiol. 2014, 171, 799–806. [Google Scholar] [CrossRef] [Green Version]
  25. Mihalache, G.; Peres, C.I.; Bodale, I.; Achitei, V.; Gheorghitoaie, M.V.; Teliban, G.C.; Cojocaru, A.; Butnariu, M.; Muraru, V.; Stoleru, V. Tomato Crop Performances under Chemical Nutrients Monitored by Electric Signal. Agronomy 2020, 10, 1915. [Google Scholar] [CrossRef]
  26. Lam, V.P.; Kim, S.J.; Park, J.S. Optimizing the Electrical Conductivity of a Nutrient Solution for Plant Growth and Bioactive Compounds of Agastache rugosa in a Plant Factory. Agronomy 2020, 10, 76. [Google Scholar] [CrossRef] [Green Version]
  27. Abou-Hadid, A.; Abd-Elmoniem, E.; El-Shinawy, M.; Abou-Elsoud, M. Electrical Conductivity Effect on Growth and Mineral Composition of Lettuce Plants in Hydroponic System. Acta Hortic. 1996, 59–66. [Google Scholar] [CrossRef]
  28. Ding, X.; Jiang, Y.; Zhao, H.; Guo, D.; He, L.; Liu, F.; Zhou, Q.; Nandwani, D.; Hui, D.; Yu, J. Electrical conductivity of nutrient solution influenced photosynthesis, quality, and antioxidant enzyme activity of pakchoi (Brassica campestris L. ssp. Chinensis) in a hydroponic system. PLoS ONE 2018, 13, e0202090. [Google Scholar] [CrossRef] [PubMed]
  29. Putranta, H.; Permatasari, A.K.; Sukma, T.A.; Dwandaru, W.S.B. The Effect of PH, Electrical Conductivity, and Nitrogen (N) in the Soil at Yogyakarta Special Region on Tomato Plant Growth. TEM J. 2019, 8, 860–865. [Google Scholar]
  30. Stoleru, V.; Munteanu, N.; Sellitto, V.M. New Approach of Organic Vegetable Systems; Aracne: Rome, Italy, 2014; ISBN 978-88-548-7847-1. [Google Scholar]
  31. Acostaquezada, P.G.; Riofrío-Cuenca, T.; Rojas, J.; Vilanova, S.; Plazas, M.; Prohens, J. Phenological growth stages of tree tomato (Solanum betaceum Cav.), an emerging fruit crop, according to the basic and extended BBCH scales. Sci. Hortic. 2016, 199, 216–223. [Google Scholar] [CrossRef]
  32. Meier, U. Growth Stages of Mono- and Dicotyledonous Plants: BBCH Monograph; Open Agrar Repositorium: Quedlinburg, Germany, 2018; ISBN 978-3-95547-071-5. [Google Scholar]
  33. Pearson’s Correlation Coefficient. Encyclopedia of Public Health; Kirch, W., Ed.; Springer: Dordrecht, The Netherlands, 2008; pp. 1090–1091. ISBN 978-1-4020-5614-7. [Google Scholar]
  34. Stiles, W.; Jörgensen, I. The Measurement of Electrical Conductivity as a Method of Investigation in Plant Physiology. New Phytol. 1914, 13, 226–242. [Google Scholar] [CrossRef]
  35. Grimnes, S.; Martinsen, Ø.G. Chapter 2—Electrolytics. In Bioimpedance and Bioelectricity Basics, 3rd ed.; Grimnes, S., Martinsen, Ø.G., Eds.; Academic Press: Oxford, UK, 2015; pp. 9–36. ISBN 978-0-12-411470-8. [Google Scholar]
Figure 1. The electrical design used for monitoring and recording the electrical signal generated by the electrical charge flow through xylem sap of tomato. The electrical circuit included 9 V DC source, femto/picoammeter (fA), monitoring and controlling system (computer), standard grounding socket of the power supply system (GND) and two stainless steel electrodes: negative electrode (E) and positive electrode (E+).
Agriculture 11 00292 g001
Figure 2. The electrical conductivities of different macronutrient treatments measured in vegetative (a), budding (b), flowering (c) and ripening stages (d). The 24 h electrical conductivities (ECs) were recorded from the first day, at 9.30 a.m. till the next day at 9.30 a.m. The vertical lines mark the sunset and sunrise.
Agriculture 11 00292 g002aAgriculture 11 00292 g002b
Figure 3. The 24 h electrical conductivities measured in different physiological stages for potassium nitrate (a), calcium nitrate (b), potassium dihydrogen phosphate (c), potassium chloride (d) and control (e). The 24 h ECs were recorded from the first day, at 9.30 a.m. till the next day at 9.30 a.m. The ECs were determined by using the indirect Ohm’s law method, based on the electrical signals recorded with a Keysight B2981A femto/picoammeter (fA).
Agriculture 11 00292 g003aAgriculture 11 00292 g003b
Figure 4. Blossom end rot, a physiological disorder induced by calcium deficiency in tomato fruits.
Agriculture 11 00292 g004
Table 1. The average of electrical conductivity of tomato plants determined in different phenological stages (dS·m−1).
TreatmentsPhenological Stages
VegetativeBuddingFloweringRipening
EC ± 4 σEC ± σEC ± σEC ± σ
KNO3 1 Daylight0.220 ± 0.0078a 50.053 ± 0.0037c0.051 ± 0.0045bc0.060 ± 0.0040ab
2 Night0.201 ± 0.0159a0.049 ± 0.0009c0.050 ± 0.0025c0.064 ± 0.0007b
3 Day0.211 ± 0.0155a0.051 ± 0.0033c0.051 ± 0.0037c0.062 ± 0.0033b
Ca(NO3)2Daylight0.224 ± 0.0058a0.049 ± 0.0104c0.049 ± 0.0010c0.062 ± 0.0161ab
Night0.216 ± 0.0066a0.036 ± 0.0014d0.048 ± 0.0005c0.054 ± 0.0012c
Day0.220 ± 0.0073a0.043 ± 0.0102c0.049 ± 0.0009c0.058 ± 0.0124b
KH2PO4 Daylight0.176 ± 0.0097b0.090 ± 0.0026b0.072 ± 0.0036b0.053 ± 0.0020b
Night0.194 ± 0.0137a0.087 ± 0.0015b0.069 ± 0.0032b0.057 ± 0.0004c
Day0.185 ± 0.0146b0.089 ± 0.0024b0.070 ± 0.0038b0.055 ± 0.0023b
KClDaylight0.141 ± 0.0086c0.124 ± 0.0053a0.096 ± 0.0122a0.078 ± 0.0037a
Night0.133 ± 0.0074b0.126 ± 0.0029a0.114 ± 0.0018a0.068 ± 0.0022a
Day0.137 ± 0.0089d0.125 ± 0.0044a0.105 ± 0.0129a0.073 ± 0.0056a
Control Daylight0.152 ± 0.0098c0.051 ± 0.0020c0.057 ± 0.0084bc0.065 ± 0.0019ab
Night0.144 ± 0.0041b0.047 ± 0.0036c0.052 ± 0.0023c0.061 ± 0.0012a
Day0.148 ± 0.0087c0.049 ± 0.0036c0.055 ± 0.0068c0.063 ± 0.0024ab[IB1]
1 EC by daylight (14 h: from first day, at 9.30 a.m., till 8.00 p.m. and the next day from 6.00 a.m. to 9.30 a.m.); 2 EC at night (10 h: from first day, at 8.00 p.m., till the next day at 6.00 a.m.); 3 EC by day (24 h: from first day, at 9.30 a.m., to the next day at 9.30 a.m.); 4 σ is the standard deviation of EC values (dS·m−1); 5 the lowercase letters represent the results of the Tukey test for p ≤ 0.05 (a—the highest value and d—the lowest value). The test was calculated on columns.
Publisher’s Note: MDPI stays neutral with regard to jurisdictional claims in published maps and institutional affiliations.

