Article

Assessing Seasonal Methane and Nitrous Oxide Emissions from Furrow-Irrigated Rice with Cover Crops

by
Sandhya Karki
1,
M. Arlene A. Adviento-Borbe
2,*,
Joseph H. Massey
2 and
Michele L. Reba
2
1
Department of Agricultural and Biological Engineering, University of Arkansas, Fayetteville, AR 72701, USA
2
Delta Water Management Research Unit, United States Department of Agriculture-Agricultural Research Service, Jonesboro, AR 72401, USA
*
Author to whom correspondence should be addressed.
Agriculture 2021, 11(3), 261; https://doi.org/10.3390/agriculture11030261
Submission received: 5 February 2021 / Revised: 11 March 2021 / Accepted: 12 March 2021 / Published: 19 March 2021
(This article belongs to the Section Agricultural Soils)

Abstract

:
Improved irrigation management is identified as a potential mitigation option for methane (CH4) emissions from rice (Oryza sativa). Furrow-irrigated rice (FR), an alternative method to grow rice, is increasingly adopted in the Mid-South U.S. However, FR may provide a potential risk to yield performance and higher emissions of nitrous oxide (N2O). This study quantified the grain yields, CH4 and N2O emissions from three different water management practices in rice: multiple-inlet rice irrigation (MIRI), FR, and FR with cereal rye (Secale cereale) and barley (Hordeum vulgare) as preceding winter cover crops (FRCC). CH4 and N2O fluxes were measured from May to September 2019 using a static chamber technique. Grain yield from FR (11.8 Mg ha−1) and MIRI (12.0 Mg ha−1) was similar, and significantly higher than FRCC (8.5 Mg ha−1). FR and FRCC drastically reduced CH4 emissions compared to MIRI. Total seasonal CH4 emissions decreased in the order of 44 > 11 > 3 kg CH4-C ha−1 from MIRI, FR, and FRCC, respectively. Cumulative seasonal N2O emissions were low from MIRI (0.1 kg N2O-N ha−1) but significantly higher from FR (4.4 kg N2O-N ha−1) and FRCC (3.0 kg N2O-N ha−1). However, there was no net difference in global warming potential among FR, FRCC and MIRI. These results suggest that the increased N2O flux from furrow-irrigated rice may not greatly detract from the potential benefits that furrow-irrigation offers rice producers.

1. Introduction

One of the greatest challenges of agriculture in the 21st century is to meet the growing food demand while simultaneously abating its environmental impacts. Food production needs to increase by 2050 to meet global food demand while agriculture must concurrently address climate change, biodiversity loss, and soil and water degradation [1]. Rice is a major staple food for almost half of the world’s population and its demand is expected to grow through 2025 with an increase in population [2]. Yet, traditional rice cultivation practices in flooded paddy have the highest global warming potential (GWP) compared to other cereal crops primarily due to high methane (CH4) emissions [3], accounting for about 11% of global anthropogenic CH4 emissions [4]. Furthermore, flooded rice systems also face major environmental issues such as higher water use. About 75% of global rice is produced in irrigated lowlands [5], where the fields are mostly continuously flooded throughout the growing season. Irrigated rice uses 34–43% of total world’s irrigation water [5]. Thus, its sustainability is highly threatened by global water scarcity [6]. Therefore, recent research is focused on alternative water management practices to concurrently increase irrigation water productivity and reduce greenhouse gas (GHG) emissions from rice without altering the grain yield.
Furrow-irrigated rice, also known as row rice, is being increasingly adopted by farmers in the Mid-South U.S. In this system, rice is grown on relatively short raised beds and resulting furrows used to supply irrigation water as with other furrow-irrigated crops [7,8]. Farmers are adopting the practice because it allows rice to be grown on more permeable soils and/or steeper field slopes than feasible with traditional flooding, and reduces soil disturbance and labor associated with installing/removing levees and levee gates [7]. Additionally, raised beds offer rice producers (a) greater flexibility in addressing changing market and/or weather conditions since they can also be used to grow soybean, (b) potential to reduce fall tillage, and (c) more timely planting of soybean in wet years when rainfall can prevent the removal of levees and other tillage activities required with conventional rice levee systems. The irrigation management of furrow-irrigated rice systems has also opened the possibility of growing cover crops in rice, which would otherwise be quite challenging. Growing cover crops in other row crops such as corn (Zea mays) and soybean (Glycine max) is already expanding in the U.S. due to multiple agronomic and environmental benefits associated with their use [9,10]. These benefits could all be helpful in furrow-irrigated rice systems, particularly if winter cover crops reduce irrigation demand, stabilize the raised beds during winter fallow periods, and suppress particularly problematic weeds such as Palmer Amaranth species.
Methane (CH4) is produced via organic matter decomposition under anaerobic soil conditions [11]. Thus, any water management practices that introduce aerobic conditions during the growing season of rice can drastically reduce CH4 emissions [12,13]. Furrow-irrigated rice has the potential to reduce CH4 emissions relative to conventional flooded rice owing to the relative aerobic conditions of row rice fields. However, row rice may also increase the risk for yield reductions and fertilizer N losses through emissions of nitrous oxide (N2O) [7]. The cycling between wet and dry soil conditions with furrow irrigation creates an environment favorable for N2O losses by stimulating nitrification and subsequent denitrification processes [14,15]. Cover crops in furrow-irrigated rice may also affect GHG emissions owing to increased availability of carbon from decomposing biomass [16,17]. Furthermore, cover crops may alter the soil moisture status by increasing soil infiltration rates and soil water storage [18,19], which will directly impact GHG emissions [11,20]. According to a recent meta-analysis by Jiang et al. [12], nonflooded rice cultivation (aerobic rice) can reduce the total global warming potential (GWP) of rice as compared to continuously flooded rice. However, furrow-irrigated rice practices in the Mid-South U.S. are different from other nonflooded water management practices: Farmers often use a “tail levee” or other means to hold floodwater on the lower portion of a field [7]. This “end blocking” results in varying soil moisture conditions up and down the field and, thus, potential variations in GHG emissions. To our knowledge, there is no published information regarding grain yield and GHG emissions from furrow-irrigated rice with and without cover crops.
The objective of this study was to quantify the grain yield, and CH4 and N2O emissions from furrow-irrigated row rice grown with and without a winter cover crop and compare to continuously flooded rice cultivation on a commercial farm. Our hypothesis was that both furrow- irrigated rice, with and without winter cover crops, decreased both rice grain yield and CH4 emissions but increase N2O emissions.

2. Materials and Methods

2.1. Study Site and Crop Management

Field studies were conducted at a commercial farm (35°48′53′′ N, 89°59′50′′ W) located in Burdette, Arkansas. The soil at the study site was Sharkey silty clay (very fine, montmorillonitic, nonacid, thermic Vertic Haplaquepts) that had been under a long-term rice and soybean rotation. Prior to this study, all fields were cropped to soybean, and the residues from the preceding soybean crop were left on the ground after harvest. No intentional effort was made to capture rainfall within the fields, but it should be noted that rainfall capture is inherent to any system that creates freeboard.
The study was conducted from May to September 2019 in a complete block design replicated five times. Three fields were used with different irrigation treatments: continuously flooded with multiple-inlet rice irrigation (MIRI), furrow-irrigated rice (FR), and furrow-irrigated rice with winter cover crops (FRCC). Each field was approximately 30 ha and had been previously precision graded to 0.1% slope. In all fields, irrigation water was delivered using 10 mil (thickness) by 38 cm (diameter) lay-flat, plastic tubing (Delta Plastics, Little Rock, AR, USA).
The MIRI field served as the conventional control and consisted of seven paddies separated by six straight earthen levees. Plastic tubing was installed perpendicular to the levees and multiple holes were installed in each paddy to allow irrigation water to be supplied simultaneously to all paddies. After flood initiation, a flood depth ranging from approximately 2 to 10 cm was maintained until about two weeks prior to harvest, at which time the field was drained. The FR and FRCC fields consisted of raised beds that were approximately 10 cm tall and spaced 91 cm apart (center to center). The beds were used to grow soybeans in 2018. Immediately after the soybean crop was harvested in August 2018, a 50:50 mixture of annual rye and barley was drilled into the beds of the FRCC field. The cover crop was terminated at the time of rice planting on 23 April 2019 using glyphosate herbicide. A disk-bedder was used to “freshen” the beds of the FR field prior to rice planting in 2019 while a modified field cultivator was used to clean the furrows of the FRCC field prior to the first irrigation. Plastic tubing was installed across the top of each field and one hole punched at every furrow to allow irrigation water to flow down each furrow.
Hybrid XP753 (RiceTec, Inc., Alvin, TX, USA) were drill seeded at the rate of 27 kg ha−1 on 23–24 April 2019 in all treatments. No irrigation water was applied following seeding because rainfall was sufficient for crop establishment. On 6 June, that is, 43–44 days after sowing, irrigation was commenced on all fields. Approximately three weeks after irrigation initiation, field outlets were blocked to create 5 to 10 cm standing floods across the entire MIRI field and the lower portions of FR and FRCC fields. The MIRI treatment was kept flooded through the growing season with the supply of irrigation at approximately a 5-day interval. In FR and FRCC, irrigation water was supplied at approximately a 3-day interval. Irrigation was halted on all fields on 29 August, resulting in an 84-d irrigation period. The combination of the 0.1% field slope and lack of levees on the FR and FRCC fields resulted in different management zones where the upper portion (~30%) of the fields was moist but not flooded (i.e., aerobic) and the lower portion (~30%) of the fields was maintained with a standing flood. Thus, the FR and FRCC fields were divided into top and bottom sections for greenhouse gas flux measurement as discussed below. The top sections (FR Top, FRCC Top) were located 76 m from the uppermost field edge while the bottom sections (FR Bottom, FRCC Bottom) were located 76 m from lower (i.e., downslope) side of each field.
Urea fertilizer was aerially broadcast over the whole field in a two-way (MIRI) and three-way split application (FR and FRCC fields) as shown in Table 1. First application of fertilizer was applied a few days prior to the permanent flood establishment or prior irrigation for all fields. For FRCC, an additional 39 kg N ha−1 was applied in the top portion of the field due to the poor growth of rice plants.

2.2. Soil Sampling and Analysis

Five composite soil samples (0–25 cm) for physico-chemical analysis were randomly collected in April 2019 from top and bottom sections of each field. The soil samples were air-dried and ground to pass a 2 mm sieve. The soil was analyzed by the University of Missouri Soil and Plant Testing Laboratory, Columbia, Missouri, USA for texture and various chemical properties (pH, electrical conductivity, cation exchange capacity, total C and total N).
Soil core samples (diameter, 22 mm) from the 0–25 cm depth were also collected for mineral N (NH4+, NO3) analysis on 11 July and 2 and 15 August. Soil-exchangeable N was determined by extracting 10 g of fresh soil with 80 mL of 2 M KCl. The extracts were stored at −20 °C and later thawed and analyzed for mineral N content. Soil exchangeable NH4-N concentration was determined using the salicylate colorimetric method while soil NO3-N concentration was measured using the vanadium reduction method [21].

2.3. Measurements and Calculation of Greenhouse Gas Fluxes

Greenhouse gas fluxes were measured using static flux chamber technique. The chamber consisted of a PVC base (collars), extensions of various heights (15.3–91.4 cm) to accommodate growing rice plants and a chamber lid. The chamber lid was equipped with a vent tube, fan and thermocouple wire for measurement of air temperature. Each PVC base (diameter, 29.5 cm and height, 22.9 cm) had four holes (diameter, 11 cm) at the bottom to facilitate water movement and root interaction. Additionally, two holes (diameter, 2.86 cm) were drilled into the top parts of the collars to allow free movement of water inside collars. The holes were plugged with rubber stoppers during gas sampling. The bases were permanently installed to an approximate depth of 15 cm into the soil when the rice was at the 3–4 leaf stage. Permanent boardwalks were installed to access each collar so as to minimize soil and plant disturbance during gas sampling.
Three gas samples (25 mL) were drawn from chamber headspace at equal time intervals within 1 h of chamber closure. Headspace gas was mixed for 1 min using a 12-V fan installed inside the chamber lid (Allied Electronics, Forth Worth, TX, USA) before gas sampling when the chamber height reached >30 cm. Also, ambient gas samples were collected from each plot at 0 min. The gas samples were transferred in pre-evacuated 12.5 mL vials. The glass vials were sealed with rubber septa and silicon to avoid gas leakage. Gas samples were generally collected from 9:00 to 13:00. The sequence of gas sampling was randomized to avoid possible bias with temperature difference during gas measurements. Gas samplings were performed at weekly intervals. Gas concentrations of CH4 and N2O were determined on a GC-2014 gas chromatograph (Shimadzu Scientific, Inst., Columbia, MD, USA) connected with an autosampler (XYZTEK, Sacramento, CA, USA) configured and calibrated as described by Adviento-Borbe et al. [22]. Fluxes of CH4 and N2O were calculated from the linear increase of gas concentration over time. CH4 and N2O fluxes below the detection limit of GC (0.203 ppm for CH4 and 0.010 ppm for N2O) were treated as zero fluxes.

2.4. Yield Component Analysis

A 1-m2 area from the middle of each replicate treatment plot was manually harvested at maturity to estimate grain yield and yield components. Approximately 2 kg of fresh biomass was subsampled by hand. Rice biomass from subsamples were analyzed for grain yield and yield components such as plant height, total panicle count, tiller number and 1000 grain weight. Plant heights were noted for 10 randomly selected plants from the subsamples. Grain yield, tiller, and panicle numbers were then calculated on area basis after upscaling the measured variables from 2 kg subsample to total fresh biomass from 1 m2 measured in the field. Grains were manually threshed from the panicles and cleaned with a seed blower (SeedBuro, Des Plaines, IL, USA), oven-dried at 60 °C until constant weight and adjusted to 14% moisture for grain yield. Also, the weight of the straw was noted after oven drying at 60 °C. The harvest index was then determined as the ratio of grains to the total aboveground biomass.

2.5. Environmental Variables

Air temperature and precipitation data were obtained from a nearby NOAA weather station located 20 km from the study site. Air temperature during chamber closure was recorded using a thermocouple wire attached to each chamber. Soil temperature at 5 and 10 cm soil depths was recorded using a digital thermometer (Thermo Fisher Scientific, Pittsburgh, PA, USA). Floodwater depth was measured manually at every gas sampling event. Additionally, soil moisture at 15, 30 and 45 cm depth were recorded at daily intervals using soil moisture sensors (Irrometer, Riverside, CA, USA).

2.6. Data Analysis

Cumulative seasonal fluxes were calculated by linear interpolation between sampling dates. Cumulative fluxes were calculated for each collar and then averaged for each water treatment (n = 5). Global warming potential (GWP) of CH4 and N2O was calculated in mass of CO2 equivalent (kg CO2 eq ha−1) over 100-yr time horizon. A radiative forcing potential relative to CO2 of 28 for CH4 and 265 for N2O [23] was used. Yield-scaled global warming potential (GWPY) was calculated by taking the ratio of GWP and corresponding grain yield for each treatment.
The differences in mean cumulative CH4, N2O, and GWP among treatments were computed using R version 3.6.1 for completely randomized design at p-level < 0.05 [24]. Data that failed normality test (Shapiro Wilk test) and homogeneous variance were log-transformed. Greenhouse gas emissions, grain yield, yield components, GWP and GWPY due to main effects such as irrigation water treatments and location (top and bottom) were analyzed using R with function “lm”. Pairwise comparison in between the treatments was performed using package “lsmeans” in R.

3. Results

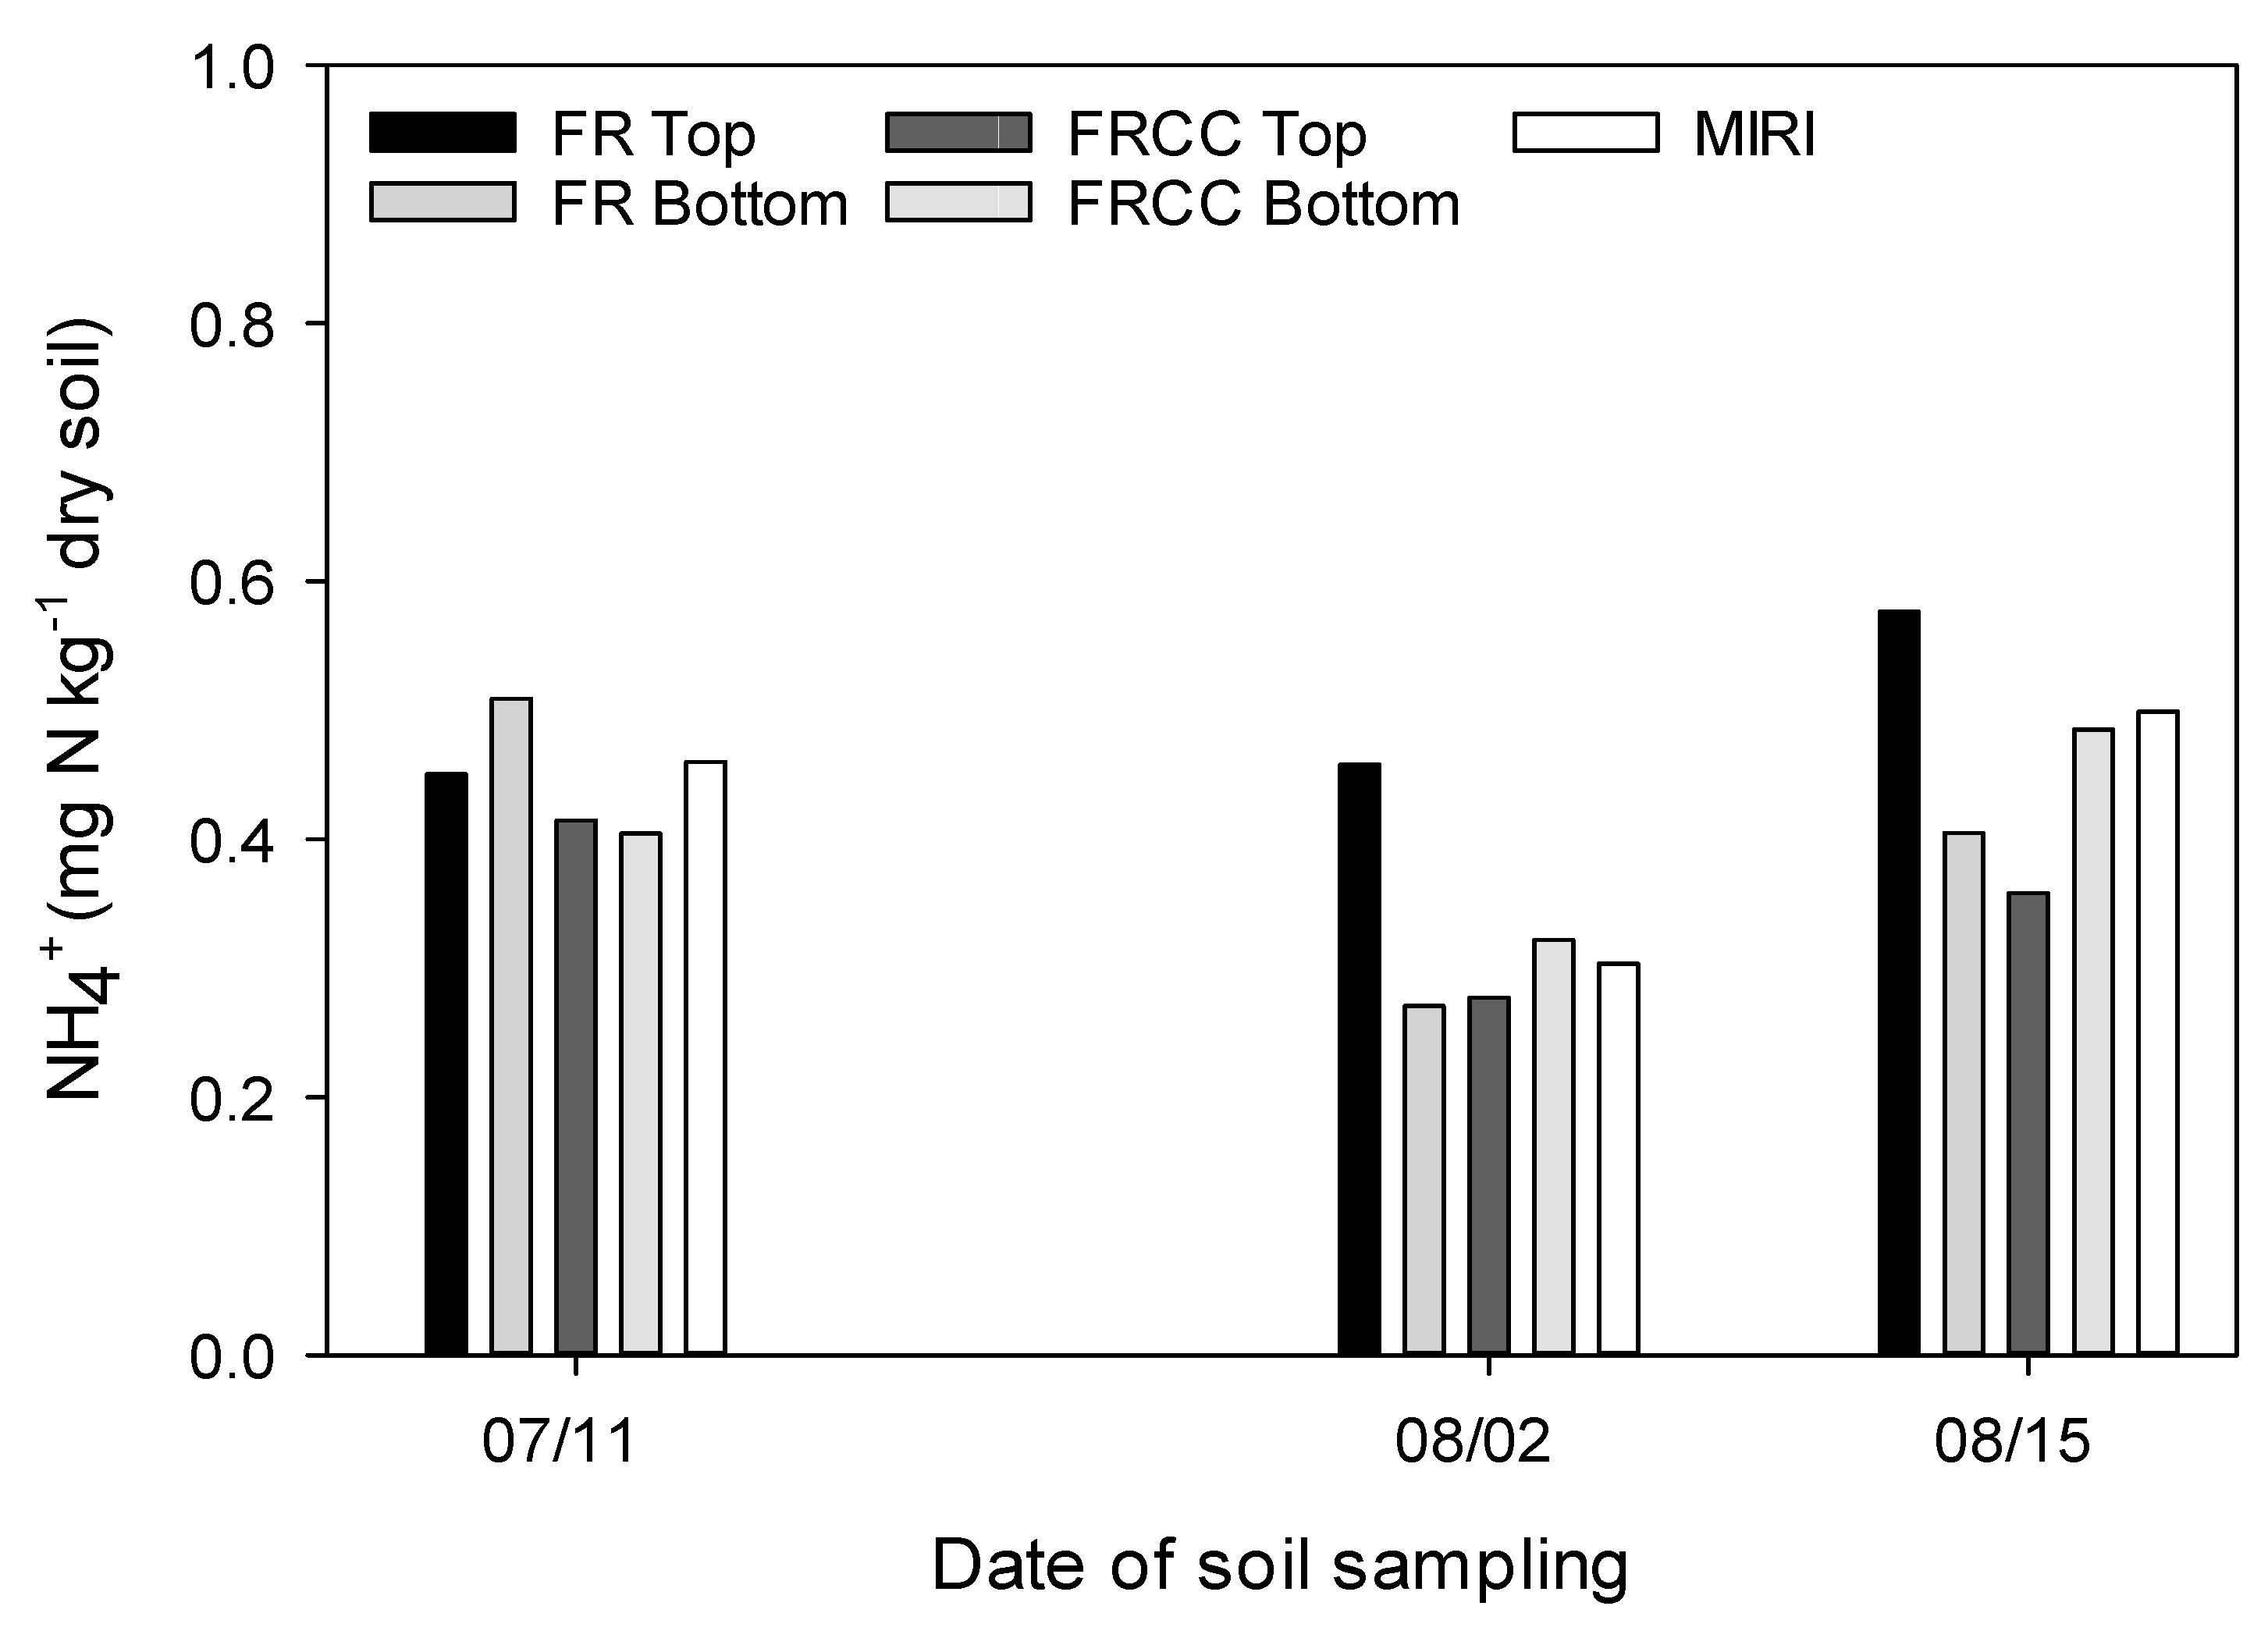
3.1. Characteristic of Soil and Soil Mineral Nitrogen

Soil texture differed among treatment plots. The soil texture was loam, clay loam and clay from FR, FRCC and MIRI, respectively (Table 2). Other soil properties at 0–25 cm depth did not differ among the treatment plots with average total organic carbon, 11 g kg−1, total nitrogen, 1.1 g kg−1, soil pHw 7.1, electrical conductivity, 0.18 ds m−1 and cation exchange capacity, 26.7 cmolc kg−1 (Table 2).
Soil exchangeable nitrate concentration was negligible or below the detection limit across water treatments in all soil sampling occasions. Also, soil exchangeable ammonium was low (<1 mg N kg−1 dry soil) and similar in all treatments during soil sampling occasions (Figure 1).

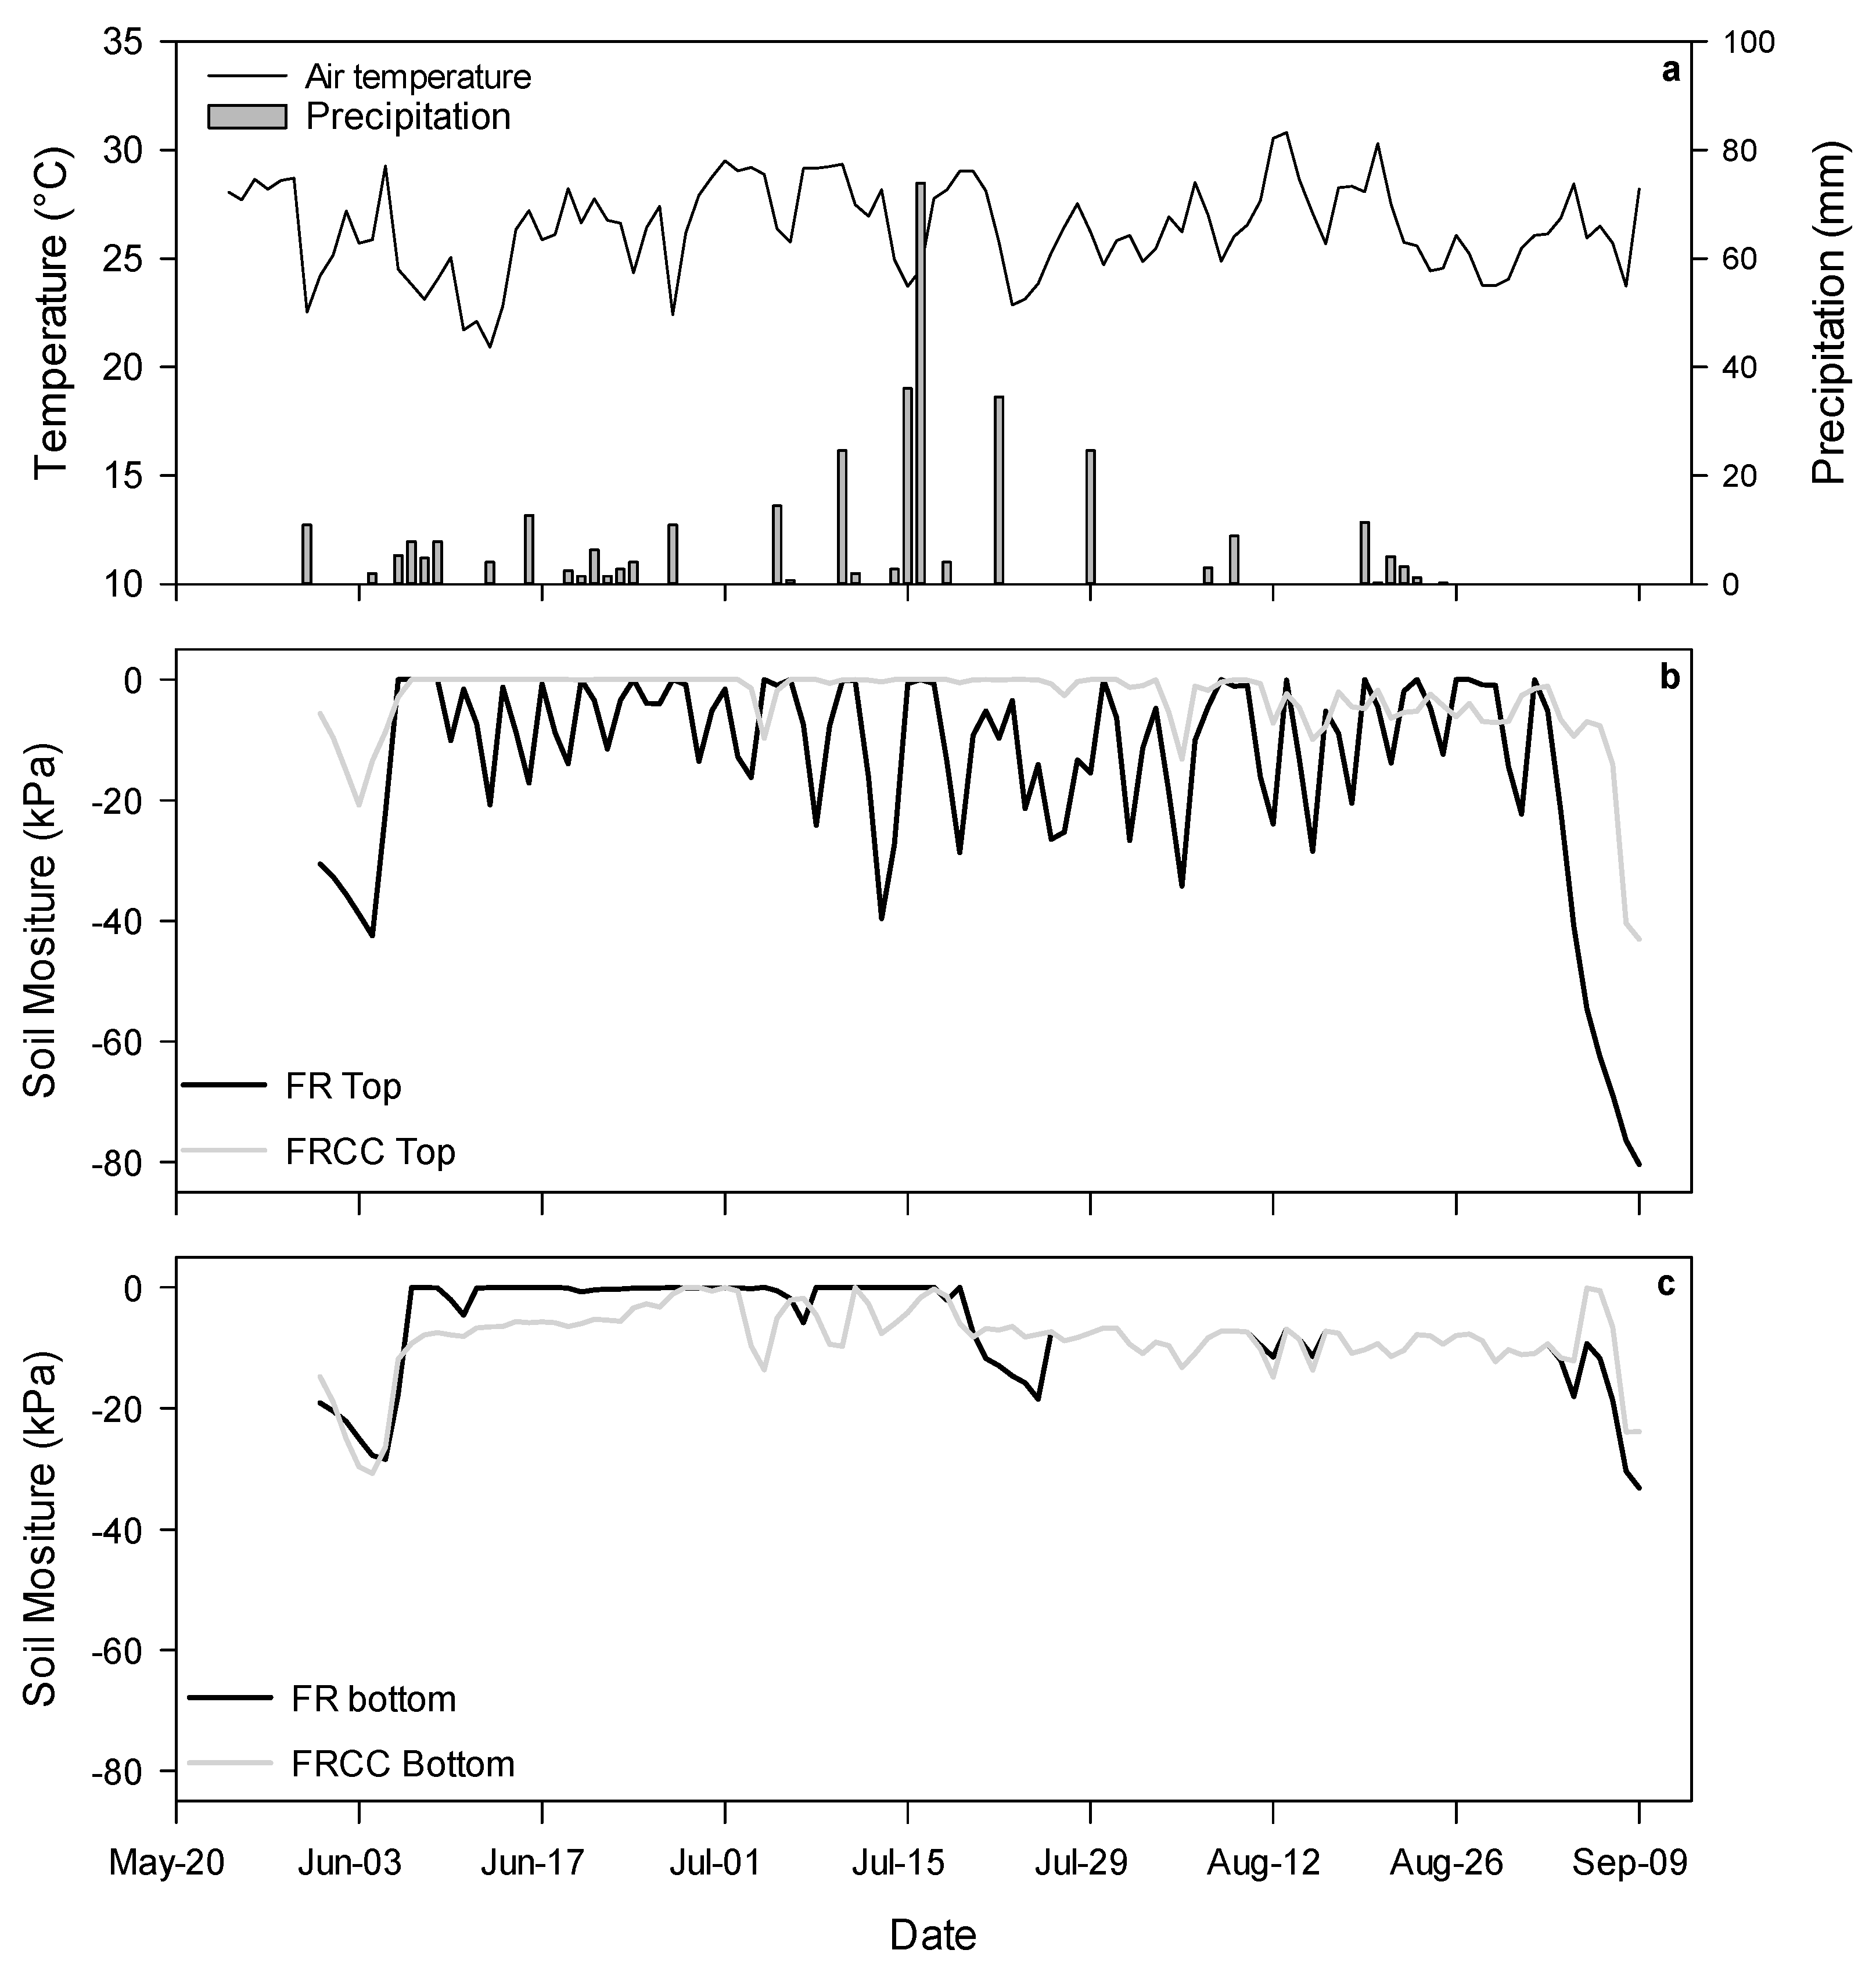
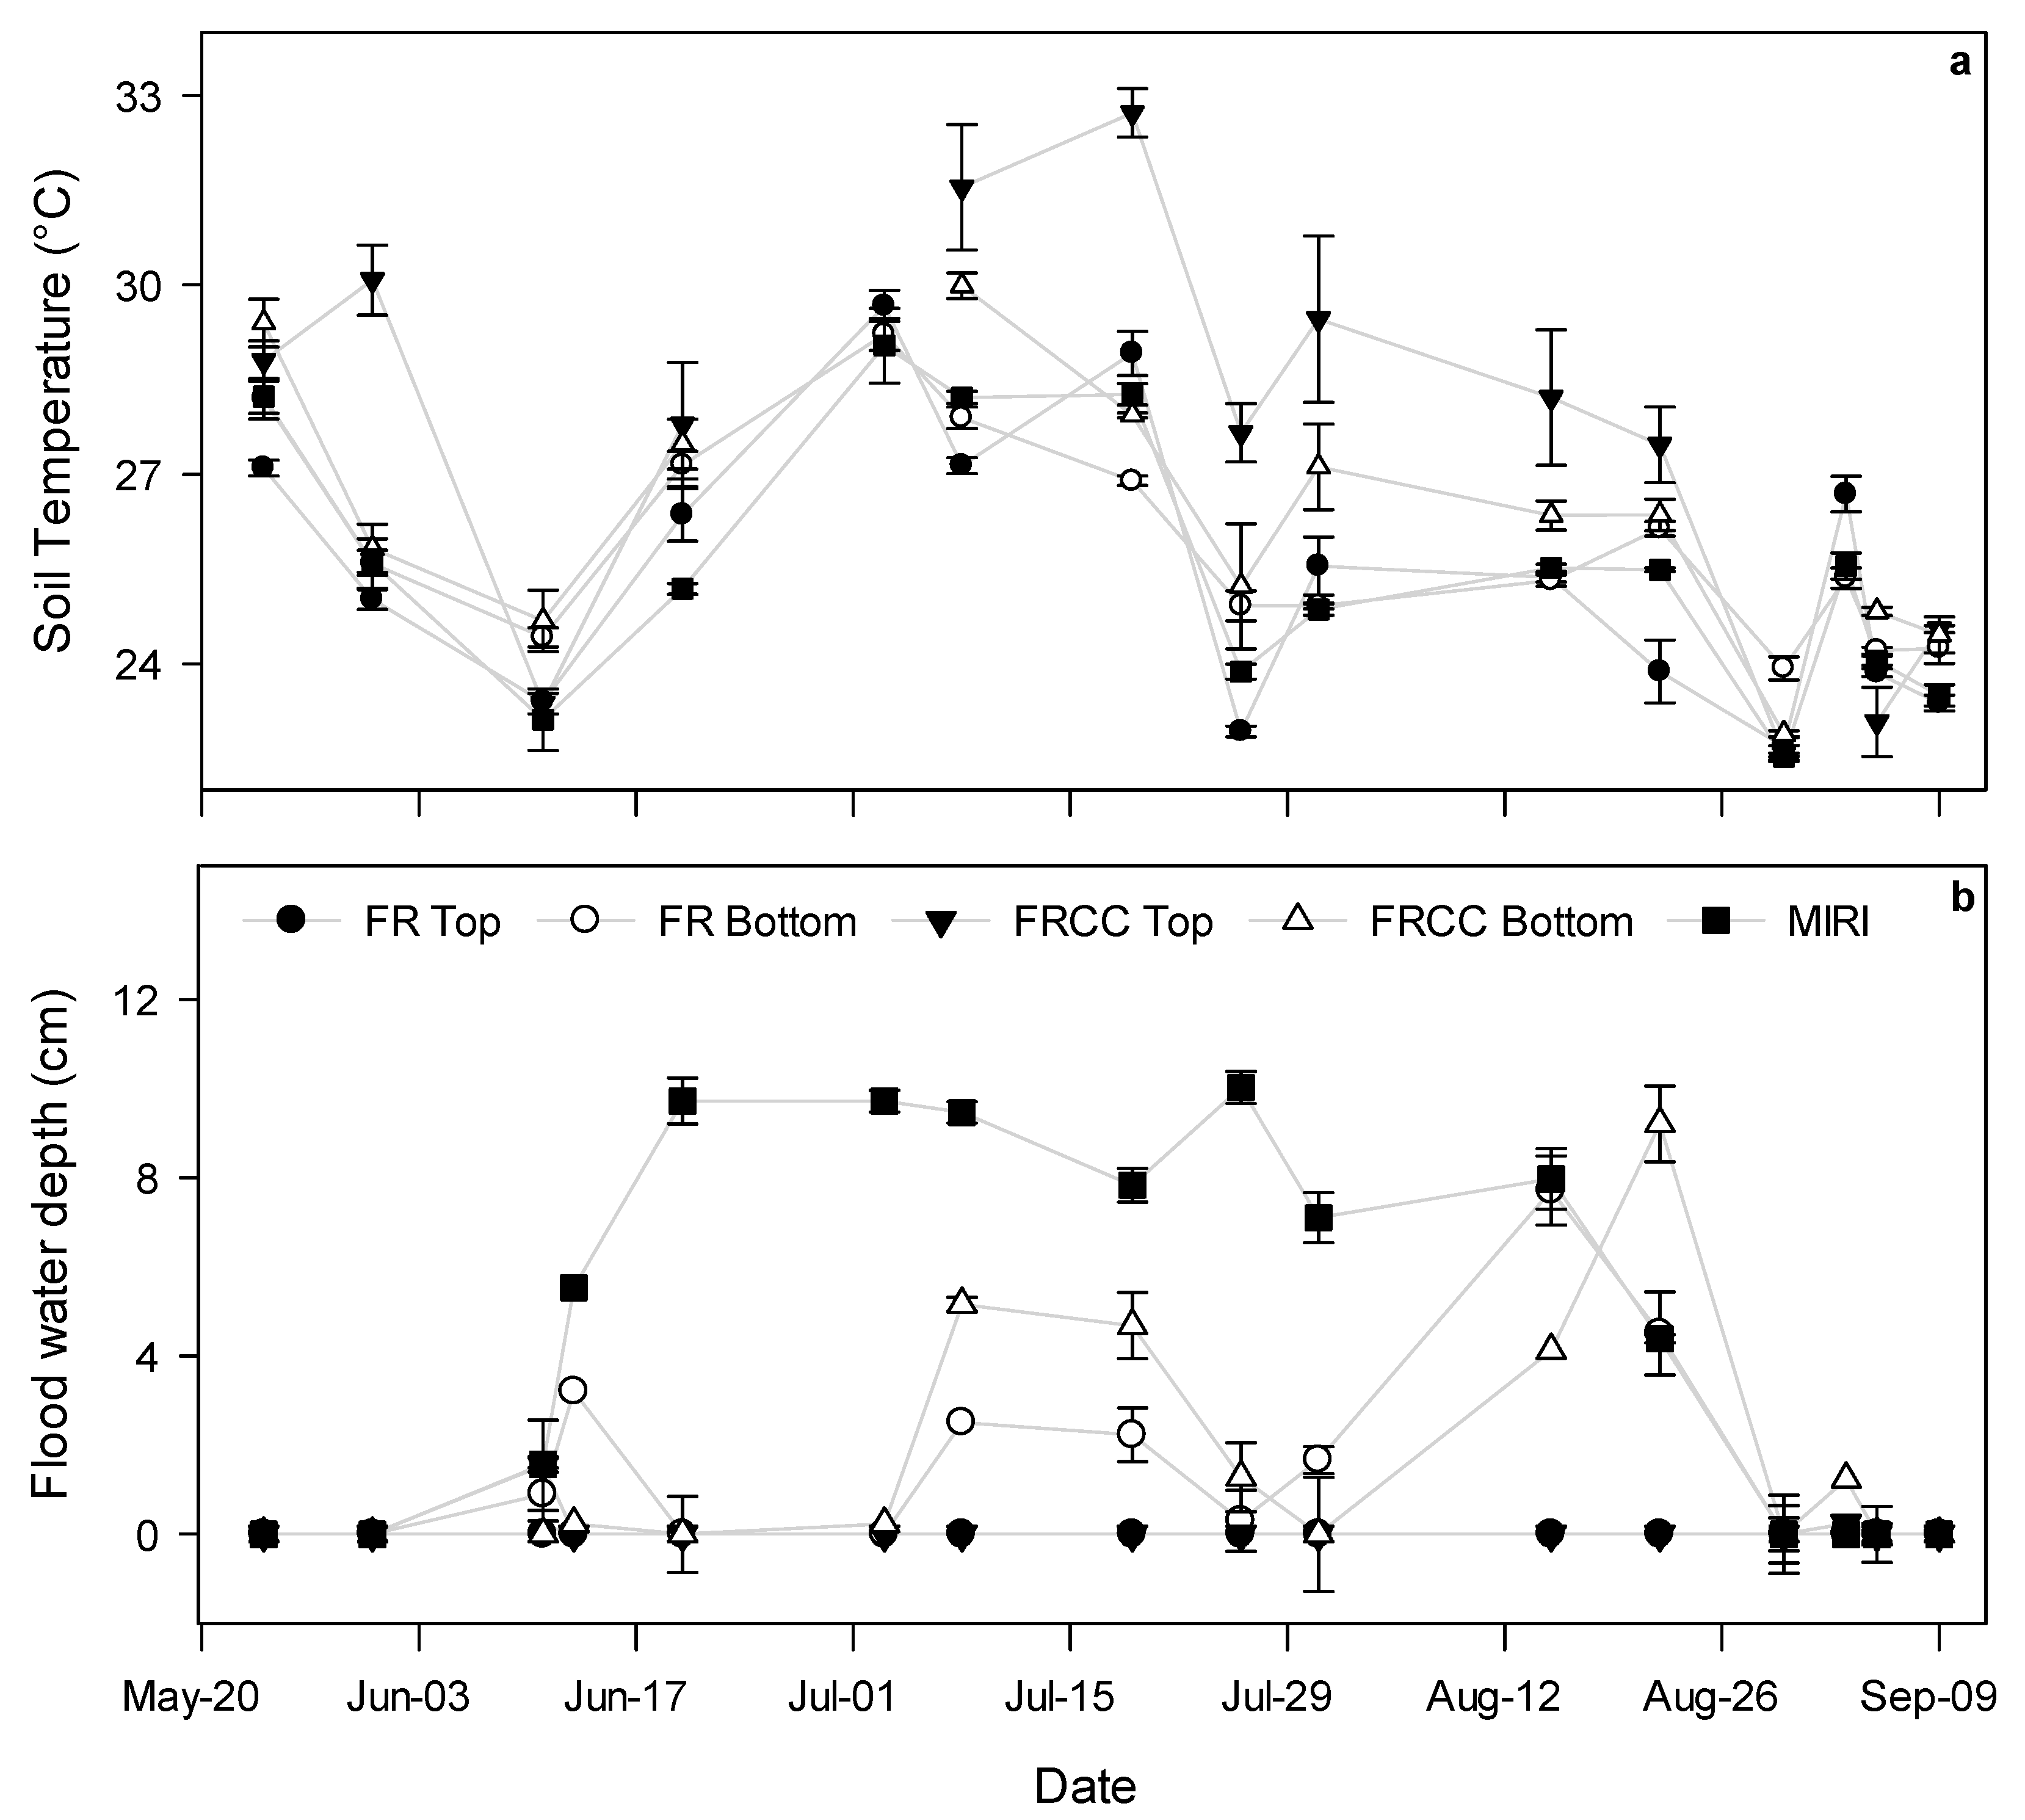
3.2. Environmental Conditions

The mean daily air temperature ranged from 21 to 31 °C during the study period. (Figure 2a). Total annual precipitation was 1218 mm and only around 25% occurred during the study period. The soil temperature during gas measurements ranged between 22 to 33 °C at 0–5 cm depth across all treatments (Figure 3a). Soil temperatures at 0–5 cm depth were similar across all treatments, except for FRCC in top sections where higher temperatures were observed mostly throughout the measurement period. Soil temperatures at the 0–15 cm soil depth ranged from 18–29 °C across all treatments with no differences among treatments. Soil water contents at 15 cm soil depth in top field sections were relatively constant at 0 kPa for FRCC but they fluctuated between 0 kPa to −80 kPa in FR (Figure 2b). In bottom field sections, soil water contents were higher in FR as compared to FRCC (Figure 2c). Soil water contents were similar for FR and FRCC after mid-July. Soil water contents were 0 kPa at the 30 to 45 cm soil depths for all treatments.
During gas sampling, standing floodwater was never observed within the upper sections of the row rice fields except for two occasions for FRCC (Figure 3b). In the bottom sections of the furrow-irrigated fields, floodwater depths fluctuated between 0 to 9 cm above the soil surface. The MIRI field was always flooded from June to September with floodwater depth ranging from approximately 2 to 10 cm (Figure 3b).

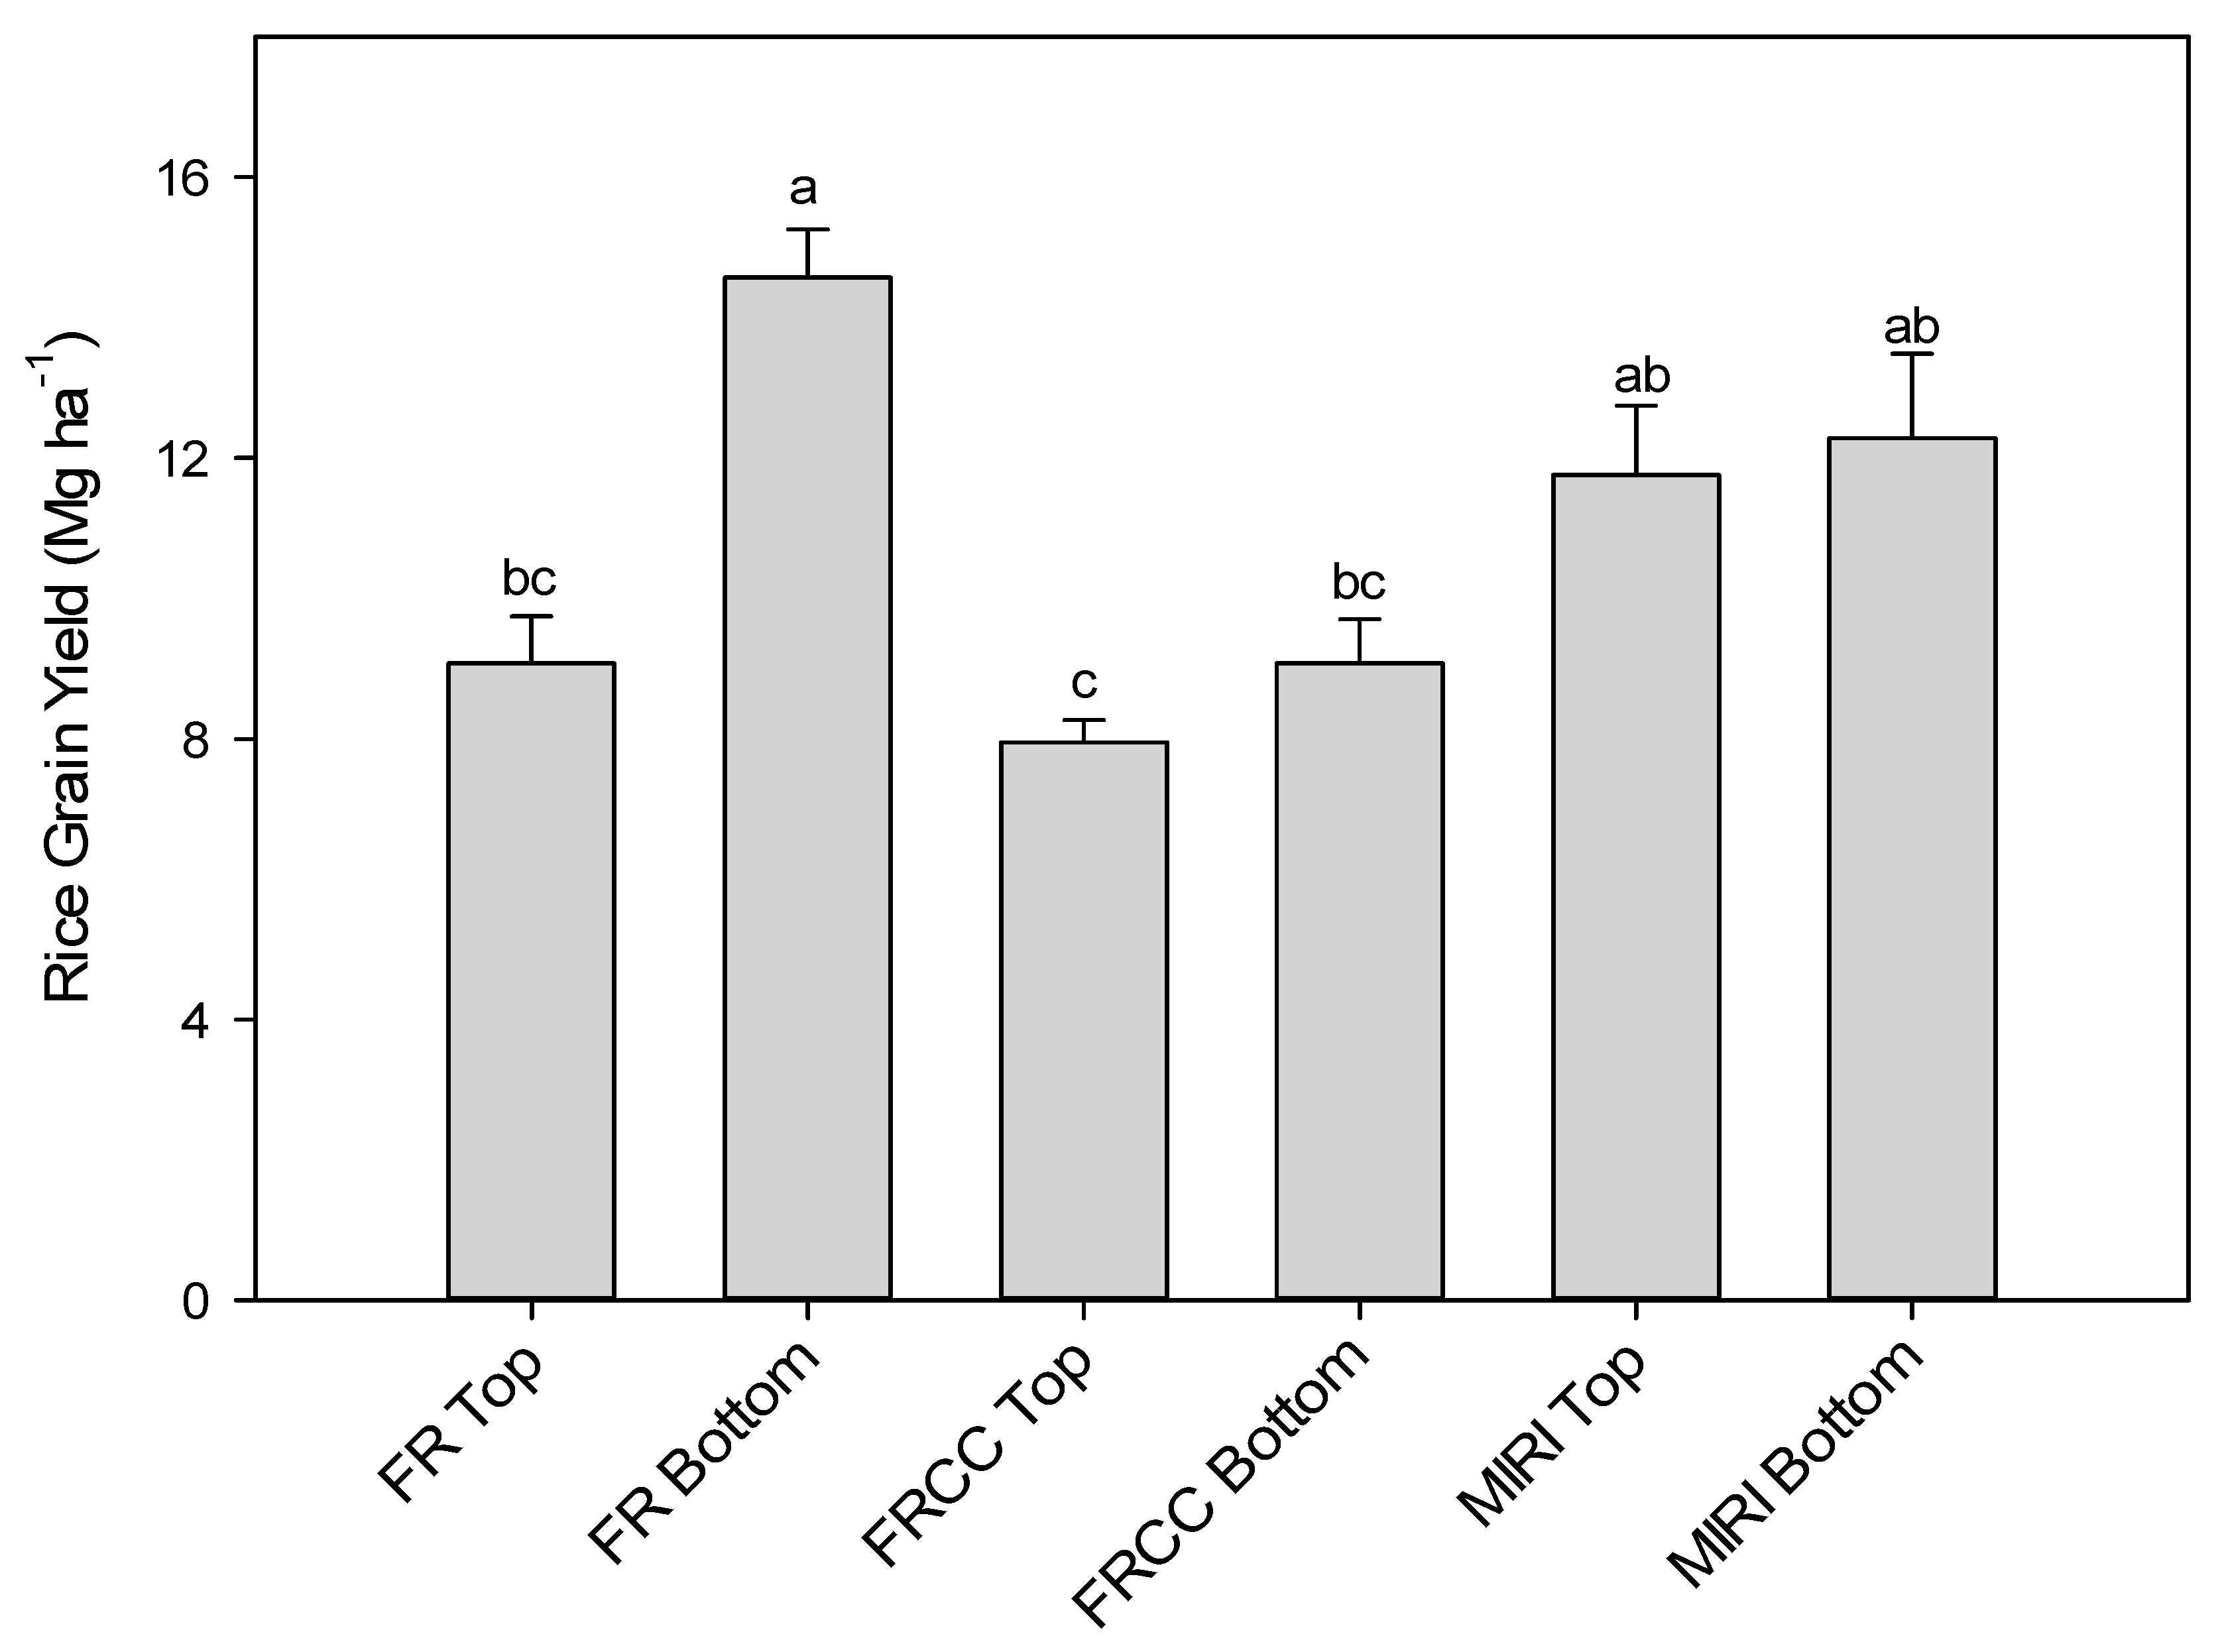
3.3. Grain Yield and Yield Components

There was a significant effect of water management on rice grain yield (p = 0.03). The average grain yield from FRCC was 8.5 Mg ha−1, which was significantly lower than MIRI and FR by almost 29% (Figure 4). For FR, the biomass yield from the top field section was significantly (p = 0.004) lower than the bottom section. A similar trend was obtained for tiller number and panicle number (Table 3). However, there was no significant effect of irrigation water management on plant height, harvest index, and 1000-seed grain weight.

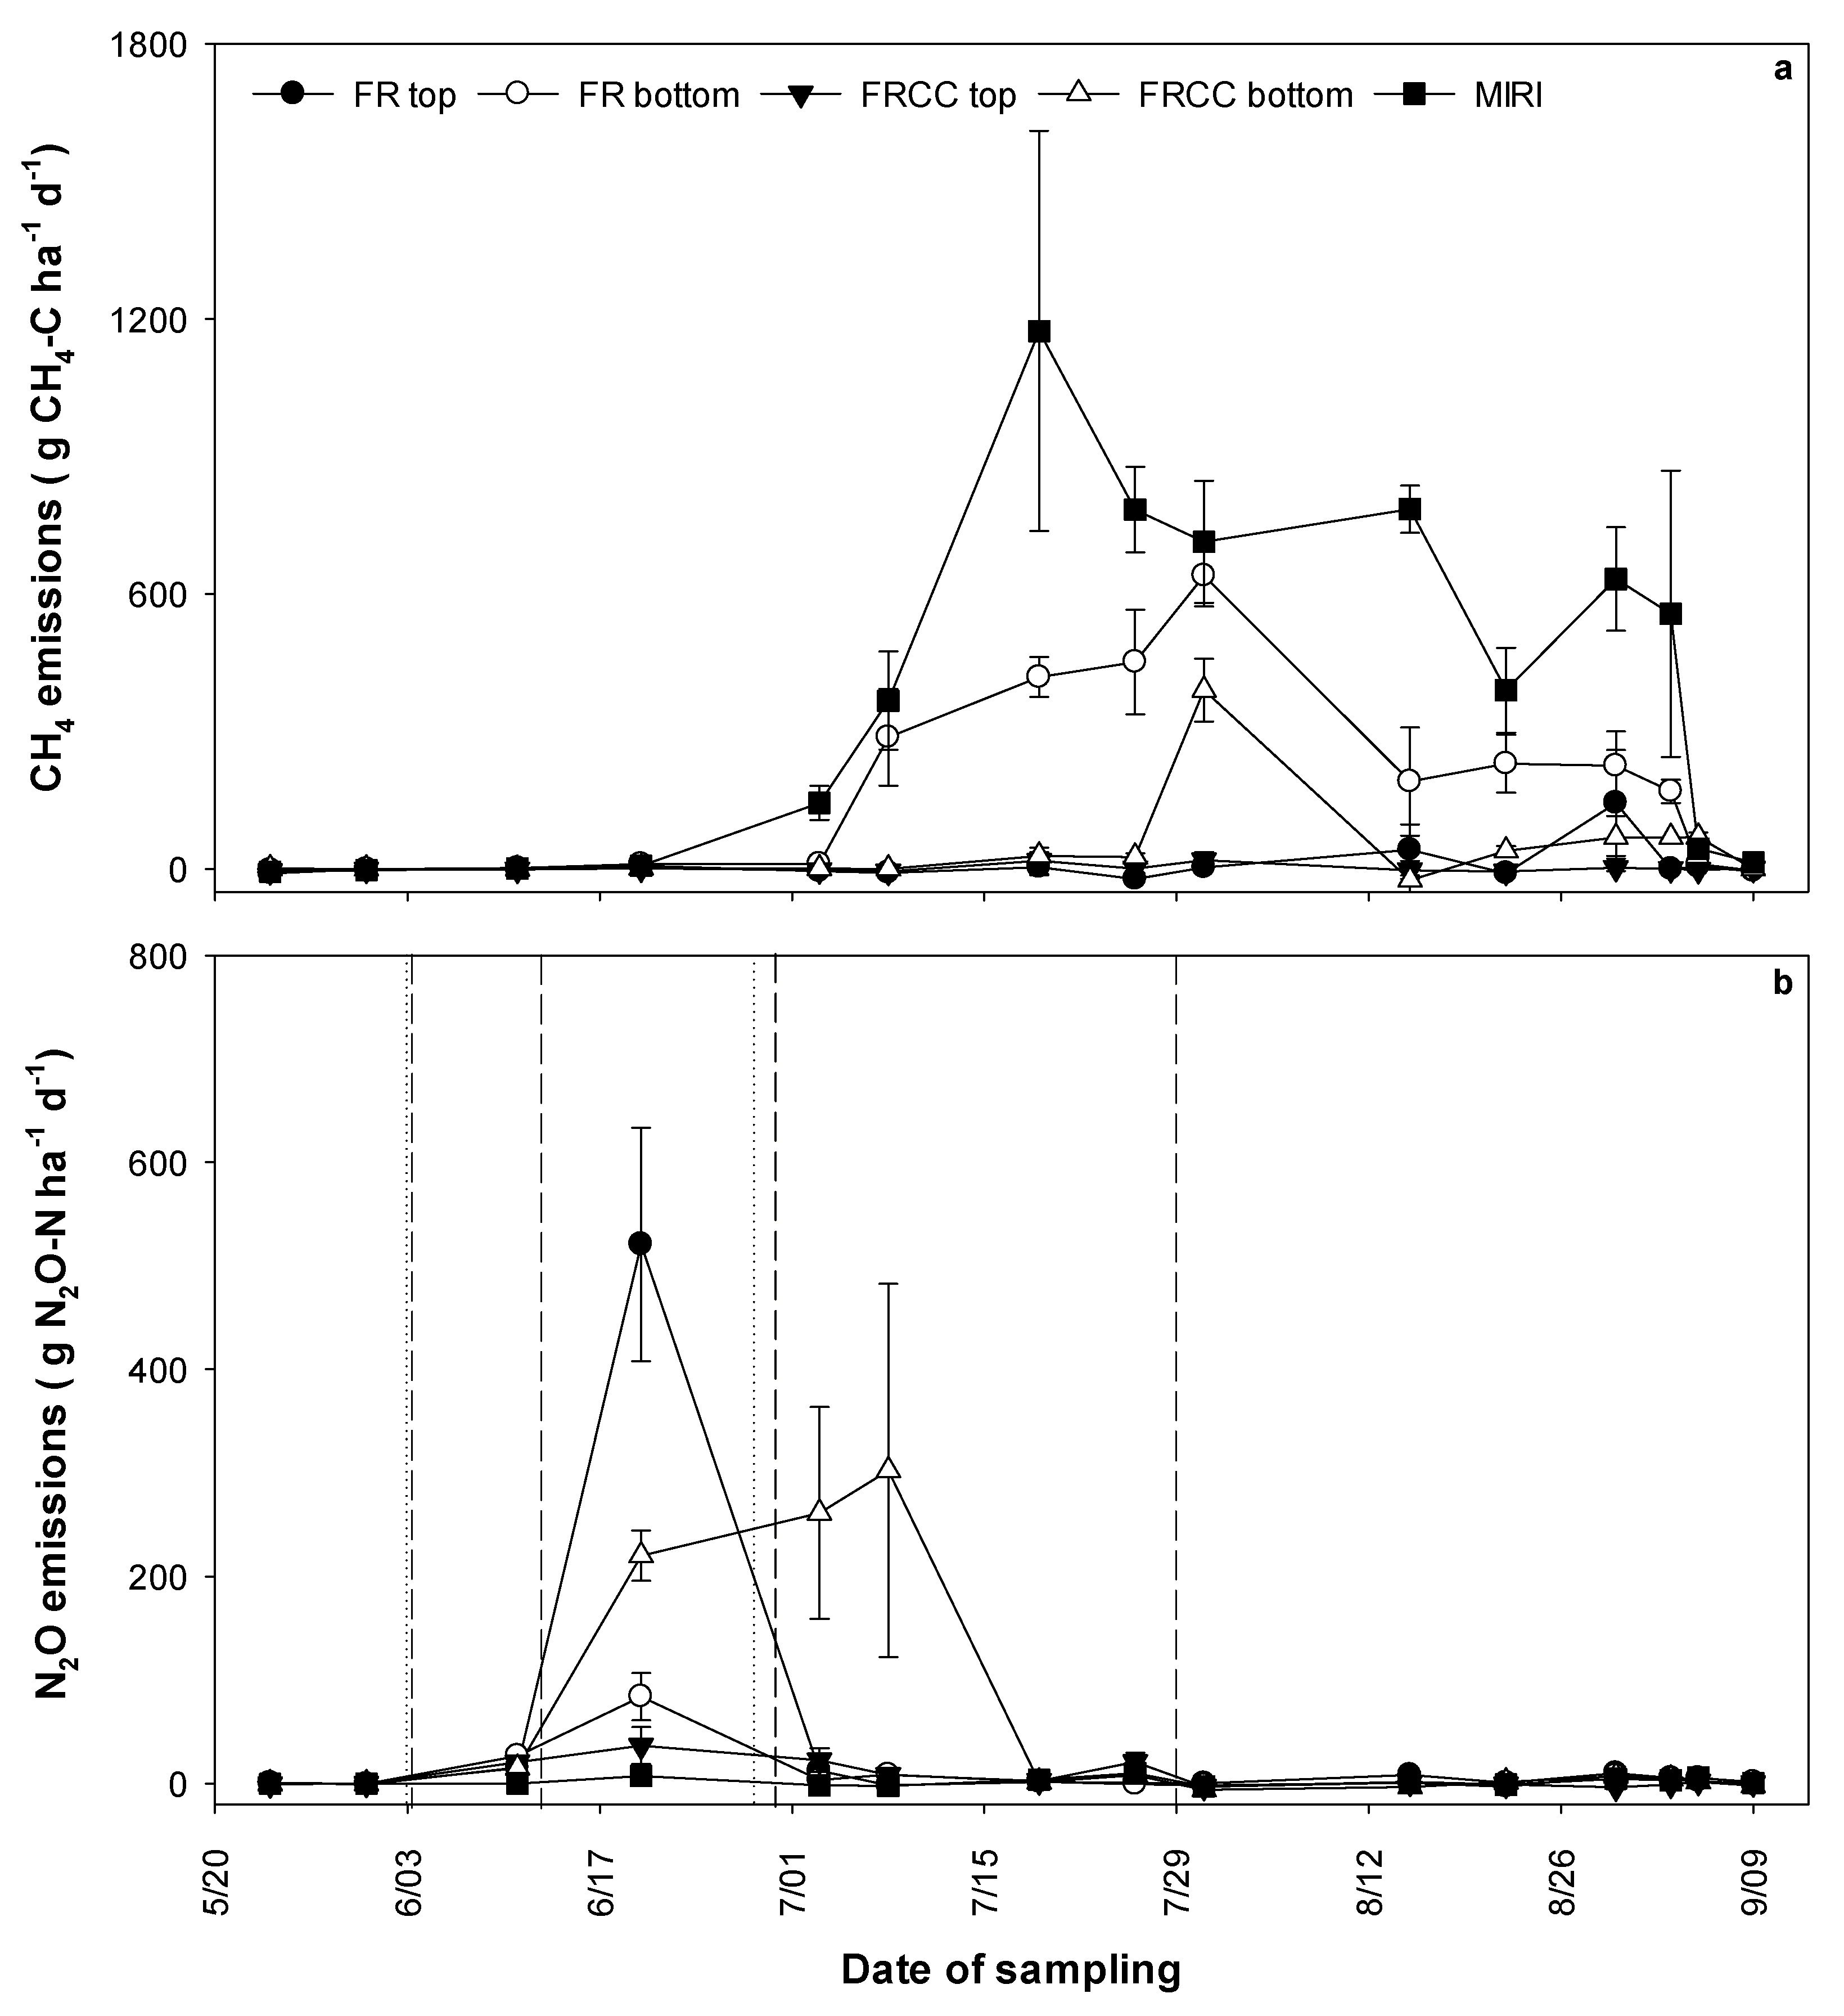
3.4. Seasonal Dynamics of Methane and Nitrous Oxide Emissions

Methane fluxes were not detected or were close to zero for all treatments during the initial period of crop development (i.e., 70 days after seeding) (Figure 5a). CH4 emissions in MIRI increased after two weeks of flooding in July and continued to increase, reaching a peak emission of 1174 g CH4-C ha−1 day−1 in mid-July (Figure 5a). Thereafter, CH4 fluxes declined to near zero a few days following removal of the flood from the field. In FR and FRCC, CH4 emissions were significantly higher from the bottom versus the top section. CH4 emissions from the FR bottom section were detected at the same time as MIRI but were later in July for the bottom section of FRCC (Figure 5a). Peak emissions of 640 and 390 g CH4-C ha−1 day−1 were observed from FR bottom and FRCC bottom, respectively, by the end of July after which time the fluxes began to decline. With the exception of two events when FR emissions were higher following reflooding of the field, the CH4 fluxes fluctuated between −22 and 19 g CH4-C ha−1 day−1 for the top sections of the FR and FRCC treatments.
Daily fluxes of N2O were low and fluctuated around zero fluxes in all field treatments except for a short period after N fertilization in FR and FRCC (Figure 5b). Nitrogen fertilizer-induced peak emissions were not observed from MIRI where daily emissions ranged from −3 to 10 g N2O-N ha−1 day−1. In the FR and FRCC treatments, the largest N fertilizer-induced peak emissions ranged from 37 to 520 g N2O-N ha−1 day−1 and were observed one week after the second N application at pre-flood + nine days (Table 1). Among the different treatments, the highest N fertilizer-induced peak was observed from FR top and FRCC bottom and lowest from FRCC top. FRCC bottom emissions continued until the first week of July, that is, almost a week after the third N application. Outside of these periods, daily N2O fluxes from FR and FRCC were low and ranged from −6 to 21 g N2O-N ha−1 day−1.

3.5. Cumulative Emissions, GWP, and Yield Scaled GWP

Cumulative seasonal CH4 emissions were significantly affected by irrigation treatment (p < 0.001), with the highest emissions from MIRI (Table 4). Seasonal CH4 emissions from the upper field sections were low for both FR and FRCC. The cumulative seasonal N2O emissions were lowest from MIRI and highest from FRCC bottom (Table 4). Combining the emissions from both the top and bottom field sections, FR and FRCC reduced CH4 emissions by 74% and 93%, respectively, relative to MIRI. In contrast, both FR and FRCC exhibited increased N2O emissions as compared to MIRI (p < 0.001).
CH4 emissions dominated the global warming potential (GWP) calculated for MIRI, contributing about 96% of its total GWP. In contrast, N2O emissions dominated the GWP in row rice with (FRCC) and without (FR) cover crop, contributing about 94 and 71% for FRCC and FR, respectively. In terms of GWP, decreases in CH4 emissions were offset by increases in N2O for both FR and FRCC. Overall, there were no significant differences in GWP. As a result of relatively similar grain yields and GWP emissions, there was no significant difference in yield scaled GWP (GWPY) across field treatments.

4. Discussion

This field experiment was designed to compare the yield-scaled GHG emissions from furrow-irrigated and continuously flooded rice systems on a commercial farm in eastern Arkansas. Though the three fields were located adjacent to each other, there were differences in soil texture, which may have a confounding effect on measured greenhouse gas fluxes [13,25]. In flooded rice systems, the interactions among water, fertilizer N, and GHG cycle are complex with many processes occurring at different levels. These differences complicate the underlying mechanisms or drivers contributing to net effects on CH4 and N2O emissions [26,27]. It has been determined that the amounts of CH4 and N2O emitted in paddy rice are mainly influenced by processes such as gas production, oxidation and transport from the soil to the environment. At the field level, other soil parameters such as soil texture, in addition to water soluble organic C, mineralizable N, irrigation, and N fertilization may increase or decrease net GHG emissions depending on dominant processes occurring in the soil [28,29,30]. However, at the ecosystem level, water and fertilizer N addition increase plant growth, which both increases C substrate supply for methanoptrophs and denitrifiers/nitrifiers and promotes larger aerenchyma cells for transport of CH4 or N2O gas from the soil to the atmosphere. While various sets of effects dominate the overall GHG efflux in a flooded rice system, it is not the intent of this paper to study the effects of soil texture on CH4 and N2O emissions. Our goal was to determine at the ecosystem level the net effect of row rice cropping practice on CH4 and N2O emissions.

4.1. Grain Yield

A relatively poor and delayed rice stand in the FRCC field may have been due to the delayed termination of cover crops [31]. The time of cover crop termination is one of the biggest challenges for their successful field implementation. Termination of cover crops two weeks prior to crop planting is suggested to avoid the adverse effect of cover crop biomass on planting operations, physical impedance for crop emergence, shading and translocating the herbicide to nontarget plants [31,32]. In this study, the presence of cover crop biomass affected the perfomance of the air seeder during planting such that some rice seeds did not have adequate contact with soil, resulting in reduced germination. In addition, minimal soil tillage in FRCC fields in late spring may have influenced rice emergence [33]. Despite the reduced stand establishment, the rice grain yield from FRCC was similar to the national average of 8.2 Mg ha−1 in 2019 [34].
Row rice has been reported to have reduced grain yields mostly due to yield declines in the upper, nonflooded portions of fields [7]. While lower yields in the upper portion of fields were observed in the current study, the average yield for FR was similar to that of MIRI. The moisture content at 15-cm soil depth in FR remained wetter than the threshold limit of −20 kPa reported to influence grain yield [35]. Fertilizer N management is also a major issue in row rice production. The recommended N fertilizer rate for hybrid XP753 is 168 kg N ha−1 for flooded rice production in Arkansas [36]. The MIRI, FR and FRCC fields actually received 22, 47, and 86 kg N ha−1, respectively, beyond this rate (Table 1). The rough rice yields obtained from MIRI and FR were higher than the 2019 national average yield of 9.2 Mg ha−1 [34], but similar yields were reported from other Arkansas studies [36,37,38,39]. Moreover, the average grain yield for XP753 under continuously flooded regime was 11.6 Mg ha−1 [40].

4.2. Methane Emissions

Soil oxygen content is one of the most important factors influencing CH4 production. The increase in soil oxygen content not only inhibits CH4 but also reduces CH4 emissions by stimulating CH4 oxidation [41,42]. Therefore, water management practices such as alternate wetting and drying (AWD) that introduce oxygen to create aerobic soil conditions during the growing season are considered as a means to reduce rice CH4 emissions [12,13]. Based on the water depth data of the present study, between two and four partial drying events were observed in the bottom of the FR and FRCC fields, respectively. These occurred exclusively during the vegetative stages of rice growth. The reduction in total cumulative CH4 emissions of 50% from the bottom of FR as compared to MIRI was close to that reported by Balaine et al. [43] and global analyses by Jiang et al. [12] with similar AWD drying events. Similarly, the reduction of 93% from the bottom of the FRCC field as compared to MIRI was close to the 83% reduction reported by Linquist et al. [13] for multiple AWD dry-down events analyzed from the U.S. The upper field sections reduced CH4 emissions by more than 94% as compared to bottom sections of both the FR and FRCC fields owing to the aerobic conditions created by nonflooded conditions during gas measurement period.
The cumulative seasonal CH4 emission from MIRI was 44 kg CH4-C ha−1, which is lower than the average seasonal CH4 emissions reported for the Mid-South (146 kg CH4-C ha−1) by Linquist et al. [13]. However, cumulative CH4 emissions ranging from 15 to 77 kg CH4-C ha−1 were reported from different studies conducted in Arkansas fields managed using a continuous flood [22,39,44].

4.3. Nitrous Oxide Emissions

Nitrous oxide is produced in soil by two major pathways: nitrification and denitrification. Both of these processes are strongly affected by soil water content and oxygen availability. N2O emissions are generally low in flooded rice fields as most of the nitrogen is lost as N2 rather than N2O [27]. An introduction of aerobic conditions has often been reported to increase N2O emissions in flooded rice fields [12,45,46]. In this study, N2O emissions were higher in both FR and FRCC as compared to MIRI. The total N2O emissions were not different between FR and FRCC; however, there was a contrasting emissions pattern in top and bottom locations. Higher N2O emissions were observed in FR top and FRCC bottom as soil water condition varied in these treatments as compared to more constant soil water condition in FRCC top and FR bottom. Soil water-filled pore space above 60% was considered optimum for maximum N2O emissions [47]. Though soil porosity was not measured, it is likely that soil moisture conditions in FR and FRCC were sufficient to cause relatively high N2O emissions. The seasonal emissions from FR (4.4 kg N2O-N ha−1) were greater than the average seasonal N2O emissions reported for wheat and maize globally 1.44 and 3.01 kg N2O-N ha−1, respectively [3]. However, it should be noted that higher seasonal emissions up to 4.6–4.9 kg N2O-N ha−1 have been reported for irrigated maize in the U.S. [48].
Higher N2O emissions from both FR and FRCC as compared to MIRI could also be due to higher application of fertilizer. N2O emissions peaked after each N fertilization event in FR and FRCC. The higher N fertilizer-induced N2O emissions in FR might be due to favorable soil water and warm conditions during fertilization. The pronounced effect of N fertilizer on N2O emissions was visible after the second N fertilization events, which coincided with rainfall. Cumulative rain of 36 mm was recorded for five days prior to GHG measurenents as per onsite manual rain-guage reading. Several studies have reported increases in N2O emissions following rainfall events coupled with the presence of high nitrate in the soil [48,49]. Notably, these N fertilizer-induced N2O emissions decreased in the later growing season despite favorable water content and warm weather due to the low amount of mineral nitrogen present in the soil (Figure 1). Similarly, LaHue et al. [50] and Balaine et al. [43] reported low N2O emissions with AWD in later growing season due to low mineral nitrogen present at the time of dry down.

4.4. GWP and Future Directions

The GWP from MIRI (1679 kg CO2 eq ha−1) was within the range of GWP (573–3371 kg CO2 eq ha−1) reported for flooded rice in Arkansas [44,45]. For the MIRI treatment, CH4 dominated the total GWP in accordance with the previous results from flooded rice [12,43,44,45]. In contrast, N2O emissions contributed most, that is, 71 and 94% to the total GWP for FR and FRCC, respectively. Despite the substantial decrease in CH4 emissions in both FR and FRCC, GWP and GWPY were similar to MIRI as higher N2O emissions from both these treatments offset decreases in CH4 emissions. Therefore, improved N fertilizer management options are needed to reduce N2O emissions from FR. Future studies should focus on irrigation water and nitrogen management options that may potentially decrease N2O emissions [51,52] from rice. In this study, gas samples were not collected in the spring immediately after the termination of cover crops. The addition of residues from winter cover-crops termination may affect both CH4 and N2O emissions [16,17] that need to be considered in the future studies.

5. Conclusions

This study is the first to present greenhouse gas emissions from commercial furrow-irrigated rice fields in Arkansas, United States. Our results suggest that furrow irrigation is an effective means to reduce CH4 emissions from traditionally flooded rice fields. However, furrow-irrigated rice also increased N2O emissions, which prevented an overall decrease in total GWP. Rice grain yield was not different in FR and MIRI. However, reduced rice stand establishment in FRCC reduced grain yield. Although our results were relatively benign and further research is required to optimize irrigation and N management, these suggest that growing lowland rice using furrow irrigation has potential to preserve grain yields while not increasing net GWP relative to continuously flooded rice. Taken together, these results suggest that increased N2O flux from furrow irrigated rice may not greatly detract from the potential benefits (e.g., improved flexibility for adapting to changing commodity markets and weather patterns; reduced soil disturbance and labor associated with rice levees) that furrow irrigation offers rice producers.

Author Contributions

Field investigation, laboratory analyses, data analysis, writing—original draft preparation, writing—review and editing, S.K., M.A.A.A.-B., J.H.M.; Conceptualization, funding acquistion, writing—review and editing, M.A.A.A.-B., J.H.M., M.L.R. All authors have read and agreed to the published version of the manuscript.

Funding

The work reported in this article was supported by USDA-ARS National Program 211 Water availability and watershed management.

Acknowledgments

The authors express their gratitude to Mike and Ryan Sullivan, cooperating farmers, for allowing us to conduct this study on their farm. We thank D. Kandanool for providing soil moisture data. We also acknowledge the technical assistance of B. Levenbach, A. Henson, Z. Burchfield, R. Woodruff, W. Larazo, A. Coronado and W. Woodruff.

Conflicts of Interest

The authors declare no conflict of interest.

References

  1. Foley, J.A.; Ramankutty, N.; Brauman, K.A.; Cassidy, E.S.; Gerber, J.S.; Johnston, M.; Mueller, N.D.; O’Connell, C.; Ray, D.K.; West, P.C.; et al. Solutions for a cultivated planet. Nature 2011, 478, 337–342. [Google Scholar] [CrossRef] [PubMed] [Green Version]
  2. Bouman, B.A.M.; Barker, R.; Humphreys, E.; Tuong, T.P.; Atlin, G.; Bennett, J.; Dawe, D.; Dittert, K.; Dobermann, A.; Facon, T.; et al. Rice: Feeding the billions. In Water for Food, Water for Life: Comprehensive Assessment of Water management in Agriculture; Molden, D., Ed.; Earthscan: London, UK, 2007; pp. 515–549. [Google Scholar]
  3. Linquist, B.; Van Groenigen, K.J.; Adviento-Borbe, M.A.; Pittelkow, C.; Van Kessel, C. An agronomic assessment of greenhouse gas emissions from major cereal crops. Glob. Chang. Biol. 2011, 18, 194–209. [Google Scholar] [CrossRef]
  4. Ciais, P.; Sabine, C.; Bala, G.; Bopp, L.; Brovkin, V.; Canadell, J.; Chhabra, A.; DeFries, R.; Galloway, J.; Heimann, M.; et al. Carbon and other biogeochemical cycles. In Climate Change 2013: The Physical Science Basis; Contribution of Working Group I to the Fifth Assessment Report of the Intergovernmental Panel on Climate Change; Stocker, T.F., Qin, D., Plattner, G.-K., Tignor, M., Allen, S.K., Boschung, J., Nauels, A., Xia, Y., Bex, V., Midgley, P.M., Eds.; Cambridge University Press: Cambridge, UK; New York, NY, USA, 2013; pp. 465–570. [Google Scholar]
  5. IRRI. How to Manage Water. 2021. Available online: http://www.knowledgebank.irri.org/step-by-step-production/growth/water-management (accessed on 24 February 2021).
  6. Rijsberman, F.R. Water scarcity: Fact or fiction? Agric. Water Manag. 2006, 80, 5–22. [Google Scholar] [CrossRef] [Green Version]
  7. Stevens, G.; Rhine, M.; Heiser, J. Rice Production with Furrow Irrigation in the Mississippi River Delta Region of the USA. In Rice Crop: Current Developments; Shah, F., Khan, Z.H., Iqbal, A., Eds.; IntechOpen: London, UK, 2018; pp. 69–82. [Google Scholar]
  8. Adviento-Borbe, M.A.A. An agronomic overview of US cereal cropping systems. In Breakfast Cereals and How They Are Made; Alicia, A., Schonauer, S.L., Poutanen, K.S., Eds.; Poutanen Elsevier Oxford: Oxford, UK, 2020; pp. 39–71. [Google Scholar]
  9. Bergtold, J.S.; Ramsey, S.; Maddy, L.; Williams, J.R. A review of economic considerations for cover crops as a conservation practice. Renew. Agric. Food Syst. 2017, 34, 62–76. [Google Scholar] [CrossRef]
  10. Blanco-Canqui, H.; Shaver, T.M.; Lindquist, J.L.; Shapiro, C.A.; Elmore, R.W.; Francis, C.A.; Hergert, G.W. Cover Crops and Ecosystem Services: Insights from Studies in Temperate Soils. Agron. J. 2015, 107, 2449–2474. [Google Scholar] [CrossRef] [Green Version]
  11. Conrad, R. Microbial Ecology of Methanogens and Methanotrophs. Adv. Agron. 2007, 96, 1–63. [Google Scholar] [CrossRef]
  12. Jiang, Y.; Carrijo, D.; Huang, S.; Chen, J.; Balaine, N.; Zhang, W.; van Groenigen, K.J.; Linquist, B. Water management to mitigate the global warming potential of rice systems: A global meta-analysis. Field Crop. Res. 2019, 234, 47–54. [Google Scholar] [CrossRef]
  13. Linquist, B.A.; Marcos, M.; Adviento-Borbe, M.A.; Anders, M.; Harrell, D.; Linscombe, S.; Reba, M.L.; Runkle, B.R.K.; Tarpley, L.; Thomson, A. Greenhouse Gas Emissions and Management Practices that Affect Emissions in US Rice Systems. J. Environ. Qual. 2018, 47, 395–409. [Google Scholar] [CrossRef] [Green Version]
  14. Buresh, R.; Reddy, K.R.; Van Kessel, C. Nitrogen Transformations in Submerged Soils. In Nitrogen in Agricultural Systems; Schepers, J.S., Ruan, W.R., Eds.; Agronomy Monograph 49; ASA: Madison, WI, USA; CSSA: Madison, WI, USA; SSSA: Madison, WI, USA, 2008; pp. 401–436. [Google Scholar]
  15. Klemedtsson, L.; Svensson, B.; Rosswall, T. Relationships between soil moisture content and nitrous oxide production during nitrification and denitrification. Biol. Fertil. Soils 1988, 6, 106–111. [Google Scholar] [CrossRef]
  16. Tang, H.-M.; Xiao, X.-P.; Tang, W.-G.; Wang, K.; Sun, J.-M.; Li, W.-Y.; Yang, G.-L. Effects of Winter Cover Crops Straws Incorporation on CH4 and N2O Emission from Double-Cropping Paddy Fields in Southern China. PLoS ONE 2014, 9, e108322. [Google Scholar] [CrossRef]
  17. Basche, A.D.; Miguez, F.E.; Kaspar, T.C.; Castellano, M.J. Do cover crops increase or decrease nitrous oxide emissions? A meta-analysis. J. Soil Water Conserv. 2014, 69, 471–482. [Google Scholar] [CrossRef] [Green Version]
  18. Basche, A.D.; DeLonge, M.S. Comparing infiltration rates in soils managed with conventional and alternative farming methods: A meta-analysis. PLoS ONE 2019, 14, e0215702. [Google Scholar] [CrossRef] [PubMed] [Green Version]
  19. Basche, A.D.; Kaspar, T.C.; Archontoulis, S.V.; Jaynes, D.B.; Sauer, T.J.; Parkin, T.B.; Miguez, F.E. Soil water improvements with the long-term use of a winter rye cover crop. Agric. Water Manag. 2016, 172, 40–50. [Google Scholar] [CrossRef] [Green Version]
  20. Butterbach-Bahl, K.; Baggs, E.M.; Dannenmann, M.; Kiese, R.; Zechmeister-Boltenstern, S. Nitrous oxide emissions from soils: How well do we understand the processes and their controls? Philos. Trans. R. Soc. B 2013, 368, 20130122. [Google Scholar] [CrossRef] [PubMed]
  21. Mulvaney, R.L. Nitrogen—Inorganic Forms. In Methods of Soil Analysis; Sparks, D.L., Page, A.L., Helmke, P.A., Loeppert, R.H., Soltanpour, P.N., Tabatabai, M.A., Johnston, C.T., Sumner, M.E., Eds.; Book Series No. 5; SSSA: Madison, WI, USA, 1996; pp. 1123–1184. [Google Scholar] [CrossRef]
  22. Adviento-Borbe, M.A.A.; Pittelkow, C.M.; Anders, M.; van Kessel, C.; Hill, J.E.; McClung, A.M.; Six, J.; Linquist, B.A. Optimal fertilizer nitrogen rates and yield-scaled global warming potential in drill deeded rice. J. Environ. Qual. 2013, 42, 1623–1634. [Google Scholar] [CrossRef] [Green Version]
  23. Myhre, G.; Shindell, D.; Bréon, F.-M.; Collins, W.; Fuglestvedt, J.; Huang, J.; Koch, D.; Lamarque, J.-F.; Lee, D.; Mendoza, B.; et al. Anthropogenic and Natural Radiative Forcing. In Climate Change 2013: The Physical Science Basis. Contribution of Working Group I to the Fifth Assessment Report of the Intergovernmental Panel on Climate Change; Stocker, T.F., Qin, D., Plattner, G.-K., Tignor, M., Allen, S.K., Boschung, J., Nauels, A., Xia, Y., Bex, V., Midgley, P.M., Eds.; Cambridge University Press: Cambridge, UK; New York, NY, USA, 2013; pp. 659–740. [Google Scholar]
  24. R Core Team. R: A Language and Environment for Statistical Computing; R Foundation for Statistical Computing: Vienna, Austria, 2019. [Google Scholar]
  25. Brye, K.R.; Rogers, C.W.; Smartt, A.D.; Norman, R.J. Soil Texture Effects on Methane Emissions from Direct-Seeded, Delayed-Flood Rice Production in Arkansas. Soil Sci. 2013, 178, 519–529. [Google Scholar] [CrossRef]
  26. Schimel, J.P. Rice, microbes and methane. Nat. Cell Biol. 2000, 403, 375–377. [Google Scholar] [CrossRef]
  27. Firestone, M.K.; Davidson, E.A. Microbiological basis of NO and N2O production and consumption in soil. In Exchange of Trace Gases between Terrestrial Ecosystems and the Atmosphere; Andreae, M.O., Schimel, D.S., Eds.; John Wiley and Sons Ltd.: Chichester, UK, 1989; pp. 7–21. [Google Scholar]
  28. Chen, Z.L.; Debo, S.; Kesheng, W. Bujun, Features of CH4 emission from rice paddy fields in Beijing and Nanjing. Chemosphere 1993, 26, 239–245. [Google Scholar]
  29. Inubushi, K.; Umebayashi, M.; Wada, H. Methane emission from paddy fields. In Proceedings of the 14th International Congress of Soil Science, Kyoto, Japan, 12–18 August 1990. [Google Scholar]
  30. Cai, Z.; Xing, G.; Yan, X.; Xu, H.; Tsuruta, H.; Yagi, K.; Minami, K. Methane and nitrous oxide emissions from rice paddy fields as affected by nitrogen fertilisers and water management. Plant Soil 1997, 196, 7–14. [Google Scholar] [CrossRef]
  31. Nascente, A.S.; Crusciol, C.A.C.; Cobucci, T.; Velini, E.D. Cover Crop Termination Timing on Rice Crop Production in a No-Till System. Crop Sci. 2013, 53, 2659–2669. [Google Scholar] [CrossRef]
  32. Oliveira, P.; Nascente, A.S.; Kluthcouski, J.; Castro, T.A.P. Corn and soybean yields as affected by cover crops and herbicide timing under no-tillage system. Planta Daninha 2013, 31, 939–946. [Google Scholar] [CrossRef] [Green Version]
  33. Peachey, R.E.; William, R.D.; Mallory-Smith, C. Effect of no-till or conventional planting and cover crops residues on weed emergence in vegetable row crop. Weed Technol. 2004, 18, 1023–1030. [Google Scholar] [CrossRef]
  34. USDA-NASS. United States Department of Agriculture, National Agricultural Statistics Service. 2019. Available online: https://www.nass.usda.gov/Statistics_by_Subject/result.php?88A6A374-4503-3581-BD0A-476C81C8BC40§or=CROPS&group=FIELD%20CROPS&comm=RICE (accessed on 10 January 2020).
  35. Carrijo, D.R.; Lundy, M.E.; Linquist, B.A. Rice yields and water use under alternate wetting and drying irrigation: A meta-analysis. Field Crop. Res. 2017, 203, 173–180. [Google Scholar] [CrossRef]
  36. Roberts, T.; Slaton, N.; Wislon, C.; Norman, R. Soil fertility. In Arkansas Rice Production Handbook; MP192; Hardke, J.T., Ed.; University of Arkansas Division of Agriculture: Little Rock, AR, USA, 2013; pp. 69–101. [Google Scholar]
  37. Humphreys, J.; Brye, K.R.; Rector, C.; Gbur, E.E.; Hardke, J.T. Water management and cultivar effects on methane emissions from direct-seeded, delayed-flood rice production in Arkansas. J. Rice Res. Dev. 2018, 1, 14–24. [Google Scholar]
  38. Rogers, C.W.; Brye, K.R.; Smartt, A.D.; Norman, R.J.; Gbur, E.E.; Evans-White, M.A. Cultivar and Previous Crop Effects on Methane Emissions from Drill-Seeded, Delayed-Flood Rice Production on a Silt-Loam Soil. Soil Sci. 2014, 179, 28–36. [Google Scholar] [CrossRef]
  39. Smartt, A.D.; Brye, K.R.; Norman, R.J. Methane emissions among hybrid rice cultivars in the mid-southern United States. Ann. Adv. Agric. Sci. 2018, 2, 1–13. [Google Scholar]
  40. Hardke, J. Arkansas Rice Cultivar Testing Preliminary Yield Reports; University of Arkansas, Division of Agriculture Research and Extension, Univeristy of Arkansas System: Fayettville, AR, USA, 2019. [Google Scholar]
  41. Ratering, S.; Conrad, R.F. Effects of short-term drainage and aeration on the production of methane in submerged rice soil. Glob. Chang. Biol. 1998, 4, 397–407. [Google Scholar] [CrossRef]
  42. Ma, K.; Lu, Y. Regulation of microbial methane production and oxidation by intermittent drainage in rice field soil. FEMS Microbiol. Ecol. 2011, 75, 446–456. [Google Scholar] [CrossRef]
  43. Balaine, N.; Carrijo, D.R.; Adviento-Borbe, M.A.; Linquist, B. Greenhouse Gases from Irrigated Rice Systems under Varying Severity of Alternate-Wetting and Drying Irrigation. Soil Sci. Soc. Am. J. 2019, 83, 1533–1541. [Google Scholar] [CrossRef]
  44. Simmonds, M.B.; Anders, M.; Adviento-Borbe, M.A.; Van Kessel, C.; McClung, A.; Linquist, B.A. Seasonal Methane and Nitrous Oxide Emissions of Several Rice Cultivars in Direct-Seeded Systems. J. Environ. Qual. 2015, 44, 103–114. [Google Scholar] [CrossRef] [PubMed]
  45. Linquist, B.A.; Anders, M.M.; Adviento-Borbe, M.A.A.; Chaney, R.L.; Nalley, L.L.; Da Rosa, E.F.; Van Kessel, C. Reducing greenhouse gas emissions, water use, and grain arsenic levels in rice systems. Glob. Chang. Biol. 2015, 21, 407–417. [Google Scholar] [CrossRef]
  46. Lagomarsino, A.; Agnelli, A.E.; Linquist, B.; Adviento-Borbe, M.A.; Agnelli, A.; Gavina, G.; Ravaglia, S.; Ferrara, R.M. Alternate wetting and drying of rice reduced CH4 emissions but triggered N2O peaks in a clayey soil of central Italy. Pedosphere 2016, 26, 533–548. [Google Scholar] [CrossRef]
  47. Del Prado, A.; Merino, P.; Estavillo, J.-M.; Pinto, M.; Gonzalez-Murua, C. N2O and NO emissions from different N sources and under a range of soil water contents. Nutr. Cycl. Agroecosyst. 2006, 74, 229–243. [Google Scholar] [CrossRef]
  48. Adviento-Borbe, M.A.A.; Haddix, M.L.; Binder, D.L.; Walters, D.T.; Dobermann, A. Soil greenhouse gas fluxes and global warming potential in four high-yielding maize systems. Glob. Chang. Biol. 2007, 13, 1972–1988. [Google Scholar] [CrossRef]
  49. Karki, S.; Elsgaard, L.; Audet, J.; Lærke, P.E. Mitigation of greenhouse gas emissions from reed canary grass in paludiculture: Effect of groundwater level. Plant Soil 2014, 383, 217–230. [Google Scholar] [CrossRef]
  50. LaHue, G.T.; Chaney, R.L.; Adviento-Borbe, M.A.; Linquist, B.A. Alternate wetting and drying in high yielding direct-seeded rice systems accomplishes multiple environmental and agronomic objectives. Agric. Ecosyst. Environ. 2016, 229, 30–39. [Google Scholar] [CrossRef]
  51. Yao, Z.; Zheng, X.; Zhang, Y.; Liu, C.; Wang, R.; Lin, S.; Zuo, Q.; Butterbach-Bahl, K. Urea deep placement reduces yield-scaled greenhouse gas (CH4 and N2O) and NO emissions from a ground cover rice production system. Sci. Rep. 2017, 7, 11415. [Google Scholar] [CrossRef] [PubMed] [Green Version]
  52. Ruser, R.; Schulz, R. The effect of nitrification inhibitors on the nitrous oxide (N2O) release from agricultural soils-a review. J. Plant Nutr. Soil Sci. 2015, 178, 171–188. [Google Scholar] [CrossRef]
Figure 1. Soil ammonium (NH4+) concentration from top and bottom sections of furrow rice (FR), furrow rice with cover crops (FRCC) and multiple inlet rice irrigation (MIRI) at various sampling dates during the study period.
Agriculture 11 00261 g001
Figure 2. (a) Average daily air temperature and precipitation, (b,c) soil water content (15 cm) at the top and bottom sections of a furrow-irrigated rice field (FR) and a furrow-irrigated rice with cover crops field (FRCC).
Agriculture 11 00261 g002
Figure 3. (a) Soil temperature (0–5 cm) and (b) floodwater depths at the top and bottom sections of a furrow-irrigated rice field (FR), a furrow-irrigated rice with winter cover crop field (FRCC) and a multiple-inlet rice irrigation field (MIRI). Data shown are average ± standard error (n = 5).
Agriculture 11 00261 g003
Figure 4. Rice grain yields at the top and bottom sections of a furrow-irrigated rice field (FR), a furrow-irrigated rice with winter cover crop field (FRCC) and a multiple-inlet rice irrigation field (MIRI) during the 2019 growing season. Data shown are average ± standard error (n = 3). Different letters denote a statistical difference (p < 0.05) among treatments.
Agriculture 11 00261 g004
Figure 5. (a) Methane and (b) nitrous oxide emissions from the top and bottom sections of a furrow-irrigated rice field (FR), a furrow-irrigated rice with winter cover crop field (FRCC) and a multiple-inlet rice irrigation field (MIRI) during the 2019 growing season. Data shown are mean ± standard error (n = 5). Short and long dotted lines represent N fertilizations made to the MIRI and furrow-irrigated rice fields, respectively. Fertilizer was applied only to the top of the FRCC field on 29 July 2019.
Agriculture 11 00261 g005
Table 1. Nitrogen (N) application rate under furrow rice (FR), furrow rice with cover crops (FRCC) and multiple inlet rice irrigation (MIRI) system of rice cultivation.
TreatmentPre-Flood/Prior to First Irrigation (PF) Mid-Season (PF + 9 Days)Mid-Season (PF + 16 Days)Late-Season (PF + 30 Days)Total N Applied
kg N ha−1
FR8282500214
FRCC82825039253
MIRI139050 *0189
* Mid-season N was applied 23 days after the initial (preflood) nitrogen application.
Table 2. Soil characteristics (0–25 cm) from furrow-irrigated rice (FR), furrow-irrigated rice with winter cover crops (FRCC) and multiple-inlet rice irrigation (MIRI) fields studied in northeast Arkansas.
Treatment
(Field Location)
TextureSand
(g kg−1)
Silt
(g kg−1)
Clay
(g kg−1)
C
(g kg−1)
N
(g kg−1)
pHElectrical Conductivity
(dS m−1)
Cation Exchange Capacity
(cmol kg−1)
FR (Top)Loam42537520091.07.10.119.2
FR (Bottom)Loam350450200121.16.90.221.4
FRCC (Top)Clay loam250450300121.17.10.225.3
FRCC (Bottom)Clay loam275425300111.170.125.9
MIRI (Top paddy)Clay175375450121.37.20.335.7
MIRI (Bottom paddy)Clay200375425111.37.20.232.5
Table 3. Various yield components of rice from top and bottom sections of furrow rice (FR), furrow rice with cover crops (FRCC) and multiple inlet rice irrigation (MIRI). Data shown are average ± standard error (n= 3).
TreatmentTiller Number m−2Panicle Number m−2Plant Height (cm)Harvest Index1000 Seed Grain Weight * (g)
FR Top364 ± 26360 ± 2885.1 ± 3.30.56 ± 0.0425.8 ± 0.5
FR Bottom407 ± 40401 ± 3797.5 ± 0.80.56± 0.0223.5 ± 0.6
FRCC Top253 ± 8247 ± 1089.4 ± 1.80.58 ± 0.0425.3 ± 1.6
FRCC Bottom280 ± 33278 ± 3396.5 ± 3.30.57 ± 0.0123.8 ± 1.1
MIRI Top429 ± 64422± 63102 ± 7.60.52 ± 0.0224.7 ± 0.9
MIRI Bottom432 ± 25424 ± 27102 ± 4.30.53 ± 0.0325.6 ± 0.4
* Adjusted to 14% of moisture content.
Table 4. Cumulative CH4 and N2O emissions, total global warming potential (GWP) and yield scaled GWP (GWPY) of rice from top and bottom sections of furrow rice (FR), furrow rice with cover crops (FRCC) and multiple inlet rice irrigation (MIRI) system of rice cultivation during cropping season of 2019. Data shown are average ± standard error (n = 5). Different letters denote statistical difference (p < 0.05) among treatments.
TreatmentCH4 Emissions
(kg CH4-C ha−1 Season−1)
N2O Emissions
(kg N2O-N ha−1 Season−1)
Total GWP
(kg CO2 eq. ha−1 Season−1)
GWPY
(kg CO2 eq. Mg−1 Season−1)
FR Top1.3 ± 0.5 c7.4 ± 1.2 a3122 ± 479 a343 ± 53 a
FR Bottom21.8 ± 4.1 a1.5 ± 0.3 b,c1449 ± 260 a99 ± 18 b,c
FRCC Top0.2 ± 0.2 c0.9 ± 0.2 c380 ± 72 b48 ± 9 c
FRCC Bottom5.6 ± 1.1 b5.0 ± 1.3 a,b2307 ± 525 a253 ± 58 a,b
MIRI43.8 ± 6.6 a0.1 ± 0.1 d1679 ± 240 a140 ± 20 b
Publisher’s Note: MDPI stays neutral with regard to jurisdictional claims in published maps and institutional affiliations.

