Article

Simulating the Long-Term Effects of Fertilizer and Water Management on Grain Yield and Methane Emissions of Paddy Rice in Thailand

by
Nittaya Cha-un
1,2,3,
Amnat Chidthaisong
1,2,3,
Kazuyuki Yagi
1,2,4 and
Sirintornthep Towprayoon
1,2,3,*
1
The Joint Graduate School of Energy and Environment (JGSEE), King Mongkut’s University of Technology Thonburi, 126 Prachauthit Rd, Bangmod, Tungkru, Bangkok 10140, Thailand
2
Center of Excellence on Energy Technology and Environment, PERDO, Ministry of Education, Bangkok 10140, Thailand
3
Earth System Science Research and Development Center (ESS), King Mongkut’s University of Technology Thonburi, 126 Prachauthit Rd, Bangmod, Tungkru, Bangkok 10140, Thailand
4
Institute for Global Environmental Strategies (IGES), 2108-11 Kamiyamaguchi, Hayama 240-0115, Japan
*
Author to whom correspondence should be addressed.
Agriculture 2021, 11(11), 1144; https://doi.org/10.3390/agriculture11111144
Submission received: 28 September 2021 / Revised: 6 November 2021 / Accepted: 8 November 2021 / Published: 15 November 2021
(This article belongs to the Special Issue Greenhouse Gas Mitigation in Agriculture)

Abstract

:
Rice is an important economic crop in Thailand. However, paddy rice fields are one of the largest anthropogenic sources of methane (CH4) emissions. Therefore, suitable crop management practice is necessary to reduce CH4 emissions while rice grain yield is maintained. This study aimed to evaluate appropriate options of fertilizer and water management practices for Thai rice cultivation with regards to improving rice grain yield and reducing CH4 emissions. The Denitrification–Decomposition (DNDC) model was used to simulate grain yield and the emission of CH4 under the three fertilizer options (chemical fertilizer (F), manure (M) and chemical fertilizer + manure (F + M)) with three water management options (continuous flooding (CF), mid-season drainage (MD) and alternate wet and dry (AWD)) during the years 2011–2050. Rain-fed and irrigated rice cropping systems were used. A total of 24 sites distributed in 22 provinces were studied. The data sets of daily climate, soil properties, and rice management practices were required as inputs in the model. Model validation with observation data in a field experiment indicated that simulated grain yields (R2 = 0.83, slope = 0.98, NRMES = 0.30) and cumulative seasonal CH4 emissions (R2 = 0.83, slope = 0.74, NRMES = 0.43) were significantly and positively correlated with the observation. At the end of the simulation period (2046–2050), fertilizer management options of F and F + M gave more grain yield than the M management option by 1–44% in rain-fed rice cropping and 104–190% in irrigated rice cropping system, respectively. Among options, the lower CH4 emissions were found in AWD water management options. The appropriate options with regard to maintaining grain yield and reducing CH4 emissions in the long term were suggested to be F + M with AWD for the rain-fed rice, and F with AWD for the irrigated rice cropping systems.

1. Introduction

Rice (Oryza sativa L.) is the main food crop for half of the world’s population. About 90% of the world’s rice is produced in Asia [1]. In Thailand, rice cultivation makes up over 60% of agricultural land [2]. In 2019, Thailand produced about 30 million metric tons of rice, ranked sixth among the global rice producers and second among rice-exported countries [1]. Despite this large volume of export, Thailand’s rice production has relatively low productivity when compared to other rice-growing countries [2]. The average yield of Thailand’s rice (2000 kg ha−1) is 60, 59, 45, 34 and 25% lower than that in Japan, China, Vietnam, Indonesia and the Philippines, respectively. However, rice remains the preeminent crop in Thailand, although its relative importance has been decreasing in recent decades. From 2010 to 2018, the rice-harvested areas and rice production have decreased over 10%. During this period, the value of rice production was reduced by 19–30% [2].
Rice cultivation in Thailand can be classified into four ecosystems. Rain-fed lowland (75%) is the main rice ecosystem, followed by irrigated (19%), deep water (5%) and upland (1%) [3]. In addition, there is also a regional preference in the cultivation of rice varieties. Over 60% of the major rice cultivation areas are located in the Northeast (NE). The glutinous rice variety RD6 is mainly cultivated in the upper Northeast (U-NE) (64%), whereas Hom Mali or fragrant rice (KDML 105, RD15) (95%) is cultivated in the lower Northeast (L-NE). Although the quality of Hom Mali rice is high, the average yield is low in L-NE (2.1 t ha−1) compared to the other varieties and regions (2.5–4.3 t ha−1) [3,4]. There are also other factors that influence rice productivity in these cultivation areas. For example, irrigation potential in the Northeast is limited (5%). Moreover, climate variability, poor soil, salinity, droughts and floods have become common and greatly affect rice production. On the other hand, in the Central (C), Western (W) and Eastern (E) regions, rice is intensively cultivated on more fertile alluvial soils. Double-cropping of rice per year is usually found in these regions due to the availability of water from irrigation networks. These regions produce white rice with various rice varieties. The common varieties are Patum Thani 1 (PTT 1), Suphan Buri 1 (SPR 1), and Chainat 1 (CNT 1). The yield of these varieties is usually 4–6 t ha−1 [3].
In Thailand, the second largest source of greenhouse gas (GHG) emissions is the agriculture sector. Thailand’s Biennial Updated Reported (BUR) indicates that the emissions from Thai agriculture have increased from 41.91 million tons CO2e in 2000 to 50.92 million tons CO2e in 2013, an increase of 21.50% [5]. Agriculture is the main source of CH4 and N2O emissions, contributing for 76.71% of total CH4 from agriculture [5]. In flooded rice cultivation, CH4 is produced in anaerobic soil through organic matter fermentation by methanogenic bacteria [6]. Emissions of CH4 are controlled by a variety of factors, including soil conditions, agronomic inputs, and field management practices. Among factors, water regime and fertilizer application practices are known to be important factors in controlling CH4 and N2O emissions [7,8,9,10,11]. Mid-season drainage (MSD or MD) has been widely adopted in China and Japan over the past decades as a strategy to increase rice grain yield and mitigate GHG emissions [12,13]. Alternate wetting and drying (AWD) has been developed and is being extended by the International Rice Research Institute (IRRI) and its partners to many rice-producing countries, to reduce the consumption of irrigation water and reduce net GHG emissions without compromising rice yields [10,11,14]. On the other hand, applications of organic matter such as crop residue and manure have also been practiced to promote soil organic carbon (SOC) stocks, but their effects on enhancing CH4 emissions from rice fields are well known [15]. Therefore, optimizing the amount of fertilizer and organic matter applied to the soil with water management by MD and AWD could be one option to reduce CH4 emissions while maintaining or even increasing grain yields. This could be an option for sustainable rice production in Thailand. However, before it is introduced to farmers for farm-level practices, it should be carefully considered and evaluated. In fact, in the long term, the observation of many parameters, and thus the evaluation of a given option in rice cultivation as mentioned above, is difficult due to spatial differences in environmental factors (air temperature, soil properties, rainfall), and the dynamism of field management practices (e.g., rice varieties, residue return, water regimes, amount of organic matter amendment, fertilization) that are normally changed in every cropping season. Time limitations and expenses are also important factors preventing an evaluation of such an option over the whole area through field campaigns.
The modeling approach to realize the long-term variation of rice grain yield, SOC sequestration, and GHG emissions under different environmental factors and field management practices is especially useful for this purpose. Use of the model does not only improve the understanding of internal mechanisms, but also helps in saving time and the research budget [16]. The denitrification–decomposition (DNDC) model is a computer simulation based on biogeochemical processes that has been developed for predicting carbon and nitrogen cycling in agroecosystems [17]. This model has been applied successfully in various ecosystems and management conditions to simulate long-term SOC dynamics and other related variables such as crop yields [18,19,20,21,22]. In addition, the long-term GHG emissions and their patterns throughout the rice growing period can also be well simulated by the DNDC model [23,24,25,26,27]. However, there have been only a few studies of Thai rice cultivation under different rice varieties and management options for fertilizer and water.
The objective of this study was to evaluate appropriate options of fertilizer and water management practices for Thai rice cultivation with regards to improving rice grain yield and reducing CH4 emissions. The DNDC model was applied to investigate the long-term effects of fertilizer and water management practices in order to find appropriate management options and to provide options for improving rice grain yield with low GHG emissions in the long term.

2. Materials and Methods

In this study, the DNDC model (version 9.5) was validated against field observation data from a two-year field study in a Thai rice field [15], and then was used to simulate 40 years (2011–2050) of fertilizer and water management practices to estimate the changes in rice grain yield and GHG emissions for five dominant rice varieties in 24 study sites in Thailand.

2.1. Model Description

The DNDC model is a process-based biogeochemical model that simulates the transformation of soil carbon (C) and nitrogen (N) in an agroecosystem. The structure of the DNDC model is reorganized into two components with six sub-models. The first component links ecological drivers to soil climate, crop growth and decomposition sub-models. The second component links soil environmental variables to trace gases and consists of denitrification, nitrification and fermentation sub-models [28].
This model was first described and developed by Li et al. [17,29]. The model is in-tended to be used for estimating the effects of climate change, land use, agricultural management, soil properties, and atmospheric nitrogen deposition on soil C and N dynamics [30]. During the last two decades, the DNDC model has been used by researchers throughout the world. The original one has been modified and adapted to include different scenarios and other ecosystems such as rice paddies, wetlands and forests. As presented in the 9.5 version, DNDC has also been developed and improved in simulations of crop growth, nitrification inhibitor application, slow-release fertilizers, sprinkler and drip irrigation, plastic film mulching, etc., to meet the demand for GHG mitigation studies [31]. Gilhespy et al. [31] suggested that this current version has inherited all historical modifications and improvements. It provides an appropriate modeling framework for the long-term simulation of crop yield, SOC stock change and GHG emissions in the rice field ecosystems. Therefore, the version of DNDC 9.5 (open source, downloaded from http://www.dndc.sr.unh.edu/, accessed on 28 September 2021) was used in the present study.

2.2. Validation of the Model Performance

In order to examine the model reliability, a two-year field experiment data set by Cha-un et al. [15] was used to simulate and validate the changes in rice grain yield, SOC stock, and emissions of CH4 and N2O under the different fertilizer management options and cropping systems (Table 1).

2.2.1. Experimental Design

The field experiment of Cha-un et al. [15] was conducted at the Ratchaburi campus, King Mongkut’s University of Technology Thonburi (13°35′ N, 99°30′ E) in 2010 and 2011. The soil texture was sandy loam (53% sand, 45% silt and 2% clay). Other soil properties were 1.75 g cm−3 bulk density, pH 5.8, 0.69% organic matter and 0.40% organic carbon. The means of daily air temperatures were 27.9 °C and 26.7 °C in 2010 and 2011, respectively. The annual rainfall accumulation amounts were 1063 mm and 1022 mm in 2010 and 2011, respectively. Different rice cropping systems were carried out to investigate the effect of crop–rice rotation systems on GHG emissions, soil carbon sequestration, and rice yield. These were fallow–rice (RF), rice–rice (RR), corn–rice (RC) and sweet sorghum–rice (RS).

2.2.2. Model Input

As the main input data, the DNDC model requires soil, climate and field management data to simulate SOC stock, crop yield and GHG emissions from the rice fields. In order to test the performance of the DNDC model under the different fertilizer management options and cropping systems, the field management data were collected from RF and RR treatments. In 2010, RF and RR received both manure and chemical fertilizers (M + F), while in 2011, the plots received only chemical fertilizer (F). The treatments of RF and RR were represented as the single rain-fed rice cropping and double-irrigated rice cropping systems, respectively. The crop calendar and field management practices of these treatments are provided in Table 1.

2.2.3. Statistical Analysis

The simulated SOC stock, crop yield and emissions of CH4 and N2O were compared with the observed data [15]. The coefficient of determination (R2) and the normalized root mean square error (NRMSE) were used in order to evaluate the goodness of fit and model performance [32]. The correlations between the observation and simulation data were calculated by Pearson correlations at the 0.05 level (2-tailed). One-way analysis of variance (ANOVA) calculations and Duncan’s multiple range tests (MRT) at the 0.05 level (p < 0.05) (SPSS Statistics 17.0 for Windows) were used for analysis of the different means of simulated grain yields and CH4 emissions of each rice variety at the start and end of the simulation period.

2.3. Long-Term Simulations of Multi-Site Location

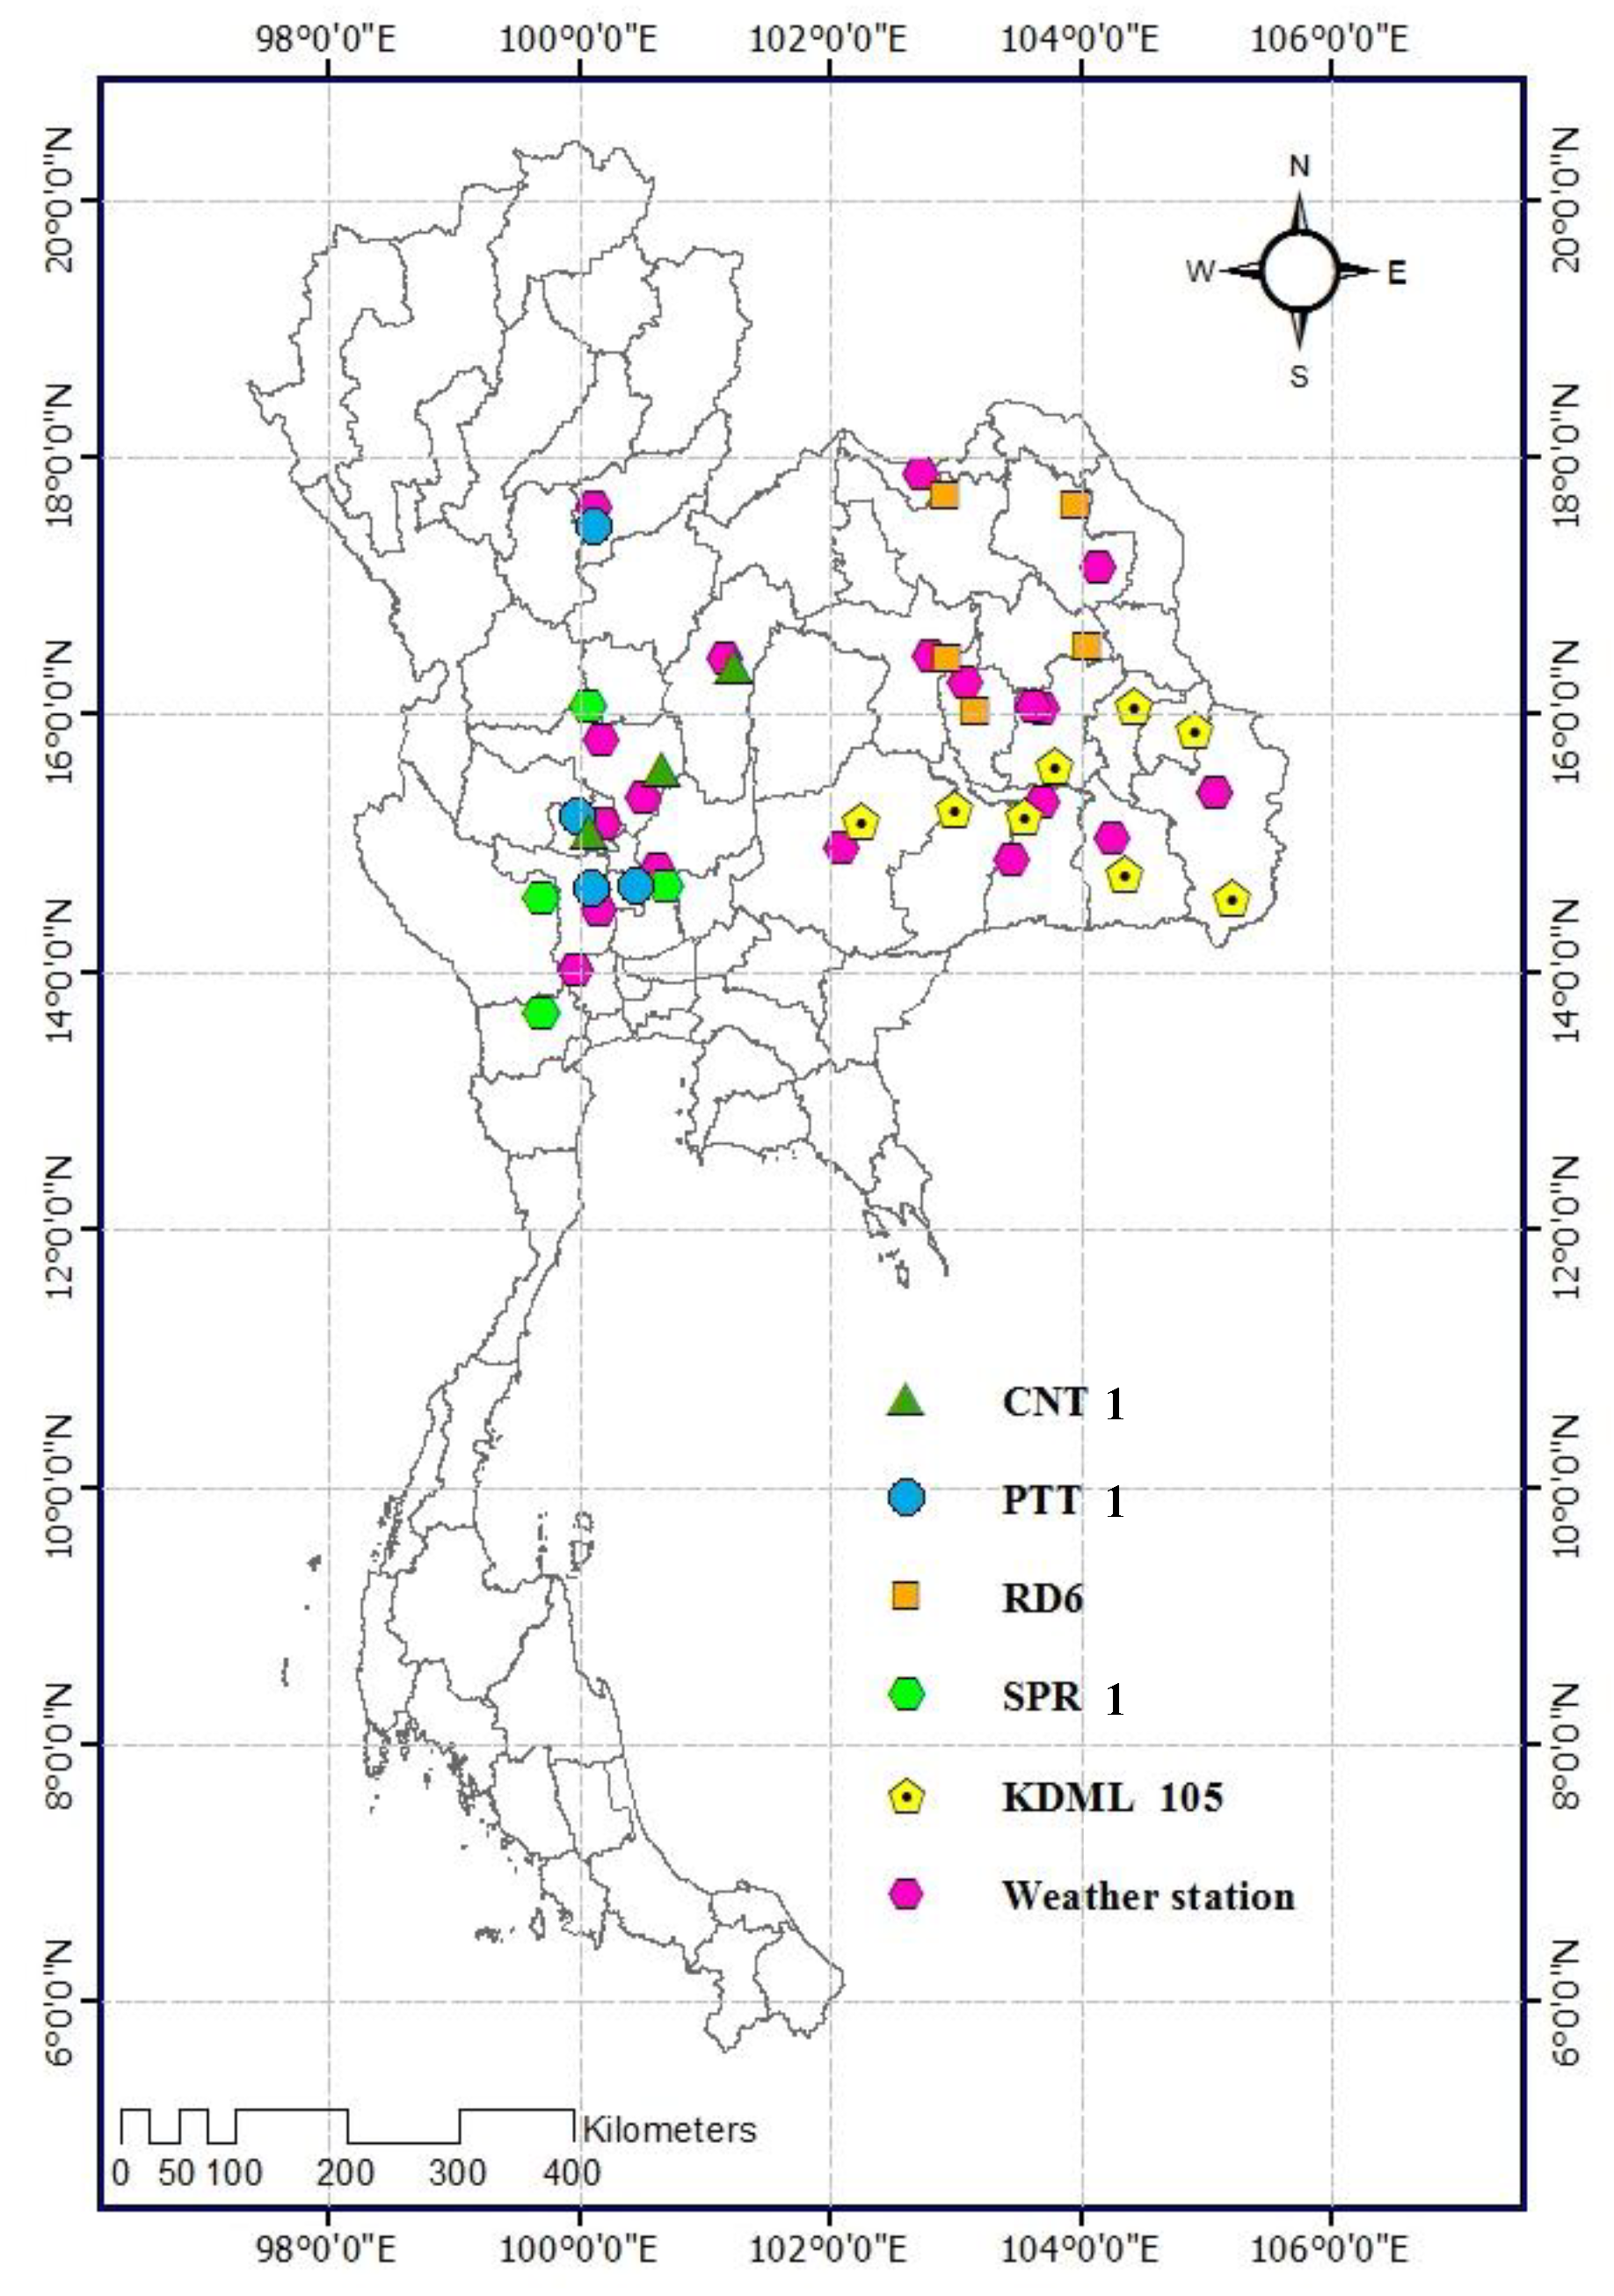
2.3.1. Rice Varieties and Site Locations

The rice varieties and study sites were selected from the annual crop data for 2016 provided by the Rice Department (RD) and the Department of Agricultural Extension, Ministry of Agriculture and Cooperatives [3]. The groups of five dominant rice varieties were based on the amount consumed and exported. These include (1) Hom Mali rice (Khao Dawk Mali 105 (KDML 105)), (2) Glutinous rice (Kao Khao 6 (RD6)), (3) Fragrant rice (Patum Thani 1 (PTT 1), (4) White rice (Suphan Buri 1 (SPR 1) and Chainat 1 (CNT 1)) (Figure 1). In addition, two rice cropping systems were used, including (1) single rain-fed-rice cropping represented by KDML 105 and RD6, and (2) double irrigated-rice cropping represented by PTT 1, SPR 1, and CNT 1.
KDML 105 and RD6 are photoperiod-sensitive varieties and flower in late October, regardless of planting time. These varieties are grown only once a year during the wet or rainy season (July to December). The varieties PTT 1, SPR 1 and CNT 1 are non-photosensitive rice varieties, and are able to grow twice a year in some irrigated areas, for both major rice during the wet season and second rice during the dry season [33].
There were 24 study sites selected from the provinces where the cumulative har-vested area of each rice variety was more than 50% of the total harvested area of each variety (Figure 1). The lists of five rice varieties and 24 study sites are provided below.
(1)
KDML 105 (eight provinces): Ubon Ratchathani, Nakhon Ratchasima, Srisaket, Roi-et, Buriram, Surin, Yasothon and Amnat Charoen
(2)
RD6 (five provinces): Khon Kaen, Sakon Nakhon, Udon Thani, Kalasin and Ma-ha Sarakham
(3)
PTT 1 (four provinces): Uttaradit, Chai Nat, Suphan Buri and Ang Thong
(4)
SPR 1 (four provinces): Nakhon Sawan, Ratchaburi, Saraburi and Kanchanaburi
(5)
CNT 1 (three provinces): Phetchabun, Nakhon Sawan and Chai Nat

2.3.2. Data Collection and Long-Term Simulation

For multi-site simulation in the long term, the soil data were compiled from the database of the Land Development Department of Thailand [34]. The soil data set included soil texture, clay fraction, bulk density, pH, and SOC at the surface (0–10 cm). Soil properties from the 24 study sites with five rice varieties are summarized in Table 2.
The model also requires climate data such as daily maximum and minimum air temperatures, and rainfall. Simulating with the DNDC model requires a spin-up time to reach a near-steady-state level of soil organic carbon pool before the main simulation years. According to the modeling of DNDC-Rice by Fumoto et al. [35] and Minamikawa et al. [36], the spin-up was performed for a period of 20 years. Therefore, this study followed these established practices by performing a 20-year spin-up (1991 to 2010) and a 40-year future projection (2011 to 2050) for each site with continuous climate observation data and the fixed crop calendar and crop management practices of the crop. A long-term simulation was then generated for an annual output over these 60 years (1991–2050). Daily weather data sets (1991–2016) at each site were obtained from the observation stations of the Thailand Meteorological Department (TMD), situated within 10 km of the site. The locations of each study site and weather station from TMD are shown in Figure 1. As for the future projections, the daily climate data sets (2017–2050) were obtained from PRECIS regional climate model outputs with the GCM ECHAM4 and SRES B2 [37].
Each study site was planted with different rice varieties and management practices. This information was also needed to input and run the DNDC model. The crop calendar and field management practices (Figure 2) for each site were compiled from the government published reports, supplemented data from the Rice Department [3,38] and the Office of Agricultural Economics, Ministry of Agriculture and Cooperatives [2]. Based on this information, farmers grow photosensitive rice varieties (KDML 105 and RD6) as single rice cropping even in the wet season. In contrast, PTT 1, SRP 1 and CNT 1 are non-photosensitive rice varieties, which are adapted to the double rice cropping system. The field management option scenarios of fertilizers and water are listed in Table 3. The traditional management practices and rice variety at each study site were defined as the baseline scenarios. The rates and modes of chemical fertilizer applications were based on the recommendation of the Rice Department [38] that fertilizers are applied two times per cropping season at the rate of 38.75 (20.00 and 18.75) kg N ha−1 crop−1 for KDML 105 and RD6, and 121.25 (35 and 86.25) kg N ha−1 crop−1 for PTT 1, SPR 1 and CNT 1, respectively. Cow manure was incorporated once a year for KDML 105 and RD6, and twice a year for PTT 1, SPR 1 and CNT 1 at the first tillage event of each cropping. Three water management options, including CF, MD, and AWD, were adopted (Figure 2).
The effects of three fertilizer managements (F, M and F + M) with three water managements (CF, MD and AWD) on the simulated grain yield and emissions of CH4 were then analyzed. The means of simulated grain yields and CH4 emissions at the start (2011 to 2015) and the end (2046 to 2050) of the projection period were compared among the different management scenarios for each rice variety at 95% confidence intervals (CIs) [36].

3. Results

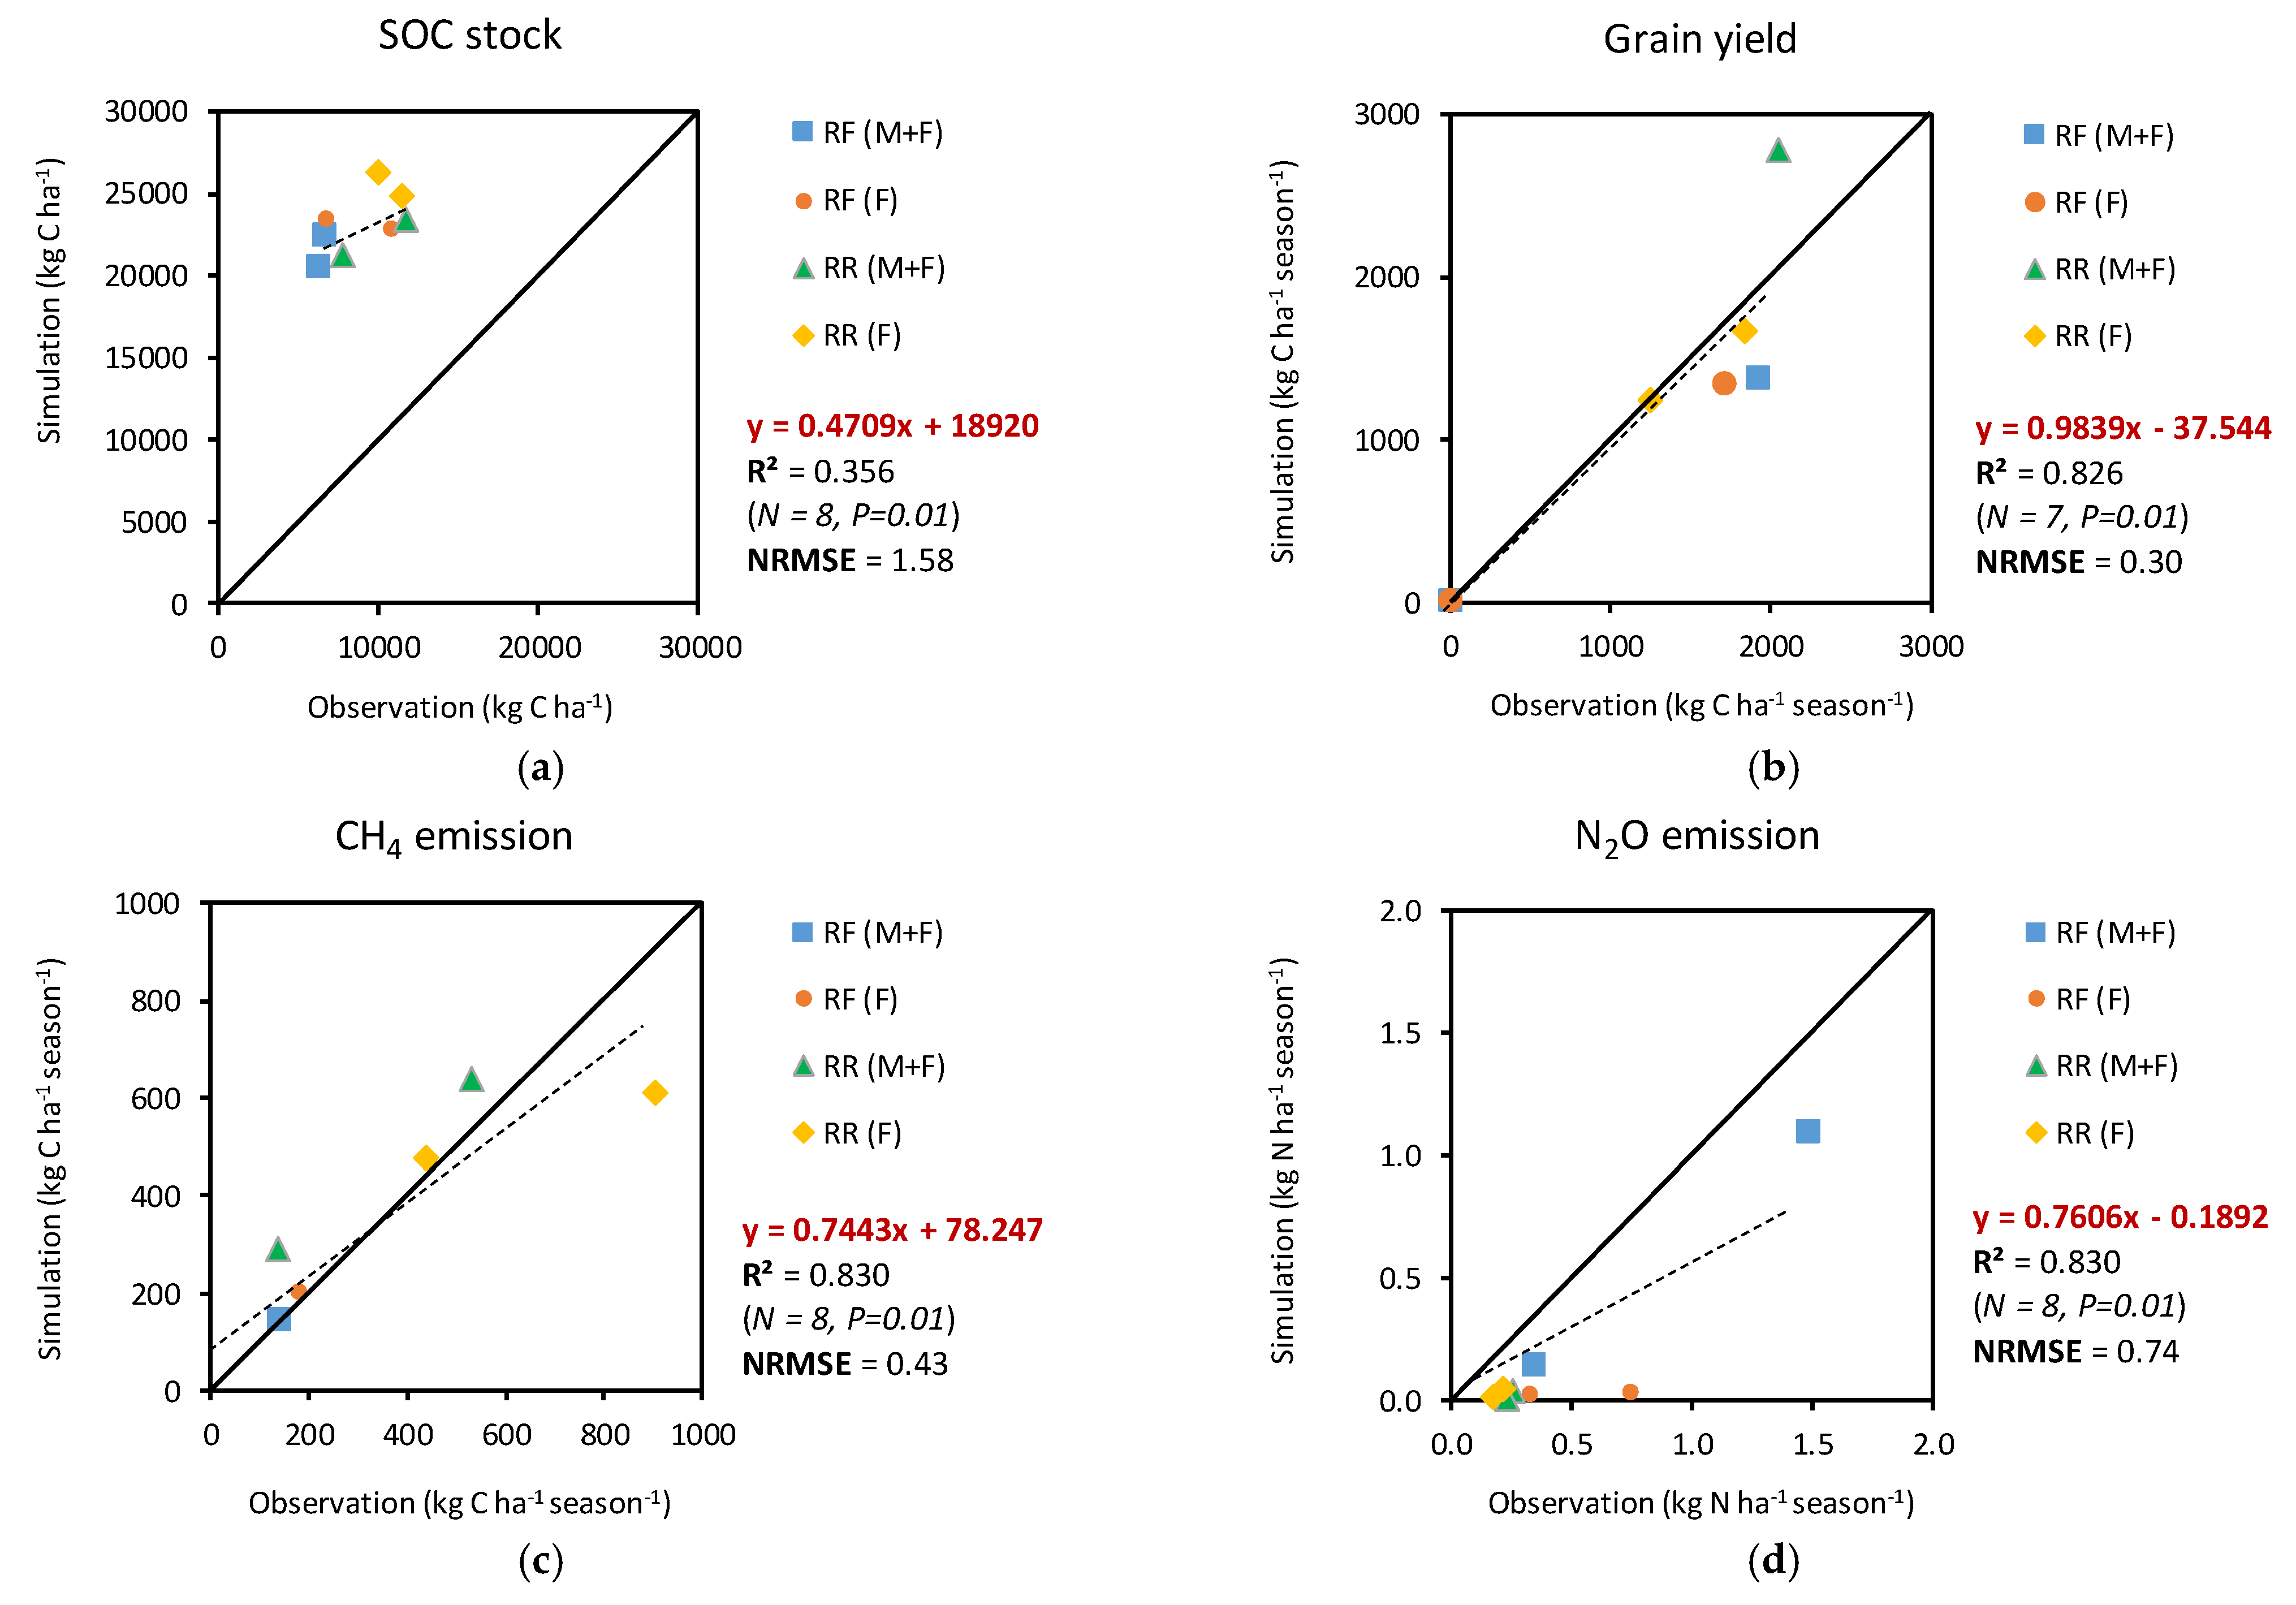
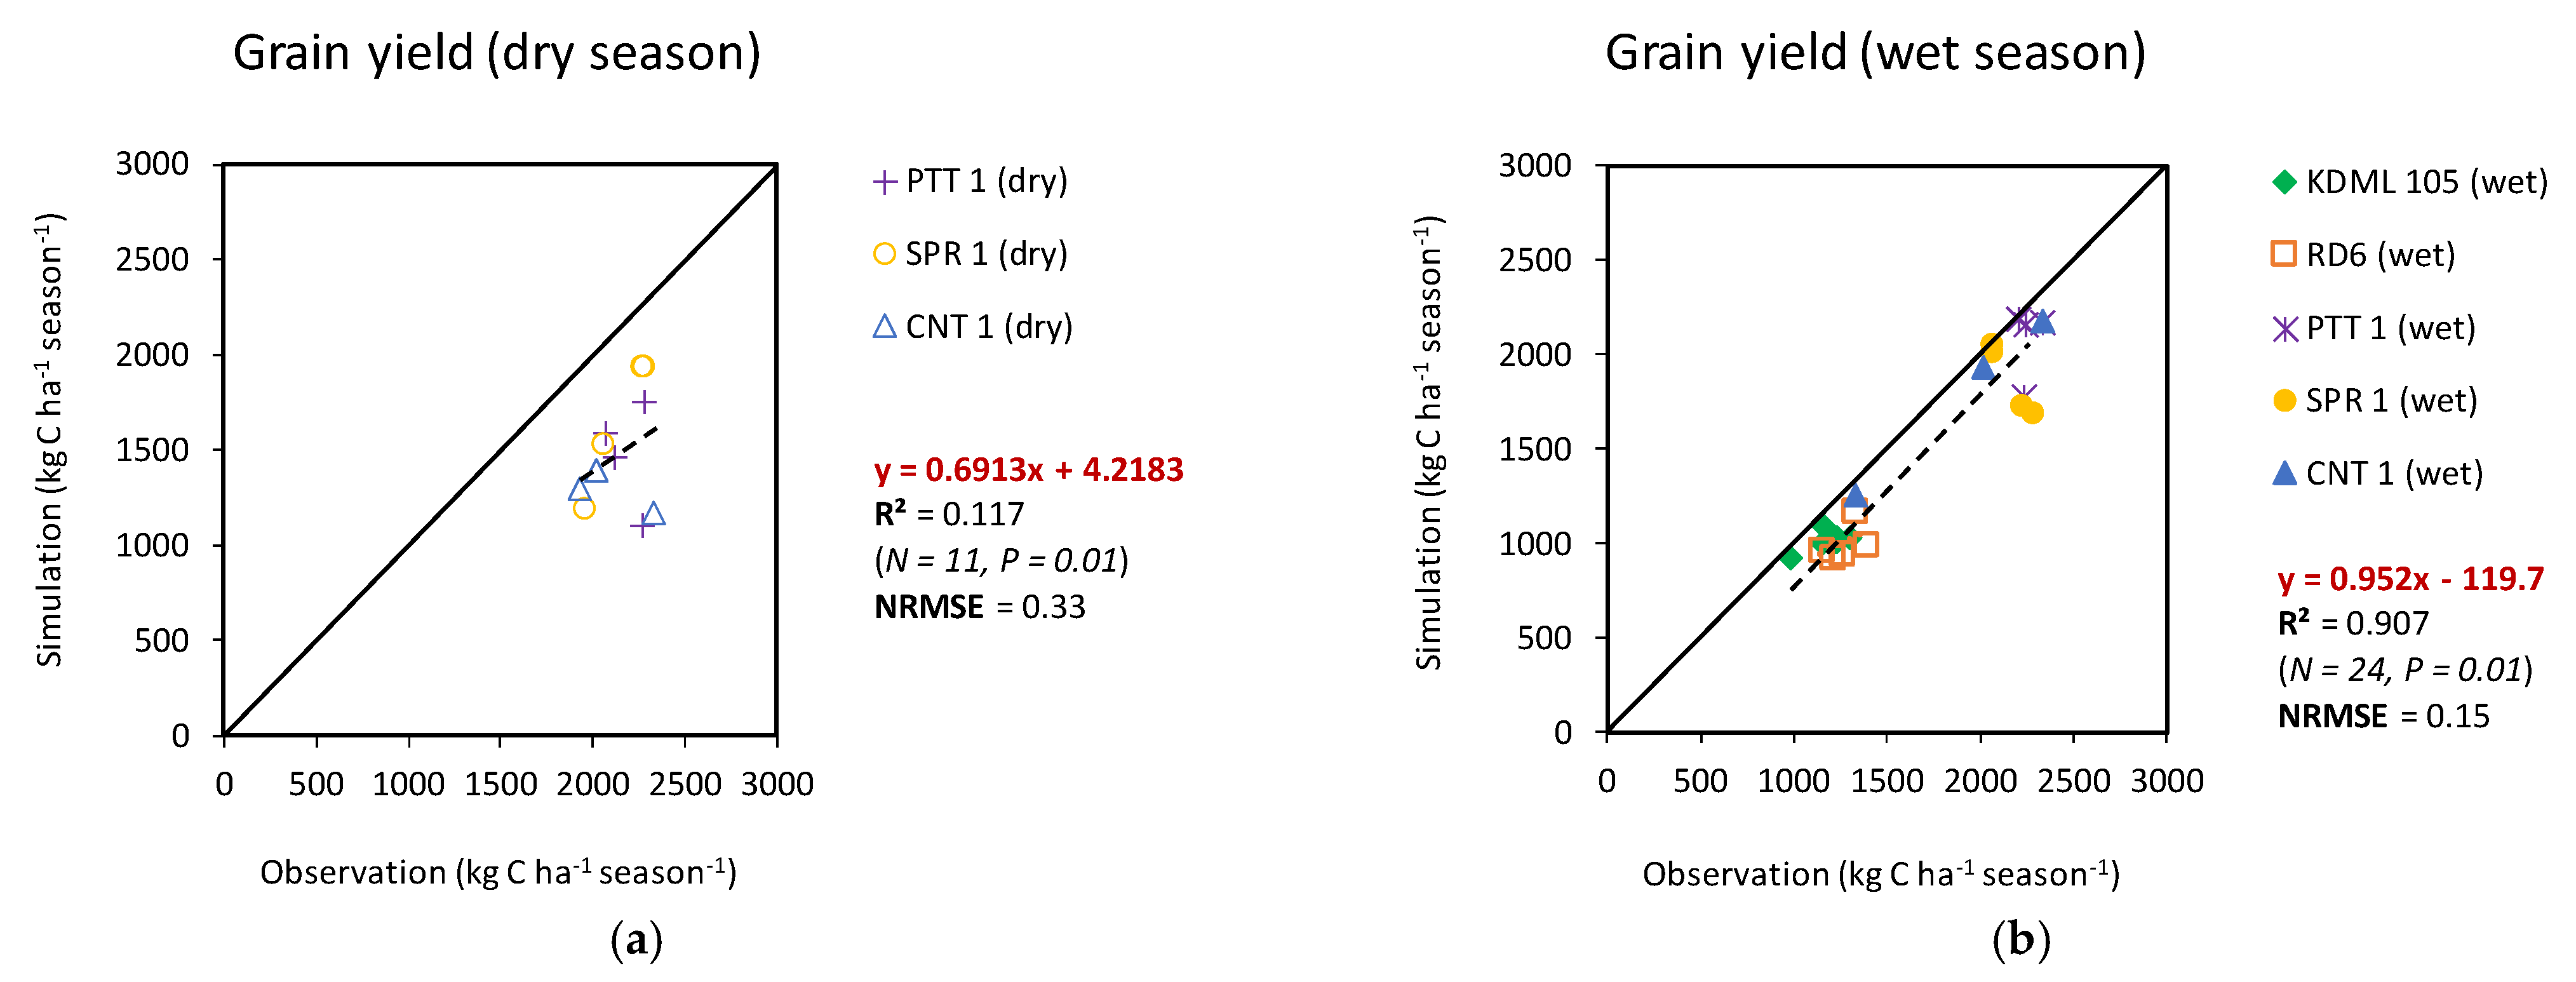
3.1. Model Validation

The results of the correlation analysis between the observation data from field experiments in two consecutive years and the DNDC simulation are presented in Figure 3. The simulated SOC stocks in both cropping systems (RF and RR) and fertilizer management practices (M + F and F) were overestimated (Figure 3a) and their relationship between observation and simulation (R2 = 0.356, NRMES = 1.58) was not very good, probably due to the fact that it was a short-term study.
On the other hand, the results of simulation agreed well with those of observation in grain yields (R2 = 0.826, slope = 0.984, NRMES = 0.30) (Figure 3b) and cumulative seasonal CH4 emissions (R2 = 0.830, slope = 0.744, NRMES = 0.43) (Figure 3c), which indicates that the model performed well for both output parameters.
The simulated cumulative seasonal N2O emissions were underestimated in all cropping systems and fertilizer management practices (Figure 3d). It should be noted that the results of SOC stocks and N2O emissions in the validation with the observation data (Figure 3a,d) show that the model performed poorly. Therefore, this study focused on grain yield and CH4 emissions in the long-term simulation for the 24 study sites.
Based on the results of the model validation above, another model validation for grain yield during the 20-year spin-up simulation for the traditional management practice (baseline) of each rice cultivar was performed. For the target year 2010, significant positive correlations (p ≤ 0.01, 2-tailed) were found between observation and simulation (Figure 4a,b). It is noteworthy that the simulated results for grain yields of all varieties in the dry and wet seasons were underestimated. The varieties of PTT 1, SPR 1 and CNT 1 in the dry season were underestimated by 14.98 to 51.51% (R2 = 0.12, slope = 0.69, NRMSE = 0.33) (Figure 4a), whereas all varieties in the wet season were underestimated by 0.33 to 27.93% (Figure 4b). Although the simulated grain yields in the wet season were underestimated, they were relatively consistent with the observations (R2 = 0.91, slope = 0.95, NRMSE = 0.15) (Figure 4b). In order to investigate it in the long term, only the simulated grain yields in the wet season were considered.

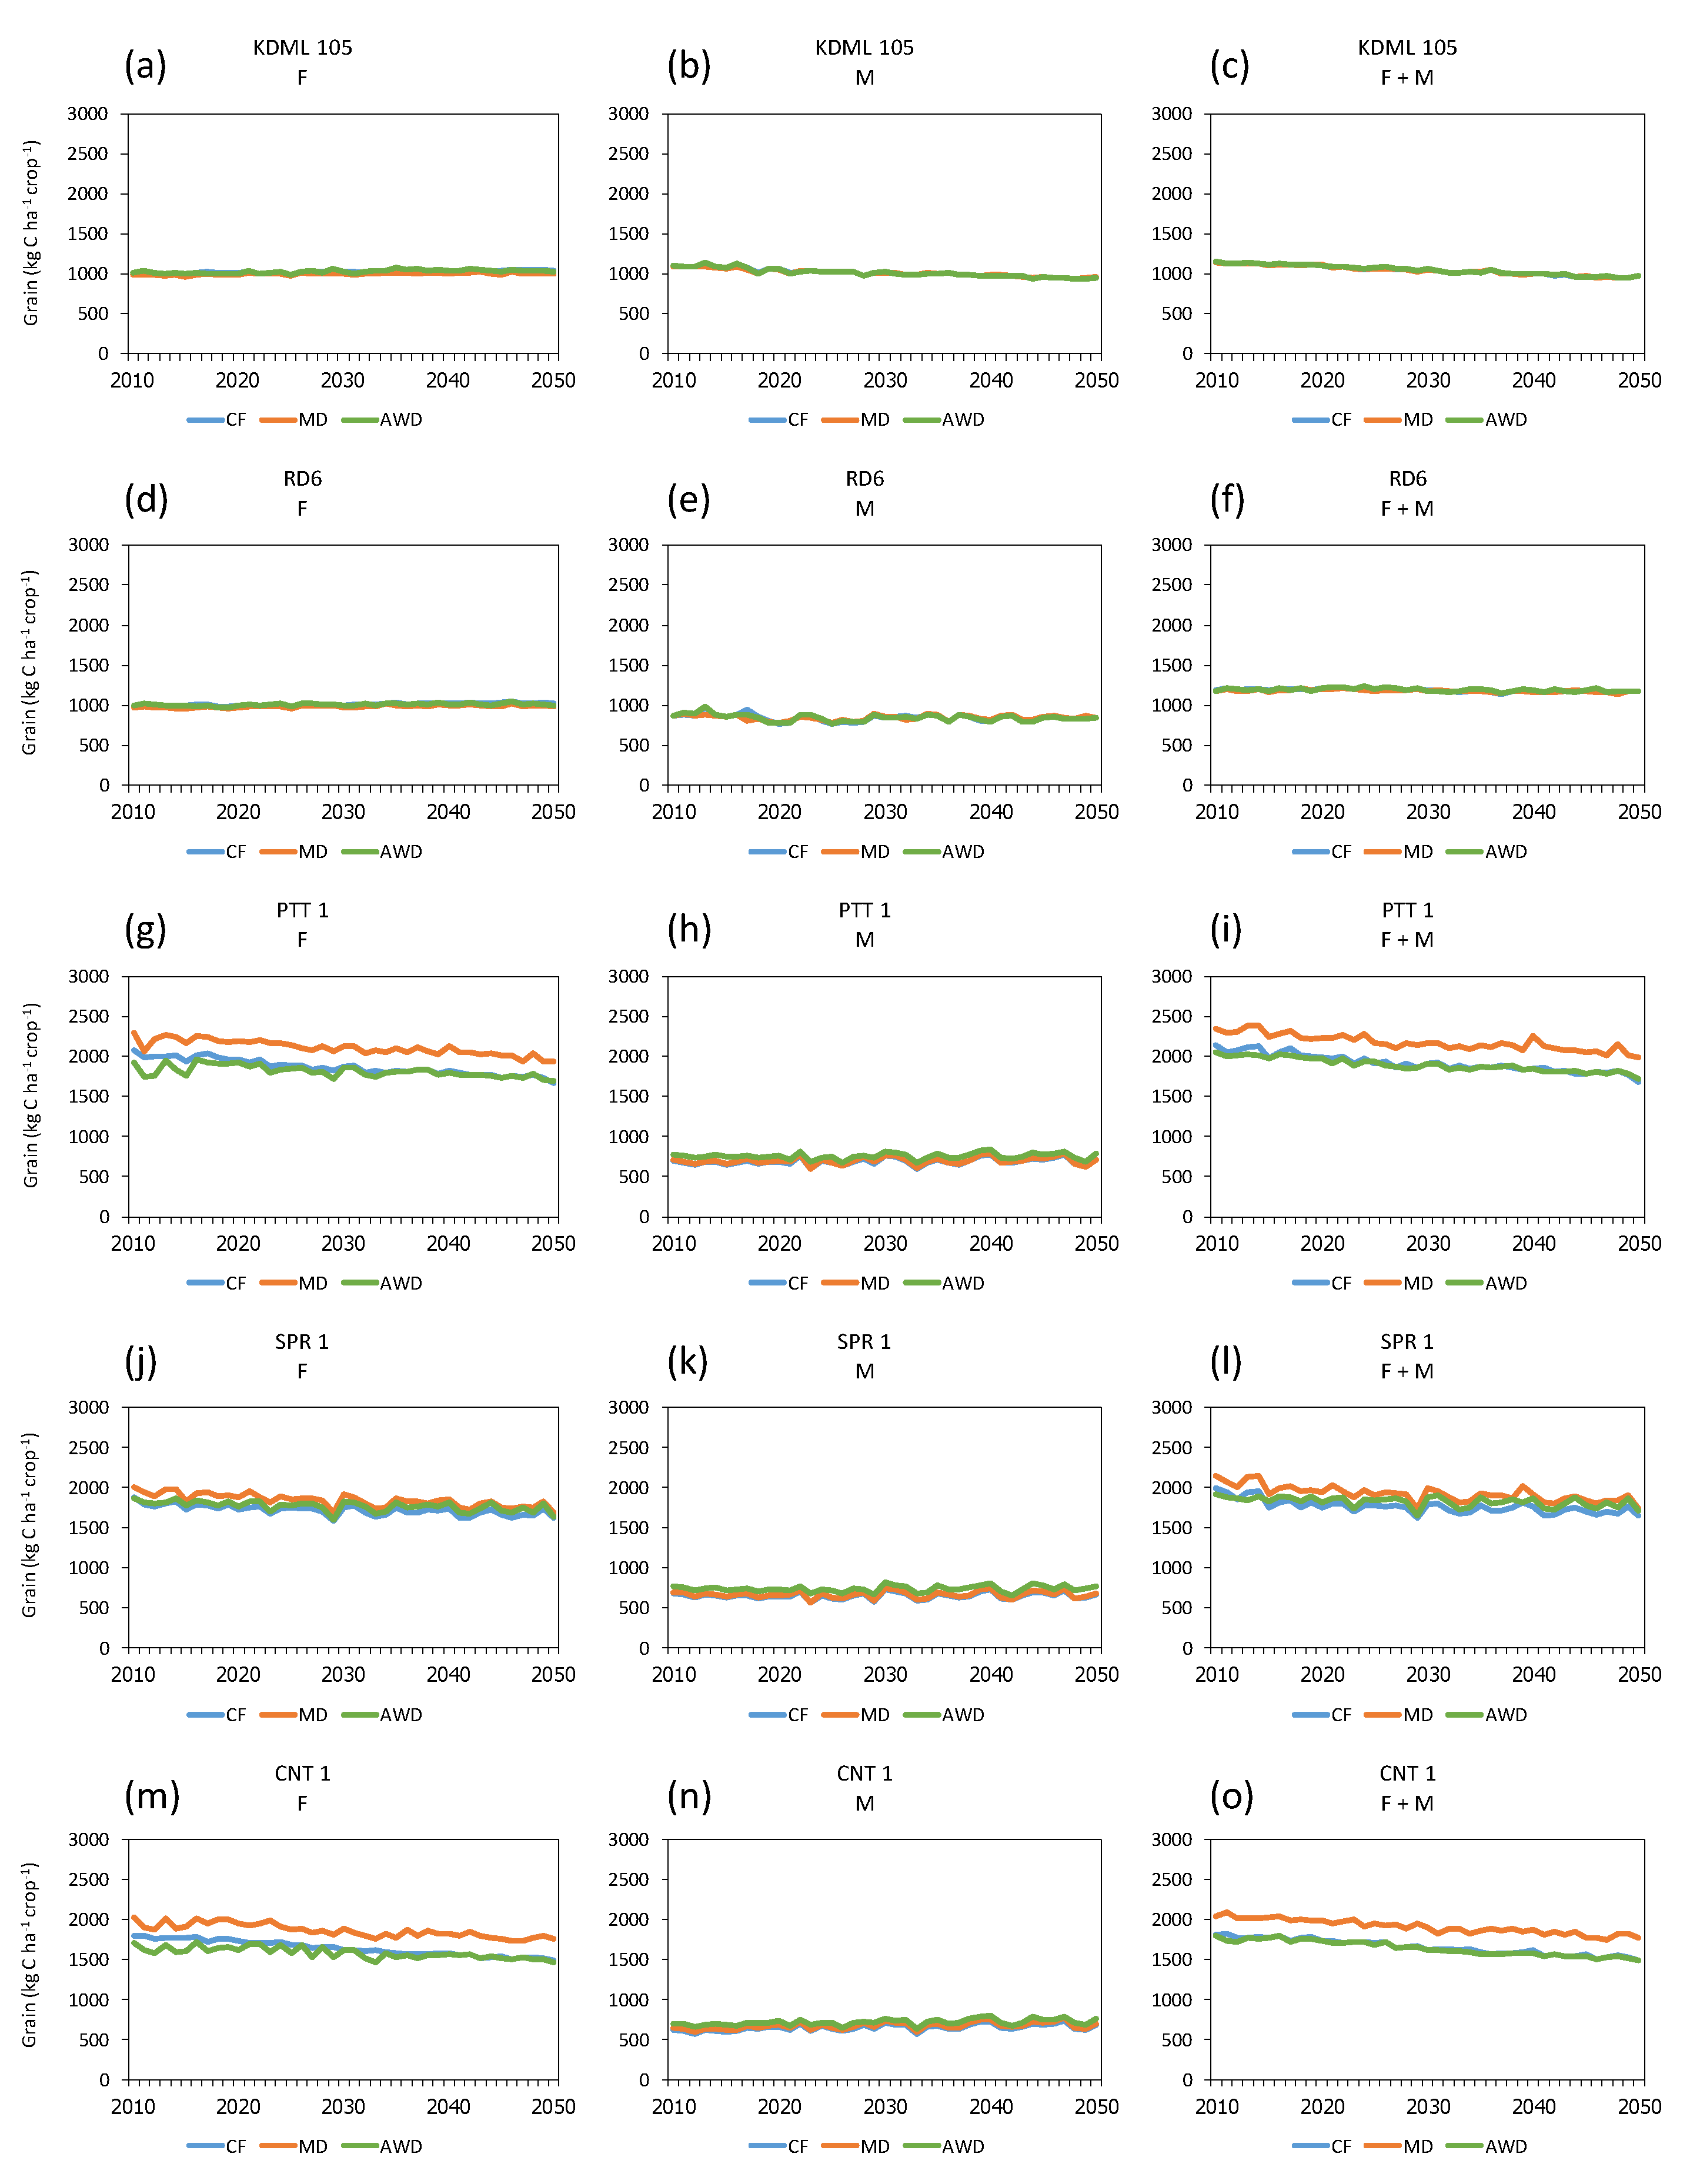
3.2. Long-Term Simulation of Grain Yields

There were significant differences in the amount of simulated grain yields that depended on rice varieties and cropping systems over the long-term simulation period (2010–2050) (Figure 5). The application of sole manure (M) significantly reduced the grain yields in all varieties. The simulated grain yields of F and F + M applications were higher than those of M applications by 1.1–38.6% for single rain-fed rice cropping of KDML 105 and RD6, and 126.9–158.6% for double-irrigated rice cropping of PTT 1, SPR 1, and CNT 1, respectively.
In addition, it was found that water management did not affect the grain yield of KDML 105 and RD6 (Figure 5a–f), but had different impacts on that of PTT 1, SRP 1, and CNT 1. Interestingly, MD irrigation significantly increased rice grain yield more than CF and AWD in the cases of F and F + M options for PTT 1, SRP 1 and CNT 1 (Figure 5g–o). As compared with CF, it was found that AWD irrigation increased the rice grain yields of SPR 1 by 2.9–13.6%, but slightly decreased the rice grain yields of PTT 1 by 1.1 to 2.7% and CNT 1 by 0.7 to 3.5%.
The means and its comparisons of simulated grain yields at the start and the end of the simulation period under different fertilizer and water management practices are shown in Table 4. At the end of the simulation period, the simulated grain yield of KDML 105 and RD6 varieties in F management slightly increased from the start by 2.6 and 2.3%, respectively. While PTT 1, SPR 1 and CNT 1 in all fertilizer management practices slightly decreased from the start, grain yields were significantly higher with F and F + M management practices than with M application alone. The simulated grain yields of F and F + M applications were 0.9 to 10.5%, 17.3 to 41.0%, 127.4 to 190.3%, 128.2 to 173.9%, and 103.7 to 157.7% greater than M applications in the KDML 105, RD6, PTT 1, SRP 1, and CNT 1, respectively. Therefore, the difference in simulated grain yields was affected by fertilizer management practices, especially in the double-cropping systems of PTT 1, SPR 1, and CNT 1 varieties.
At the end of the simulation period, water management practices of CF, MD, and AWD slightly decreased the simulated grain yields. In addition, the grain yields of KDML 105 and RD6 were not significantly different among the three irrigation modes. The grain yields of PTT 1, SRP 1 and CNT 1 varieties in water management of AWD were higher than those in CF by 1.7, 5.8 and 1.2%, respectively, while MD gave higher grain yields than those in CF by 12.3, 6.0 and 14.4%, respectively. Although higher grain yields of PTT 1, SRP 1 and CNT 1 were found in MD irrigation, they were not significantly different from CF and AWD irrigations (Table 4). Moreover, water use in AWD practice was significantly lower among the three water management practices (Figure 2). These results showed that, although AWD practice slightly decreased grain yields of PTT 1, SRP 1 and CNT 1 as double-rice cropping systems, water use was lower.

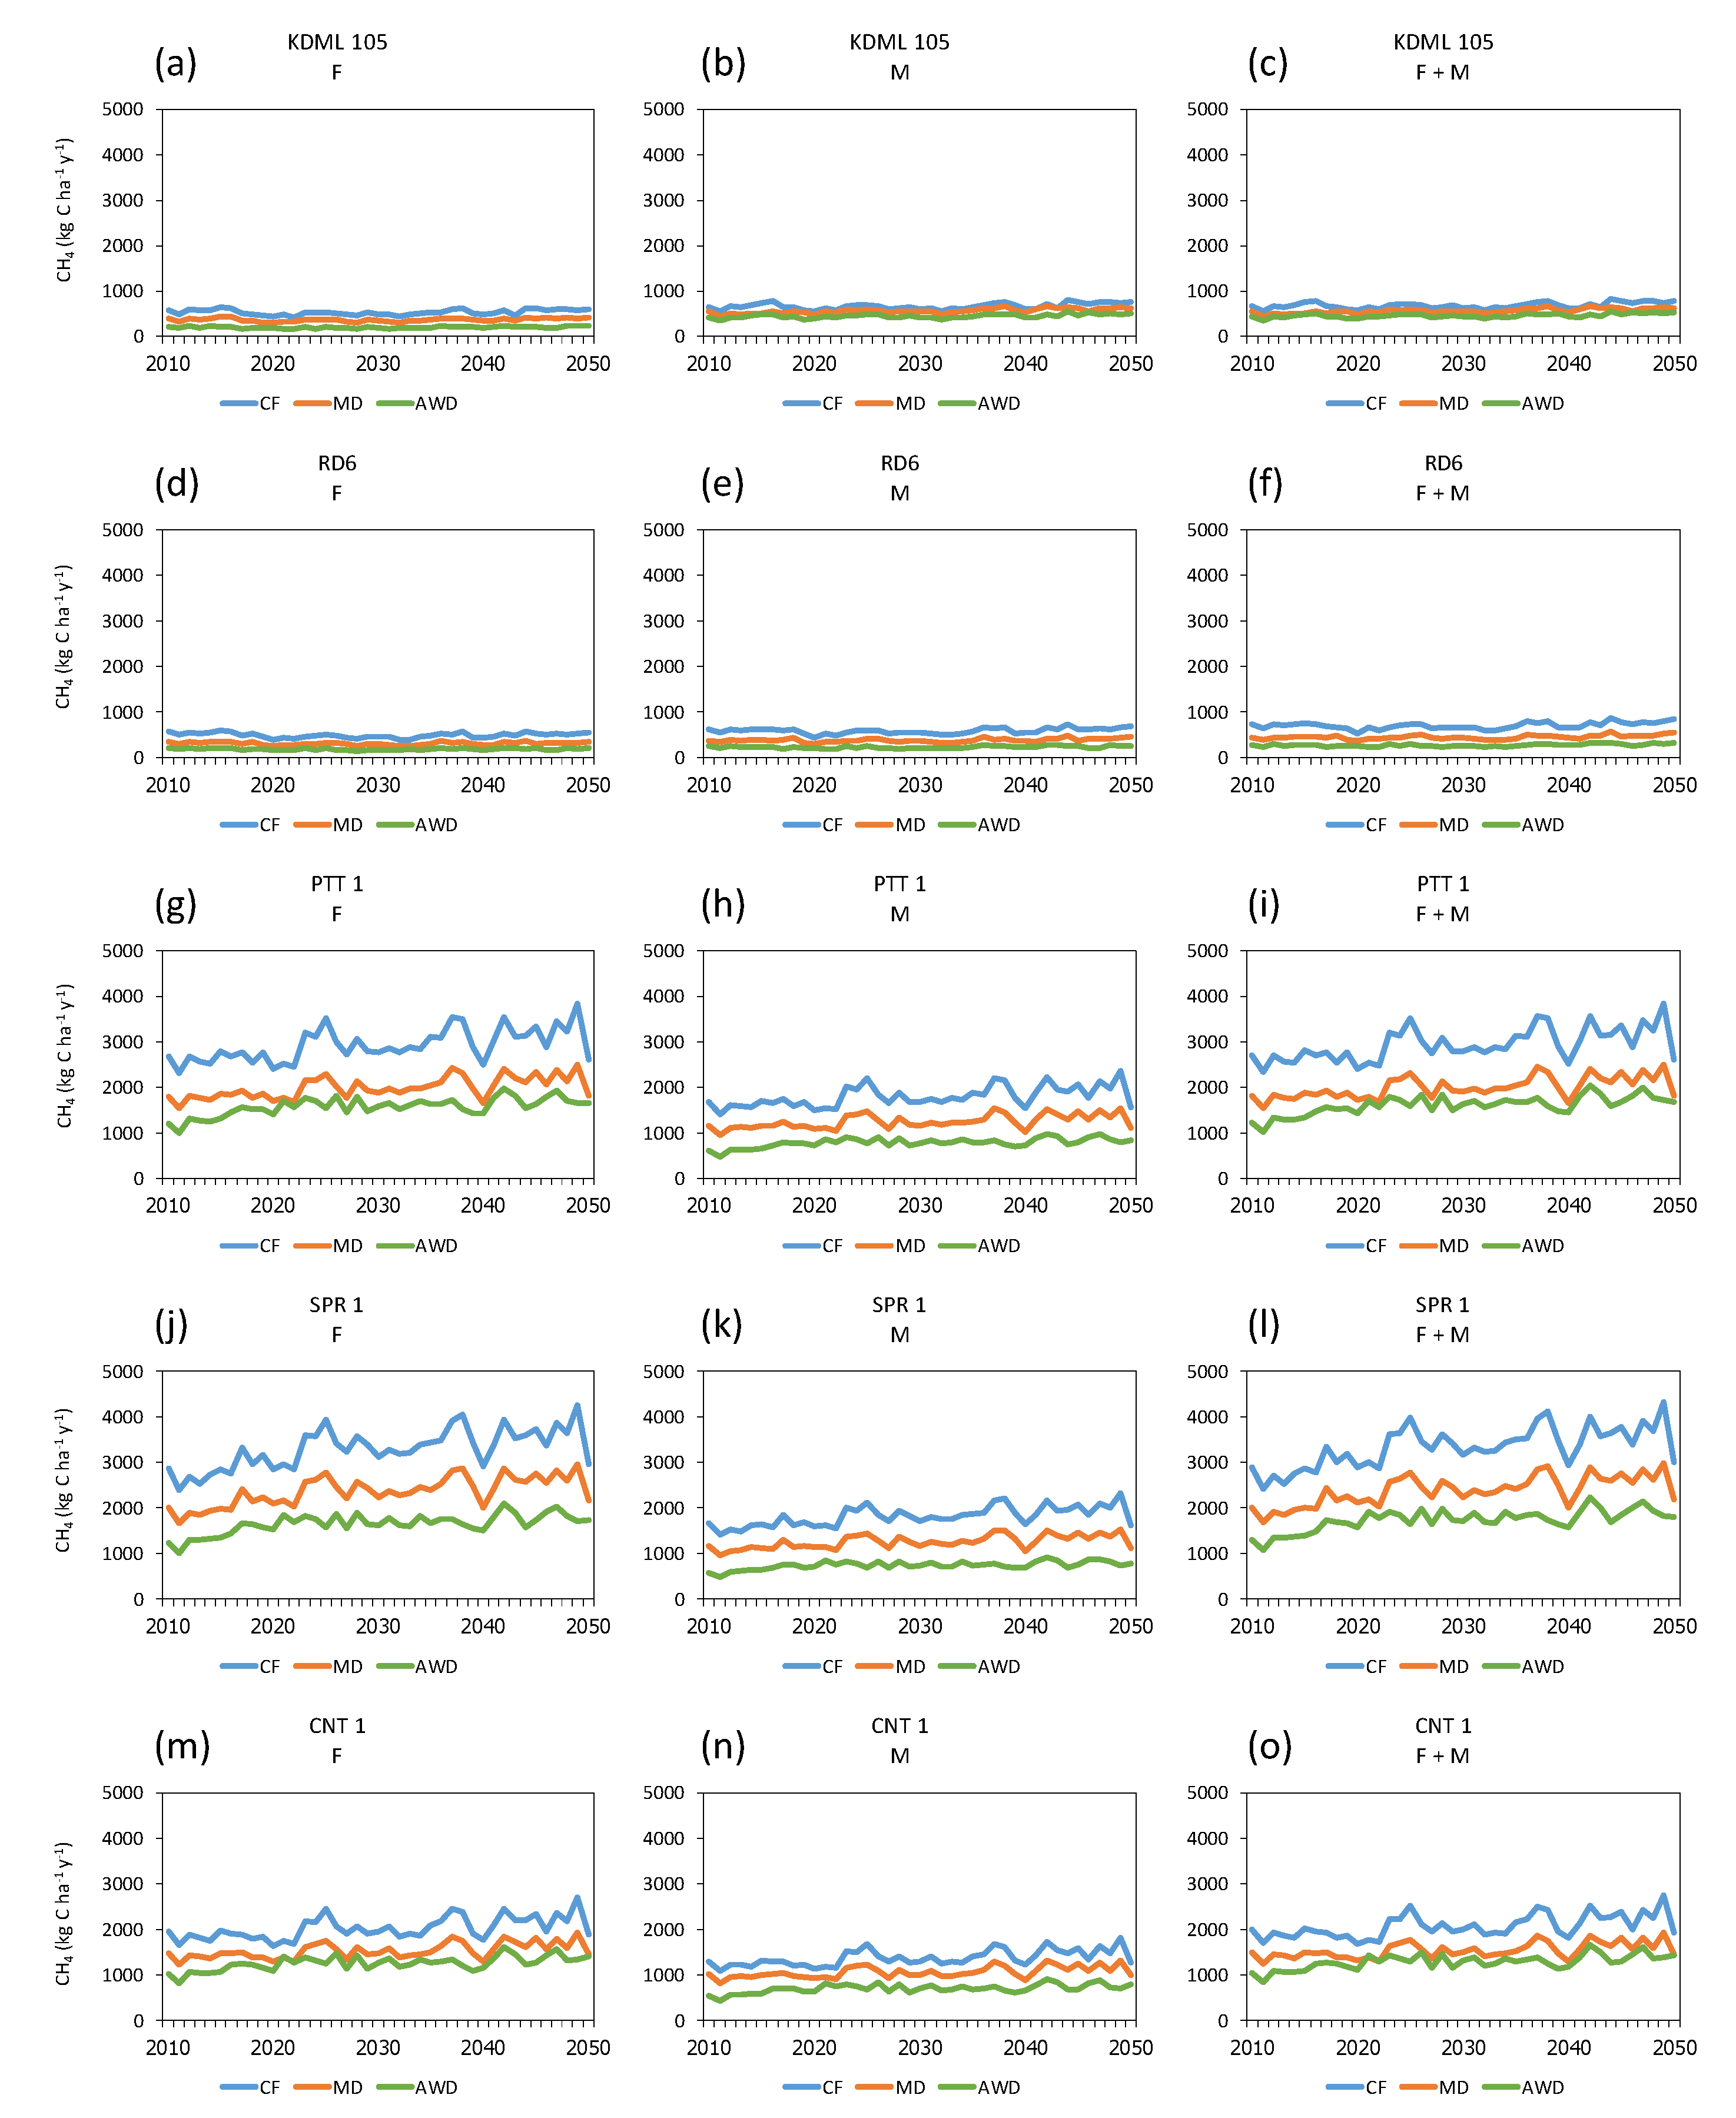
3.3. Long-Term Simulation of CH4 Emissions

As the same simulation output with grain yield as presented above, CH4 emissions were simulated accordingly. The CH4 emissions tended to increase in most of the cases during the simulation period (Figure 6). The case for KDML 105 and RD6 applied with sole chemical fertilizer (F) resulted in lower CH4 emissions (Figure 6a,d). However, emissions of CH4 were increased by 19.1–127.8% when M and F + M were applied (Figure 6b,c,e,f). Therefore, the application of M in the single rain-fed rice cropping system of KDML 105 and RD6 was one of the major C inputs that resulted in increased CH4 emissions. On the other hand, for PTT 1, SRP 1, and CNT 1, application of M alone did not increase CH4 emissions as compared with that of F and F + M (Figure 6g–o). Moreover, it was clear that AWD water management significantly reduced CH4 emissions by 16.6 to 45.5% and 32.3 to 62.3% as compared to the MD and CF, respectively.
The means of simulated CH4 emissions at the start and the end of the simulation period under different fertilizer and water management practices are shown in Table 5. In all rice varieties, the simulated CH4 emissions at the end of the simulation period increased from the start. In KDML 105 and RD6 varieties, the simulated CH4 emissions from M and F + M applications at the end of the simulation period were 7.2 to 25.6% greater than those at the start. Whereas, PTT 1, SPR 1, and CNT 1 varieties, the simulated CH4 emissions from F and F + M applications at the end of the simulation period, increased by 19.9 to 48.9% from the start. Furthermore, the application of F + M resulted in higher CH4 emissions than the applications of F by 1.1 to 56.4% and M by 1.6 to 98.7%, respectively. These results show that the co-application of the fertilizer with cow manure is one of the main management practices that enhance CH4 emissions.
For the effect of water management, CH4 emissions at the end of the simulation period in MD and AWD irrigations were lower than those in CF by 17.6–35.9% and 31.8- 63.2%, respectively (Table 5). Although small rice grain yields were increased with the practice of AWD, CH4 emissions were significantly reduced among five rice varieties with three fertilizer managements. Therefore, this indicates that AWD has the potential for long-term GHG mitigation in Thai rice cultivation.

4. Discussion

4.1. Model Performance

In the current study, the model performed poorly in simulating SOC stocks (Figure 3a). This could partly be due to the fact that only two years of data were available for the simulation. It is usual that changes in SOC level occur slowly over time, especially in paddy soils. It is thus difficult to detect slight changes in SOC over a short time. Under the flooded and anaerobic conditions, SOM decomposition is slow and interannual changes in the amount of SOC stock are usually difficult to detect [18]. Ku et al. [39] applied the DNDC model to simulate changes in SOC content and rice grain yield over 35 years under different treatments of rice straw incorporation and fertilizer application. They found a good agreement between the observed and simulated values on validation of SOC contents and yields. They also reported that incorporating rice straw and rice straw compost improved grain yields by 9% and 11%, respectively, compared to no rice straw application, due to the increased SOC contents [39]. Naher et al. [22] also used the DNDC model and conducted a rice–rice–fallow cropping sequence of 31 years to determine the effect of balanced chemical fertilizer and integrated nutrient management on SOC sequestration. They reported that the simulated values were close to the observed data (nRMSE = 4.1 to 7.9, R2 = 0.95 to 0.99). They concluded that the DNDC model provides a good prediction of SOC balance in the long term [22] (Table 6).
In contrast to the case of SOC, the simulated grain yields and cumulative seasonal CH4 emissions agreed well with those of the observations (Figure 3b–c). This indicates that the model still performed well and was valid with respects to simulation of yield and GHG emissions. Similar performance was also found in several studies (Table 6). Pandey et al. [40] used the DNDC model (version 9.5) to predict organic fertilizer impacts on rice grain yield and CH4 emissions. They found that simulated grain yields in organically amended fields were well correlated with the results obtained from field experiment (R2 = 0.96, slope = 0.68) and that the simulated seasonal soil CH4 emissions were strongly correlated with observed values (R2 = 0.93, slope = 0.77). Zhao et al. [45] also used the DNDC model to evaluate the effects of different field management practices on CH4 from flooded paddy fields in Shanghai, China. They showed that the simulated seasonal patterns of CH4 (R2 = 0.76, ME = 0.71) emissions were correlated with the observations from experimental paddy fields. Furthermore, their model sensitivity analysis indicated that the emissions of CH4 were positively correlated with the organic fertilizer rate, the straw returned fraction, and the SOC content. [45].
The simulation results of cumulative seasonal N2O emissions were underestimated in all management practices (Figure 3d). Similar results were also reported by Oo et al. [46] (Table 6); they reported that the DNDC-Rice model did not adequately predict the total N2O emissions, particularly under AWD irrigation. They hypothesized that these discrepancies were caused by inaccurate estimation of N release rates from the fertilizers, including coated urea [46]. Abdalla et al. [24] reported that DNDC performed better in simulating N2O fluxes for high N fertilizer inputs (>140 kg N ha−1) than for low N input (0–70 kg N ha−1). According to the current study, N fertilizer input was only 80–90 kg N ha−1 (Table 1), resulting in frequent underestimation of simulated N2O emissions. Katayanagi et al. [44] also observed that the simulated N2O emissions were lower than the observed values by 87% and 29% for CF and AWD, respectively. They explained that the discrepancy might have been caused by the model overestimating rice growth, which would have resulted in more N uptake by the plants, leaving less N available to support microbial activity in the soil. Furthermore, the discrepancy may have resulted from an incorrect balance of nitrification and denitrification rates in the model [44]. As a result, N input and output processes are essential for accurate simulation of crop growth and yield or nutrient cycles using the DNDC model [32].
In DNDC, emission of N2O is predicted as an intermediate product by simulating nitrification and denitrification processes. In paddy rice soils, nitrification generally regulates N2O production by oxidation of ammonium ion (NH4+) to nitrate ion (NO3), which is the substrate for denitrification [29]. Katayanagi et al. [44] explained that if the NO3 supply arrives later than predicted, the simulated N2O production will be lower than the observed value. Thus, modification of the balance between nitrification and denitrification rates may be needed for reasonable prediction of N2O emissions.

4.2. Effects of Fertilizer and Water Management Practices on Grain Yields

The simulation results show that grain yield increase depends on the application of chemical and manure fertilizers (Figure 5). For all rice varieties tested, the applications of F and F + M provided higher grain yields than those of the M application. In the studies of the effects of long-term fertilization (20 years) in Hunan’s Qiyang County, China [47], Wang et al. showed that mixed application of chemical NPK and organic fertilizers in-creased straw and grain yield to a greater extent than other fertilization methods. In order to improve crop yield, they suggested the mixing of organic fertilizer with chemical NPK fertilizer. Zhao et al. [45] reported that simulated rice grain yield was positively correlated with the organic fertilization rate. However, the overuse of N fertilizer in rice fields has little role in the increase in rice biomass [41]. Zhao et al. [48] suggested that an application rate of 240 kg N ha−1 with the optimized fertilization time was the best fertilization technique for the experimental paddy field, which dramatically decreased total N loss by 31.6%, while maintaining optimal rice yields [48]. In order to increase nutrient use efficiency in the long term, agricultural nanotechnology, such as nanofertilizers, is therefore recommended for use in agriculture soil [49].
In the cases of F and F + M applications for PTT 1, SRP 1 and CNT 1 varieties, MD irrigation significantly increased rice grain yield more than CF and AWD (Figure 5g–o). The current study also found that AWD irrigation increased the simulated grain yields of SPR 1, but slightly decreased the simulated grain yields of PTT 1 and CNT 1 when compared with CF. Similarly, Tian et al. [43] reported that MD and AWD can maintain or improve predicted rice yields when compared to CF. Oo et al. [46] found that simulated grain yields in the CF (7846–8420 kg ha−1) and AWD (7852–9557 kg ha−1) treatments did not show a significant difference. However, the different simulated grain yields can be explained by the soil water content, SOC content and nitrogen (N) availabilities for crop. In DNDC, crop growth and yields are controlled by complex interactions of weather, soil conditions and crop physiological properties [50].
In this simulation, MD irrigation was a short-term drainage that was carried out for seven days (53–60 days after planting) during the rice growing period (Figure 2). After running the model, the daily soil climate output revealed that there was 81–95% moisture in the soil during the drainage period. This soil condition could enhance the rates of root growth and grain-filling [51]. Itoh et al. [52] applied MD irrigation in Japan’s paddy fields and found that the grain yield of the conventional MD (5–17 days) was higher than that of prolonged MD (14–24 days). Rahman et al. [53] also applied MD irrigation to the paddy fields in Japan. They reported that the drained field condition of the MD treatment induced higher root activity and yield.
In AWD irrigation practice, during the vegetative stage, the higher SOC content in SPR 1 cultivation sites (Table 2) is associated with N mineralization in aerobic soil conditions, and this supplies more N availability for the rice plant, resulting in increasing grain yield [54,55]. Carrijo et al. [55] also reported that AWD performed better on soils with high SOC (>1%) with relative high yields compared to soils with lower SOC. On the other hand, the lower grain yields by AWD in PTT 1 and CNT 1 could be partly explained by the lower SOC and irrigation practice as the input parameters into the model. Namely, in the current DNDC model, the input information for flooding practices can be selected from four options to define flooding duration, including (1) irrigation, (2) rainfed, (3) observed water table, and (4) empirical parameters [50]. The “irrigation” option with a marginal flooding (water layer thickness varying between −5 and 5 cm) for 15 to 60 days after planting in AWD irrigation was used in the present study (Figure 2). After running the model with AWD irrigation, it was discovered that the wet and dry soil conditions alternated for five days each, with three rotation times. Soil moisture ranged from 89 to 95% during the dry period. Due to the strict variations of the −5 to 5 cm of water layer, unsaturated soil conditions were induced during the rice growing season, which in turn reduced soil moisture and soil water inputs to the rice field. As a result, the simulated rice grain yield was reduced. Similarly, Bouman and Tuong [56] described that rice is sensitive to non-saturated soil conditions. There was no developmental (vegetative or reproductive) stage which affects the yield production. Carrijo et al. [55] have analyzed 56 studies with 528 side-by-side comparisons of AWD with CF, and found that AWD decreased yields by 5.4%. Therefore, in this study, it is not surprising that simulated grain yields were reduced with AWD practices. Although AWD has some effects on yields, it is a good option for water saving and has been widely adopted. Carrijo et al. [55] also suggested that the mild AWD reduced water use by 23% compared to CF while maintaining yield.
Over 55% of the total rice area and 70% of global rice production are irrigated lowland systems [4]. Lowland rice requires more water than most other upland rice and other crops. Most rice varieties achieve better growth and produce higher yields when they are grown under flooded conditions than under aerobic conditions [57]. In Thailand, rice could be grown in any part of the country. Most of the major rice cultivation areas are located in the Northeast, which has irrigation limitations, climate variability, poor soil, salinity, droughts and floods. Therefore, natural AWD conditions are common in this region. These factors have come to greatly affect rice production. On the other hand, in the Central region, rice is intensively cultivated on more fertile alluvial soils. Double-cropping of rice per year is usually found in this region due to the availability of water from irrigation networks. The yield of rice grown in this area is usually 4–6 t ha−1 [3]. In this regard, AWD has a very high potential to reduce water use and to maintain rice grain yields.

4.3. Effects of Fertilizer and Water Management Practices on CH4 Emissions

The simulated CH4 emissions tended to increase in most of the cases during the simulation period (Figure 6). The application of F in a single rain-fed rice cropping system of KDML 105 and RD6 resulted in low CH4 emissions. (Figure 6a,d). When M and F + M were applied, CH4 emissions increased by 19.1–127.8% (Figure 6). F and F + M treatments increased CH4 emissions in double rice cropping of PTT 1, SRP 1, and CNT 1. Zhao et al. [45] indicated that, in paddy fields, CH4 emissions are positively correlated with the organic fertilizer rate, the straw returned fraction, the tillage depth and the SOC content [45]. Meanwhile, the excessive application of N fertilizer in rice fields and N deposition contributes to a weak inhibiting effect on CH4 emissions because it can promote the activity of methanotrophs and thus accelerates the CH4 oxidation. As a result of N deposition, total CH4 emissions were reduced by 0.04 Tg y−1 [41].
Crop management practices such as manure application, fertilization, irrigation, and flooding have been parameterized in the DNDC model in order to drive biophysical and biogeochemical reactions and their products by controlling soil environmental conditions and/or substrate concentrations. During the simulation of manure application, C and N contained in the manure are released through decomposition and distributed into the corresponding soil C and N pools, where they are then involved in soil C and N cycling. Fertilization changes soil N pools depending on N rate, which can have an impact on crop growth and CH4 emissions [50]. As a result, fertilization, whether chemical or organic fertilizer such as manure, will result in increased CH4 emissions.
In this study, CH4 emissions at the end of the simulation period in MD irrigations were lower than those in CF by 17.6–35.9%. Similarly, Wang et al. [41] presented that, as compared with CF, MD irrigation reduced CH4 emissions by 1.38 and 1.69 kg CH4 ha−1 y−1 for single- and double-cropping rice, respectively. The present study also shows that AWD irrigation reduced CH4 emissions by 16.6 to 45.5% and 32.3 to 62.3% as compared to the MD and CF, respectively. Similar results were reported by Katayanagi et al. [44] and Minamikawa et al. [36] by using the DNDC-Rice model. Katayanagi et al. [44] reported that simulated CH4 emissions from the AWD pots (126 kg C ha−1) were 70% lower than those from the CF pots (417 kg C ha−1). Minamikawa et al. [36] predicted the future CH4 emissions from irrigated rice paddies in central Thailand under different water management practices. They found that, from 2051 to 2060, the single (SD) and multiple (MD) aeration decreased CH4 emissions by 21.9 to 22.9% and 53.5 to 55.2% compared to continuous flooding (CF), respectively [36]. Moreover, Tian et al. [43] found that when compared to CF, AWD reduced CH4 emissions by 60–71% in Northeast China sites and 34–65% in South China sites. Hwang et al. [58] used the DNDC model to estimate CH4 emissions from rice paddy fields in South Korea under the Representative Concentration Pathway 8.5 (RCP-8.5) climate change scenario. They found that intermittent drainage during the cropping season can reduce CH4 emissions from paddy fields [58].
Results from previous and this current study strongly demonstrate that AWD irrigation has high potential to reduce CH4 emissions. In the DNDC model, the flooding and irrigation methods have a direct effect on soil moisture and redox potential, both of which influence crop production and all biogeochemical processes, which are the key determinants of CH4 production rates [50]. AWD irrigation has been proposed as a water management technique that can effectively reduce CH4 emissions in paddy fields [40]. Under AWD irrigation, the soil surface is transformed from wet to dry (Figure 2), which increases the penetration of oxygen into the soil and leads to the inhibition of CH4-producing archaea [46]. Model simulation reconfirms that a long-term practice of AWD could be a good option to mitigate CH4 emissions.
Finally, the study overall shows that the modelling tool could be useful in improving our understanding of the interactions among management practices, rice productivity, and GHG emissions. The results provide insight into the scenarios that if farmers continue doing rice cultivation as present, emissions of CH4 would be only increased. Rice yield will be increased only with fertilization. Fertilizers, whether chemical or organic, will also lead to more CH4 emissions. This study highlights that additional management such as water management is necessary to sustain rice production, while fertilization could be used as needed. In this regard, AWD has a very high potential to maintain rice grain yields and reduce CH4 emissions. The framework and plan to implement AWD in rice production regions may be urgently realized. However, we also noted that AWD is effective only where irrigation is available. Effective management schemes for rain-fed rice are therefore urgently needed. Nevertheless, the emission of N2O and changes of SOC stock were not successfully carried out. As described above, these aspects need further investigation, both in terms of adjusting the model parameters itself and in collecting more field data for model validation.

5. Conclusions

In this study, the DNDC model was applied to investigate the long-term effects of fertilizer and water management practices in order to find appropriate management options for Thai rice cultivation, and to provide options for improving rice grain yield with low CH4 emissions. This model was validated against field observation data from a two-year field study in a Thai rice field. In validation of the model, the simulated grain yields (R2 = 0.826, slope = 0.984, NRMES = 0.302) and cumulative seasonal CH4 emissions (R2 = 0.830, slope = 0.744, NRMES = 0.425) were significantly and positively correlated, and better agreed with the observations, which indicated that the model performed well. In a short-term simulating SOC stocks, the model performed poorly (R2 = 0.36, slope = 0.47, NRMES = 1.58). Moreover, simulated cumulative seasonal N2O emissions were significantly underestimated in all cropping systems and fertilizer management practices.
In the long-term simulations of five rice varieties, application of manure (M) alone was not a suitable option for increasing grain yields of all rice varieties and cropping systems. The additional water management is required to sustain rice yields. In this regard, AWD has a high potential for maintaining rice grain yields while lowering CH4 emissions. The appropriate options with regard to maintaining rice yield and reduce CH4 emissions in the long term were suggested to be F + M with AWD for the rain-fed rice cropping of KDML 105 and RD6, and F with AWD for the irrigated rice cropping of PTT 1, SRP 1 and CNT 1. These could be promising options for sustainable rice production in Thailand.

Author Contributions

Conceptualization: N.C.-u., A.C., K.Y. and S.T.; Methodology: N.C.-u., A.C. and S.T.; Performed the experiment: N.C.-u.; Analyzed the data: N.C.-u.; Wrote the paper: N.C.-u.; Review and editing: N.C.-u., A.C., K.Y. and S.T. All authors have read and agreed to the published version of the manuscript.

Funding

Funding in this study was partly supported by the Southeast Asia Climate Change Research Network: SACRN (IRN5701PDFW02) of Thailand Science Research and Innovation (TSRI), ESS-JGSEE-KMUTT and CTI-PERDO, and Climate change and tropical soil carbon research network under the project of Climate Change Mitigation by Sustainable Agriculture Soil Management in Thailand of the National Research Council of Thailand (NRCT).

Data Availability Statement

We also would like to thank Chitnucha Buddhaboon and Benjamas Rodsopha from the Rice Department (RD), and Sathaporn Jaiarree from the Land Develop Department (LDD) for their data support.

Acknowledgments

The authors gratefully acknowledge the support of the Joint Graduate School of Energy and Environment (JGSEE) at King Mongkut’s University of Technology Thonburi, for laboratory equipment and materials.

Conflicts of Interest

The authors declare no conflict of interest.

Abbreviations

DNDCDenitrification–Decomposition model
GHGgreenhouse gas
CH4methane
SOCsoil organic carbon
Fchemical fertilizer
Mcow manure
F + Mmixed chemical fertilizer and cow manure
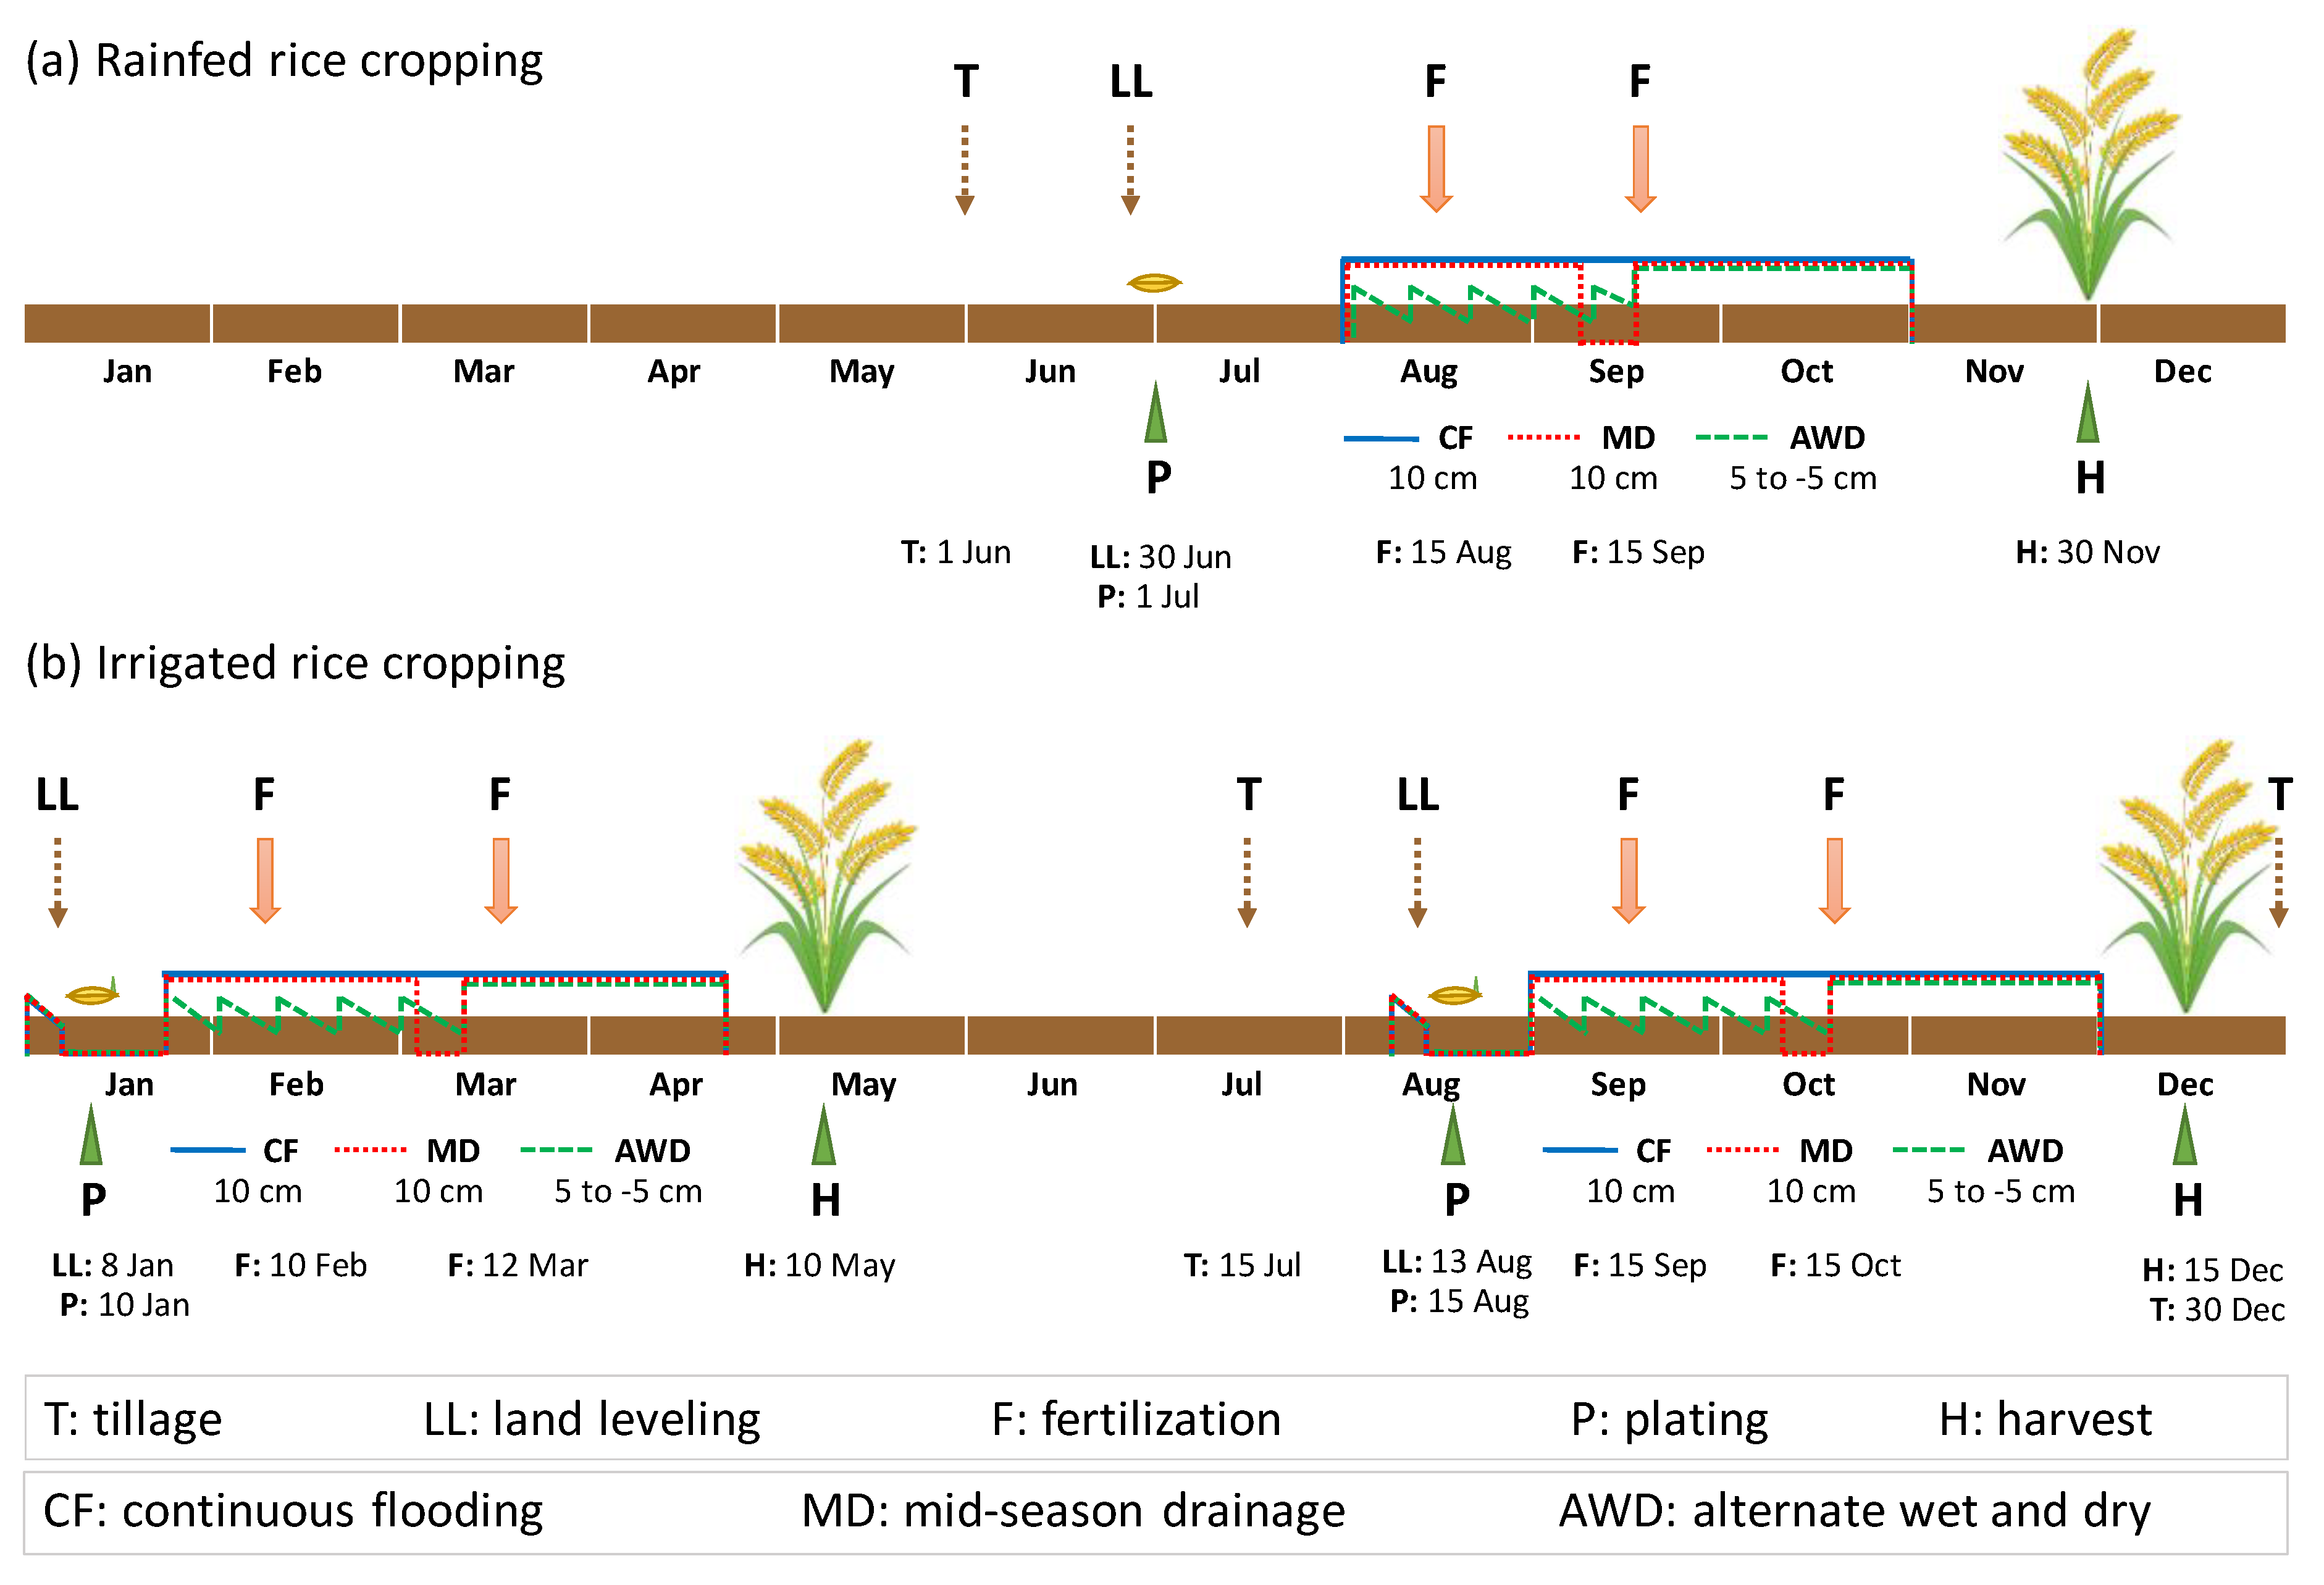
CFcontinuous flooding
MDmid-season drainage
AWDalternate wet and dry
RFrotation of fallow land and rain-fed rice
RRrotation of irrigated rice and rain-fed rice
KDML 105rice variety name of Khao Dawk Mali 105
RD6rice variety name of Kao Khao 6
PTT 1rice variety name of Patum Thani 1
SPR 1rice variety name of Suphan Buri 1
CNT 1rice variety name of Chainat 1

References

  1. Food and Agriculture Organization of the United Nations (FAO). FAOSTAT Database. 2020. Available online: https://www.fao.org/faostat/en/#data/QCL (accessed on 10 November 2021).
  2. OAE. Agricultural Statistics of Thailand 2019; Office of Agricultural Economics: Bangkok, Thailand, 2019; 221p.
  3. Varinruk, B. Thai Rice Production and Rice Research and Development on Climate Change. In Proceedings of the Workshop on Strengthening APEC Cooperation on Food Security and Climate Change, Asia-Pacific Economic Cooperation (APEC), Hanoi, Viet Nam, 19–21 April 2017. [Google Scholar]
  4. GRiSP (Global Rice Science Partnership). Rice Almanac, 4th ed.; International Rice Research Institute: Los Baños, Philippines, 2013; 283p. [Google Scholar]
  5. ONEP. Second Biennial Update Report of Thailand; Office of Natural Resources and Environmental Policy and Planning (ONEP): Bangkok, Thailand, 2017; 108p.
  6. Le Mer, J.; Roger, P. Production, oxidation, emission and consumption of methane by soils: A review. Eur. J. Soil Biol. 2001, 37, 25–50. [Google Scholar] [CrossRef]
  7. Cai, Z.; Xing, G.; Yan, X.; Xu, H.; Tsuruta, H.; Yagi, K.; Minami, K. Methane and nitrous oxide emissions from rice paddy fields as affected by nitrogen fertilisers and water management. Plant Soil 1997, 196, 7–14. [Google Scholar] [CrossRef]
  8. Wassmann, R.; Lantin, R.S.; Neue, H.U.; Buendia, L.V.; Corton, T.M.; Lu, Y. Characterization of Methane Emissions from Rice Fields in Asia. III. Mitigation Options and Future Research Needs. Nutr. Cycl. Agroecosyst. 2000, 58, 23–36. [Google Scholar] [CrossRef]
  9. Towprayoon, S.; Smakgahn, K.; Poonkaew, S. Mitigation of methane and nitrous oxide emissions from drained irrigated rice fields. Chemosphere 2005, 59, 1547–1556. [Google Scholar] [CrossRef]
  10. Chidthaisong, A.; Cha-Un, N.; Rossopa, B.; Buddaboon, C.; Kunuthai, C.; Sriphirom, P.; Towprayoon, S.; Tokida, T.; Padre, A.T.; Minamikawa, K. Evaluating the effects of alternate wetting and drying (AWD) on methane and nitrous oxide emissions from a paddy field in Thailand. Soil Sci. Plant Nutr. 2017, 64, 31–38. [Google Scholar] [CrossRef] [Green Version]
  11. Sriphirom, P.; Chidthaisong, A.; Yagi, K.; Tripetchkul, S.; Towprayoon, S. Evaluation of biochar applications combined with alternate wetting and drying (AWD) water management in rice field as a methane mitigation option for farmers’ adoption. Soil Sci. Plant Nutr. 2019, 66, 235–246. [Google Scholar] [CrossRef]
  12. Wang, Z. Rice Based Systems in Subtropical China; International Institute for Tropical Agriculture: Ibadan, Nigeria, 1986. [Google Scholar]
  13. Suzuki, A. Fertilization of Rice in Japan; Technical Report No. 372; Japan FAO Association: Tokyo, Japan, 1997. [Google Scholar]
  14. Bouman, B.A.M.; Lampayan, R.M.; Tuong, T.P. Water Management in Irrigated Rice: Coping with Water Scarcity; International Rice Research Institute (IRRI): Los Baños, Philippines, 2007; p. 54. [Google Scholar]
  15. Cha-Un, N.; Chidthaisong, A.; Yagi, K.; Sudo, S.; Towprayoon, S. Greenhouse gas emissions, soil carbon sequestration and crop yields in a rain-fed rice field with crop rotation management. Agric. Ecosyst. Environ. 2017, 237, 109–120. [Google Scholar] [CrossRef]
  16. Jones, J.; Hoogenboom, G.; Porter, C.; Boote, K.; Batchelor, W.; Hunt, L.; Wilkens, P.; Singh, U.; Gijsman, A.; Ritchie, J. The DSSAT cropping system model. Eur. J. Agron. 2003, 18, 235–265. [Google Scholar] [CrossRef]
  17. Li, C.; Frolking, S.; Harriss, R. Modeling carbon biogeochemistry in agricultural soils. Glob. Biogeochem. Cycles 1994, 8, 237–254. [Google Scholar] [CrossRef]
  18. Shirato, Y. Testing the Suitability of the DNDC Model for Simulating Long-Term Soil Organic Carbon Dynamics in Japanese Paddy Soils. Soil Sci. Plant Nutr. 2005, 51, 183–192. [Google Scholar] [CrossRef] [Green Version]
  19. Wang, L.; Qiu, J.; Tang, H.; Li, H.; Li, C.; Van Ranst, E. Modelling soil organic carbon dynamics in the major agricultural regions of China. Geoderma 2008, 147, 47–55. [Google Scholar] [CrossRef]
  20. Mu, L.; Liang, Y.; Xue, Q.; Chen, C.; Lin, X. Using the DNDC model to compare soil organic carbon dynamics under different crop rotation and fertilizer strategies. Span. J. Agric. Res. 2014, 12, 265. [Google Scholar] [CrossRef] [Green Version]
  21. Cha-un, N.; Chidthaisong, A.; Towprayoon, S. Short-term and Long-term Soil Carbon Sequestration in Rice Field with Energy Crop Rotation. J. Sustain. Energy Environ. 2015, 6, 97–104. [Google Scholar]
  22. Naher, U.A.; Hossain, M.B.; Haque, M.M.; Maniruzzaman, M.; Choudhury, A.K.; Biswas, J.C. Effect of Long-Term Nutrient Management on Soil Organic Carbon Sequestration in Ric… Rice Fallow Rotation. Curr. Sci. 2020, 118, 587–592. [Google Scholar] [CrossRef]
  23. Babu, Y.J.; Li, C.; Frolking, S.; Nayak, D.R.; Adhya, T.K. Field Validation of DNDC Model for Methane and Nitrous Oxide Emissions from Rice-based Production Systems of India. Nutr. Cycl. Agroecosyst. 2006, 74, 157–174. [Google Scholar] [CrossRef]
  24. Abdalla, M.; Wattenbach, M.; Smith, P.; Ambus, P.; Jones, M.; Williams, M. Application of the DNDC model to predict emissions of N2O from Irish agriculture. Geoderma 2009, 151, 327–337. [Google Scholar] [CrossRef]
  25. Ludwig, B.; Jäger, N.; Priesack, E.; Flessa, H. Application of the DNDC model to predict N2 O emissions from sandy arable soils with differing fertilization in a long-term experiment. J. Plant Nutr. Soil Sci. 2010, 174, 350–358. [Google Scholar] [CrossRef]
  26. Chen, H.; Yu, C.; Li, C.; Xin, Q.; Huang, X.; Zhang, J.; Yue, Y.; Huang, G.; Li, X.; Wang, W. Modeling the impacts of water and fertilizer management on the ecosystem service of rice rotated cropping systems in China. Agric. Ecosyst. Environ. 2016, 219, 49–57. [Google Scholar] [CrossRef]
  27. Cha-un, N.; Chidthaisong, A.; Towprayoon, S. Using the DNDC model to predict methane emissions from crop-rice rotation systems. Res. J. Chem. Environ. 2017, 21, 36–46. [Google Scholar]
  28. Li, C.S. Modeling Trace Gas Emissions from Agricultural Ecosystems. Nutr. Cycl. Agroecosyst. 2000, 58, 259–276. [Google Scholar] [CrossRef]
  29. Li, C.; Frolking, S.; Frolking, T.A. A model of nitrous oxide evolution from soil driven by rainfall events: 2. Model applications. J. Geophys. Res. Space Phys. 1992, 97, 9777–9783. [Google Scholar] [CrossRef]
  30. Li, C. The DNDC Model. In Evaluation of Soil Organic Matter Models; Powlson, D.S., Smith, P., Smith, J.U., Eds.; NATO ASI Series (Series I: Global Environmental Change); Springer: Berlin/Heidelberg, Germany, 1996; Volume 38. [Google Scholar]
  31. Gilhespy, S.L.; Anthony, S.; Cardenas, L.; Chadwick, D.; del Prado, A.; Li, C.; Misselbrook, T.; Rees, R.M.; Salas, W.; Sanz-Cobena, A.; et al. First 20 years of DNDC (DeNitrification DeComposition): Model evolution. Ecol. Model. 2014, 292, 51–62. [Google Scholar] [CrossRef] [Green Version]
  32. Katayanagi, N.; Ono, K.; Fumoto, T.; Mano, M.; Miyata, A.; Hayashi, K. Validation of the DNDC-Rice model to discover problems in evaluating the nitrogen balance at a paddy-field scale for single-cropping of rice. Nutr. Cycl. Agroecosyst. 2013, 95, 255–268. [Google Scholar] [CrossRef]
  33. Arunrat, N.; Pumijumnong, N. Practices for Reducing Greenhouse Gas Emissions from Rice Production in Northeast Thailand. Agriculture 2017, 7, 4. [Google Scholar] [CrossRef] [Green Version]
  34. LDD. Soil Nutrients in Thailand; Land Development Department (LDD): Bangkok, Thailand, 2011.
  35. Fumoto, T.; Kobayashi, K.; Li, C.; Yagi, K.; Hasegawa, T. Revising a process-based biogeochemistry model (DNDC) to simulate methane emission from rice paddy fields under various residue management and fertilizer regimes. Glob. Chang. Biol. 2007, 14, 382–402. [Google Scholar] [CrossRef]
  36. Minamikawa, K.; Fumoto, T.; Iizumi, T.; Cha-Un, N.; Pimple, U.; Nishimori, M.; Ishigooka, Y.; Kuwagata, T. Prediction of future methane emission from irrigated rice paddies in central Thailand under different water management practices. Sci. Total Environ. 2016, 566-567, 641–651. [Google Scholar] [CrossRef] [Green Version]
  37. Chinvanno, S.; Laung-Aram, V.; Sangmanee, C.; Thanakitmetavut, J. Future Climate Projection for Thailand and Mainland Southeast Asia Using PRECIS and ECHAM4 Climate Models; Southeast Asia START Regional Center Technical, Chulalongkorn University: Bangkok, Thailand, 2009; p. 377. [Google Scholar]
  38. RD. Rice Knowledge Bank; Rice Department (RD): Bangkok, Thailand, 2019.
  39. Ku, H.-H.; Ryu, J.-H.; Bae, H.-S.; Jeong, C.; Lee, S.-E. Modeling a long-term effect of rice straw incorporation on SOC content and grain yield in rice field. Arch. Agron. Soil Sci. 2019, 65, 1941–1954. [Google Scholar] [CrossRef]
  40. Pandey, A.; Dou, F.; Morgan, C.L.; Guo, J.; Deng, J.; Schwab, P. Modeling organically fertilized flooded rice systems and its long-term effects on grain yield and methane emissions. Sci. Total Environ. 2020, 755, 142578. [Google Scholar] [CrossRef] [PubMed]
  41. Katayanagi, N.; Furukawa, Y.; Fumoto, T.; Hosen, Y. Validation of the DNDC-Rice model by using CH4and N2O flux data from rice cultivated in pots under alternate wetting and drying irrigation management. Soil Sci. Plant Nutr. 2012, 58, 360–372. [Google Scholar] [CrossRef]
  42. Zhao, Z.; Cao, L.; Deng, J.; Sha, Z.; Chu, C.; Zhou, D.; Wu, S.; Lv, W. Modeling CH4 and N2O emission patterns and mitigation potential from paddy fields in Shanghai, China with the DNDC model. Agric. Syst. 2019, 178, 102743. [Google Scholar] [CrossRef]
  43. Oo, A.; Sudo, S.; Fumoto, T.; Inubushi, K.; Ono, K.; Yamamoto, A.; Bellingrath-Kimura, S.; Win, K.; Umamageswari, C.; Bama, K.; et al. Field Validation of the DNDC-Rice Model for Methane and Nitrous Oxide Emissions from Double-Cropping Paddy Rice under Different Irrigation Practices in Tamil Nadu, India. Agriculture 2020, 10, 355. [Google Scholar] [CrossRef]
  44. Tian, Z.; Fan, Y.; Wang, K.; Zhong, H.; Sun, L.; Fan, D.; Tubiello, F.N.; Liu, J. Searching for “Win-Win” solutions for food-water-GHG emissions tradeoffs across irrigation regimes of paddy rice in China. Resour. Conserv. Recycl. 2020, 166, 105360. [Google Scholar] [CrossRef]
  45. Wang, Z.; Zhang, X.; Liu, L.; Wang, S.; Zhao, L.; Wu, X.; Zhang, W.; Huang, X. Inhibition of methane emissions from Chinese rice fields by nitrogen deposition based on the DNDC model. Agric. Syst. 2020, 184, 102919. [Google Scholar] [CrossRef]
  46. Wang, Z.; Zhang, X.; Liu, L.; Wang, S.; Zhao, L.; Wu, X.; Zhang, W.; Huang, X. Estimates of methane emissions from Chinese rice fields using the DNDC model. Agric. For. Meteorol. 2021, 303, 108368. [Google Scholar] [CrossRef]
  47. Wang, H.; Xu, J.; Liu, X.; Zhang, D.; Li, L.; Li, W.; Sheng, L. Effects of long-term application of organic fertilizer on improving organic matter content and retarding acidity in red soil from China. Soil Tillage Res. 2019, 195, 104382. [Google Scholar] [CrossRef]
  48. Zhao, Z.; Cao, L.; Sha, Z.; Deng, J.; Chu, C.; Zhou, D.; Wu, S.; Lv, W. Impacts of fertilization optimization on N loss from paddy fields: Observations and DNDC modeling case study in Shanghai, China. Soil Tillage Res. 2020, 199, 104587. [Google Scholar] [CrossRef]
  49. Bungau, S.; Behl, T.; Aleya, L.; Bourgeade, P.; Aloui-Sossé, B.; Purza, A.L.; Abid, A.; Samuel, A.D. Expatiating the impact of anthropogenic aspects and climatic factors on long-term soil monitoring and management. Environ. Sci. Pollut. Res. 2021, 28, 30528–30550. [Google Scholar] [CrossRef]
  50. EOS. DNDC (Version 9.5) Scientific Basis and Processes; Institute for the Study of Earth, Oceans and Space (EOS), University of New Hampshire (UNH): Durham, NH, USA, 2017; p. 32. [Google Scholar]
  51. Chu, G.; Wang, Z.; Zhang, H.; Liu, L.; Yang, J.; Zhang, J. Alternate wetting and moderate drying increases rice yield and reduces methane emission in paddy field with wheat straw residue incorporation. Food Energy Secur. 2015, 4, 238–254. [Google Scholar] [CrossRef]
  52. Itoh, M.; Sudo, S.; Mori, S.; Saito, H.; Yoshida, T.; Shiratori, Y.; Suga, S.; Yoshikawa, N.; Suzue, Y.; Mizukami, H.; et al. Mitigation of methane emissions from paddy fields by prolonging midseason drainage. Agric. Ecosyst. Environ. 2011, 141, 359–372. [Google Scholar] [CrossRef]
  53. Rahman, S.M.; Kakuda, K.-I.; Sasaki, Y.; Ando, H. Effect of Mid-season Drainage (MSD) on Growth and Yield of Rice in North East Japan. Am. J. Plant Nutr. Fertil. Technol. 2013, 3, 33–42. [Google Scholar] [CrossRef]
  54. Kader, M.A.; Sleutel, S.; Begum, S.A.; Moslehuddin, A.Z.M.; De Neve, S. Nitrogen mineralization in sub-tropical paddy soils in relation to soil mineralogy, management, pH, carbon, nitrogen and iron contents. Eur. J. Soil Sci. 2013, 64, 47–57. [Google Scholar] [CrossRef]
  55. Carrijo, D.; Lundy, M.E.; Linquist, B.A. Rice yields and water use under alternate wetting and drying irrigation: A meta-analysis. Field Crop. Res. 2017, 203, 173–180. [Google Scholar] [CrossRef]
  56. Bouman, B.; Tuong, T. Field water management to save water and increase its productivity in irrigated lowland rice. Agric. Water Manag. 2001, 49, 11–30. [Google Scholar] [CrossRef]
  57. Sivapalan, S. Water Balance of Flooded Rice in the Tropics. In Irrigation and Drainage—Sustainable Strategies and Systems; Javaid, M.S., Ed.; IntechOPEN: London, UK, 2015; pp. 91–118. [Google Scholar]
  58. Hwang, W.; Kim, C.; Cho, K.; Hyun, S. Characteristics of greenhouse gas emissions from rice paddy fields in South Korea under climate change scenario RCP-8.5 using the DNDC model. Pedosphere 2021, 31, 332–341. [Google Scholar] [CrossRef]
Figure 1. Rice varieties and site locations in different provinces.
Agriculture 11 01144 g001
Figure 2. Schematic illustrations of the crop calendar and field management practices.
Agriculture 11 01144 g002
Figure 3. Relationship between observation and simulation values for (a) SOC stock, (b) grain yields, and cumulative (c) CH4 and (d) N2O emissions. RF and RR denote the single rain-fed rice cultivation and double-irrigated rice cultivation, respectively. F and M denote the application of chemical fertilizer and cow manure, respectively. Solid black lines represent the 1:1 line. Broken black lines indicate the regression model.
Agriculture 11 01144 g003
Figure 4. Relationship of rice grain yield between observation and simulation values at year 2010 for (a) grain yields in the dry season and (b) grain yields in the wet season. Solid black lines represent the 1:1 line. Broken black lines indicate the regression model.
Agriculture 11 01144 g004
Figure 5. Long-term simulation of rice grain yields (kg C ha−1 crop−1) in the wet season from 2010 to 2050 for the rice varieties of (a) KDML 105 with fertilizer, (b) KDML 105 with manure, (c) KDML 105 with mixed fertilizer and manure, (d) RD6 with fertilizer, (e) RD6 with manure, (f) RD6 with mixed fertilizer and manure, (g) PTT 1 with fertilizer, (h) PTT 1 with manure, (i) PTT 1 with mixed fertilizer and manure, (j) SPR 1 with fertilizer, (k) SPR 1 with manure, (l) SPR 1 with mixed fertilizer and manure, (m) CNT 1 with fertilizer, (n) CNT 1 with manure, and (o) CNT 1 with mixed fertilizer and manure. CF, MD and AWD indicate the irrigation methods of continuous flooding, mid-season drainage and alternate wet and dry, respectively. The line for each fertilizer and water management practice denotes the mean among the provinces in which the same rice variety was cultivated.
Agriculture 11 01144 g005
Figure 6. Long-term simulation of CH4 emissions (kg C ha−1 y−1) from 2010 to 2050 for the rice varieties of (a) KDML 105 with fertilizer, (b) KDML 105 with manure, (c) KDML 105 with mixed fertilizer and manure, (d) RD6 with fertilizer, (e) RD6 with manure, (f) RD6 with mixed fertilizer and manure, (g) PTT 1 with fertilizer, (h) PTT 1 with manure, (i) PTT 1 with mixed fertilizer and manure, (j) SPR 1 with fertilizer, (k) SPR 1 with manure, (l) SPR 1 with mixed fertilizer and manure, (m) CNT 1 with fertilizer, (n) CNT 1 with manure, and (o) CNT 1 with mixed fertilizer and manure. CF, MD and AWD indicate the irrigation methods of continuous flooding, mid-season drainage and alternate wet and dry, respectively. The line for each fertilizer and water management practice denotes the mean among the provinces in which the same rice variety was cultivated.
Agriculture 11 01144 g006
Table 1. Crop calendar and field management practices of RF and RR treatments.
Management
Practices
SeasonRFRR
2010201120102011
Tillagedry2 Jan: Plowing, 20 cm22 Jan: Plowing, 20 cm2 Jan: Plowing, 20 cm22 Jan: Plowing, 20 cm
7 Feb: Ploughing, 5 cm29 Jan: Ploughing, 5 cm 7 Feb: Ploughing, 5 cm29 Jan: Ploughing, 5 cm
wet9 Jul: Plowing, 20 cm 23 Jul: Plowing, 20 cm 9 Jul: Plowing, 20 cm 23 Jul: Plowing, 20 cm
14 Aug: Ploughing, 5 cm28 Aug: Ploughing, 5 cm14 Aug: Ploughing, 5 cm28 Aug: Ploughing, 5 cm
Cow manure
incorporation
dry2 Jan: 4.3 ton ha−1No application2 Jan: 4.3 ton ha−1 No application
wet9 Jul: 10 ton ha−1No application9 Jul: 10 ton ha−1No application
Rice residue
incorporation
dryNo crop residue22 Jan: 10.1 ton ha−1No crop residue22 Jan: 9.9 ton ha−1
wetNo crop residueNo crop residue9 Jul: 10.4 ton ha−123 Jul: 9.4 ton ha−1
Rice planting
and harvest
dryFallowFallow7 Feb: sowing29 Jan: sowing
26 Jun: harvest24 Jun: harvest
wet14 Aug: sowing28 Aug: sowing14 Aug: sowing28 Aug: sowing
18 Dec: harvest28 Dec: harvest18 Dec: harvest28 Dec: harvest
FertilizationdryFallowFallow12 Mar: NPK (156 kg ha−1)25 Feb: NPK (156 kg ha−1)
7 Apr: Urea (125 kg ha−1)9 Apr: NPK (78 kg ha−1) + Urea (12.5 kg ha−1)
23 May: Urea (125 kg ha−1)
wet7 Sep: NPK (156 kg ha−1)9 Oct: NPK (156 kg ha−1)7 Sep: NPK (156 kg ha−1)9 Oct: NPK (156 kg ha−1)
11 Nov: Urea (125 kg ha−1)20 Nov: Urea (125 kg ha−1)11 Nov: Urea (125 kg ha−1)20 Nov: Urea (125 kg ha−1)
Water
management
dryFallowFallowFlooding: 5–8 Feb,11 Mar–24 Mar, 7 Apr–7 May, Flooding: 27–30 Jan
14 May–10 Jun 20 Feb–9 Jun
continuous flooding, 10 cmcontinuous flooding,10 cm
wetFlooding: 13–16 AugFlooding: 19–29 AugFlooding: 13–16 AugFlooding: 19–29 Aug
1 Sep–10 Dec12 Sep–16 Dec1 Sep–10 Dec12 Sep–16 Dec
continuous flooding,10 cmcontinuous flooding,10 cmcontinuous flooding,10 cmcontinuous flooding,10 cm
RF is the single rice cropping system of fallow land in the dry season and rice in the wet season. RR is the double rice cropping system in the dry and wet seasons. NPK is a compound fertilizer of N: P2O5: K2O (15:15:15). Urea is 46:0:0 of nutrient (NPK) contents.
Table 2. Soil properties from the 24 study sites.
Rice
Varieties
ProvincesSoil TextureSand (%)Silt (%)Clay (%)BD (g cm−3)pH (1:1 Water)OM (%)SOC
(g C kg−1)
Rain-Fed Rice Cropping
KDML 105Ubon RatchathaniSL 85.6 5.8 8.6 1.63 4.93 0.5 2.9
Nakhon RatchasimaSL 67.9 11.6 20.5 1.63 5.8 0.72 4.18
SrisaketSL 64.6 18.4 17 1.63 6.7 1.08 6.26
Roi-etSL 67.9 11.6 20.5 1.63 5.8 0.72 4.18
BuriramSL 64.6 18.4 17 1.63 6.1 0.52 3.02
SurinSL 64.6 18.4 17 1.63 4.8 0.75 4.35
YasothonSL 61.2 33 5.8 1.63 4.9 0.76 4.41
Amnat CharoenSL 64.6 18.4 17 1.63 6.1 0.52 3.02
RD6Khon KaenSL 64 32 4 1.63 7.05 1.52 8.82
Sakon NakhonL 47.5 41.5 11 1.63 4.05 0.5 2.9
Udon ThaniSL 54.1 39.8 6.1 1.63 5.35 1.66 9.63
KalasinSL 67.9 11.6 20.5 1.63 6.23 0.77 4.47
Maha SarakhamSL 67.9 11.6 20.5 1.63 5.8 0.72 4.18
Irrigated Rice Cropping
PTT 1UttaraditSiCL 4.6 60.3 35.1 1.63 5.63 2.16 12.53
Chai NatSCL 62.4 15.6 22 1.63 5.26 1.39 8.06
Suphan BuriSL 70.8 23.9 5.3 1.63 6.29 1.38 8
Ang ThongC 1.1 19.3 79.6 1.39 5.44 1.99 11.54
SPR 1Nakhon SawanSiCL 17.5 46.9 35.6 1.55 6.58 1.68 9.74
RatchaburiSL 44 41 15 1.63 6.25 0.73 4.23
SaraburiC 3.7 12.3 84 1.39 6.38 4.08 23.66
KanchanaburiSL 52.7 35.4 11.9 1.63 6.4 0.74 4.29
CNT 1PhetchabunSiCL 6.3 54.6 39.1 1.55 5.98 2.21 12.82
Nakhon SawanSiCL 17.5 46.9 35.6 1.55 7.15 1 5.8
Chai NatSCL 62.4 15.6 22 1.6 5.26 1.39 8.06
KDML 105, RD6, PTT 1, SPR 1 and CNT 1 are rice variety names of Khao Dawk Mali 105, Kao Khao 6, Patum Thani 1, Suphan Buri 1 and Chainat 1, respectively. SL, L, SiCL, SCL and C denote soil texture of sandy loam, loam, silty clay loam, sandy clay loam and clay, respectively.
Table 3. Fertilizer and water management practices of the simulation scenarios.
Rice
Varieties
Scenario NamesFertilizer and Water Management PracticesRemark
FertilizerManureIrrigation
Method
(kg N ha−1 crop−1)(kg C ha−1 crop−1)(kg N ha−1 crop−1)
Rain-Fed Rice Cropping
KDML 105KDML 105_F + AWD38.75--AWDBaseline
KDML 105_F + CF38.75--CF
KDML 105_F + MD38.75--MD
KDML 105_M + AWD-3875276.78AWD
KDML 105_M + CF-3875276.78CF
KDML 105_M + MD-3875276.78MD
KDML 105_F + M + AWD38.753875276.78AWD
KDML 105_F + M + CF38.753875276.78CF
KDML 105_F + M + MD38.753875276.78MD
RD6RD6_F + AWD38.75--AWDBaseline
RD6_F + CF38.75--CF
RD6_F + MD38.75--MD
RD6_M + AWD-3875276.78AWD
RD6_M + CF-3875276.78CF
RD6_M + MD-3875276.78MD
RD6_F + M + AWD38.753875276.78AWD
RD6_F + M + CF38.753875276.78CF
RD6_F + M + MD38.753875276.78MD
Irrigated Rice Cropping
PTT 1PTT 1_F + CF121.25--CFBaseline
PTT 1_F + MD121.25--MD
PTT 1_F + AWD121.25--AWD
PTT 1_M + CF-58041.43CF
PTT 1_M + MD-58041.43MD
PTT 1_M + AWD-58041.43AWD
PTT 1_F + M + CF121.2558041.43CF
PTT 1_F + M + MD121.2558041.43MD
PTT 1_F + M + AWD121.2558041.43AWD
SPR 1SPR 1_F + CF121.25--CFBaseline
SPR 1_F + MD121.25--MD
SPR 1_F + AWD121.25--AWD
SPR 1_M + CF-58041.43CF
SPR 1_M + MD-58041.43MD
SPR 1_M + AWD-58041.43AWD
SPR 1_F + M + CF121.2558041.43CF
SPR 1_F + M + MD121.2558041.43MD
SPR 1_F + M + AWD121.2558041.43AWD
CNT 1CNT 1_F + CF121.25--CFBaseline
CNT 1_F + MD121.25--MD
CNT 1_F + AWD121.25--AWD
CNT 1_M + CF-58041.43CF
CNT 1_M + MD-58041.43MD
CNT 1_M + AWD-58041.43AWD
CNT 1_F + M + CF121.2558041.43CF
CNT 1_F + M + MD121.2558041.43MD
CNT 1_F + M + AWD121.2558041.43AWD
F and M denote the application of chemical fertilizer and cow manure, respectively. Irrigation methods of CF, MD and AWD indicate continuous flooding, mid-season drainage and alternate wet and dry, respectively. The baseline of each rice cultivar indicates the traditional management practice.
Table 4. Effects of fertilizer and water management practices on simulated grain yields (kg C ha−1 crop−1) in the wet season at the start years (2011–2015) and the end years (2046–2050) of the simulation period.
StartEndEnd/Start (%)
Fertilizer Management Practices on Grain Yields
FMF + MFMF + MFMF + M
KDML 1051000 ± 17 c1100 ± 8 b1140 ± 4 a1030 ± 27 a949 ± 2 b960 ± 1 b103 ± 287 ± 185 ± 0
RD6993 ± 22 b894 ± 19 c1200 ± 8 a1020 ± 18 b844 ± 7 c1170 ± 12 a102 ± 195 ± 398 ± 1
PTT 12000 ± 217 a699 ± 53 b 2130 ± 190 a1820 ± 156 a722 ± 41 b1868 ± 176 a91 ± 5103 ± 288 ± 2
SPR 11840 ± 85 a684 ± 54 b1930 ± 117 a1710 ± 53 a690 ± 58 b1760 ± 78 a93 ± 2101 ± 191 ± 4
CNT 11770 ± 171 a635 ± 46 b1850 ± 174 a1590 ± 165 a 700 ± 36 b1610 ± 175 a90 ± 5110 ± 287 ± 2
Water Management Practices on Grain Yields
CFMDAWDCFMDAWDCFMDAWD
KDML 1051080 ± 77 a1070 ± 83 a1090 ± 70 a985 ± 62 a971 ± 32 a983 ± 57 a91 ± 1291 ± 1091 ± 11
RD61030 ± 173 a1010 ± 180 a1040 ± 168 a1010 ± 182 a1010 ± 178 a1010 ± 195 a98 ± 599 ± 497 ± 5
PTT 11575 ± 890 a1730 ± 1030 a1520 ± 762 a1400 ± 692 a1580 ± 854 a1430 ± 650 a93 ± 1294 ± 1095 ± 7
SPR 11440 ± 777 a1550 ± 867 a1470 ± 718 a1330 ± 665 a1410 ± 734 a1410 ± 649 a95 ± 793 ± 797 ± 5
CNT 11380 ± 766 a1520 ± 885 a1350 ± 659 a1230 ± 550 a1410 ± 705 a1250 ± 503 a94 ± 1797 ± 1496 ± 13
F and M denote the application of chemical fertilizer and cow manure, respectively. CF, MD and AWD indicate continuous flooding, mid-season drainage and alternate wet and dry, respectively. Values in the effects of fertilizer management practices given are means among the three water managements (CF, MD and AWD) and the corresponding 95% CI. Values in the effects of water management practices given are means among the three fertilizer managements (F, M and F + M) and the corresponding 95% CI. Means with different letters in the rows of each rice varieties at the start and the end years of simulation period are significantly different at the 0.05 level (ANOVA and Duncan’s MRT).
Table 5. Effects of fertilizer and water management practices on simulated CH4 emissions (kg C ha−1 y−1) at the start years (2011–2015) and the end years (2046–2050) of the simulation period.
StartEndEnd/Start (%)
Fertilizer Management Practices on CH4 Emissions
FMF + MFMF + MFMF + M
KDML 105394 ± 209 a526 ± 134 a530 ± 140 a405 ± 211 a623 ± 134 a.633 ± 140 a103 ± 2119 ± 6120 ± 6
RD6366 ± 199.6 a407 ± 212 a476 ± 252 a354 ± 189 a442 ± 228 a533 ± 278 a97 ± 3109 ± 5112 ± 5
PTT 11850 ± 767 a1090 ± 548 a1870 ± 763 a2370 ± 841 a1390 ± 616 a2400 ± 824 a130 ± 12130 ± 12131 ± 12
SPR 11920 ± 781 a1070 ± 537 a1950 ± 765 a2690 ± 1007 a1380 ± 658 a2750 ± 978 a142 ± 5131 ± 7142 ± 7
CNT 11390 ± 459 a892 ± 374 a1420 ± 472 a1760 ± 464 a1150 ± 408 a1790 ± 480 a128 ± 13131 ± 14127 ± 13
Water Management Practices on CH4 Emissions
CFMDAWDCFMDAWDCFMDAWD
KDML 105636 ± 54 a458 ± 67 b357 ± 142 b699 ± 109 a547 ± 135 ab414 ± 194 b110 ± 8119 ± 13114 ± 12
RD6625 ± 93 a386 ± 57 b237 ± 39 c655 ± 146 a428 ± 100 b246 ± 57 b104 ± 9110 ± 10103 ± 8
PTT 12250 ± 658 a1530 ± 430 ab1030 ± 416 b2790 ± 814 a1910 ± 544 ab1480 ± 593 b124 ± 0124 ± 1143 ± 1
SPR 12280 ± 722 a1610 ± 527 ab1050 ± 452 b3090 ± 1090 a2200 ± 830 a1540 ± 707 a135 ± 6136 ± 9145 ± 7
CNT 11620 ± 417 a1230 ± 290 ab856 ± 308 b1990 ± 476 a1490 ± 337 ab1210 ± 417 b123 ± 3121 ± 1142 ± 3
F and M denote the application of chemical fertilizer and cow manure, respectively. CF, MD and AWD indicate continuous flooding, mid-season drainage and alternate wet and dry, respectively. Values in the effects of fertilizer managements given are means among the three water management practices (CF, MD and AWD) and the corresponding 95% CI. Values in the effects of water managements given are means among the three fertilizer management practices (F, M and F + M) and the corresponding 95% CI. Means with different letters in the rows of each rice varieties at the start and the end years of simulation period are significantly different at the 0.05 level (ANOVA and Duncan’s MRT).
Table 6. Summary of comparative data of the DNDC model performance.
Output
Study
This StudyOther StudyReference
Simulation YearResultSimulation YearResult
SOC2R2 = 0.3631R2 = 0.95 to 0.99Naher et al. [22]
Slope = 0.47nRMSE = 4.1 to 7.9
NRMES = 1.58
Grain yield 2R2 = 0.8320R2 = 0.99Minamikawa et al. [36]
slope = 0.98NRMSE = 0.11
NRMES = 0.3022R2 = 0.96 to 0.98Pandey et al. [40]
slope = 1.08 to 1.21
RMSD = 150 to 174
1R = 0.93 to 0.99Wang et al. [41,42]
MAE = 2.2 to 6.6%
25R2 = 0.62 to 0.69Tian et al. [43]
Slope = 0.52 to 0.64
CH4 emission2R2 = 0.83 1RMSE = 1.76 to 1.86Katayanagi et al. [44]
slope = 0.7420R2 = 0.96Minamikawa et al. [36]
NRMES = 0.43NRMSE = 0.29
1R2 = 0.76Zhao et al. [45]
ME = 0.71
2RMSE = 0.30 to 1.85Oo et al. [46]
22R2 = 0.93 to 0.97Pandey et al. [40]
slope = 0.77 to 0.87
RMSD = 35.40 to 41.60
1R = 0.90Wang et al. [41,42]
MAE = 15.7%
N2O emission2R2 = 0.83 1RMSE = 2.23 to 124Katayanagi et al. [44]
slope = 0.762RMSE = 7.4 to 97.0Oo et al. [46]
NRMES = 0.741R2 = 0.71Zhao et al. [45]
ME = 0.67
R is the coefficient of correlation. R2 (R square) is the coefficient of determination. MAE is the mean absolute error. ME is the Nash–Sutcliffe index of model efficiency. RMSE is the root mean square error. NRMSE or nRMSE is the normalized root mean square error. RMSD is the root mean square deviation.
Publisher’s Note: MDPI stays neutral with regard to jurisdictional claims in published maps and institutional affiliations.

