Article

Effect of Climate-Smart Agriculture Practices on Climate Change Adaptation, Greenhouse Gas Mitigation and Economic Efficiency of Rice-Wheat System in India

1
Department of Agronomy, CCS Haryana Agricultural University, Hisar 125004, India
2
ICAR-Central Soil Salinity Research Institute, Karnal 132001, India
3
International Maize and Wheat Improvement Center (CIMMYT), NASC Complex, Pusa, New Delhi 110012, India
4
International Maize and Wheat Improvement Center (CIMMYT), El-Batan, Texcoco 56237, Mexico
*
Authors to whom correspondence should be addressed.
Agriculture 2021, 11(12), 1269; https://doi.org/10.3390/agriculture11121269
Submission received: 6 October 2021 / Revised: 1 December 2021 / Accepted: 1 December 2021 / Published: 14 December 2021
(This article belongs to the Special Issue Greenhouse Gas Mitigation in Agriculture)

Abstract

:
Conventional rice–wheat (RW) rotation in the Indo-Gangetic Plains (IGP) of South Asia is tillage, water, energy, and capital intensive. Coupled with these, crop residue burning contributes significantly to greenhouse gas (GHG) emission and environmental pollution. So, to evaluate the GHG mitigation potential of various climate-smart agricultural practices (CSAPs), an on-farm research trial was conducted during 2014–2017 in Karnal, India. Six management scenarios (portfolios of practices), namely, Sc1—business as usual (BAU)/conventional tillage (CT) without residue, Sc2—CT with residue, Sc3—reduced tillage (RT) with residue + recommended dose of fertilizer (RDF), Sc4—RT/zero tillage (ZT) with residue + RDF, Sc5—ZT with residue + RDF + GreenSeeker + Tensiometer, and Sc6—Sc5 + nutrient-expert tool, were included. The global warming potential (GWP) of the RW system under CSAPs (Sc4, Sc5, and Sc6) and the improved BAU (Sc2 and Sc3) were 33–40% and 4–26% lower than BAU (7653 kg CO2 eq./ha/year), respectively. This reflects that CSAPs have the potential to mitigate GWP by ~387 metric tons (Mt) CO2 eq./year from the 13.5 Mha RW system of South Asia. Lower GWP under CSAPs resulted in 36–44% lower emission intensity (383 kg CO2 eq./Mg/year) compared to BAU (642 kg CO2 eq./Mg/year). Meanwhile, the N-factor productivity and eco-efficiency of the RW system under CSAPs were 32–57% and 70–105% higher than BAU, respectively, which reflects that CSAPs are more economically and environmentally sustainable than BAU. The wheat yield obtained under various CSAPs was 0.62 Mg/ha and 0.84 Mg/ha higher than BAU during normal and bad years (extreme weather events), respectively. Thus, it is evident that CSAPs can cope better with climatic extremes than BAU. Therefore, a portfolio of CSAPs should be promoted in RW belts for more adaptation and climate change mitigation.

1. Introduction

In the era of climate change, traditional rice farming has been criticized for the elevated level of GHG emissions. Intensive tillage, in situ burning of crop residue, faulty irrigation management, and indiscriminate use of chemical fertilizers are the main sources of anthropogenic GHG emissions in the RW production system and are accountable for ill effects of climate change [1,2,3,4]. Methane from enteric fermentation and rice cultivation [5] and nitrous oxide emissions from soil and from applied fertilizers [1,6] are major contributors to agricultural GHG emissions. A recent report by the Intergovernmental Panel on Climate Change (IPCC) highlighted that the current level of GHG emissions needs to be reduced considerably to limit the temperature rise to below 2 °C (UNFCCC 2015). Although the contribution from the agriculture sector to global emissions is lower than industrial, energy, and other sectors [7], appropriate mitigation and adaptation strategies can further reduce the carbon footprints of agriculture [8]. Rice–wheat rotation in South Asia is the key source of livelihood, employment, and income for millions of people and spreads over an area of 13.5 Mha [9]. However, it is also being criticized for higher GHG emissions in many forums. Farmers’ current production practices (business as usual) of rice–wheat rotation are conventional tillage (generally performed by 5–6 passes of harrow, cultivator, and rotavator for seedbed preparation and sowing), inappropriate use of irrigation (higher than the required) and inorganic fertilizers (imbalanced), crop residue burning, and other faulty management practices that are inefficient in resource use and carbon intensive [4,10,11,12]. Intensive uses of N fertilizers are the largest source of N2O emission in the RW system of IGP. From its production in the factory to losses from the field, the application of excessive N fertilizer (urea) @ > 185 kg N per hectare against the recommended dose of 150 kg to rice and wheat crops increases the carbon footprint. Almost 50% of the applied N in RW rotation is lost to the environment and results in the wasting of resources and environmental pollution problems [12,13].
Although the productivity of RW rotation in IGP increased after the Green Revolution, the rate of increase has been reduced significantly nowadays [8,10]. On the other hand, projections show that rice and wheat production would have to increase by nearly 1.10% and 1.70% per year, respectively, over the next four decades to meet the food requirement [8,14]. Given the limited scope for horizontal expansion, the increase in production has to come through system intensification. If appropriate measures are not taken, the farmers’ as-usual practices will lead to an increased C-footprint from agriculture in the future [15]. Hence, higher production from system intensification has to come through sustainable and resilient management practices and policy portfolio.
The sustainability of a crop production system depends on cropping system-based management optimization for crop productivity, profitability, and environmental impacts. Certain crop management practices are climate resilient, as they favor C-sequestration while minimizing GHG emissions [4,15]. There are numerous mitigation opportunities from several climate-smart agriculture practices (CSAPs), which are more productive, profitable, and eco-friendly [8]. A systematic analysis of the C-footprint of RW rotation in IGP is required for targeting the practices/technologies that help mitigate GHG emissions while adapting to the climatic risks [1,12,13]. In addition to soil, production inputs, crop residue burning, and consumption of fossil fuel in various on-farm activities significantly contribute to total GHG emissions from the RW rotation. Therefore, it is very essential to estimate an overall C-footprint of production technologies to identify resource-efficient and resilient practices/technologies. Most of the earlier research has reported the C-footprint of production practices from research station-based studies in IGP. However, information on village- and farmer-level (from a climate-smart village) C-foot print analysis of CSAPs in IGP is rare. We therefore undertook an on-farm multi-location participatory study in climate-smart villages of Haryana (India) for three years. The basic objectives of the study were to (i) assess the potential large-scale benefits of the portfolio of CSAPs for adaptation and GHG mitigation in an RW rotation of IGP, (ii) estimate GHG (CO2, N2O, CH4) emissions, global warming potential (GWP), and eco-efficiency from a different portfolio of practices/technologies in both rice and wheat crops to find low-carbon-emission options for RW rotation of the IGP, and (iii) estimate the area- and yield-scaled mitigation potential of the productive and resilient portfolio of CSAPs for RW rotation of IGP.

2. Material and Methods

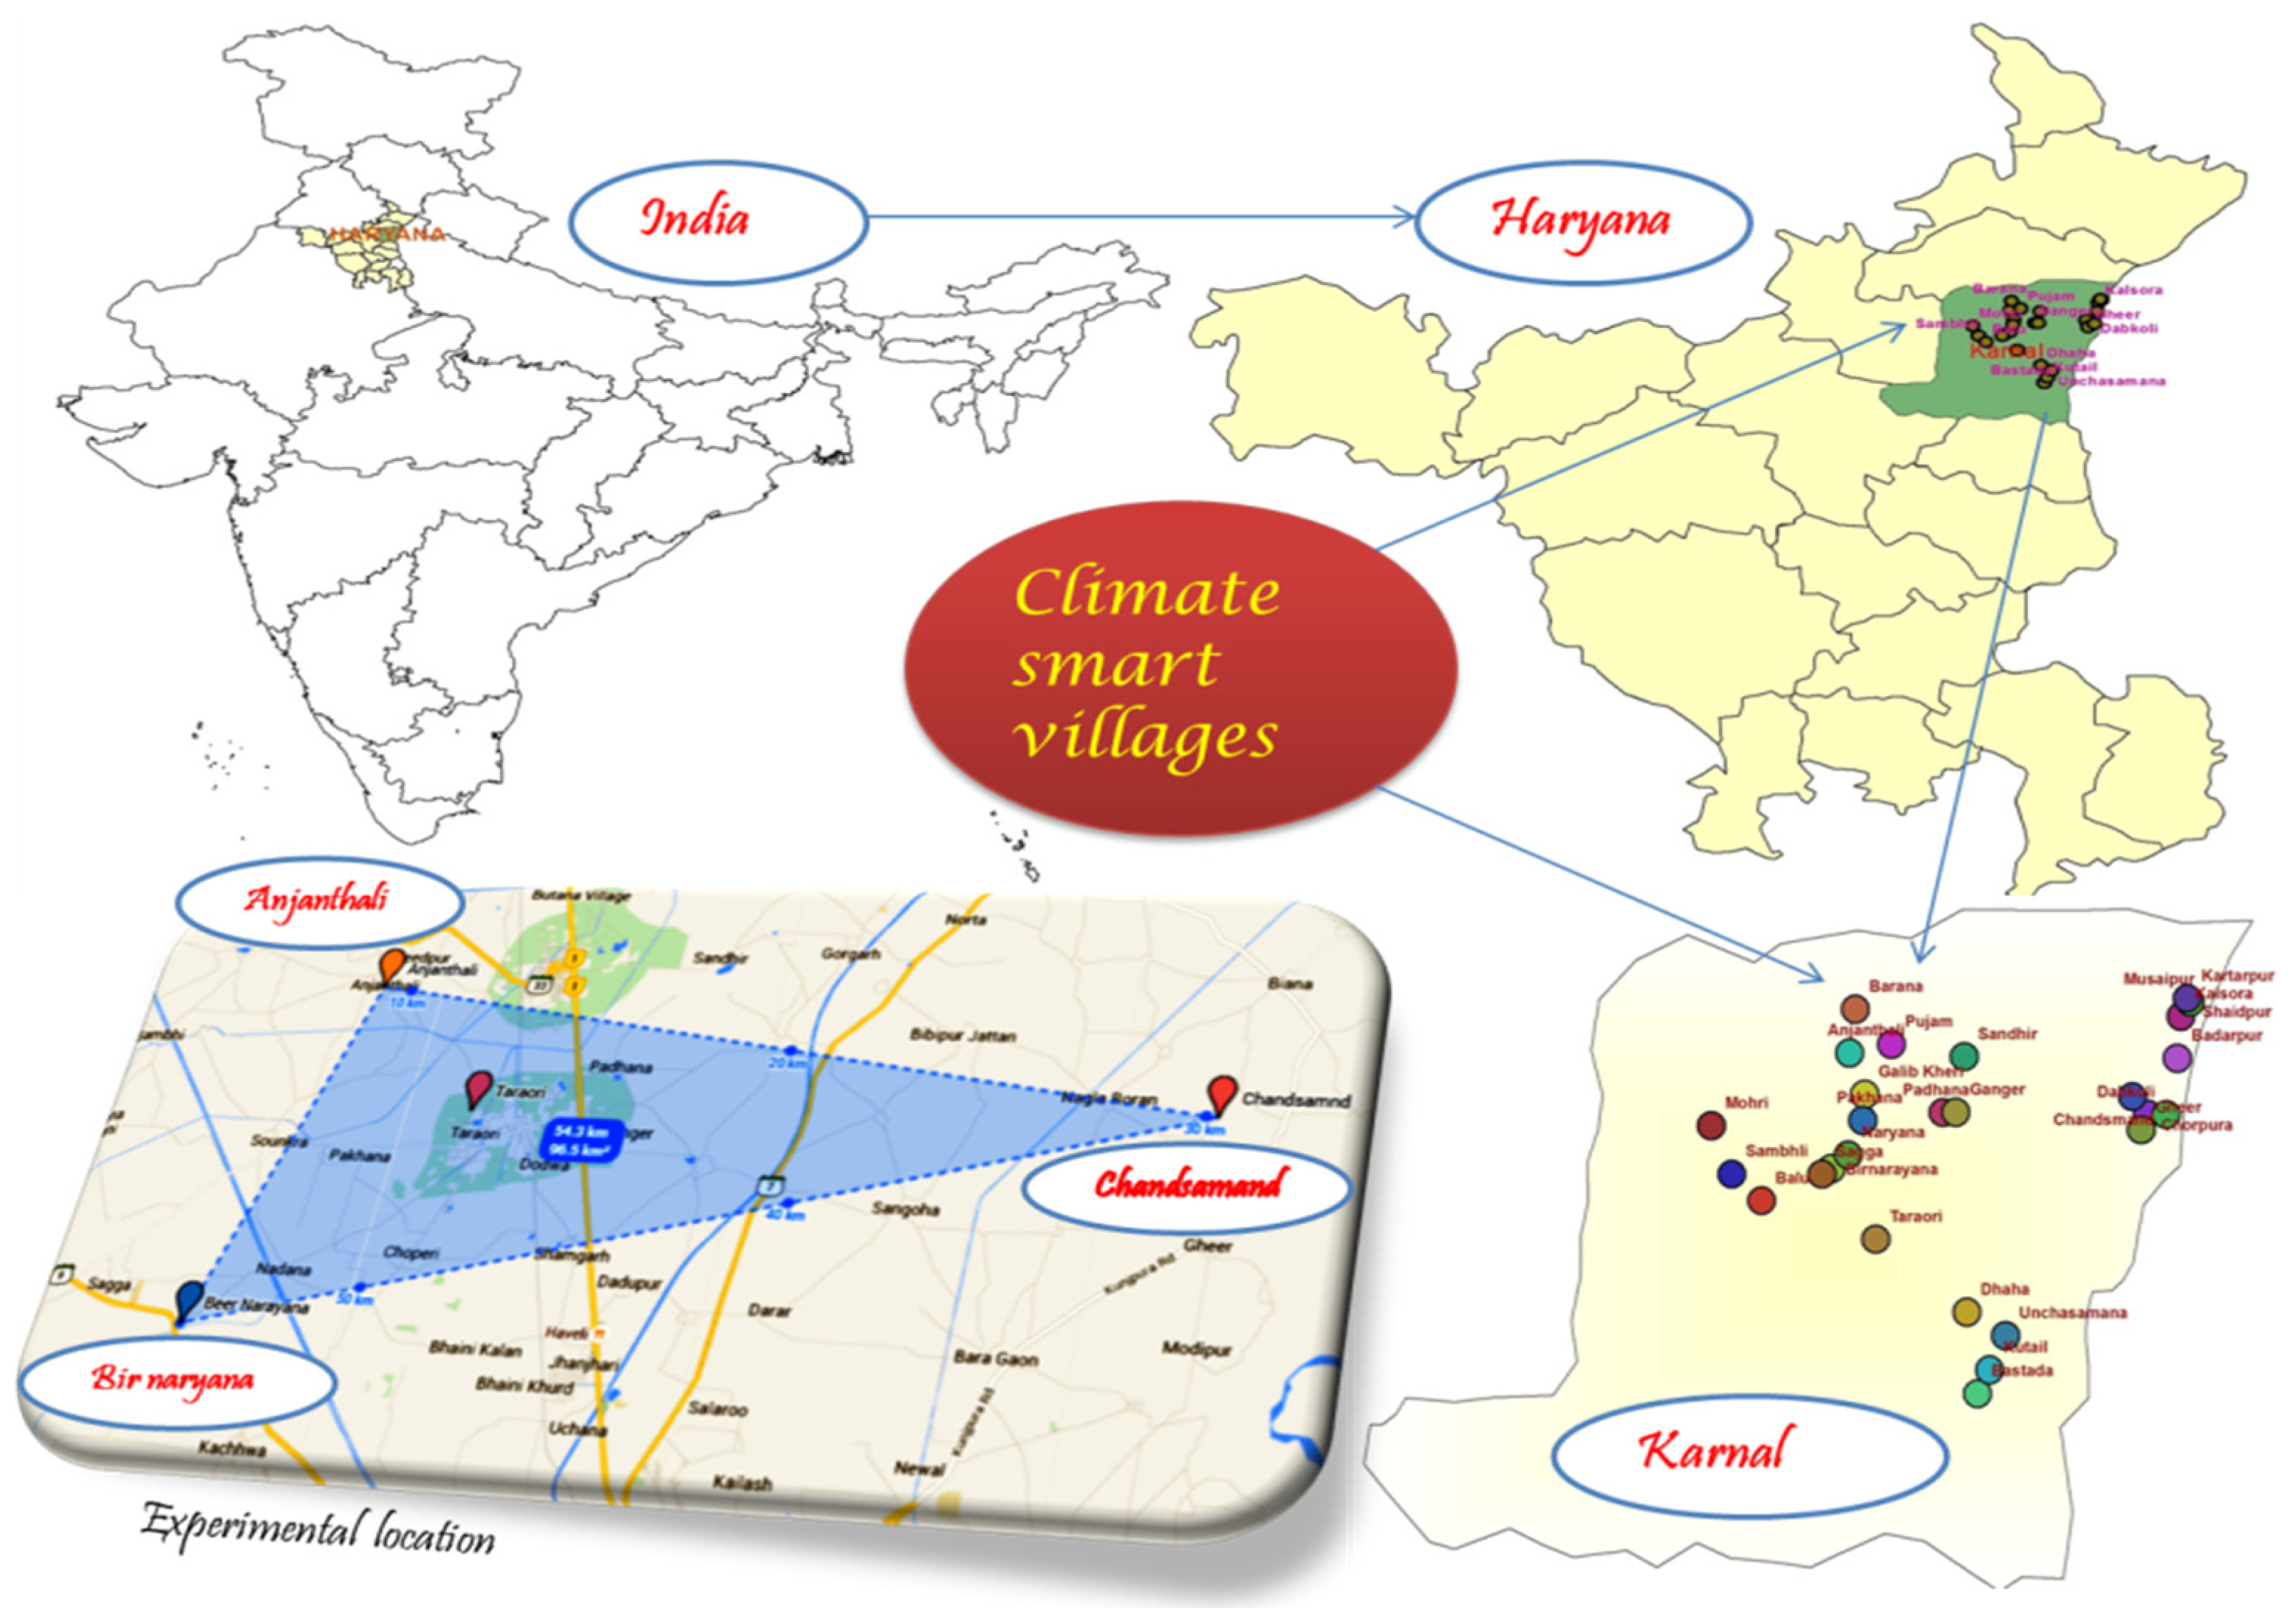
2.1. Experimental Place and Climate Conditions

A participatory on-farm research trial was carried out during the 2014–2015, 2015–2016, and 2016–2017 rice–wheat seasons in three climate-smart villages (CSVs; https://ccafs.cgiar.org/publications/climate-smart-villages-haryana-india, accessed on 16 April 2017) at Anjanthali, Birnarayana, and Chandsamand of Haryana, India (Figure 1). The experimental sites were under a continuous rice–wheat–fallow rotation for 30 years before the commencement of the experiment. The climate of Karnal district is sub-tropical, characterized by dry and hot summers and cold winters, with 700 mm of annual rainfall (nearly 80% of which is received during the months of mid-June to mid-September).

2.2. Scenario Details

A participatory on-farm study was initiated during the rainy season of 2014, with six treatments referred to as scenarios. The term “scenario” can be described as a portfolio of practices with more than two agronomic interventions in each treatment. Six scenarios with the layering of various climate-smart technologies are Sc1 (Business as usual)—conventional tillage (CT) without residue, Sc2—CT with residue, Sc3—reduced tillage (RT) with residue + recommended dose of fertilizer (RDF), Sc4—RT/zero tillage (ZT) with residue + RDF, Sc5—ZT with residue + RDF + GreenSeeker + Tensiometer, and Sc6—ZT with residue + nutrient expert + GreenSeeker + Tensiometer. Sc1 and Sc2 are related to intensive tillage operation, whereas Sc3 is related to minimum tillage operation with a traditional agronomic package and practices. Sc5 and Sc6 are related to no tillage with a modern agronomic package and practices. The detailed description of the scenarios together with the common management practices are given in Table 1. The various interventions involved in the six scenarios included tillage, crop establishment, precision land-levelling, cultivars, crop residue management, nutrient management, water management, ICTs (information and communication tools), and index-based crop insurance. Each scenario was evaluated in 1000 m2 plots and repeated in three locations for each of the three years.

2.3. Crop and Residue Management

Details of the crop management are given in Table 1. To compare the productivity of different crops and total system productivity of the different scenarios, the yield of non-rice crops (wheat) was converted into rice equivalent yield (REY) (Mg/ha) and calculated as follows:
Rice   equivalent   yield = Grain   yield   of   non   rice   crop   ( Mg / ha ) × MSP   of   non   rice   crop   ( INR / Mg ) MSP   of   rice   ( INR / Mg )
where MSP is the minimum support price and INR is the India national rupee.
Rice and wheat residue were managed (incorporated or retained) as per the scenario explanation given in Table 1. The harvesting was done with a combine machine in all the scenarios and the height of the anchored stubble was 30–40 cm in rice and 10–15 cm in wheat, except in business as usual (Sc1), where in Sc1, the harvesting of rice and wheat was done with the combine harvester machine from the surface of the ground and the entire aboveground residues of rice and wheat were burned or removed.
Scenarios Sc2, Sc3, Sc4, Sc5, and Sc6 received a total of 33.8, 34.03, 35.10, 35.38, and 36.15 t/ha crop residues, respectively, in the three years of the study. In Sc2, 9.5 to 9.9 t/ha of anchored rice stubble and 1.4 to 1.7 t/ha anchored wheat stubble were incorporated over the years at the time of wheat and rice sowing/transplanting, respectively. In Sc3, 9.2 to 10.2 t/ha of rice and 1.5 to 1.7 t/ha of wheat residues were incorporated into soil during field preparation for the sowing of wheat and rice, respectively. In Sc4, Sc5 and Sc6, full rice (9.2 to 11.0 t/ha) and anchored wheat stubble (1.6 to 1.9 t/ha) was retained on the soil surface over the years.

2.4. Irrigation Management

Scenario descriptions and irrigation management practices are given in Table 1. In transplanted rice, the field was regularly submerged with 5 ± 2 cm of water for ~40 days after transplanting, followed by irrigation of water when small hairline cracks appeared in the field. In direct-seeded rice (DSR) plots, the field was kept wet until complete germination of seeds and then further irrigation was applied on the appearance of small hairline cracks. In wheat, irrigation was applied based on a certain time interval (20–25 days). In Sc5 and Sc6, irrigation water was applied according to the threshold of the soil matric potential (SMP) using an irrometer/tensiometer installed in the plots.

2.5. Nutrient Management

Protocols related to nutrient management in each scenario are presented in Table 1. All the amount of P2O5, K2O, and ZnSO4 was applied at the seeding/transplanting time through di-ammonium phosphate (DAP), potassium chloride/muriate of potash (MOP), and zinc sulphate, respectively. A small quantity of nitrogen (23.5 kg/ha) was also applied at the sowing time (as basal) and the remaining N was applied through urea in three equal splits in both the crops, except in Sc5 and Sc6, where the nitrogen amount for the third split was determined by GreenSeeker (GreenSeeker protocol as described by Singh et al. [6]. Two equal N splits were applied manually by broadcasting urea at 20–25 and 45–50 days after seeding (DAS)/transplanting in rice and at 20–21 and 40–45 DAS in wheat. A third N dose was given at 60–70 and 50–60 days after sowing in rice and wheat, respectively. In the Sc1 and Sc2 scenarios, basal fertilizer was broadcasted in both the crops, whereas in the other scenarios it was drilled at the time of sowing.

2.6. Greenhouse Gas Emission Estimation

The estimation of GHG emissions was computed by using the CCAFS Mitigation Option Tool (CCAFS-MOT) [16]. In this tool, many empirical models are combined to estimate the GHG emissions in any production system. The tool considers specific factors, namely, climatic conditions, soil characteristics, crop production inputs, and other management activities that influence emissions. The background- and fertilizer-induced emissions were estimated using the multivariate empirical model (MEM) of Bouwman et al. [17] for nitrous oxide (N2O) and nitric oxide (NO) emissions, and the FAO/IFA [18] model for ammonia (NH4) emissions. Emissions driven by crop residue management were computed through IPCC N2O Tier-1 emission factors. The ecoinvent database was used to estimate the emissions from crop production and fertilizer transportation [19].
Fertilizer-induced field emission of N2O (which constitutes a significant portion) was estimated using Bouman’s model. In this model, emissions are estimated by taking into account fertilizer type and quantity together with soil and climatic condition using the following formula.
l o g ( N 2 O + N ) . = A + i = 1 n E i + E f × N   a p p l i e d
where A = constant;
Ei = effective value for factors i (soil organic carbon, pH, soil texture, climate, crop type);
Ef = factor for N input (0.0038 for N2O and 0.0061 for NO).
Alterations in SOC due to tillage operations, farmyard manure, and residue retention/incorporation were based on the IPCC methodology, as described by Smith et al. [20] and Ogle et al. [21]. Further the CO2 emissions from the soil resulting from urea or liming were predicted by the IPCC methodology [22]. The GWP of the production systems was based on the GWP (over 100 years) of 298 for N2O and 34 for CH4 (IPCC, [23]; Equation (1)). GHG intensity is the ratio of total GWP to the grain yield (Equation (3)). The net GWP of the RW rotation was estimated by using all the sources and sinks of greenhouse gases such as emissions due to the production and transportation of fertilizers, field operations (tillage, seeding, irrigation), retention/incorporation of crop residues, land-use management, burning of crop residue, C-sequestration, and soil flux of GHGs.
GWP (kg CO2 eq./ha) = CO2 (kg/ha) + N2O (kg/ha) × 298 + CH4 (kg/ha) × 34
Total GWP = ∆soil C GWP + soil CH4 emission + soil N2O emission + operation GHG emission + Input GHG emission
GHG Intensity (GWP per unit of grain yield) = Total GWP/the grain yield

2.7. N-Factor Productivity (FPn)

Partial factor productivity (PFP) is an index to measure resource use efficiency. It brings an integrative equation that measures total economic gain compared to the utilization of all resources in the system related to nutrients [24]. N-factor productivity was calculated using the equation given below [24].
N - factor   productivity   ( FPn ) = Grain   yield   kg / ha Applied   fertilizer   N   kg / ha

2.8. Economic Efficiency (EE)

Eco-efficiency is an index aimed at de-coupling resource use and pollutant release from economic activity, and the indicator eco-efficiency is defined as a ratio between economic value added and ecological destruction that has occurred [25]. The environmental footprints can be measured in terms of the amount of GHG emitted (kg. CO2 eq.) by farming practices. In this paper, eco-efficiency was calculated using the following formula:
Eco - efficiency   ( USD / kg   CO 2   eq . ) = Economic   Return   ( USD / ha ) Global   warming   potential   ( kg   CO 2   eq . / ha )  

2.9. Statistical Analysis

The analysis of variance (ANOVA) technique was used to analyze the experimental data [26]. Data analysis was done with the SAS 9.1 software [27]. Tukey’s honestly significant difference (HSD) procedure was used for comparing treatment means at a 5% level of significance. Principal component analysis (PCA) was done with JMP 14.1 software. The results were submitted to PCA in order to determine the common relationships between parameters.

3. Results

3.1. Estimates of Greenhouse Gas (GHG) Emissions

3.1.1. Methane (CH4) Emissions

Estimated CH4 emissions (kg CO2 eq./ha) from rice field were the highest in Sc2 and Sc1 as compared to other scenarios in all the years of experimentation. Sc2 had 15% higher CH4 emissions (kg CO2 eq./ha) compared to BAU (Table 2). In general, puddled scenarios (3–4 wet tillage) where crop residues were incorporated had higher CH4 emissions than when crop residues were removed from the field (Table 2). On an average, the direct seeded rice scenarios, Sc4, Sc5, and Sc6 (mean values are presented), emitted 42 and 50% lower CH4 (kg CO2 eq./ha) compared to BAU (2607 kg CO2 eq./ha) and Sc2 (3001 kg CO2 eq./ha), respectively (Table 2). The linear contrast showed a greater influence of CH4 emissions by various management practices. The results of the contrast also showed lower CH4 under CSAPs compared to BAU and I-BAU (Table 3).

3.1.2. Nitrous Oxide (N2O) Emissions

The GWP associated with N2O emissions varied from 10.3 to 963.1 kg CO2 eq./ha during the rice cropping period. Maximum N2O emissions (950.7 kg CO2 eq./ha) were estimated under the Sc5 scenario and the lowest under Sc1 (10.4kg CO2 eq.//ha) during all years (three years’ mean). CSAPs produced nine times higher N2O emissions compared to BAU during the three years (Table 2).
The N2O emission from wheat cultivation ranged from 1000 to 1439 kg CO2 eq./ha in all the years (Table 2). The three-year average N2O emissions decreased by 16% under CSAPs compared to Sc2 (Table 2). The CSAPs had about 14% higher N2O emissions compared to BAU in wheat cultivation during the three years (mean of 3 yrs). The GWP in terms of N2O emissions from the RW system was almost double in CSAPs compared to BAU (Table 2). The contrast effect (FFF vs. PNM) was significant for N2O in both the crops (Table 3).

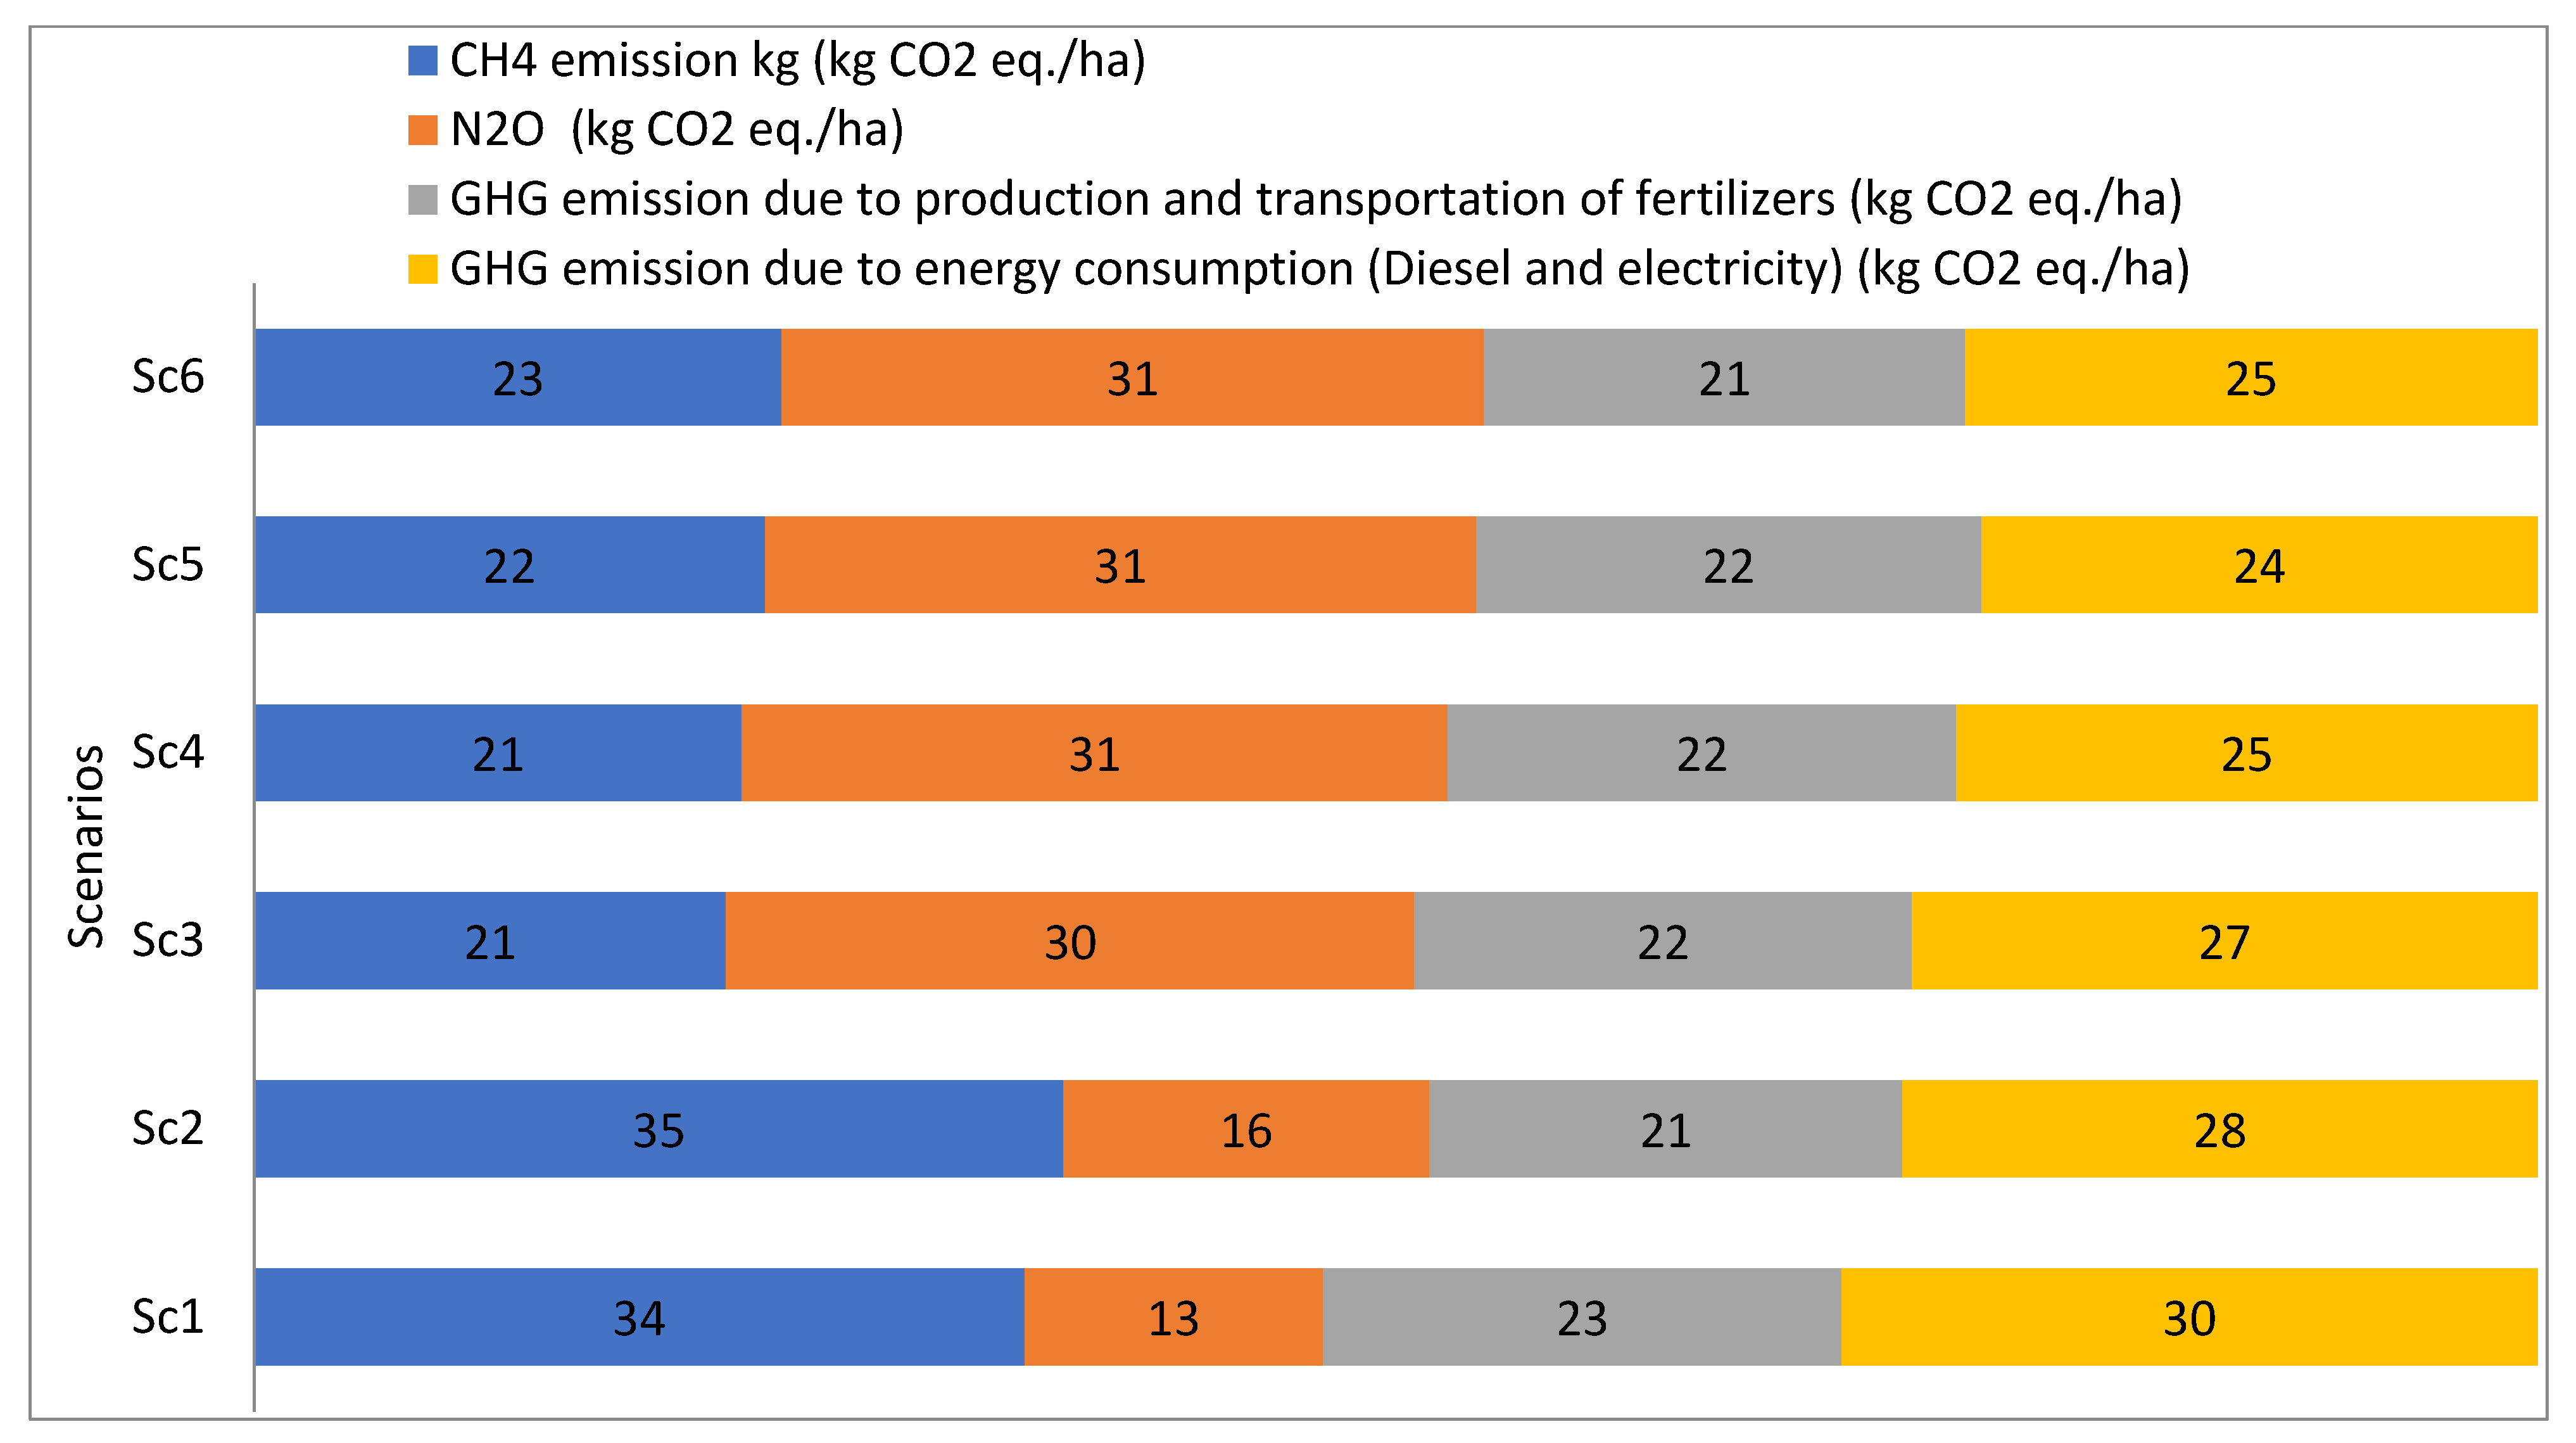
3.2. GHG Emissions Associated with Fertilizer and Energy Consumption

The estimate of GHG emissions due to the production and transportation of fertilizers was highest under BAU in both the crops and in the RW system and lowest under CSAPs (average of Sc4, Sc5, and Sc6) (Table 2 and Figure 2). The interaction and contrast effect were significant for the GHG emissions associated with fertilizers (Table 3). It was higher by 23%, 14%, and 18% in rice, wheat, and system, respectively, under farmer fertilizer practice (Sc1) compared to precision nutrient management (PAN) scenarios (mean of Sc5 and Sc6).
GHG emissions due to energy consumption varied from 1241 to 2053 and from 219 to 550 kg CO2 eq./ha in rice and wheat, respectively (Table 2 and Figure 2). Estimated GHG emissions due to energy consumption in CSAPs were 27 and 32% lower under rice and wheat than BAU, respectively (Table 2). On the system basis, Sc6, Sc5, and Sc4 recorded lower energy-related GHG emissions by 31, 31, and 24%, respectively, relative to BAU (2354 kg CO2 eq./ha). The linear contrast effects were significant for GHG emissions associated with energy consumption (diesel and electricity) (Table 3). Scenario × crop interaction effect showed that rice emitted more GHGs due to energy consumption (diesel and electricity) compared to wheat (Table 3).

3.3. Carbon Sequestration

Estimated C-sequestration varied from 66 to 498 kg CO2 eq./ha/yr in rice and from 0 to 1703 kg CO2 eq./ha/yr in wheat (Table 2). Overall, C-sequestration was the highest under CSAPs in both the crops and in RW system and the lowest under BAU. C-sequestration in the RW system was 26.0 and 20.7 times higher in CSAPs and Sc3, respectively, compared to BAU (74 kg CO2 eq./ha/yr) (Table 2). The Sc2 and Sc3 (improved BAU) also sequestered 17 times higher carbon sequestration than BAU. The linear contrast effect showed business as usual, improved BAU, and climate-smart agricultural practices significantly influenced carbon sequestration.

3.4. Total Global Warming Potential (GWP)

Global warming potential (GWP) per hectare and greenhouse gas intensity (emission per unit of crop yield) varied with crop management practice portfolios. On an average, the GWP of BAU activities was 5304 kg CO2 eq./ha and the GHG intensity was 791 kg CO2 eq./Mg of rice, whereas CSAPs emitted only 4016 kg CO2 eq./ha and 599 kg CO2 eq./Mg rice (mean of 3 yrs) (Table 2). Among the six scenarios of rice, Sc2 recorded the highest GWP during the three years compared to BAU. CSAPs (mean of Sc4, Sc5, and Sc6) had a 24% lower GWP compared to BAU (average of 3 yrs) (Table 2). The contrast effect (BAU vs. CSA, BAU vs. I-BAU, and FFF vs. PNM) was significant for GWP (Table 3). It was higher by 8–25% in rice under CSAPs, I-BAU, and PNM compared to BAU/FFP.
Convergence/layering of varied agronomic management practices influenced the total GWP (CO2 eq./ha) in wheat during the study years (Table 2). On average, BAU emitted 2348 kg CO2 eq./ha and 466kg CO2 eq./Mg wheat, whereas CSAPs emitted only 828 kg CO2 eq./ha and 145 kg CO2 eq./Mg wheat. Sc6 recorded the lowest GWP amongst all the scenarios and was 71% lower (3 years’ mean) than BAU in wheat. On the system basis, Sc6, Sc5, Sc4, and Sc3 noted a lower GWP by 40, 37, 33, and 26%, respectively, than BAU (7653 kg CO2 eq./ha) (Figure 2). The contrast effect (BAU vs. CSA, BAU vs. I-BAU, and FFF vs. PNM) was significant for GWP in both the crops (Table 3). It was higher by 32–68% in wheat under CSAPs, I-BAU, and PNM compared to BAU/FFP.

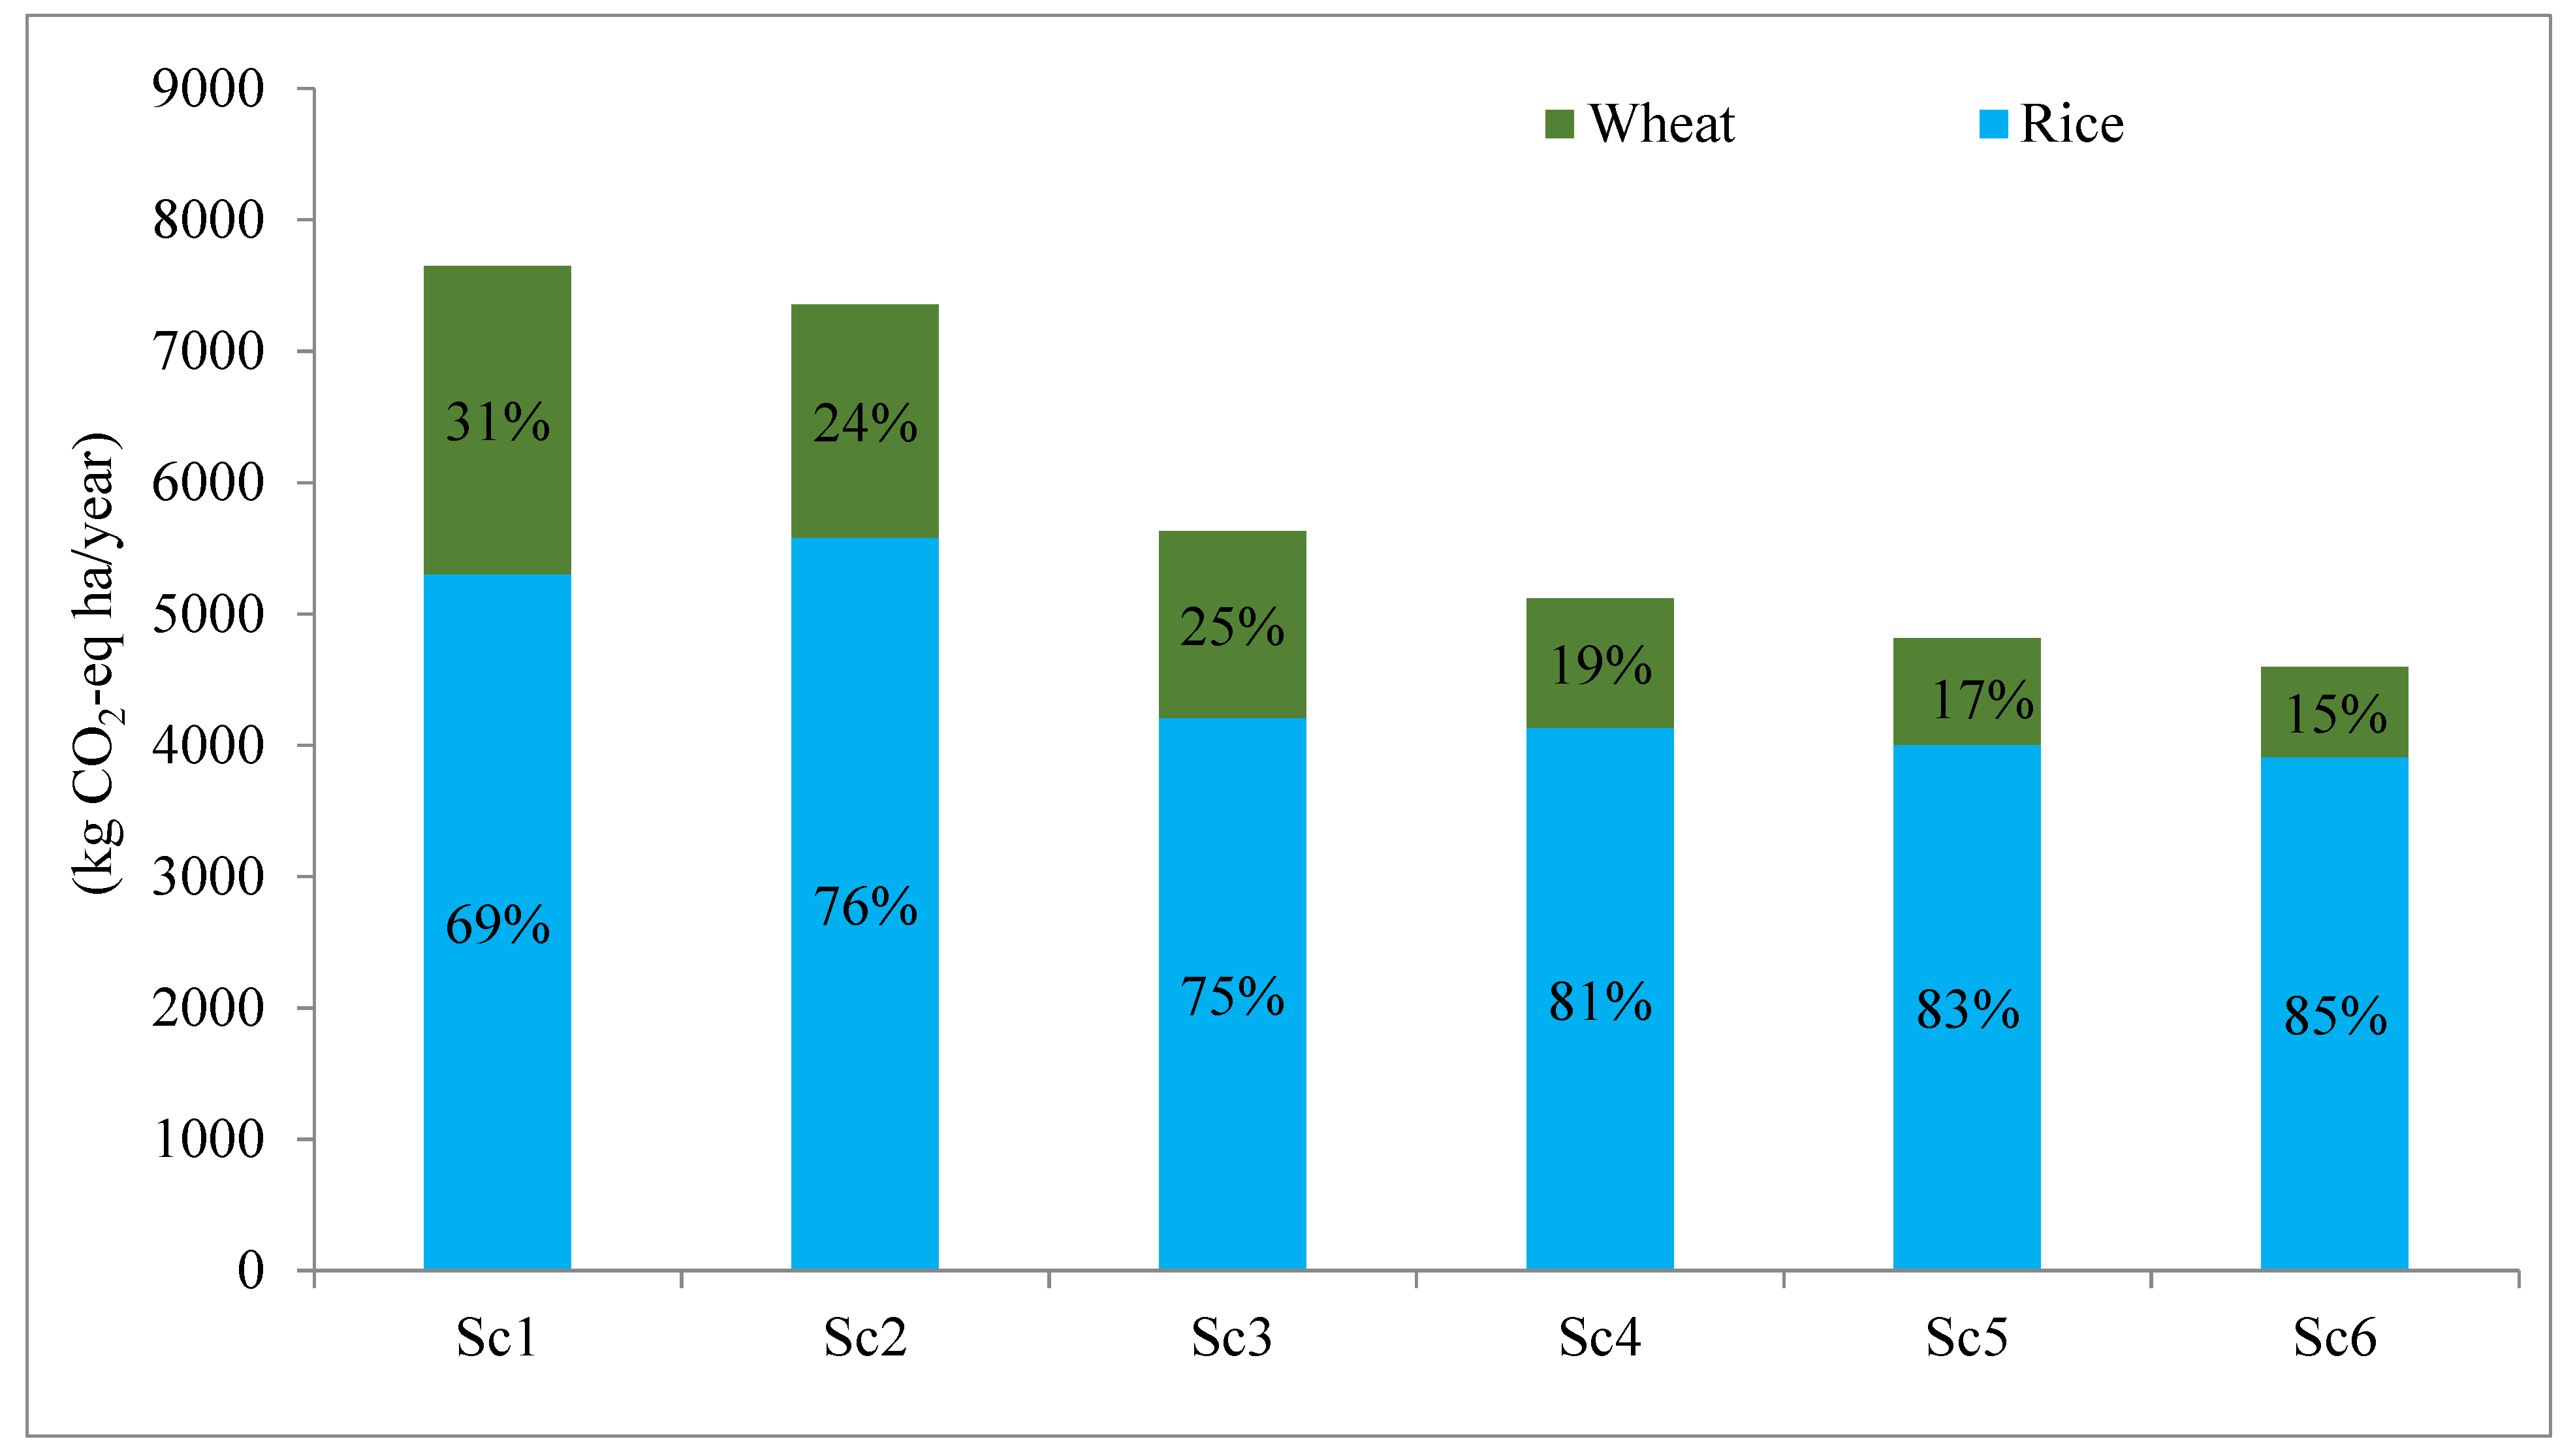
3.5. Share of Rice and Wheat in Total Global Warming

The contribution of rice and wheat crops towards estimated GWP under different scenarios is presented in Figure 3. In the RW system, rice contributed 69–85% of the total GWP and wheat contributed 15–31% of it. Rice emitted 3.38 times higher GHGs than wheat. The GHG intensity from rice cultivation (674 kg CO2/Mg rice grain) was higher than wheat cultivation (252 kg CO2/Mg wheat grain). Thus, rice is a GHG-intensive crop in the rice–wheat cropping system. The interaction effects of scenarios × crops on GWP were significant. (Table 3)

3.6. Contribution of Individual GHGs to Total GWP

The average contribution from individual operations to estimated GHG emissions and GWP (CH4, N2O, and CO2) are presented in Figure 2. The share from various field operations in the total GWP of the RW system varied among the studied scenarios. In general, CO2 emissions from fertilizer (production and transportation) and energy consumption contributed about 50% of total GWP across all the scenarios. The contribution of CH4 to total GWP was about ~34% in BAU and about 22% in rest of the scenarios. The contribution from N2O was about 15% to total GWP in the RW system under BAU and slightly over 20% in other scenarios. The contrast effect (BAU vs. CSA, BAU vs. I-BAU, and FFF vs. PNM) was significant for GWP (Table 3).

3.7. N-Factor Productivity (FPn)

N-factor productivity was directly associated with the grain yield and applied N fertilizer under different CSAPs, and it varied from 34.5 to 49.0 in rice and from 27.7 to 48.2 (kg grain/kg N) in wheat crop (Table 2). Sc6 recorded 42 and 74% higher FPn in rice and wheat crops than BAU, respectively (3 years’ mean). On the system basis, Sc6, Sc5, Sc4, and Sc3 recorded 57, 43, and 32% higher FPn compared to BAU (31.5 kg grain/kg N), respectively (3 years’ mean). The linear contrast showed a large influence of nutrient management on N-factor productivity (Table 3).

3.8. Grain Yield

During all three years, the rice yield was not significantly influenced by different crop management practices (Table 2 and Table 4). The linear interaction effect was not significant on the grain yield of rice. However, in wheat, CSAP (mean of Sc4, Sc5, and Sc6) produced 18, 12, and 12% higher yield during the first, second, and third years, respectively, compared to BAU (year-wise data are not presented). On average, wheat yield was 12% higher in the CSAP than BAU in the normal years (mean of 2015–2016 and 2016–2017), whereas the yield advantages of CSAP over BAU was much higher (18%) during a bad year (2014–2015) (year-wise data are not presented). These results are the first of their kind, providing clear evidence of the benefits of CSAPs in conferring resilience to climatic extremes. Another important finding is that the yield loss in the bad year (compared to the normal year) was less in CSAPs (5.8%; 0.32 Mg/ha) compared to BAU (11.6%; 0.55 Mg/ha), indicating a greater yield penalty of the latter under climatic extremes (Table 4). Higher system productivity of 8, 6, and 4% (mean of 3 yrs) was observed in Sc6, Sc5, and Sc4, respectively, relative to BAU (11.97 Mg/ha) (Table 2). BAU vs. CSAPs and FFP vs. PNM significantly influenced the grain yield of wheat (Table 3).

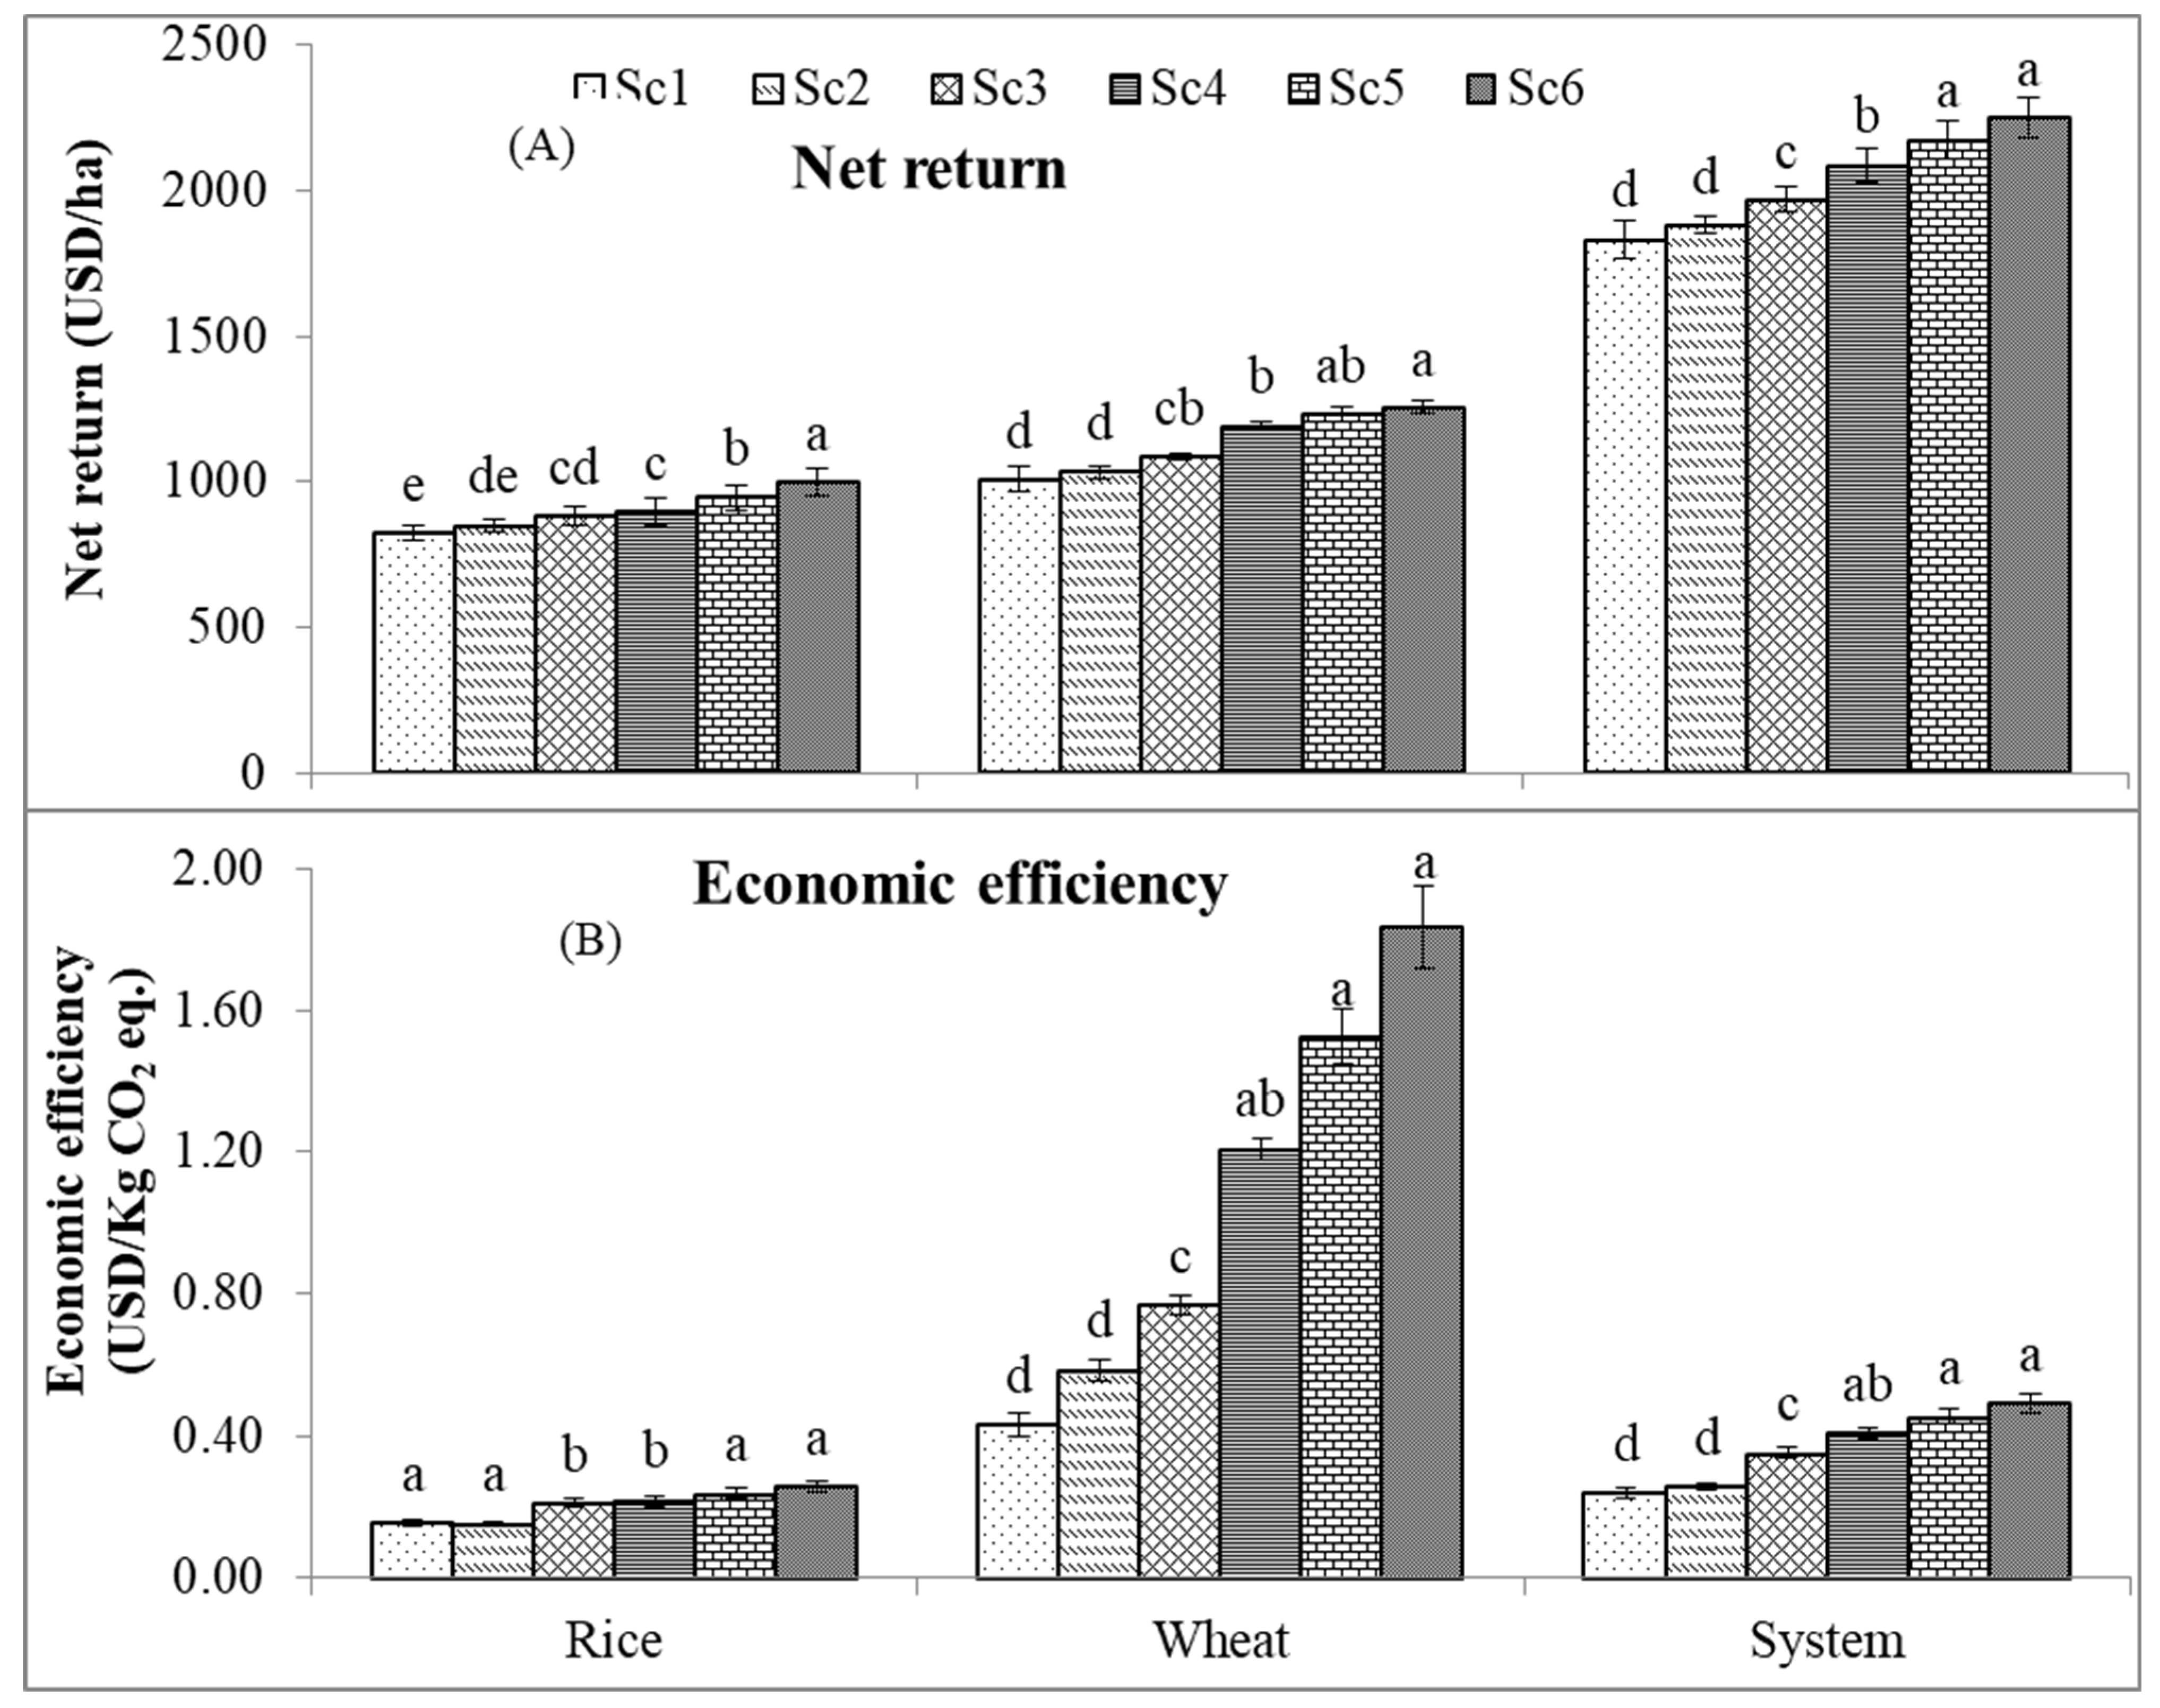
3.9. Net Return and Economic Efficiency

CSAPs increased the net returns from the rice, wheat, and RW system by 15, 21, and 18% (3 yrs’ mean), respectively, compared to BAU. Compared to business as usual (BAU), Sc6 increased the net income by 21, 24, and 23% (3 yrs’ mean) in the rice, wheat, and RW system, respectively (Figure 4A). The eco-efficiency is expressed in terms of economic gain per unit GHG emissions for a unit area (USD/kg CO2 eq.). The three-year results showed that eco-efficiency varied from USD 0.16 to 0.26/kg CO2 eq. in rice and USD 0.43 to 1.84/kg CO2 eq. in wheat (Figure 4B). Overall, the eco-efficiency was highest under CSAPs in both the crops and the lowest under BAU. On the basis of the three-years’ mean, CSAPs recorded higher eco-efficiency by 52, 254, and 88% in the rice, wheat, and RW system, respectively, relative to BAU. Sc6 was the most eco-efficient crop management practice among the six scenarios (Figure 4). BAU vs. CSAPs significantly influenced net return (Table 3). However, BAU vs. I-BAU contrast effect was not significant on net return.

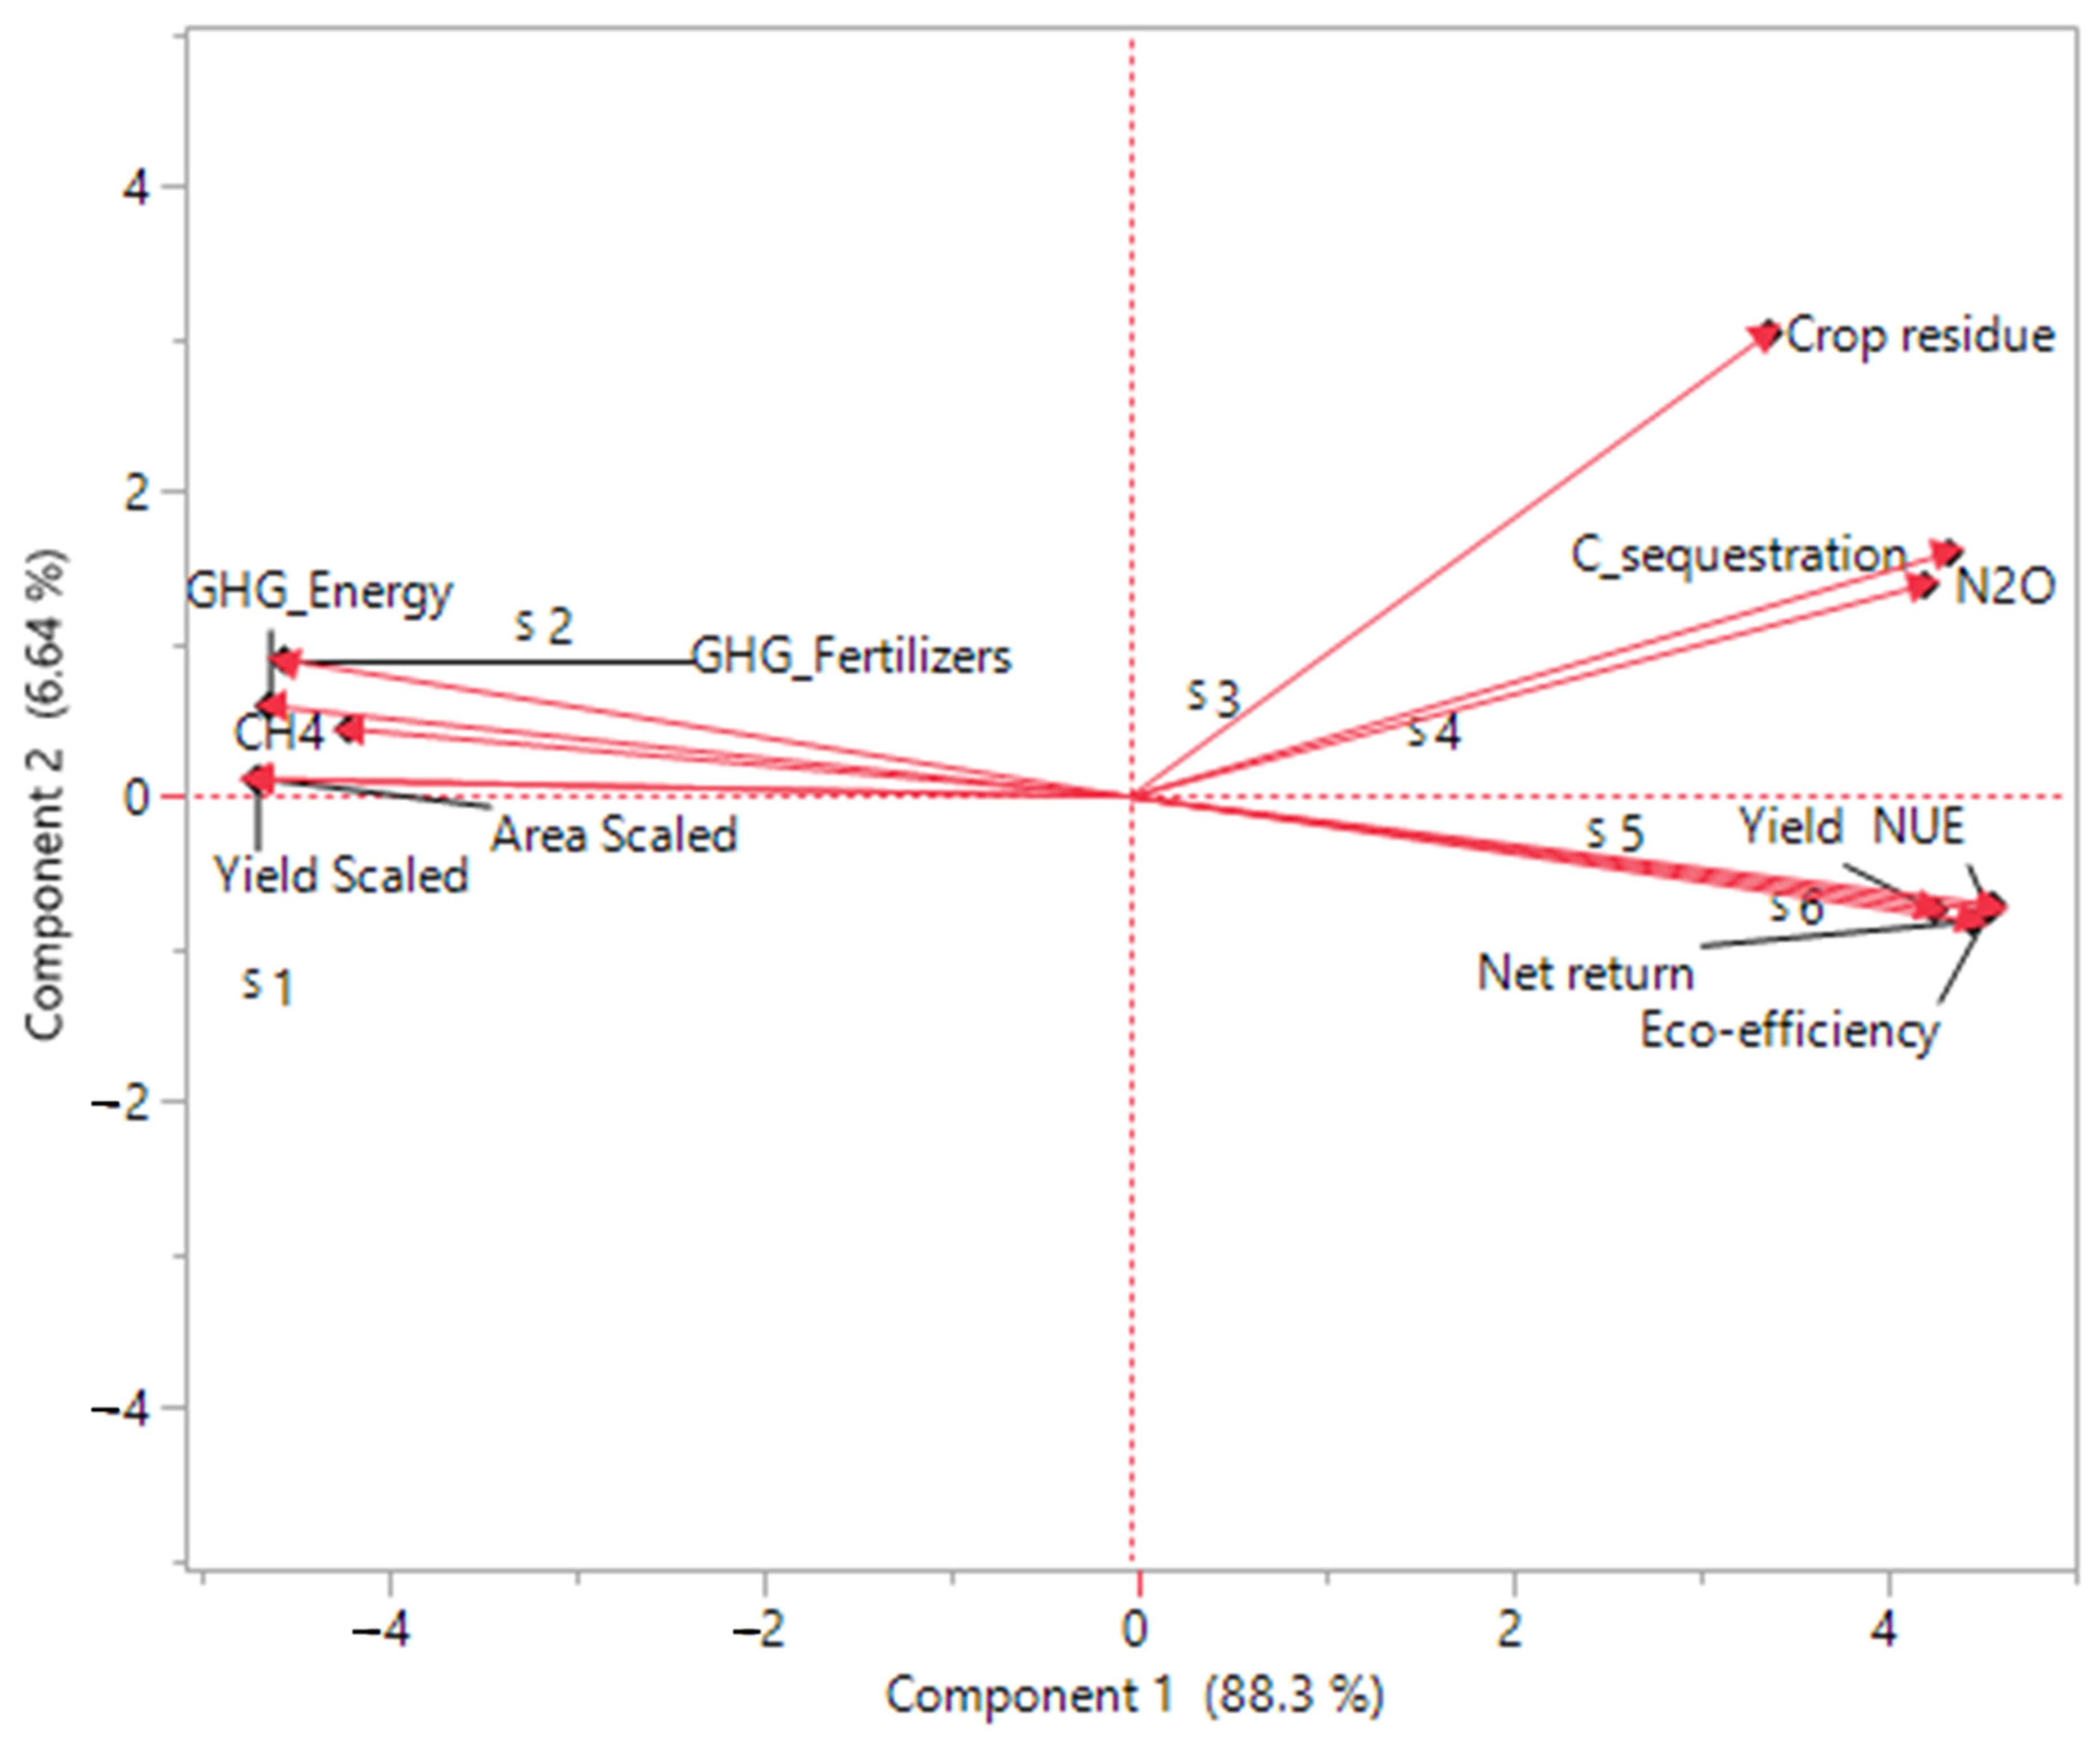
3.10. Principal Component Analysis (PCA) and Correlation

In the PCA of 11 variables, three PCs were extracted with eigenvalues > 0.9 and explained 99.2% of the variance (Figure 5). The relationships between GHG emission indicators (CH4, N2O, GHG emissions due to fertilizer; GHG emissions due to energy consumption; and GWP) and sustainability indicators (C-sequestration, grain yield, GHG intensity, net return, NUE, and eco-efficiency) were examined using principal component analysis (PCA) (Figure 5). PCA indicated that axis 1 accounted for 88.3% and axis 2 accounted for 6.6% of the variation. Sustainability indicators like GHG intensity, C-sequestration, N-factor productivity, grain yield, net return, and eco-efficiency were the most highly weighted variables in PC1 (88.3% of total variance), except N2O. Specifically, the angles between the GHGs and sustainability indicators were significantly different (stenosis and width).
These results show that the area scaled/GWP were correlated (positively or negatively) with C-sequestration, N-factor productivity, grain yield, net return, and eco-efficiency (Table 5). In particular, total GWP was significantly positively correlated with yield scaled (r = 99, p < 0.001), whereas it was significantly negatively correlated with N-factor productivity (r = 0.98, p < 0.01), yield (r = 0.88, p < 0.05), net return (r = 0.94, p < 0.01), and eco-efficiency (r = 0.98, p < 0.001). N-factor productivity was strongly positively correlated with N2O (r = 0.94, p < 0.05) and negatively correlated with GHGs due to fertilizer production and consumption (r = 0.85, p < 0.05) (Table 5). However, crop residue (incorporation or retention) was strongly positively correlated with C-sequestration (r = 0.91, p < 0.05).

4. Discussion

4.1. Greenhouse Gas Emissions

4.1.1. Methane Emissions

Climate-smart agricultural practices (mean of Sc4, Sc5, and Sc6) estimated lower CH4 emissions compared to BAU, which may be due to avoidance of puddling and less frequent irrigation. Methane emissions were higher under Sc2 (Table 2), where residues were incorporated, than under business as usual (BAU), where residues were taken off the field. This was probably because of residue incorporation in the system provided carbon sources for methanogenic bacteria. Furthermore, residue-retaining scenarios emitted less CH4 than the scenario of residue incorporation, probably due to the less anaerobic environment under these scenarios because of the avoidance of puddling and frequent irrigation. The linear contrast effect (BAU vs. CSAPs, BAU vs. I-BAU, and I-BAU vs. CSAPs) was significant for CH4 emissions (Table 3). These results are in accordance with Wang et al. [28], who also stated that crop residue significantly increased CH4 production (37.3 mg/m2) relative to the control (8.34 mg/m2). In Sc2, incorporation of loose rice residue enhanced sites for soil microbe attacks and may have led to enhanced decomposition and CH4 emissions. Aerobic conditions during the wheat crop cycle led to negligible or zero net emission of CH4, and this is in agreement with the results from other researchers from the IGP region [1].

4.1.2. Nitrous Oxide Emissions

In the three-year study, seasonal N2O emissions varied from 10 to 963 kg CO2 eq./ha, with a mean value of 487 kg CO2 eq./ha (Table 2), which was within the reported range under similar water levels in rice fields of western IGP [29,30]. Frequent wetting and drying of soil in Sc3 and CSAPs may have led to the more emissions of N2O from the nitrification and denitrification process of soil microorganisms. Puddled transplanted scenarios (BAU and Sc2) emitted less N2O compared to the other scenarios. Continuous submergence might have resulted in more denitrification (conversion of N2O to N2) because of a favorable range of O2 in the soil. The contrast effect showed that estimated N2O emissions were significantly influenced by various agronomic management practices in rice (Table 3). Gupta et al. [5] also reported that after the application of urea, the peak of the N2O flux was less with puddled TPR relative to DSR, probably might be due to fast conversion rate of NO3 to N2 through complete denitrification without forming N2O as an intermediate product. When anaerobic conditions prevail, the denitrification process dominates over the nitrification process and in turn increases the probability of the reduction of N2O into N2 [5]. Sc6 emitted 3.4% less N2O compared to Sc3 (941 kg CO2 eq./ha) (Table 2). The linear contrast effect (FFP vs. PNM) was significant for N2O emissions. This may be due to the precision management of N fertilizers with SSNM techniques and neem-coated urea (NCU) under the Sc6 scenario. Neem-coated urea (NCU) might have released N slowly, and in turn, enhanced the N-use efficiency because of its nitrification inhibition properties. Reduced N2O emissions due to SSNM was also confirmed by Sapkota et al. [12] and Gupta et al. [5].
In wheat, the highest N2O emissions were recorded with Sc2, whereas the lowest were recorded under BAU and Sc6 (1000 and 1098 kg CO2 eq./ha) in the three years (Table 2). The linear contrast effect (BAU vs. CSAPs, BAU vs. I-BAU, I-BAU vs. CSAPs, and FFP vs. PNM) was significant in N2O emissions (Table 3). This may have been due to the denitrification losses of N under aerobic soil environments. The higher emissions of N2O in CSAPs can be attributed to the higher soil moisture content, which reduces the rate of O2 diffusion into the soil, which favors N2O production [5,30]. For example, Bhatia et al. [30] observed nearly 12% more N2O emissions in without/no-tilled wheat over conventional-tillage wheat (CTW). Sapkota et al. [1] also observed more N2O emissions under no-tilled wheat over CTW from northwestern IGP.

4.2. GHG Emissions from Fertilizer and Energy Consumption

A significant off-site source of carbon dioxide emissions is the production of CO2 during the manufacturing and transportation of fertilizers. The emission of CO2 due to the production and transportation of fertilizer was lower by 22%, 10%, and 16% in the rice, wheat, and RW rotation, respectively, under CSAP relative to BAU (Table 4). The linear contrast effect (BAU vs. CSAPs, BAU vs. I-BAU, I-BAU vs. CSAPs, and FFP vs. PNM) was significant for CO2 emissions due to the production and transportation of fertilizer (Table 3). The higher nitrogen (N) fertilizer application in business as usual (N rate in BAU was 25% higher than in CSAPs) led to higher fertilizer-related emissions. Sapkota et al. [13] reported that sources and quantities of nitrogenous fertilizer had significant effects on global warming potential.
GHG emissions due to the consumption of electricity and diesel energy were significantly influenced by tillage methods and nutrient management strategies. Intensive tillage and irrigation in BAU and Sc2 led to higher energy-related emissions compared to other scenarios. Zero tillage in CSAPs lowers fuel (diesel) consumption, decreases the working period, and slows down the depreciation of equipment, which all lead to lower GHG emissions from various farm operations for crop production and from machinery manufacturing processes as well [3,31]. Only by adopting ZT practice in RW rotation, IGP farmers could save about 36 L of diesel per hectare [32], which is the equivalent of 93 kg CO2 emission/ha/yr. CSAPs can also mitigate GHGs by saving irrigation water by using water-saving technologies. Often, in eastern IGP diesel energy is used, whereas in northwestern IGP, electric energy is used for pumping irrigation water, both of which contribute to CO2 emissions [1]. Therefore, agricultural emissions can be reduced by adopting energy-efficient technologies like zero-tillage and precision nutrient/water management.

4.3. Carbon Sequestration

More carbon sequestration under CSAPs than under BAU might have been due to less soil disturbance, soil surface cover with crop residue, greater biomass input, and a lower rate of decomposition [21,33]. SOC loss through the disruptive effect of intensive tillage operations under conventional tillage-based systems is well known [33]. This is may be due to the disruption of soil macro- and micro-aggregates during intensive tillage operations, which expose SOC to more microbial decomposition relative to the ZT-based system [34]. Sapkota et al. [33] also reported higher C-sequestration in the ZT- than CT-based RW system through seven years of experimentation in eastern IGP.

4.4. Total Global Warming Potential (GWP)

In the three-year study, the GWP per hectare as well as the per-Mg rice–wheat yield was significantly lower under Sc3, Sc4, Sc5, and Sc6 relative to BAU (Table 2). The lower GWP in CSAPs (mean of Sc4, Sc5, and Sc6) may have been due to layering the best crop management practices in optimal combinations, which helps mitigate GHG emissions. Business as usual (BAU) had a larger GWP than CSAPs, showing the importance of site-specific input management not only to reduce GWP but also to increase system productivity. Similar results of reduced GWP by 44–47% were also highlighted in the studies by Sapkota et al. [1] and Gupta et al. [5] in CA-based RW rotation without a significant penalty to the system yield. Puddled transplantation of rice followed by continuous flooding in the TPR system enhanced CH4 emissions, which was further increased with the incorporation of crop residues in the soil [5]. The higher share of rice to total GWP compared to wheat was chiefly due to higher CH4 emissions in rice and also higher energy consumption in rice for tillage and irrigation compared to wheat.

4.5. N-Factor Productivity (FPn)

In the three-year study, CSA practices increased the FPn by 33, 56, and 44% without yield penalty in the rice, wheat, and RW system, respectively, compared to BAU (Table 2). This might have been due to the site-specific nutrient management approach (layering of nutrient expert + GreenSeeker + neem-coated urea) that helped improve the nitrogen use efficiency (NUE) and mitigate GHG emissions, especially nitrous oxide (N2O). Qiao et al. [35] reported that 15% higher NUE can be achieved with a proper N application rate at the same yield level, and a reduction of N load in the environment. Systems sustainability improved N use efficiency and precise and efficient N fertilizer use can reduce the N application rates by 30–60% while retaining the crop yields with markedly reduced nitrogen losses to the atmosphere [36].

4.6. Grain Yield

Averaged over three years, CSAPs provided almost similar rice grain yield compared to BAU. Our results contradict the findings of Gathala et al. [37] and Kakraliya et al. [11], who observed that DSR with best management practices (BMP) gave equal or more yield compared to puddled transplanted rice, but are in conformity with Jat et al. [38], who also revealed that rice grain yield under DSR was not higher than TPR for the initial four years. On average, wheat yield was increased by 12–18% and 2–7% under CSAPs (Sc4, Sc5, and Sc6) and improved BAU (average of Sc2 and Sc3), respectively, compared to BAU in all the years (Table 2 and Table 4). The linear interaction effect was significant for the grain yield of wheat. The continuous high and unusual rains at the grain-filling stage of wheat during the first year led to lower yield losses with a varied degree of adaptation measures in different scenarios, with the maximum being under BAU and the lowest under Sc6 layered with climate-smart agricultural practices. Compared to BAU, the additional wheat yield obtained under CSAP was 0.62 Mg/ha in a normal year and 0.84 Mg/ha in a bad year (Table 4). This means that a farmer can benefit from an additional amount of USD 131/ha in a normal year and USD 177/ha in a bad year if CSAP is adopted. Therefore, CSAP has both climate-adapted and economic benefits (in terms of yield gain and total cost reduction), implying a win–win situation.
Higher wheat yield under CSAPs might be due to precise land levelling, best-bet management practices, suitable cultivars, proper crop establishment, efficient water management, effective weed control, and efficient nutrient management. Better performance of wheat followed by DSR with residue retention might have created better soil physical and biological conditions [11,37] and also improved SOC [3], which might have helped in deeper crop root penetration and thus improved water and nutrient uptake, all leading to improved wheat yields.

4.7. Net Return and Economic Efficiency

Higher net returns were associated with CSAPs due to the lower cost of cultivation incurred in tillage, crop establishment, irrigation costs, and higher crop yields (Figure 4A). Gathala et al. [10] observed that only adoption of ZTDSR reduced tillage and establishment cost by 79–85% compared to conventional tillage. The eco-efficiency of the RW system was 88% higher under CSA scenarios (Sc4, Sc5, and Sc6) compared to BAU (0.24 USD/kg CO2 eq.) (Figure 4B). This was mainly due to lower GHG emissions and higher net return in these scenarios compared to BAU. Our results suggest that the eco-efficiency of the RW system can be enhanced by the practice of CSAP, which reduces negative environmental impacts while at the same time maintaining or increasing the net farm income [25]. Therefore, the CSAPs of RW systems with higher eco-efficiency are reflected as more economically and environmentally sustainable. The results of this study also suggest that an enormous potential exists for increasing the eco-efficiency of RW production in IGP.

4.8. Principal Component Analysis (PCA) and Correlation

Scatter plot of scenarios on PCA coordinates showed that climate-smart agriculture-based scenarios are distinctly located on PCA coordinates (Figure 5). Improved BAU and CSAP scenarios (Sc3, Sc4, Sc5, and Sc6) are positioned in the right-hand-side coordinates with a higher weightage of PC1 (88.3% of total variance). A close association between sustainability parameters like C-sequestration, grain yield, GHG intensity, net return, NUE, and eco-efficiency is also apparent from PCA graph. The estimated global warming potential (GWP) of various greenhouse gases were more under business as usual (BAU) due to higher emissions associated with higher energy use for tillage, irrigation, fertilizer use, and the burning of crop residues in comparison to CSAPs. However, the GWP of various greenhouse gases were at the minimum in CSAPs (mean of Sc4, Sc5, and Sc6), followed by Sc3, and at the maximum in Sc1 and Sc2. This might have been due to precise input management, proper crop establishment, efficient water management, and efficient nutrient management. The layering of climate-smart agriculture practices significantly improves crop productivity and economics [11]. The present study results show that the area scaled/GWP were correlated (positively or negatively) with C-sequestration, N-factor productivity, grain yield, net return, and eco-efficiency. Astonishingly high Pearson’s correlation coefficients were detected for crop residues (incorporation or retention) and C-sequestration (r = 0.91, p < 0.05). This strong correlation may be due to the benefits of residue retention/incorporation in soil being significant and improving C-sequestration and soil health [24,34].

5. Conclusions

The conventional RW rotation in IGP is a major contributor to the food basket of South Asia, but intensive input usage increases its GWP largely. To tackle this, several CSAPs have been developed, involving various resource conservation technologies for the RW system. In our study, we evaluated these CSAPs for potential GHG emissions and GWP and found them to be feasible, viable, and scalable alternatives to conventional management practices and have tremendous potential for adaptation-led mitigation co-benefits with potential economic gains for the farmers. CSAPs had 24% and 65% less GWP than BAU in rice and wheat crops, respectively, and rice was the major contributor to total GWP in the RW system (having threefold higher GWP than wheat). In addition, CSAP practices had higher wheat and system productivity tan BAU. As a co-benefit, CSAPs have judicious N management and increased factor productivity and higher economic efficiency. The synthesis of the three-year study showed that layering (portfolio) of CSAPs in the rice-wheat rotation of IGP can significantly contribute to reducing agriculture’s environmental footprint while improving productivity and profitability (ensuring food security), resource use efficiency, and sustaining natural resources under the emerging threat of climate change. Based on the present study, the different adaptation and mitigation practices (climate-smart agricultural practices) should be implemented by smallholder farmers to help them adapt to climate change and to suffer less in terms of yield penalty during a climate-extreme year. Additional research is needed on climate-smart agriculture to validate at farming system level and to provide information to policymakers about the expected impacts of climate change and the effectiveness of adaptation strategies.

Author Contributions

Conceptualization, M.L.J.; Data curation, S.K.K.; Formal analysis, S.K.K., T.B.S., M.K. and M.K.G.; Funding acquisition, M.L.J.; Methodology, M.L.J.; Project administration, M.L.J.; Resources, H.S.J., P.C.S. and M.L.J.; Software, S.K.K. and M.K.G.; Supervision, I.S. and M.L.J.; Validation, T.B.S.; Writing—original draft, S.K.K.; Writing—review & editing, H.S.J., T.B.S. and M.L.J. All authors have read and agreed to the published version of the manuscript.

Funding

This research received no external funding.

Institutional Review Board Statement

This study did not involve humans or animals.

Informed Consent Statement

Not applicable.

Data Availability Statement

Not applicable.

Acknowledgments

The research trial was funded by CGIAR Research Programs (CRPs) on Climate Change, Agriculture and Food Security (CCAFS). We acknowledge the CGIAR Fund Council, Australia (ACIAR), IFAD, the Netherlands, New Zealand, Switzerland, the UK, USAID, Irish Aid, the European Union, and Thailand for funding CCAFS. The support of the CGIAR Research Program on Wheat Agri-Food Systems (WHEAT) is thankfully acknowledged. We also acknowledge the collaboration and support of CCSHAU, Hisar, for this study. We also acknowledge the farmers Vinod Kumar, Harpreet Singh, and Amit Rana, Karnal, for participating in management activities and for providing land for this study. We also acknowledge the help of Kailash C. Kalwaniya, Munmun Rai, and Tripti Aggarwal of CIMMYT and Harishankar Nayak of ICAR-IARI.

Conflicts of Interest

The authors declare no conflict of interest.

References

  1. Sapkota, T.B.; Jat, M.L.; Shankar, V.; Singh, L.K.; Rai, M.; Grewal, M.S.; Stirling, C.M. Tillage residue and nitrogen management effects on methane and nitrous oxide emission from rice-wheat system of Indian Northwest Indo-Gangetic Plains. J. Integr. Environ. Sci. 2015, 12, 31–46. [Google Scholar] [CrossRef] [Green Version]
  2. Sapkota, T.B.; Vetter, S.; Jat, M.L.; Sirohi, S.; Shirsath, P.; Singh, R.; Jat, H.S.; Smith, P.; Hillier, J.; Stirling, C. Cost-effective opportunities for climate change mitigation in Indian agriculture. Sci. Total Environ. 2018, 655, 1342–1354. [Google Scholar] [CrossRef]
  3. Saharawat, Y.S.; Ladha, J.K.; Pathak, H.; Gathala, M.; Chaudhary, N.; Jat, M.L. Simulation of resource-conserving technologies on productivity, income and greenhouse gas GHG emission in rice-wheat system. J. Soil Sci. Environ. Manag. 2012, 3, 9–22. [Google Scholar]
  4. Jat, H.S.; Kumar, V.; Datta, A.; Choudhary, M.; Yadvinder-Singh; Kakraliya, S.K.; Poonia, T.; McDonald, A.J.; Jat, M.L.; Sharma, P.C. Designing profitable, resource use efficient and environmentally sound cereal based systems for the Western Indo-Gangetic plains. Sci. Rep. 2020, 10, 19267. [Google Scholar] [CrossRef] [PubMed]
  5. Gupta, D.K.; Bhatiaa, A.; Kumar, A.; Das, T.K.; Jain, N.; Tomar, R.; Sandeep, K.M.; Fagodiya, R.K.; Dubey, R.; Pathak, H. Mitigation of greenhouse gas emission from rice-wheat system of the Indo-Gangetic plains: Through tillage, irrigation and fertilizer management. Agric. Ecosyst. Environ. 2016, 230, 1–9. [Google Scholar] [CrossRef]
  6. Kakraliya, S.K.; Jat, H.S.; Singh, I.; Jat, M.L. Effect of Climate Smart Agriculture Practices on Crop yields and Factor Productivity of Rice-Wheat Cropping System in Indo-Gangetic Plains of India. Indian J. Fertil. 2019, 15, 852–858. [Google Scholar]
  7. Aryal, J.P.; Rahut, D.B.; Sapkota, T.B.; Khurana, R.; Khatri-Chhetri, A. Climate change mitigation options among farmers in South Asia. Environ. Dev. Sustain. 2020, 22, 3267–3289. [Google Scholar] [CrossRef] [Green Version]
  8. Jat, M.L.; Dagar, J.C.; Sapkota, T.B.; Singh, Y.; Govaerts, B.; Ridaura, S.L.; Saharawat, Y.S.; Sharma, R.K.; Tetarwal, J.P.; Jat, R.K.; et al. Climate change and agriculture: Adaptation strategies and mitigation opportunities for food security in South Asia and Latin America. Adv. Agron. 2016, 137, 127–236. [Google Scholar]
  9. Ladha, J.K.; Dawe, D.; Pathak, H.; Padre, A.T.; Yadav, R.L.; Singh, B.; Hobbs, P.R. How extensive are yield declines in long-term rice-wheat experiments in Asia? Field Crop. Res. 2003, 81, 159–180. [Google Scholar] [CrossRef]
  10. Gathala, M.K.; Kumar, V.; Sharma, P.C.; Saharawat, Y.S.; Jat, H.S.; Singh, M.; Kumar, A.; Jat, M.L.; Humphreys, E.; Sharma, D.K.; et al. Optimizing intensive cereal based cropping systems addressing current and future drivers of agricultural change in the Northwestern Indo-Gangetic Plains of India. Agric. Ecosyst. Environ. 2014, 187, 33–46. [Google Scholar] [CrossRef]
  11. Kakraliya, S.K.; Jat, H.S.; Singh, I.; Sapkota, T.; Singh, L.K.; Sutaliya, J.M.; Sharma, P.C.; Jat, R.D.; Lopez-Ridaura, S.; Jat, M. Performance of portfolios of climate smart agriculture practices in a rice-wheat system of western Indo-Gangetic plains. Agric. Water Manag. 2018, 202, 122–133. [Google Scholar] [CrossRef]
  12. Sapkota, T.B.; Majumdar, K.; Jat, M.L.; Kumara, A.; Bishnoi, D.K.; McDonaldd, A.J.; Pampolino, M. Precision nutrient management in conservation agriculture based wheat production of Northwest India: Profitability, nutrient use efficiency and environmental footprint. Field Crop. Res. 2014, 155, 233–244. [Google Scholar] [CrossRef]
  13. Sapkota, T.B.; Shankar, V.; Rai, M.; Jat, M.L.; Stirling, C.M.; Singh, L.K.; Jat, H.S.; Grewal, M.S. Reducing Global Warming Potential through Sustainable Intensification of Basmati Rice-Wheat Systems in India. Sustainability 2017, 9, 1044. [Google Scholar] [CrossRef] [Green Version]
  14. Campbell, B.M.; Vermeulen, S.J.; Aggarwal, P.K.; Corner-dolloff, C.; Girvetz, E.; Wollenberg, E. Reducing risks to food security from climate change. Glob. Food Secur. 2016, 11, 34–43. [Google Scholar] [CrossRef] [Green Version]
  15. Alavaisha, E.; Manzoni, S.; Lindborg, R. Different agricultural practices affect soil carbon, nitrogen and phosphorous in Kilombero–Tanzania. J. Environ. Manag. 2019, 234, 159–166. [Google Scholar] [CrossRef]
  16. Feliciano, D.; Nayak, D.; Vetter, S.; Hillier, J. CCAFS Mitigation Option Tool. 2015. Available online: www.ccafs.cigar.org (accessed on 17 November 2016).
  17. Bouwman, A.F.; Boumans, L.J.M. Emissions of N2O and NO from fertilized fields: Summary of available measurement data. Glob. Biogeochem. Cycles 2002, 16, 6–13. [Google Scholar] [CrossRef]
  18. Bouwman, A.F. Global Inventory of NH3 Emissions from Mineral Fertilizers and Animal Manure Applied to Croplands and Grasslands; FAO: Rome, Italy, 2001. [Google Scholar]
  19. Ecoinvent Center. Overview and Methodology; Final Report Ecoinvent v2.0 No. 1.; Frischknecht, R., Jungbluth, N., Eds.; Swiss Centre for Life Cycle Inventories: St-Gallen, Switzerland, 2007; p. 40. [Google Scholar]
  20. Smith, P.; Powlson, D.; Glendining, M.; Smith, J.O. Potential for carbon sequestration in European soils: Preliminary estimates for five scenarios using results from long-term experiments. Glob. Chang. Biol. 1997, 3, 67–79. [Google Scholar] [CrossRef]
  21. Ogle, S.M.; Breidt, F.J.; Paustian, K. Agricultural management impacts on soil organic carbon storage under moist and dry climatic conditions of temperate and tropical regions. Biogeochemistry 2005, 72, 87–121. [Google Scholar] [CrossRef]
  22. IPCC. Agriculture, Forestry and Other Land Use. In Guidelines for National Greenhouse Gas Inventories; Intergovernmental Panel on Climate Change: Geneva, Switzerland, 2006; Volume 4. [Google Scholar]
  23. IPCC. Climate Change 2013: The Physical Science Basis in Contribution of Working Group I to the Fifth Assessment Report of the Intergovernmental Panel on Climate Change; Stocker, T.F., Qin, D., Plattner, G.-K., Tignor, M.M.B., Allen, S.K., Boschung, J., Nauels, A., Xia, Y., Bex, V., Midgley, P.M., Eds.; Cambridge University Press: Cambridge, UK; New York, NY, USA, 2013; pp. 710–716. [Google Scholar]
  24. Kakraliya, S.K.; Jat, R.D.; Kumar, S.; Choudhary, K.; Prakash, J.; Singh, L. Integrated Nutrient Management for Improving, Fertilizer Use Efficiency, Soil Biodiversity and Productivity of Wheat in Irrigated Rice Wheat Cropping System in Indo-Gangatic Plains of India. Int. J. Curr. Microb. Appl. Sci. 2017, 6, 81–88. [Google Scholar] [CrossRef]
  25. Soni, P.; Sinha, R.; Perret, S.R. Energy use and efficiency in selected rice-based cropping systems of the Middle-Indo Gangetic Plains in India. Energy Rep. 2018, 4, 554–564. [Google Scholar] [CrossRef]
  26. Gomez, K.; Gomez, A. Statistical Procedures for Agricultural Research, 2nd ed.; Wiley: New York, NY, USA, 1984; pp. 180–209. [Google Scholar]
  27. SAS Institute. SAS/STAT User’s Guide; Version 8-1; SAS Institute: Cary, NC, USA, 2001. [Google Scholar]
  28. Wang, W.; Lai, D.Y.F.; Wanga, C.; Pana, T.; Zeng, C. Effects of rice straw incorporation on active soil organic carbon pools in a subtropical paddy field. Soil Tillage Res. 2015, 152, 8–16. [Google Scholar] [CrossRef]
  29. Bhatia, A.; Jain, N.; Pathak, H. Methane and nitrous oxide emissions from Indian rice paddies, agricultural soils and crop residue burning. Greenh. Gases Sci. Technol. 2013, 3, 196–211. [Google Scholar] [CrossRef]
  30. Bhatia, A.; Sasmal, S.; Jain, N.; Pathak, H.; Kumar, R.; Singh, A. Mitigating nitrous oxide emission from soil under conventional and no-tillage in wheat using nitrification inhibitors. Agric. Ecosyst. Environ. 2010, 136, 247–253. [Google Scholar] [CrossRef]
  31. West, T.O.; Post, W.M. Soil organic carbon sequestration rates by tillage and crop rotation. Soil Sci. Soc. Am. J. 2002, 66, 1930–1946. [Google Scholar] [CrossRef] [Green Version]
  32. Erenstein, O.; Laxmi, V. Zero tillage impacts in India’s rice-wheat systems: Areview. Soil Tillage Res. 2008, 100, 1–14. [Google Scholar] [CrossRef]
  33. Sapkota, T.B.; Jat, R.K.; Singh, R.G.; Jat, M.L.; Stirling, C.M.; Jat, M.K.; Bijarniya, D.; Kumar, M.; Yadvinder-Singh; Saharawat, Y.S.; et al. Soil organic carbon changes after seven years of conservation agriculture based rice-wheat cropping system in the eastern Indo-Gangetic Plain of India. Soil Use Manag. 2017, 23, 81–89. [Google Scholar] [CrossRef]
  34. Singh, Y.; Gupta, R.K.; Jagmohan, S.; Gurpreet, S.; Gobinder, S.; Ladha, J.K. Placement effects on rice residue decomposition and nutrient dynamics on two soil types during wheat cropping in rice-wheat system in north western India. Nutr. Cycl. Agroecosyst. 2010, 88, 471–480. [Google Scholar] [CrossRef]
  35. Qiao, J.; Yang, L.; Yan, T.; Xue, F.; Zhao, D. Nitrogen fertilizer reduction in rice production for two consecutive years in the Taihu lake area. Agric. Ecosyst. Environ. 2012, 146, 103–112. [Google Scholar] [CrossRef]
  36. Ju, X.; Xing, G.; Chen, X.; Zhang, S.; Zhang, L.; Liu, X.; Cui, Z.; Yin, B.; Christie, P.; Zhu, Z.; et al. Reducing environmental risk by improving N management in intensive Chinese agricultural systems. Proc. Natl. Acad. Sci. USA 2009, 106, 3041–3046. [Google Scholar] [CrossRef] [Green Version]
  37. Gathala, M.K.; Ladha, J.K.; Saharawat, Y.; Kumar, V.; Kumar, V.; Sharma, P. Effect of tillage and crop establishment methods on physical properties of a medium-textured soil under a seven-year rice-wheat rotation. Soil Sci. Soc. Am. J. 2011, 75, 1851–1862. [Google Scholar] [CrossRef]
  38. Jat, R.K.; Sapkota, T.B.; Singh, R.G.; Jat, M.L.; Kumar, M.; Gupta, R.K. Seven years of conservation agriculture in a rice-wheat rotation of Eastern Gangetic Plains of South Asia: Yield trends and economic profitability. Field Crop. Res. 2014, 164, 199–210. [Google Scholar] [CrossRef]
Figure 1. Location of experimental sites in Karnal districts of Haryana, India.
Agriculture 11 01269 g001
Figure 2. Share of different components in the total global warming potential under the rice–wheat system (Mean of 3 years). Sc1—business as usual, conventional tillage (CT) without residue; Sc2—CT with residue; Sc3—reduced tillage (RT) with residue + recommended dose of fertilizer (RDF); Sc4—RT/zero tillage (ZT) with residue + RDF; Sc5—ZT with residue + RDF + GreenSeeker + Tensiometer; Sc6—Sc5 + nutrient expert.
Agriculture 11 01269 g002
Figure 3. Share of rice and wheat in the total global warming potential of the rice–wheat system (mean of 3 years). Sc1—business as usual, conventional tillage (CT) without residue; Sc2—CT with residue; Sc3—reduced tillage (RT) with residue + recommended dose of fertilizer (RDF); Sc4—RT/zero tillage (ZT) with residue + RDF; Sc5—ZT with residue + RDF + GreenSeeker + Tensiometer; Sc6—Sc5 + nutrient expert.
Agriculture 11 01269 g003
Figure 4. Effect of management practices portfolios on net return (A) and eco-efficiency (B) in the rice, wheat, and RW system (mean of 3 years). Sc1—business as usual, conventional tillage (CT) without residue; Sc2—CT with residue; Sc3—reduced tillage (RT) with residue + recommended dose of fertilizer (RDF); Sc4—RT/zero tillage (ZT) with residue + RDF; Sc5—ZT with residue + RDF + GreenSeeker + Tensiometer; Sc6—Sc5 + nutrient expert.
Agriculture 11 01269 g004
Figure 5. Principal component analysis among the GHG emissions, C-sequestration, grain yield, GHG intensity, net return, NUE, and eco-efficiency parameters under the RW system.
Agriculture 11 01269 g005
Table 1. Scenario description and crop management under different scenarios in rice–wheat (RW) rotation.
Scenarios a/Management PracticesSc1Sc2Sc3Sc4Sc5Sc6
Crop EstablishmentConventional Tillage (CT)CTReduced Tillage (RT)RT—Zero Tillage (ZT)ZTZT
Field preparationRice—2 passes of harrow, 1 pass of rotavator, 2 passes of puddle harrow followed by (fb) planking;
Wheat—2 passes of harrow and rotavator each fb planking
Same as in Sc1Rice—1 pass of harrow, 1 pass of cultivator fb planking;
Wheat—1 pass of harrow, 1 pass of cultivator fb planking
Rice—same as in Sc3;
Wheat—zero tillage
Zero tillageSame as in Sc5
Seed rate (kg ha−1) a12.5–100Same as in Sc120–100Same as in Sc3Same as in Sc3Same as in Sc3
FP, residue removedFP, residue removed100% of rice and 25% of wheat residue incorporatedSame as Sc2100% rice residue retained and 25% wheat residue incorporated100% of rice residue and 25% of wheat retainedSame as in Sc5
Fertilizer (N:P2O5:K2O) in kg ha−1Rice—195:58:00;
Wheat—185:58:00
Same as in Sc1Rice—150:60:60;
Wheat—150:60:60
Same as in Sc3Rice—147:60:60 (in 1st yr), 153:60:60 (in 2nd yr), and 158:60:60 (in 3rd yr)
Wheat—143:60:60 (in 1st yr), 120:60:60 (in 2nd yr), and 134:60:60 (in 3rd yr)
Rice—138:39:70 (in 1st yr), 140:42:57 (in 2nd yr), and 145:44:57 (in 3rd yr)
Wheat—135:62:60 (in 1st yr), 111:58:55 (in 2nd yr), and 122:56:55 (in 3rd yr)
Water managementRice—continuous flooding of 5–6 cm depth for 30–40 days after transplanting fb irrigation applied at alternate wetting and drying
Wheat—4–6 irrigation as per requirement
Same as in Sc1Rice—soil was kept wet up to 20 days after sowing fb irrigation applied at hairline cracks.
Wheat—4–6 irrigation as per critical crop growth stages
Same as in Sc3Rice—soil was kept wet until germination fb irrigation at −20 to −30 kPa matric potential
Wheat—irrigation at −50 to −55 kPa matric potential
Same as in Sc5
a Seed treatment was done with Bavistin + Streptocycline @ 10 + 1 g per 10 kg seed-Raxil® Tebuconazole 2DS (2% w/w) at 0.2 g a.i. kg−1 se.
Table 2. Effect of management practice portfolios on GHG emissions, C-sequestration, grain yield and GHG intensity in rice–wheat system under different scenarios in 3 years.
Scenarios aCH4 kg (kg CO2 eq./ha)N2O (kg CO2 eq./ha)GHG Emissions Due to Production and Transportation of Fertilizers (kg CO2 eq./ha)GHG Emissions Due to Energy Consumption (Diesel and Electricity) (kg CO2 eq./ha)Total C-Sequestration (kg CO2 eq./ha)Area Scaled (GWP; kg CO2 eq./ha)Grain Yield (Mg/ha)Yield Scaled (kg CO2/Mg grain yield)N-Factor Productivity (kg grain/kg N)
Rice
Sc12607 A10.4 D900 A1861 A74.2 A5304 B6.73 A791 B34
Sc23001 B13.3 D900 A1861 A194.3 B5581 A6.85 A818 A35
Sc31479 C941.2 B716 B1530 B456.0 C4209 C6.64 A637 C44
Sc41497 CD945.2 AB716 B1445 C470.1 D4132 D6.65 A625 C44
Sc51503 D950.7 A722 B1305 D474.5 D4006 E6.73 A600 D44
Sc61508 D909.4 C665 C1305 D477.0 D3909F6.90 A572 E50
Wheat
Sc1-NA-1000 A856 A492 A0 A2348 A5.06 A466 A27
Sc2-NA-1344 B856 A492 A913 B1780 B5.15 A348 B28
Sc3-NA-1217 C847 A431 B1074 C1420 C5.39 B264 C36
Sc4-NA-1223 C847 A338 C1420 D987 D5.64 C175 D38
Sc5-NA-1144 D766 B331 C1432 D809 E5.77 CD141 E44
Sc6-NA-1098 D711 C331 C1452 D688F5.85 D118 E48
System
Sc12607 A1010 A1756 A2354 A74 A7653 A11.97 A642 A32
Sc23001 B1358 B1756 B2354 A1107 B7361 B12.18 AB607 B32
Sc31479 C2158 C1562 C1960 B1530 C5629 C12.22 AB462 C41
Sc41497 CD2168 C1562 C1783 C1890 D5120 D12.48 BC411 D42
Sc51503 D2094 D1488 D1636 D1906 D4815 E12.71 CD380 E45
Sc61508 D2008 E1376 E1636 D1929 D4597 F12.95 D357 F49
a Refer to Table 1 for scenario description. Means followed by similar uppercase letters within a column in a given year are not significantly different at the 0.05 level of probability using Tukey’s HSD test. Sc1—Business as usual, conventional tillage (CT) without residue; Sc2—CT with residue; Sc3—reduced tillage (RT) with residue + recommended dose of fertilizer (RDF); Sc4—RT/zero tillage (ZT) with residue + RDF; Sc5—ZT with residue + RDF + GreenSeeker + Tensiometer; Sc6—Sc5 + nutrient expert.
Table 3. Significance effect of management practice portfolios and their linear contrast on GHG emissions, C-sequestration, grain yield, GHG intensity, net return, NUE and eco-efficiency under rice, wheat, and RW system.
Scenarios aCH4 kg (kg CO2 eq./ha)N2O (kg CO2 eq./ha)GHG Emissions Due to Production and
Transportation of
Fertilizers
(kg CO2 eq./ha)
GHG Emissions Due to
Energy Consumption (Diesel and Electricity)
(kg CO2 eq./ha)
Total C-Sequestration (kg CO2 eq./ha)Area Scaled (GWP; kg CO2 eq./ha)Grain Yield (Mg/ha)Yield Scaled (kg CO2/Mg Grain Yield)Net Return (USD/ha)N-Factor Productivity (kg Grain/Kg N)Eco-Efficiency (USD/Kg CO2 eq.)
Rice
BAU vs. CSA******************NS**********
BAU vs. I-BAU*****************NS*NS*NS
I-BAU vs. CSA*********NS***NS*NS*****
FFP vs. PNM******************NS**********
Wheat
BAU vs. CSA-**************************
BAU vs. I-BAU-***NS*********NS***NSNSNS
I-BAU vs. CSA-****************************
FFP vs. PNM-***************************
System
Scenarios*********************************
Crops (rice & wheat)*********************************
Scenario*Crops**************NS*********
BAU vs. CSA******************NS***********
BAU vs. I-BAU*****************NS***NS***
I-BAU vs. CSA******************NS**********
FFP vs. PNM******************NS***********
a Refer to Table 1 for scenario description. Where: BAU—business as usual (Sc1); CSA—climate-smart agricultural practices (Sc4, Sc5, and Sc6); CT—conventional tillage (Sc1 and Sc2); RT—reduced tillage (Sc3 and Sc4); ZT—zero tillage (Sc5 and Sc6); FFP—farmers’ fertilizer practice (Sc1); precision nutrient management (Sc5 and Sc6). NS is non-significant and the * symbols indicate significant difference at different levels of probability using Tukey’s HSD test * p < 0.05, two–tailed, ** p < 0.01, two–tailed, *** p < 0.001.
Table 4. Wheat yield (Mg/ha) under alternative production systems in normal and bad years.
Wheat Production SystemAverage Wheat Yield (Mg/ha)Yield Difference
between Normal Year (2015–2016) and Bad Year (Mg/ha)
Yield Difference
between Normal Year (2016–2017) and Bad Year (Mg/ha)
Yield Difference between Normal Years
2014–2015
(Bad Year)
2015–2016
(Normal Year)
2016–2017
(Normal Year)
Business as usual (Sc1)4.705.195.300.49 a0.60 a0.11 a
Improved business as usual (I-BAU)4.985.375.450.39 b0.47 b0.08 b
CSAPs5.545.795.930.25 c0.39 c0.14 c
Yield difference between I-BAU and Sc1 (Mg/ha)0.28 d0.18 e0.15 f
Yield difference between CSAPs and Sc1 (Mg/ha)0.84 d0.60 e0.63 f
a, b, c Yield loss due to climatic risk (untimely rain at the ready to harvest stage of wheat crop) in Sc1, I-BAU and CSAPs between bad year (2014–2015) and normal years (2015–2016 and 2016–2017). d Yield gap between Sc1 vs. I-BAU and I-BAU vs. CSAPs in bad year (here, untimely rain at the ready-to-harvest stage of wheat crops) i.e., in year 2014–15. e, f Yield gap between Sc1 vs. I-BAU and I-BAU vs. CSAPs in normal years i.e., in years 2015–2016 and 2016–2017.
Table 5. Correlation coefficient (r) matrix of different GHG emissions, C-sequestration, N-factor productivity, yields, and economic parameters.
CH4N2OGHG_FertilizersGHG_EnergyC-SequestrationArea Scaled/GWPYield ScaledNUEYieldNet ReturnEco-EfficiencyCrop Residue
CH41
N2O−0.91 *
GHG_Fertilizers0.87 *−0.81
GHG_Energy0.91 *−0.87 *0.95 **
C_sequestration−0.77 *0.93 **−0.83 *−0.88 *
Area scaled0.93 **−0.92 **0.96 **0.99 ***−0.92 **
Yield scaled0.92 *−0.91 *0.96 **0.99 ***−0.92 **0.99 ***
N-factor productivity−0.88 *0.83 *−1.0 ***−0.97 **0.85 *−0.97 **−0.98 ***
Yield−0.670.68−0.93 **−0.90 *0.83 *−0.88 *−0.90 *0.93 **
Net return−0.780.76−0.96 **−0.96 **0.86 *−0.94 **−0.95 ***0.97 **0.99 ***
Eco-efficiency−0.86 *0.82 *−0.98 **−0.99 ***0.88 *−0.98 ***−0.98 ***0.99 ***0.96 **0.99 ***
Crop residue−0.500.80−0.60−0.620.91 *−0.69−0.700.620.640.630.631
Stars indicating different level of significance; *** = significance level at p < 0.001; ** = significance level at p < 0.01; * = significance level at p < 0.05; NS = non-significant.
Publisher’s Note: MDPI stays neutral with regard to jurisdictional claims in published maps and institutional affiliations.

