Article

Whole-Plant Measure of Temperature-Induced Changes in the Cytosolic pH of Potato Plants Using Genetically Encoded Fluorescent Sensor Pt-GFP

1
Department of Biophysics, National Research Lobachevsky State University of Nizhny Novgorod, 23 Gagarin Avenue, 603950 Nizhny Novgorod, Russia
2
Department of Biochemistry and Biotechnology, National Research Lobachevsky State University of Nizhny Novgorod, 23 Gagarin Avenue, 603950 Nizhny Novgorod, Russia
*
Author to whom correspondence should be addressed.
Agriculture 2021, 11(11), 1131; https://doi.org/10.3390/agriculture11111131
Submission received: 14 September 2021 / Revised: 31 October 2021 / Accepted: 9 November 2021 / Published: 11 November 2021

Abstract

:
Cytosolic pH (pHcyt) regulates a wide range of cellular processes in plants. Changes in pHcyt occurring under the effect of different stressors can participate in signal transmission. The dynamics of pHcyt under the action of external factors, including significant factors for open ground crops such as temperature, remains poorly understood, which is largely due to the difficulty of intracellular pH registration using standard methods. In this work, model plants of potato (one of the essential crops) expressing a fluorescent ratiometric pH sensor Pt-GFP were created. The calibration obtained in vivo allowed for the determination of the pHcyt values of the cells of the leaves, which is 7.03 ± 0.03 pH. Cooling of the whole leaf caused depolarization and rapid acidification of the cytosol, the amplitude of which depended on the cooling strength, amounting to about 0.2 pH units when cooled by 15 °C. When the temperature rises to 35–40 °C, the cytosol was alkalized by 0.2 pH units. Heating above the threshold temperature caused the acidification of cytosol and generation of variation potential. The observed rapid changes in pHcyt can be associated with changes in the activity of H+-ATPases, which was confirmed by inhibitory analysis.

1. Introduction

Potato is one of the most important crops grown in open ground conditions. Cultivation in open ground conditions exposes potato plants to a greater influence of uncontrollable external factors than growing in greenhouses under a controlled level of humidity, degree of irrigation and other conditions [1,2,3]. In addition, traditional potato breeding was aimed at increasing productivity, quality and improving resistance to diseases; so modern varieties have limited resistance to abiotic stresses, for example, salinity, drought and cold stress [4]. Temperature has a significant influence on the development of potato plants and affects their productivity [5,6].
Temperature changes affect the activity of a number of processes, including photosynthesis and starch metabolism [7,8], which ultimately can lead to plant death or crop yield reduction. For example, a temperature rise of 1 °C above 35 °C could result in 1.34–4.29% loss of maize yield [9], and maize productivity also decreases by 0.3% on cold days occurring during the growing season [10]. Each 1 °C of global warming (increase in temperature from 11 °C to 19 °C) decreases wheat yield by 4.1–6.4% [11]; and under cold stress (2 °C/8 °C) there is a 35–78% decrease in wheat grain yield [12]. Potatoes are sensitive to temperature changes too. Potatoes have a wide range of temperature resistance, so the temperature minimum for tuberization is 4–18 °C (for different cultivars this threshold is different), and the maximum is 30 °C [5,13,14]. However, when the temperature rises by 1 °C in the range of 19.1–27.7 °C, potato yield reduces by 11% [15]. A 19–29% decline in potato yield in 2038–2067 is predicted with an increase in maximum (of 0.7, 1.2, and 2.1 °C) and minimum (of 0.6, 1.3, and 2.0 °C) temperatures and a decrease in irrigation [16]. A decrease in yield is mediated via changes in metabolism, the direct regulation of the activity of key enzymes and the initiation of a plant defense reaction, which occurs with the participation of signaling systems. One of the ways of regulating enzymes and transporters is by a change in the cytosolic pH, the value of which is 7.2–7.5; however, more acidic values have also been noted, for example, 6.62 [17,18,19,20]. The cytosolic pH can shift due to the action of various factors. For example, alkalization is observed in cases of penetration of pathogen fungus Alternaria alternata hyphae into the plant cell (by 1.5–2 units) [21], gravistimulation (by 0.4 units) [22], the external addition of indole-3-acetic acid (IAA) (by 0.2 units) [23] and anoxia, which acidifies cytosol by 0.8–1.2 units [24]. Cold stress is indicated to provoke acidification of the cytosol [25]. It should be noted that the majority of research on the effect of temperature changes on cytosolic pH has been carried out on cell cultures [26] or in the cells of individual organs [25], and the pH has not been studied in the whole organs or plant. The effect of heating on cytosolic pH has not yet been reliably determined. Temperatures in the range of 30 °C to 55 °C cause a metabolic response for many plant species [27]. Therefore, a change in the intracellular pH caused by temperature can be a signal/messenger of various processes in the plant, including those transmitted over long distances [17].
In plant cells, there is a complex of pH regulation systems, including buffer systems of phosphate and carbonate anions; the biochemical pH-stat that functions due to the pH-sensitive processes of carboxylation and decarboxylation of organic acids; and the biophysical pH-stat including H+-ATPases of tonoplast and plasmalemma, proton pyrophosphatases and H+-cotransporters [28,29,30]. The H+-ATPases are the most important participants in the regulation of intracellular pH [31]. Their activity can be regulated by a plethora of factors such as blue light [32], the fusicoccin toxin [33], the oral secretion of Spodoptera littoralis [34], phytohormones [31,35], drought [36] and temperature changes [37]. Cooling leads to a decrease in the H+-ATPases activity in the initial hours of treatment [38]. Heating induces a different response from the proton pumps, depending on the duration of the treatment and the strength of the temperature stimulus [39,40]. The main way of regulating the activity of H+-ATPases is through changes in membrane lipids [37,41] and phosphorylation, or dephosphorylation of seven amino acid residues of the C-terminus [35]. Moreover, the binding of H+-ATPase to the regulatory 14-3-3 protein is required for the effective functioning of the proton pump; phosphorylation of the penultimate threonine residue of the C-terminus of H+-ATPase provides this bond [42]. The H+-ATPases also have an electrogenic function and contribute the most to the membrane’s potential generation and potential changes [34,43,44]. Changes in cytosolic pH and electrical potential may be related: the generation of damage-induced variation potential is mediated by a decrease in the activity of the H+-ATPases [44,45], which also leads to acidification of the cytosol [39].
The importance of cytosolic pH for the regulation of many cellular processes has been the reason for creating of various methods for its measurement, which has different degrees of invasiveness and toxicity for the plant and the duration of observation. Glass, liquid-membrane ion-sensitive and vibrating electrodes have previously been successfully used for continuous pH measurement during long-term (several hours) observations of processes [46,47,48,49]. Intracellular pH can also be measured using optical (fluorescent) methods, which are less invasive. The optical methods include the use of chemical fluorescent dyes and genetically encoded fluorescent probes. Fluorescent molecular probes need to be loaded into the cells, which is associated with certain difficulties. Furthermore, the analysis of long-term (from several tens of minutes to several hours) processes is limited by photobleaching and photodamage of the molecular probes [48,50], which generally limits their successful application. The pH-sensitive genetically encoded sensors based on GFPs, which include Pt-GFP, pHusion and pHluorin, overcome these limitations: these sensors are non-toxic and are constantly expressed in cells, so they are more suitable for whole-plant imaging [23,51]. GFP contains the protein β-barrel, which surrounds the fluorescence-emitting chromophore. Chromophore is formed as a result of the cyclization of the internal tripeptide S65-Y66-G67. Spectral properties of GFP and its mutants depend on pH due to the presence of tyrosine residue (Y66) in the chromophore [52]. Chromophore has different forms, dependent on the pH. The neutral form (A) of the chromophore can be transformed into the anionic form (B) with an increase in pH by changing the protonation of amino acid residues and then by the modulation of conformation [53]. The neutral form of GFP has an absorption maximum at 390 nm; the anionic form—at 475 nm. Dependence on the pH of the GFP’s spectral properties allows the use of GFPs as ratiometric pH sensors. The ratiometric fluorescent sensor Pt-GFP from Ptilosarcus gurneyi has sensitivity to a larger pH range among other popular pH sensors [51,54]. S65 residue of Pt-GFP chromophore was replaced by Q65 residue, which is accompanied by a more pronounced peak of excitation at 475 nm [55]. Both absorption peaks of Pt-GFP (at 390 and 475 nm) are expressed at low pH; alkalization leads to a smoothing of the peak at 390 nm and an increase in the second absorption peak [51]. The sensor is characterized by a low sensitivity to cooling [23] and sodium chloride [51].
The majority of research on cytosolic pH was carried out using Arabidopsis model plants [23,51,56]. Therefore, the creation and usage of model plants based on common crops are important for identifying patterns in their responses to biotic and abiotic factors in order to further improve their cultivation conditions. This work describes the creation of potato plants with the genetically encoded Pt-GFP sensor and their application for the registration of pH shifts under the local and systemic action of a temperature stimulus.

2. Materials and Methods

2.1. Micropropagation and Genetic Transformation of Potato Plants

Studies were carried out on plants of potato (Solanum tuberosum) cultivar “Nevsky”. Plants were cultured in vitro on a Murashige and Skoog (MS) [57] basal medium containing 30 g L−1 (w/v) sucrose and 7 g L−1 (w/v) agar. Stem explants with one node were used for micropropagation every 3 weeks.
Transgenic S. tuberosum (cv. Nevsky) plants were produced using an Agrobacterium-mediated transformation. The strain AGL0 of Agrobacterium tumefaciens was cultivated on a YEP nutrient medium supplied with 100 mg L−1 rifampicin. A. tumefaciens was transformed with pART27-ptGFP (NanoLight®, Technologies, Malvern, PA, USA) by electroporation using a MicroPulser (Bio-Rad, Hercules, CA, USA). The T-region of the pART27-ptGFP vector contained the kanamycin resistance gene nptII and ptGFP-gene under the control of the CaMV 35S promoter and ocs terminator. The pART27-ptGFP vector also contained the aadA gene of spectinomycin resistance (Tn7 Spr/Str). Transgenic bacteria were screened for antibiotic resistance on selective growth media YEP supplied with 100 mg L−1 rifampicin and 100 mg L−1 spectinomycin.
For genetic transformation, stem explants of potato without nodes were cultivated with transgenic agrobacteria on MS nutrient medium supplemented with 30 g L−1 (w/v) sucrose, 7 g L−1 (w/v) agar, 3 mg L−1 6-Benzylaminopurine (6-BAP) and 0.5 mg L−1 IAA. Co-cultivation of potato plants with agrobacteria was carried out in the dark at 25 °C for 2 days. After co-cultivation for organogenesis induction, potato explants were placed in selected MS nutrient medium supplemented with 30 g L−1 (w/v) sucrose, 7 g L−1 (w/v) agar, 3 mg L−1 6-BAP, 0.5 mg L−1 IAA, 100 mg L−1 kanamycin and 600 mg L−1 cefotaxime. After 2 months, potato regenerants with buds and calli were transferred to MS nutrient medium supplemented with 2 mg L−1 6-BAP, 1 mg L−1 1-naphthaleneacetic acid, 100 mg L−1 kanamycin and 600 mg L−1 cefotaxime. Regenerants of potato were propagated in vitro on MS media with 30 g L−1 (w/v) sucrose and 7 g L−1 (w/v) agar without phytohormones or antibiotics.
Potato micropropagation, organogenesis induction and cultivation of regenerants were carried out under 16/8 h (light/dark) photoperiod at 25 °C with a light intensity of 60 μmol m−2 s−1.

2.2. Acclimatization of Potato

Well-rooted 7-day-old potato plantlets were transferred into clear polypropylene containers with a 10% solution of mineral composition of MS liquid nutrient medium. Every container had a transparent polyethylene lid (height 12 cm). After 2 days, the polyethylene lids were removed. Plantlets were cultivated on a liquid nutrient medium for 7 days. After acclimatization, potato plantlets were grown in pots with soil containing 220 mg L−1 NH4+NO3, 200 mg L−1 P2O5 and 250 mg L−1 K2O. The pH of the soil was 5.5–6.5. Potato plantlets were cultivated in an environmentally controlled room under 16/8 h (light/dark) photoperiod at 25 °C with a cool-white and pink fluorescence tubular lamp (FLUORA OSRAM, Munich, Germany; 60 μmol m−2 s−1).

2.3. PCR Analysis of Transgenic Plants

The presence of the Pt-GFP gene in the plantlets was analyzed by PCR. Genomic DNA from the putative transgenic lines of the potato was isolated using the CTAB method [58]. PCRs were performed using 8.0 μL of 0.4 μM every primers, 40 μL of 5× Buffer (ThermoFS, Walthame, MA, USA), 4 μL of 0.2 mM dNTPs, 20 μL of genomic DNA and 0.8 μL of Hot Start DNA polymerase (ThermoFS, Walthame, MA, USA). The forward primer Pt-GFP (ATGAACCGCAACGTGCTGAA) and the reverse primer Pt-GFP (TACACCAGATCCACTTCGCC) (Eurogen, Moscow, Russia) were also used. PCR was carried out using C1000TM Termal Cycler Bio-Rad (Bio-Rad, Hercules, CA, USA). PCR was performed in a thermocycler using the following program: 28 cycles of 95 °C for 60 s, 55 °C for 30 s, 72 °C for 60 s and a final extension of 72 °C for 8 min. DNA products were visualized in agarose gels using Thermo Scientific FastRuler™ Middle Range DNA Ladder markers (Thermo Scientific, Waltham, MA, USA).

2.4. Confocal Laser Scanning Microscopy (CLSM)

Fluorescent images and fluorescent spectra of different tissues and organs of transgenic plants were obtained by an LSM710 confocal laser scanning microscope (Carl Zeiss, Jena, Germany) with a Plan-Apochromat 20×/0.5 objective. Pt-GFP was excited at 405 nm and 488 nm, and detected between 505 nm and 525 nm or 495 nm and 600 nm (for spectra). Image data were analyzed using the software Zen 2.1 (Carl Zeiss) [59] and the open-source ImageJ 1.52p software [60].

2.5. Fluorescence Imaging of Pt-GFP in the Leaf of a Whole Plant

Fluorescence imaging of the Pt-GFP signal of the potato leaves was carried out using the fluorescence imaging system DVS-03 (ILIT RAS, Shatura, Russia). Pt-GFP fluorescence was excited by a 395/25 nm luminodiode and 490/20 nm luminodiode and was emitted by a CMOS-camera (PRIME 95B, Photometrics, Tucson, AZ, USA) with a 535/43 nm filter. Fluorescent images were obtained at an exposure of 2000 ms with a frequency of 20 s. Micro-Manager 1.4 software [61] and ImageJ 1.52p software [60] were used for processing raw images.
40-day-old potato plants with leaves of 3–4 cm long were used for fluorescence imaging. Before image recording, plants were fixed on the measuring stand (Figure S1) and adaptation lasted for 90 min. The recording was performed under actinic light illumination of 650/50 nm (40 μmol m−2 s−1) and an ambient temperature of 23 °C. After adaptation, but before the temperature effect on the plants, a series of fluorescence images were recorded for 5 min. There was a variety of impacts:
  • The abaxial side of the leaves was cooled or heated using Peltier device, the polarity of which can be changed to switch from cooling to heating and back. The temperature changed periodically. In total, four temperature effects were applied with increasing strength, lasting 2 min within a period of 5 min. The cooling strength was 16.4, 9.4, 4.9 and 3 °C. The heating was carried out with the same time intervals to 34.7, 42.9, 50.7 and 59.1 °C;
  • The tips of the leaves were heated with a ceramic cement resistor for 4 min to 52 °C;
  • The detached leaves treated with a H+-ATPase inhibitor (2.5 mM sodium orthovanadate) or standard solution (1 mM NaCl, 0.1 mM KCl, 0.1 mM CaCl2) were first cooled to 9.4 °C for 3 min, and then after 7 min heated to 42.9 °C for 3 min by the Peltier device. The treatment of the leaves with reagents was carried out by loading them through the petiole using a desiccator and vacuum pump at a pressure of 0.2 atmosphere for 5 min;
  • H+-ATPase inhibitor or standard solution was added to 10 × 10 mm pieces cut out of the leaves and placed in Petri dishes (volume 15 mL) filled with standard solution.
Non-transgenic potato plants characterized by a low ratio F490/F395 level were used to control changes in the fluorescence of heated or cooled leaves.

2.6. In Vivo Calibration of Pt-GFP Signal in the Potato Plants. Ratiometric Analysis

Whole leaves of 40-day-old potato (transgenic and non-transgenic) plants were incubated for 4 h in buffer solutions with different pH levels (4.0, 4.5, 5.0, 5.5, 6.0, 6.5, 7.0, 7.5, 8.0, 8.5, 9.0) to obtain the dependence of Pt-GFP fluorescence on pH. Buffer solutions contained 125 μM of the protonophore carbonyl cyanide 3-chlorophenylhydrazone (CCCP). Buffer solutions had the following composition: pH 4.0, 4.5, 5.0 and 5.5 (40 mM sodium citrate, 40 mM MES); 6.0 (40 mM sodium citrate, 40 mM MES, 40 mM MOPS); 6.5 and 7.0 (40 mM sodium citrate, 40 mM MES, 40 mM MOPS, 40 mM TRIS); 7.5 (40 mM MOPS, 40 mM TRIS); and 8.0, 8.5 and 9.0 (80 mM TRIS). The base of all buffers was a standard solution (1 mM NaCl, 0.1 mM KCl, 0.1 mM CaCl2). The solutions were buffered with 1M NaOH or 1M HCl.
After incubation in buffer solutions, the leaves were fixed onto the measuring stand in such a way that the abaxial side of the leaf was immersed in 5 mL of the corresponding buffer solution. Further fluorescent images were obtained on a fluorescence imaging system, as described above. In addition, immediately after incubation of the leaves in the buffer solutions, the pH level of each solution was re-measured using a pH-meter. The equations of F490/F395 dependence on pH were calculated using GraphPad Prism 6 software. The Boltzmann fit was chosen for fitting sigmoidal curves to calibration data [62] using apparent pK 7.3 for the Pt-GFP sensor [51].

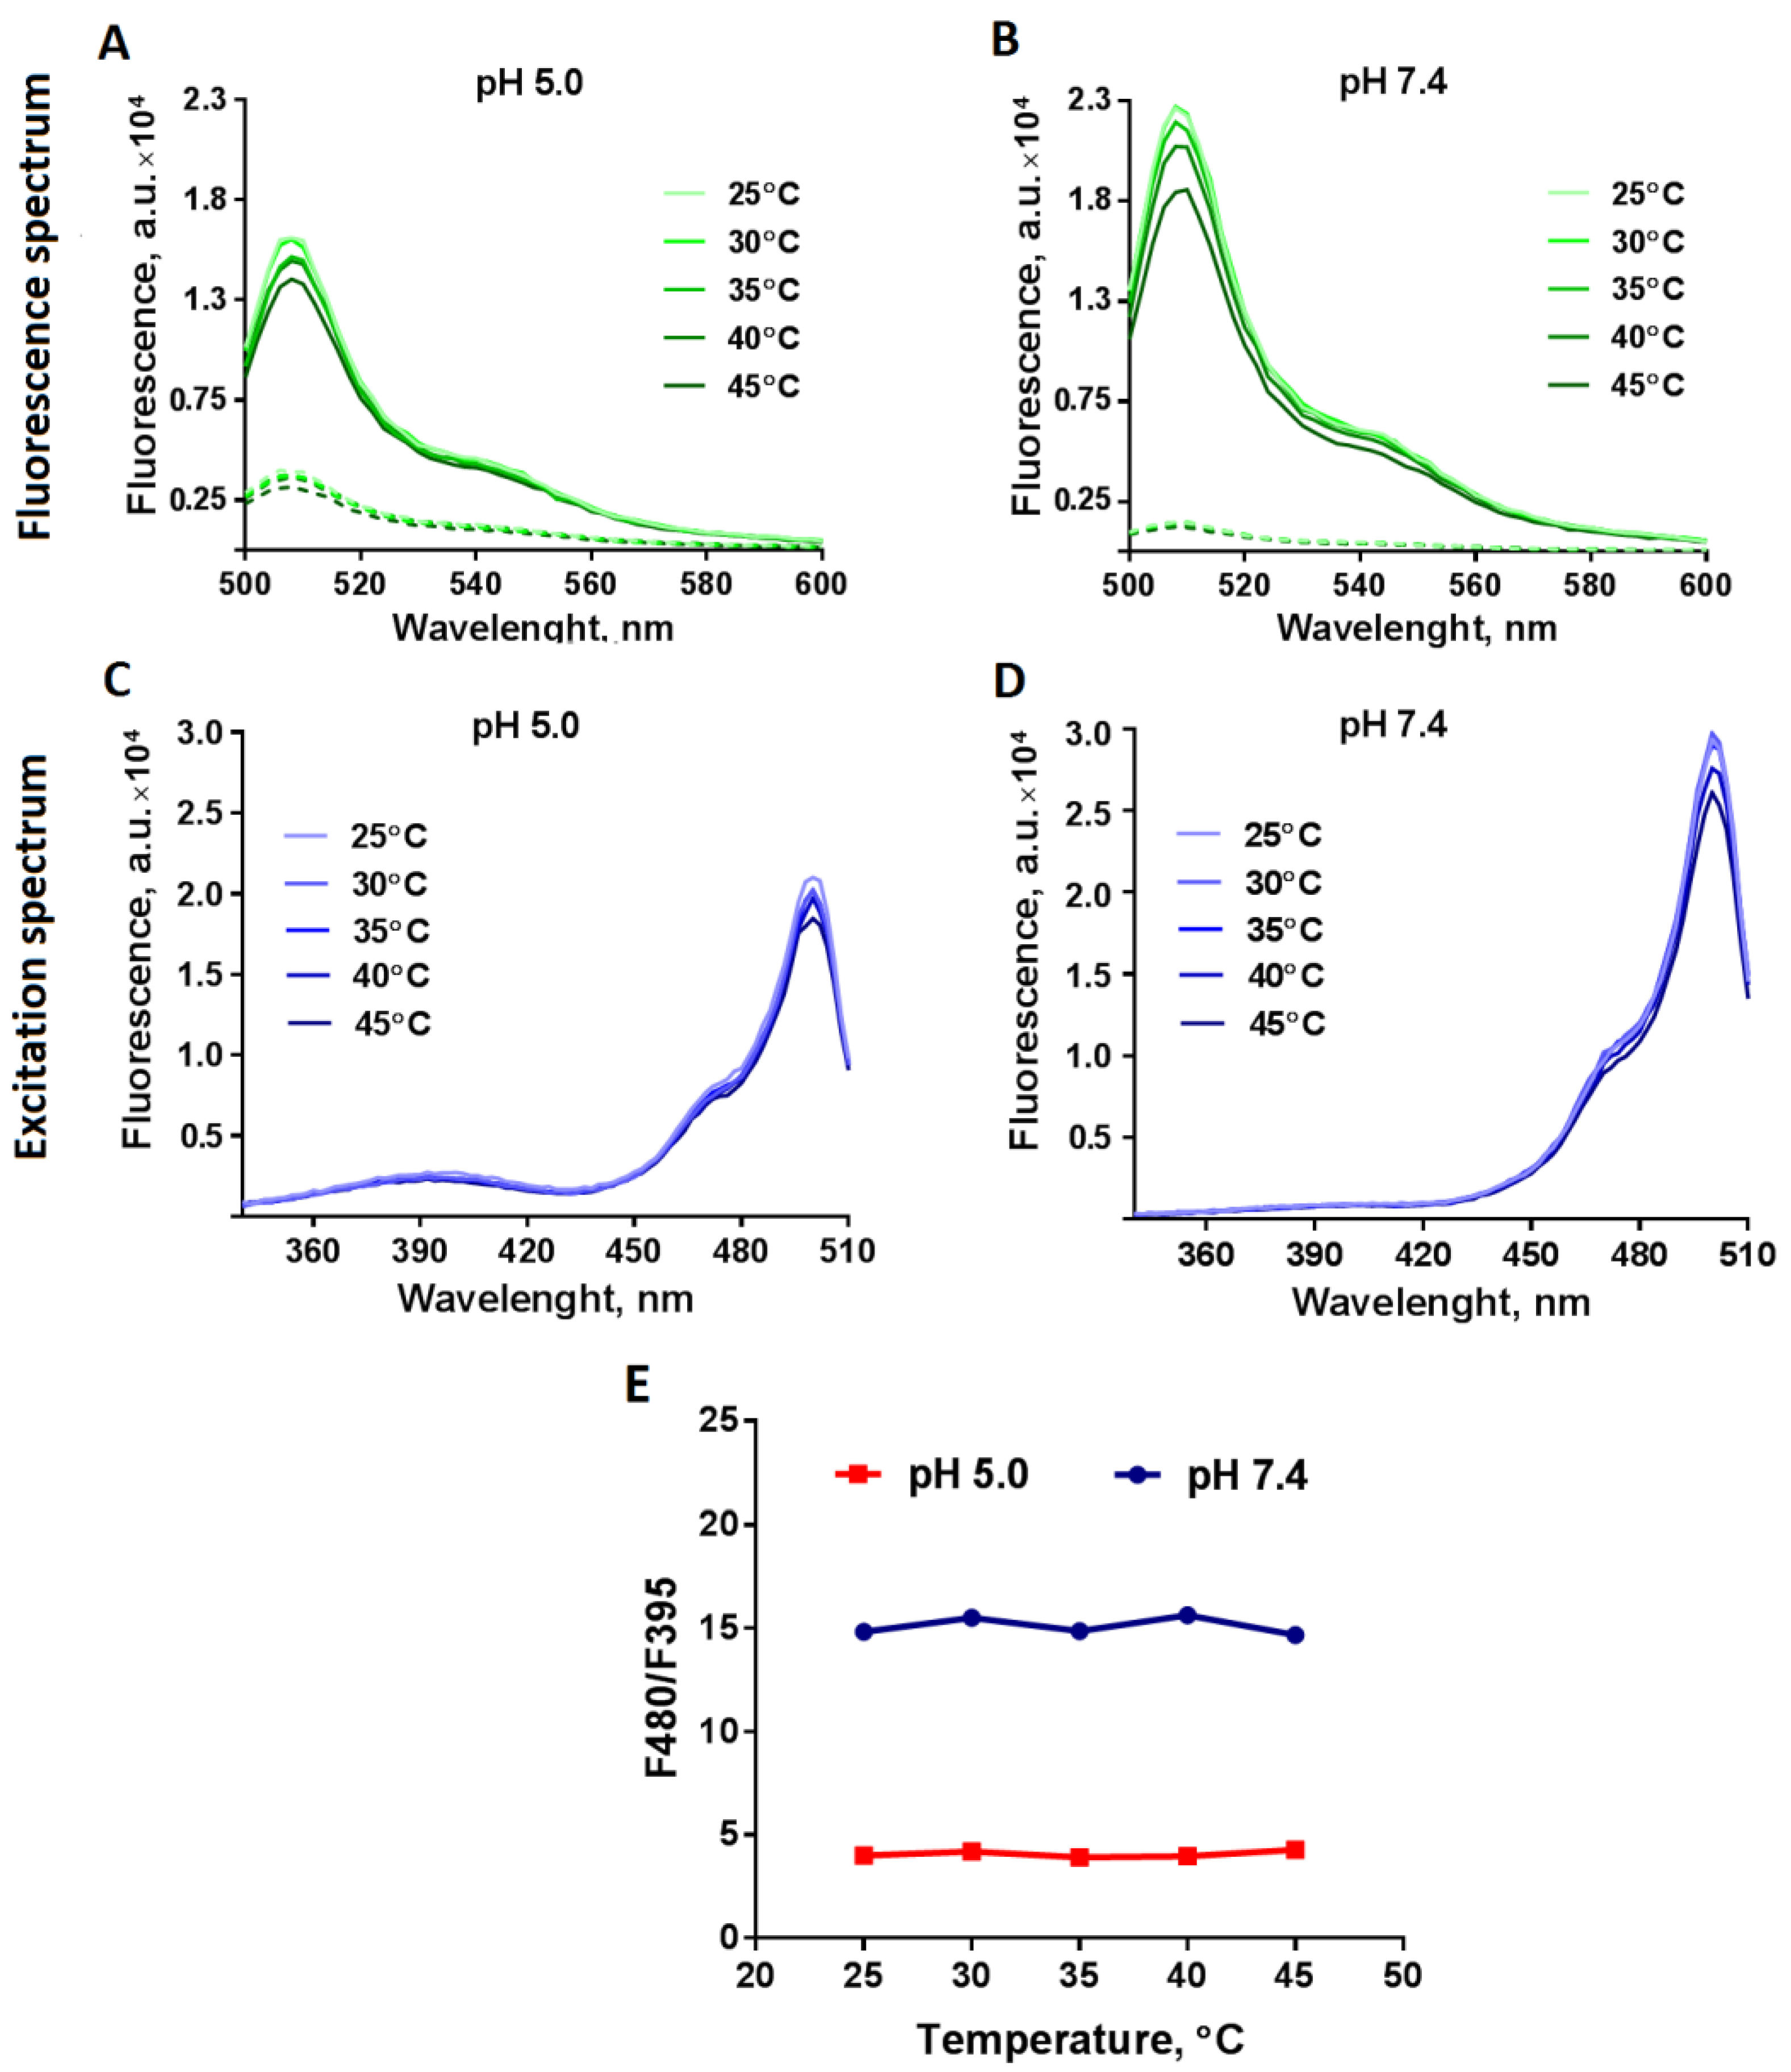
2.7. Testing the Temperature Dependence of Pt-GFP Fluorescence

The dependence of the Pt-GFP spectral properties on temperature was tested at 25, 30, 35, 40 and 45 °C using commercial purified Pt-GFP (Nanolight®, Technologies, Malvern, PA, USA). The Pt-GFP was dissolved in a pH 7.4 buffer solution (137 mM sodium chloride, 2.7 mM potassium chloride, 10 mM disodium phosphate) or in a pH 5.0 buffer solution (114.2 mM sodium chloride, 2.25 mM potassium chloride, 8.3 mM disodium phosphate, 13.3 mM sodium citrate, 13.3 mM MES). The final concentration of protein was 0.1 μg mL−1.
Excitation and emission spectra of the purified Pt-GFP were obtained using Synergy Mx Multi-Mode Microplate Reader (BioTek, Winooski, VT, USA) in black 96-well microplates with a clear glass bottom (Eppendorf, Hamburg, Germany). Heating of Pt-GFP solutions was carried out with a sequential increase in temperature from 25 °C to 30, 35, 40 and 45 °C using a Microplate Reader control unit. Excitation spectra were obtained in the range from 330 to 510 nm, and the fluorescence signal was registered at 530 nm. Fluorescence spectra were recorded in the range of 500 to 600 nm with excitation at 395 or 480 nm.

2.8. Measurements of Electric Potential in Potato Plants Using Macroelectrodes

Electrical potentials were extracellularly measured with Ag+/AgCl electrodes EVL-1MZ (Gomel Plant of Measuring Devices, Gomel, Belarus). The electrodes were connected with a high-impedance amplifier IPL-113 (Semico, Novosibirsk, Russia) and a personal computer. Measuring electrodes were set in contact with a plant by cotton threads wetted with water. The measurements of electric signals were carried out with fluorescence measurements by fluorescence imaging system DVS-03 at the same time. The scheme of electrode positions on the leaf is presented on Figure S1. The reference electrode was set in a pot with soil.

2.9. Temperature Changes of Potato Leaves

A thermal imager Testo 885 (Testo, Lenzkirch, Germany) was used for control of the temperature of the potato leaves which were cooled or heated. Received images were processed by IRSoft 4.5 software [63].

2.10. Statistical Analysis

Statistical analysis was performed using GraphPad Prism 6 software. Data are represented as mean ± standard deviation (SD). The number of biological replicates was from 5 to 7.

3. Results

3.1. Characteristics of Potato Transformants

As a result of the agrobacterial transformation of potatoes by the gene of the Pt-GFP ratiometric pH sensor, 19 regenerants were obtained. The efficiency of the genetic transformation was 13.19%. A polymerase chain reaction confirmed the presence of the Pt-GFP gene in the genome of 5 of the 19 potato regenerants (Figure 1).
Further experiments were carried out on the plants of transformation line 1 (NKM01). The choice of this regenerant was based on the results of a PCR analysis and the severity of the characteristic peak of Pt-GFP protein emission in the tissues of the transformed plants (Figure S2).
A detailed study of Pt-GFP localization in the potato plants was carried out using confocal laser scanning microscopy (CLSM). A bright fluorescent sensor signal was observed on CLSM images of transgenic plant cells, and it was more pronounced when excited at 488 nm (Figure 2A). The emission spectrum of transgenic plants had a maximum at 509 nm (typical for Pt-GFP) when excited at both 405 and 488 nm. The untransformed potato plants did not possess such fluorescence. CLSM images of the cells of the untransformed plants contained a weak fluorescent signal due to the autofluorescence of tissues, which is much less than that of the transformed cells (Figure 2).
The presence of the Pt-GFP sensor was confirmed in all organs of the transgenic potatoes, for example, in the leaves (abaxial epidermis, abaxial and adaxial mesophyll, vascular tissue), stem cortex, tip, absorption zone and elongation zone of the root (Figure 3). The fluorescent signal of the Pt-GFP sensor indicates the presence of this protein in the cytoplasm and cell nuclei.
To determine the pH value in potato leaf cells, a calibration curve was performed in the pH range of 4 to 9 (Figure 4). Potato leaves were incubated in solutions with different pH levels in the presence of the protonophore, and then fluorescent images of potato tissues were obtained using the DVS-03 fluorescence imaging system or using CLSM. After image processing, the dependence of the fluorescence of the Pt-GFP protein on the pH in the cells of a whole potato leaf was obtained. The dependence of the ratio F490/F395 on pH was approximated by the Boltzmann sigmoid (Figure 4). The results obtained using CLSM for the absorption zone of the root, stem cortex and adaxial mesophyll of the leaf are shown in Figure S3.
In the range of 6.5 to 8 pH units, a close to linear dependence of Pt-GFP fluorescence on pH was observed, which corresponds to the literature data on the sensitivity range of the Pt-GFP sensor, both in solution and in situ calibration [51,64].
The cytosolic pH of the cells of a whole potato leaf, determined by a whole-body imaging method, was 7.03 ± 0.03. pH values determined with CLSM were 7.09 ± 0.14 in the cortical cells of the absorption zone of the root, 6.79 ± 0.12 in the cortical cells of stem, and 6.75 ± 0.17 in the mesophyll cells of the leaf adaxial side.

3.2. Testing the Temperature Dependence of Pt-GFP Fluorescence

The effect of temperature on the fluorescence of purified Pt-GFP was evaluated. The emission and excitation spectra of Pt-GFP in pH 5.0 or 7.4 solutions are shown in Figure 5. An increase in the temperature of the solution caused a decrease in the intensity of the Pt-GFP fluorescence with an increase in temperature from 25 to 45 °C (Figure 5A,B). At the same time, there was no change in the position of the excitation and emission peaks (Figure 5C,D). It is also important to note the constancy of the fluorescence ratio of the anionic and neutral forms of the protein (F480/F395) in both alkaline and acidic solutions (Figure 5E). Thus, the results demonstrate the possibility of using the Pt-GFP to measure of the temperature-induced pH changes in plants.

3.3. Temperature-Induced pH Shifts in the Potato Leaf

During the study, changes in the pH of the cytosol and electrical potentials were determined in the zone affected by the stress-factors, i.e., cooling or heating of a whole leaf of an intact potato plant.
An uneven decrease in the temperature of the leaf surface was observed, due to differing leaf thickness, when the whole leaf was chilled by the Peltier device (Figure 6). The most pronounced decrease in temperature (up to 9 °C from the initial temperature of 23 °C) was observed in the thinner distal part of the leaf (area1) (Figure 6), while the thick central part of the potato leaf (area2) was cooled to 9.9 °C. The difference in the extent of cooling of a potato leaf was reflected in the change in the pH level and the electrical potential in these two zones of interest.
During the cooling of the leaf surface, a rapid decrease in the cytosolic pH occurred: it acidified after cooling started, and also quickly recovered after the end of the stimulus action and the return of the leaf temperature to the initial value. The magnitude of the pH shift directly depended on the cooling depth. At maximum cooling in area1, the pH decreased by 0.21 units, in area2—by 0.17. No changes in the F490/F395 ratio of the non-transgenic plant were observed compared to that of the transgenic plant line. The results are shown in Figure S4.
Along with the change in the intracellular pH, cooling caused a transient depolarization of the membrane of the cells of the leaf, with a maximum amplitude of 30 mV recorded in the distal part of the leaf where the most pronounced cooling occurred (area1) (Figure 6B,D). The dynamics of the changes in pH and electrical potential were similar.
In the case of heating the whole leaf by the Peltier device, an uneven change in the surface temperature of the leaf was also noted. The thinner distal part of the leaf (area 1) was heated by 26.3 °C from the initial temperature, while the thicker central part of the leaf (area 2) was heated only by 15.4 °C (Figure 7).
Heating caused alkalization of the cytoplasm by 0.3 pH units. When a temperature was reached (35–40 °C), rapid acidification of the cytoplasm began, along with ongoing heating.
The dynamics of the electrical potential in the heated leaf, in general, corresponded to the dynamics of the cytosolic pH. First, when the leaf surface was heated, hyperpolarization occurred, and then, when the critical temperature was reached, depolarization took place with the maximum amplitude, which was 35 mV. Stimuli 3 and 4 caused the generation of variation potential in area 1, and only the last stimulus caused the same in area 2. The recovery of the electrical potential after the temperature returned to the initial values was slower compared to cooling, especially with strong heating. The amplitudes of cold- and heat-induced depolarization were similar for transgenic and non-transgenic plants. Moreover, these stressors did not lead to changes in the F490/F395 ratio, which could reflect a change in pH (Figure S4).

3.4. Registration of pH Changes at a Distance from the Zone of Local Stimulation

The next step of the research was the analysis of pH changes in the unstimulated areas of the leaf under local stimulation. In this case, only area1 was exposed to high temperatures, and changes in pH and electrical potential were recorded at different distances from the stimulation zone. Local heating caused the propagation of an electrical signal to the unstimulated area. The electrical signal was a transient depolarization with an amplitude of 50 mV, which can be characterized as a variation potential (VP) (Figure 8). There was a decrement of VP, which was expressed in a decrease in the amplitude of the reaction with the distance from the stimulation zone. Along with the VP propagation, local heating also induced a change in the intracellular pH in the unstimulated areas of the leaf. Such changes represent a wave of the pH decreasing, lasting several tens of minutes. The amplitude of the acidification wave decreased with the distance from the local heating zone, by ~0.2 pH units at a distance of 1 cm from the stimulation zone (area1) and by ~0.1 pH units at a distance of 3 cm from the stimulation zone (area2). Along with the propagation of the acidification wave near the stimulation zone, there was also a short-term alkalization of small amplitude. This may be due to an increase in temperature in the area adjacent to the stimulated area.

3.5. Analysis of the Mechanism of Temperature Induced Changes in pH

The mechanism of pH shifts under the temperature changes is most likely to be the modulation of H+-ATPase activity, the contribution of which was determined using an inhibitor, sodium orthovanadate. When sodium orthovanadate was added to the leaf bathing solution, a decrease in pH by 0.25 was observed (Figure 9A), and persistent inhibition of the proton pump occurred: the pH level remained low throughout the observation period. The pHcyt of leaves washed with the standard solution did not change.
An analysis of the effect of sodium orthovanadate on thermally induced changes in pH and electrical potential was performed on leaves loaded with the inhibitor or standard solution. During heating and cooling, the reactions of the leaves treated with a standard solution and the inhibitor differed (Figure 9B). The pH changes (Figure 9C) in the leaves treated with the inhibitor were less pronounced than those in leaves treated with the standard solution. Sodium orthovanadate caused a decrease in pH shifts by 50% under cooling, and by 59% under heating. Along with the suppression of temperature-induced pH shifts in the presence of the inhibitor, there was a significant suppression of changes in the electrical potential (Figure 9D).

4. Discussion

Potato plants genetically transformed with pH-sensitive fluorescent sensor were characterized in this work as one of the few model objects from a group of the most important agricultural crops for studying plant responses to the changes in environmental conditions that are significant for cultivation. The optimal growth temperature of the potato is considered to be between 16 and 25 °C. Therefore, high and low temperatures during the cultivation season cause physiological changes in potato plants that affect its development and can lead to a decrease in productivity: the minimum temperature for tuber initiation ranges from 4 to 18 °C, and at high temperatures (29–31 °C) tuberization decreases [5,14,65,66]. The use of a genetically encoded sensor in a plant allows for the performance of non-invasive single or multiple assessments, as well as long-term monitoring of intracellular pH, without loading of molecular probes [51]. The high uniform expression of the Pt-GFP sensor in cells of various tissues allows for the measurement of pH changes, both in individual cells using high-resolution microscopy and in the whole plant using whole-body imaging. As demonstrated in Figure 6 and Figure 7, whole-body imaging allows for the study of the spatial heterogeneity of responses to temperature factors.
Some literature data indicate the need for careful use of GFP-based sensors in the study of temperature-dependent processes, because GFP fluorescence can also be temperature dependent [67,68]. At the same time, the properties of Pt-GFP were previously analyzed at temperatures from 4 to 22 °C [25]: Pt-GFP did not change its properties in this temperature range. Furthermore, Pt-GFP remains stable when heated to 80.5 °C [55]. In our work, we have shown that the fluorescence of Pt-GFP remains almost unchanged at temperatures from 25 to 45 °C. When the protein is heated, the ratio between the fluorescence of the anionic and neutral forms of Pt-GFP remains unchanged and the pH sensitivity of the sensor is maintained (Figure 5F).
The usage of potato as a model plant allows for the determination of the features of shifts in intracellular pH caused by such an important abiotic factor as a temperature change. The acidification of the cytosol of potato cells caused by cooling corresponds to the direction of cold-induced pH shifts for Vigna radiata and Arabidopsis thaliana, according to early research of cell suspensions [25,26,69,70,71]. The registered magnitude of pH shift in potato plants (by 0.2 units) (Figure 6) is generally slightly smaller than that of V. radiata (by 0.6 pH units) [26], V. radiata and T. aestivum (by 0.1–0.6 pH units) [69], A. cherimola (by 0.72 pH units) [72], and A. thaliana (by 0.1 pH units) [25]. The differences can be due to both the greater strength and duration of cooling performed in the works [72], and the fact that, in the studies [26,69], the pH was measured in a cell suspension, and not in the whole plant.
The study of the dynamics of temperature-induced changes in the intracellular pH revealed their high rate (Figure 6 and Figure 7). This indicates that the pH changes are primarily associated with the “biophysical pH-stat”—a change in the activity of H+-transporting systems, including H+-ATPases of the tonoplast and plasmalemma [28]. The participation of the H+-ATPases of plasmalemma is also indicated by the changes in the electrical potential, consistent with the pH shifts (Figure 6 and Figure 7), to the formation of which the proton pump contributes the most in plant cells [44]. The key role of H+-ATPases in temperature-induced changes in pH and electrical potentials is evidenced by the experiments with proton-pump inhibition by sodium orthovanadate (Figure 9). Inhibition of H+-ATPase activity reduced the amplitude of pH and electrical potential changes compared to the standard solution treatment (Figure 9C,D). However, the interpretation of in vivo experiments with sodium orthovanadate should be performed with caution, because it can also affect the activity of other enzyme activity, for example, phosphatases [35]. The set of the data obtained in our work indicates the contribution of the proton pump to temperature-induced pH shifts.
A decrease in H+-ATPase activity may be associated with the influx of calcium ions into the cell, which is the central event of the cold-induced cell response [73], also inducing the development of depolarization [38,42]. Another way that the cold influences the activity of the ATPase can be an increase in membrane rigidity [37,74,75,76]. Along with the H+-ATPase of plasmalemma, the vacuolar H+-ATPase is also apparently involved in the response to cold stress, since an increase in the vacuolar pH was registered along with a decrease in the cytosolic pH [69,71].
An increase in temperature to sub-threshold values leads to cytosol alkalinization (Figure 7). This can be caused directly by the effect of temperature on the membrane lipid matrix [76], or by the regulation of activity by reversible phosphorylation of the proton pump [77].
Heating to the extent of exceeding the threshold temperature leads to the formation of a deep depolarization wave, propagating beyond the stimulated zone—a variation potential [74,78]. The formation of VP is associated with the inactivation of the proton pump occurring in case of the threshold temperature being exceeded [40], or after prolonged treatment with sub-threshold temperatures [41,79]. The generation and propagation of VP are accompanied by transient acidification of cytosol (Figure 7 and Figure 8). In the case of heat shock, the inactivation of the proton pump and the subsequent acidification of the cytosol are the result of earlier rapid events: changes in the properties of membranes, and activation of the signaling cascade involving lipids messenger, calcium release and ROS generation [76,80]. The pH changes associated with the propagation of long-distance stress signals were described earlier, and represent a transient acidification of the cytoplasm, along with apoplastic alkalinization [17,39,81,82,83,84,85,86]. On maize [39] and pea plants [85], cytosol acidification was observed directly during the generation of an electrical impulse. At the same time, the results of this research demonstrate the prolonged acidification wave after electrical impulse generation. The formation of the wave presumably can be caused by the activation of regulatory/signaling systems during the generation of VP.
In general, the results of the research indicate both local and systemic changes in pH under temperature changes. pH changes can act as regulators of the activity of physiological processes and gene activation, e.g., they are shown to regulate the activity of photosynthesis by long-distance stress signals [44,87,88]. They can be a result of other propagating signals or be an important basic condition accompanying the dominant signaling cascade [17]. Changes in pH can be coordinated with other stress signals, such as a calcium signal [89], or they can induce the next signal [90]. The pH level determines the functioning of enzymes and many other processes, thus determining the pH as a signal. The study of the generation and propagation of such a signal is important for an understanding of the relationship of the processes in a plant cell and fine-tuning their regulation.

5. Conclusions

The created model potato plants expressing a pH-sensitive fluorescent sensor allow for the recording of the dynamics of intracellular pH on whole plants. There are rapid local and systemic changes in cytosolic pH in response to temperature changes. A change in the activity of the H+-ATPases contributes to them. Further research should focus on the mechanisms of modulation of H+-ATPases activity, as well as on the role of pH changes in the formation of resistance to stressors.

Supplementary Materials

The following are available online at https://www.mdpi.com/article/10.3390/agriculture11111131/s1, Figure S1: The scheme of experiment in the fluorescence imaging system DVS-03, Figure S2: Emission spectra of transgenic potato plants and non-transgenic potato plants, Figure S3: In vivo calibration of Pt-GFP fluorescence ratio (F488/F405), Figure S4: Cold- and heat-induced changes in F490/F395 ratio and electrical potential of non-transgenic potato leaf cells.

Author Contributions

Conceptualization, A.P., V.V. and A.B.; methodology, A.P., M.G. and A.B.; investigation, A.P., M.G., M.A., T.Z. and A.Y.; writing—original draft preparation, A.P.; writing—review and editing, A.P., M.G., M.A. and M.L.; visualization, A.P., M.G., M.L. and A.B.; supervision, A.B.; project administration, V.V. and A.B.; funding acquisition, V.V. All authors have read and agreed to the published version of the manuscript.

Funding

This research was supported by The Center of Excellence, Center of Photonics, funded by The Ministry of Science and Higher Education of the Russian Federation, contract No 075-15-2020-927.

Data Availability Statement

Data is contained within the article and supplementary material.

Conflicts of Interest

The authors declare no conflict of interest.

References

  1. Singh, J.; Kaur, L. Advances in Potato Chemistry and Technology, 1st ed.; Academic Press: Cambridge, MA, USA, 2009; p. 528. [Google Scholar]
  2. Halterman, D.; Guenthner, J.; Collinge, S.; Butler, N.; Douches, D.S. Biotech Potatoes in the 21st Century: 20 Years Since the First Biotech Potato. Am. J. Potato Res. 2016, 93, 1–20. [Google Scholar] [CrossRef] [Green Version]
  3. Akpenpuun, T.D.; Mijinyawa, Y. Evaluation of a Greenhouse under Tropical Conditions Using Irish Potato (Solanum Tuberosum) as the Test Crop. Acta Technol. Agric. 2018, 21, 56–62. [Google Scholar] [CrossRef] [Green Version]
  4. Kikuchi, A.; Huynh, H.D.; Endo, T.; Watanabe, K. Review of recent transgenic studies on abiotic stress tolerance and future molecular breeding in potato. Breed. Sci. 2015, 65, 85–102. [Google Scholar] [CrossRef] [Green Version]
  5. Rykaczewska, K. The Effect of High Temperature Occurring in Subsequent Stages of Plant Development on Potato Yield and Tuber Physiological Defects. Am. J. Potato Res. 2015, 92, 339–349. [Google Scholar] [CrossRef] [Green Version]
  6. Lee, Y.-H.; Sang, W.-G.; Baek, J.-K.; Kim, J.-H.; Shin, P.; Seo, M.-C.; Cho, J.-I. The effect of concurrent elevation in CO2 and temperature on the growth, photosynthesis, and yield of potato crops. PLoS ONE 2020, 15, e0241081. [Google Scholar] [CrossRef]
  7. Struik, P.C. Responses of the Potato Plant to Temperature. In Potato Biology and Biotechnology: Advances and Perspectives, 1st ed.; Vreugdenhil, D., Bradshaw, J., Gebhardt, C., Govers, F., Taylor, M., MacKerron, D., Ross, H., Eds.; Elsevier B.V.: Amsterdam, The Netherlands, 2007; pp. 367–393. [Google Scholar] [CrossRef]
  8. Orzechowski, S.; Sitnicka, D.; Grabowska, A.; Compart, J.; Fettke, J.; Zdunek-Zastocka, E. Effect of Short-Term Cold Treatment on Carbohydrate Metabolism in Potato Leaves. Int. J. Mol. Sci. 2021, 22, 7203. [Google Scholar] [CrossRef]
  9. Wei, S.; Liu, J.; Li, T.; Wang, X.; Peng, A.; Chen, C. Effect of High-Temperature Events When Heading into the Maturity Period on Summer Maize (Zea mays L.) Yield in the Huang-Huai-Hai Region, China. Atmosphere 2020, 11, 1291. [Google Scholar] [CrossRef]
  10. Wei, T.; Zhang, T.; de Bruin, K.; Glomrød, S.; Shi, Q. Extreme Weather Impacts on Maize Yield: The Case of Shanxi Province in China. Sustainability 2017, 9, 41. [Google Scholar] [CrossRef] [Green Version]
  11. Tomás, D.; Rodrigues, J.C.; Viegas, W.; Silva, M. Assessment of High Temperature Effects on Grain Yield and Composition in Bread Wheat Commercial Varieties. Agronomy 2020, 10, 499. [Google Scholar] [CrossRef] [Green Version]
  12. Subedi, K.; Gregory, P.; Summerfield, R.; Gooding, M. Cold temperatures and boron deficiency caused grain set failure in spring wheat (Triticum aestivum L.). Field Crop. Res. 1998, 57, 277–288. [Google Scholar] [CrossRef]
  13. Chen, C.-T.; Setter, T. Role of Tuber Developmental Processes in Response of Potato to High Temperature and Elevated CO2. Plants 2021, 10, 871. [Google Scholar] [CrossRef]
  14. Escuredo, O.; Seijo-Rodríguez, A.; Rodríguez-Flores, M.S.; Meno, L.; Seijo, M.C. Changes in the Morphological Characteristics of Potato Plants Attributed to Seasonal Variability. Agriculture 2020, 10, 95. [Google Scholar] [CrossRef] [Green Version]
  15. Kim, Y.-U.; Seo, B.-S.; Choi, D.-H.; Ban, H.-Y.; Lee, B.-W. Impact of high temperatures on the marketable tuber yield and related traits of potato. Eur. J. Agron. 2017, 89, 46–52. [Google Scholar] [CrossRef]
  16. Vashisht, B.; Nigon, T.; Mulla, D.; Rosen, C.; Xu, H.; Twine, T.; Jalota, S. Adaptation of water and nitrogen management to future climates for sustaining potato yield in Minnesota: Field and simulation study. Agric. Water Manag. 2015, 152, 198–206. [Google Scholar] [CrossRef] [Green Version]
  17. Felle, H.H. pH: Signal and Messenger in Plant Cells. Plant Biol. 2001, 3, 577–591. [Google Scholar] [CrossRef]
  18. Kesten, C.; Gámez-Arjona, F.M.; Menna, A.; Scholl, S.; Dora, S.; Huerta, A.I.; Huang, H.Y.; Tintor, N.; Kinoshita, T.; Rep, M.; et al. Pathogen-induced pH changes regulate the growth-defense balance in plants. EMBO J. 2019, 38, e101822. [Google Scholar] [CrossRef] [PubMed]
  19. Shen, J.; Zeng, Y.; Zhuang, X.; Sun, L.; Yao, X.; Pimpl, P.; Jiang, L. Organelle pH in the Arabidopsis Endomembrane System. Mol. Plant 2013, 6, 1419–1437. [Google Scholar] [CrossRef] [Green Version]
  20. Rupprecht, K.; Wingen, M.; Potzkei, J.; Gensch, T.; Jaeger, K.E.; Drepper, T. A novel FbFP-based biosensor toolbox for sensitive in vivo determination of intracellular pH. J. Biotechnol. 2017, 258, 25–32. [Google Scholar] [CrossRef]
  21. Diéguez-Uribeondo, J.; Förster, H.; Adaskaveg, J.E. Visualization of Localized Pathogen-Induced pH Modulation in Almond Tissues Infected by Colletotrichum acutatum Using Confocal Scanning Laser Microscopy. Phytopathology 2008, 98, 1171–1178. [Google Scholar] [CrossRef] [Green Version]
  22. Scott, A.C.; Allen, N.S. Changes in Cytosolic pH within Arabidopsis Root Columella Cells Play a Key Role in the Early Signaling Pathway for Root Gravitropism. Plant Physiol. 1999, 121, 1291–1298. [Google Scholar] [CrossRef] [Green Version]
  23. Gjetting, S.; Ytting, C.K.; Schulz, A.; Fuglsang, A.T. Live imaging of intra- and extracellular pH in plants using pHusion, a novel genetically encoded biosensor. J. Exp. Bot. 2013, 63, 3207–3218. [Google Scholar] [CrossRef]
  24. Yemelyanov, V.V.; Chirkova, T.V.; Shishova, M.F.; Lindberg, S.M. Potassium Efflux and Cytosol Acidification as Primary Anoxia-Induced Events in Wheat and Rice Seedlings. Plants 2020, 9, 1216. [Google Scholar] [CrossRef]
  25. Barnes, A.C.; Benning, C.; Roston, R.L. Chloroplast Membrane Remodeling during Freezing Stress Is Accompanied by Cytoplasmic Acidification Activating Sensitive to Freezing2. Plant Physiol. 2016, 171, 2140–2149. [Google Scholar] [CrossRef] [PubMed] [Green Version]
  26. Yoshida, S. Low temperature-induced cytoplasmic acidosis in cultured mung bean (Vigna radiate (L.) Wilczek) cells. Plant Physiol. 1994, 104, 1131–1138. [Google Scholar] [CrossRef] [PubMed] [Green Version]
  27. Nievola, C.C.; Carvalho, C.P.; Carvalho, V.; Rodrigues, E. Rapid responses of plants to temperature changes. Temperature 2017, 4, 371–405. [Google Scholar] [CrossRef] [PubMed]
  28. Felle, H.H. pH Regulation in Anoxic Plants. Ann. Bot. 2005, 96, 519–532. [Google Scholar] [CrossRef] [PubMed] [Green Version]
  29. Sze, H.; Chanroj, S. Plant Endomembrane Dynamics: Studies of K+/H+ Antiporters Provide Insights on the Effects of pH and Ion Homeostasis. Plant Physiol. 2018, 177, 875–895. [Google Scholar] [CrossRef] [Green Version]
  30. Wegner, L.H.; Shabala, S. Biochemical pH clamp: The forgotten resource in membrane bioenergetics. New Phytol. 2020, 225, 37–47. [Google Scholar] [CrossRef] [PubMed] [Green Version]
  31. Falhof, J.; Pedersen, J.T.; Fuglsang, A.T.; Palmgren, M. Plasma Membrane H+-ATPase Regulation in the Center of Plant Physiology. Mol. Plant 2016, 9, 323–337. [Google Scholar] [CrossRef] [PubMed] [Green Version]
  32. Inoue, S.-I.; Kinoshita, T. Blue Light Regulation of Stomatal Opening and the Plasma Membrane H+-ATPase. Plant Physiol. 2017, 174, 531–538. [Google Scholar] [CrossRef] [Green Version]
  33. Polak, M.; Karcz, W. Fusicoccin (FC)-Induced Rapid Growth, Proton Extrusion and Membrane Potential Changes in Maize (Zea mays L.) Coleoptile Cells: Comparison to Auxin Responses. Int. J. Mol. Sci. 2021, 22, 5017. [Google Scholar] [CrossRef]
  34. Camoni, L.; Barbero, F.; Aducci, P.; Maffei, M.E. Spodoptera littoralis oral secretions inhibit the activity of Phaseolus lunatus plasma membrane H+-ATPase. PLoS ONE 2018, 13, e0202142. [Google Scholar] [CrossRef] [PubMed]
  35. Haruta, M.; Gray, W.; Sussman, M.R. Regulation of the plasma membrane proton pump (H+-ATPase) by phosphorylation. Curr. Opin. Plant Biol. 2015, 28, 68–75. [Google Scholar] [CrossRef] [PubMed] [Green Version]
  36. Zhang, X.; Wu, H.; Chen, L.; Liu, L.; Wan, X. Maintenance of mesophyll potassium and regulation of plasma membrane H+-ATPase are associated with physiological responses of tea plants to drought and subsequent rehydration. Crop. J. 2018, 6, 611–620. [Google Scholar] [CrossRef]
  37. Lindberg, S.; Banaś, A.; Stymne, S. Effects of different cultivation temperatures on plasma membrane ATPase activity and lipid composition of sugar beet roots. Plant Physiol. Biochem. 2005, 43, 261–268. [Google Scholar] [CrossRef]
  38. Muzi, C.; Camoni, L.; Visconti, S.; Aducci, P. Cold stress affects H+-ATPase and phospholipase D activity in Arabidopsis. Plant Physiol. Biochem. 2016, 108, 328–336. [Google Scholar] [CrossRef] [PubMed] [Green Version]
  39. Grams, T.; Lautner, S.; Felle, H.H.; Matyssek, R.; Fromm, J. Heat-induced electrical signals affect cytoplasmic and apoplastic pH as well as photosynthesis during propagation through the maize leaf. Plant Cell Environ. 2009, 32, 319–326. [Google Scholar] [CrossRef]
  40. Zhao, X.; Shi, Y.; Chen, L.; Sheng, F.; Zhou, H. Secondary Structure Changes and Thermal Stability of Plasma Membrane Proteins of Wheat Roots in Heat Stress. Am. J. Plant Sci. 2011, 2, 816–822. [Google Scholar] [CrossRef] [Green Version]
  41. Mariamma, M.; Muthukumar, B.; Gnanam, A. Thermotolerance and effect of heat shock on the stability of the ATPase enzyme in rice. J. Plant Physiol. 1997, 150, 739–742. [Google Scholar] [CrossRef]
  42. Bobik, K.; Duby, G.; Nizet, Y.; Vandermeeren, C.; Stiernet, P.; Kanczewska, J.; Boutry, M. Two widely expressed plasma membrane H+-ATPase isoforms of Nicotiana tabacum are differentially regulated by phosphorylation of their penultimate threonine. Plant J. 2010, 62, 291–301. [Google Scholar] [CrossRef]
  43. Sze, H.; Li, X.; Palmgren, M.G. Energization of Plant Cell Membranes by H+-Pumping ATPases: Regulation and Biosynthesis. Plant Cell 1999, 11, 677–689. [Google Scholar] [PubMed] [Green Version]
  44. Szechynska-Hebda, M.; Lewandowska, M.; Karpiński, S. Electrical Signaling, Photosynthesis and Systemic Acquired Acclimation. Front. Physiol. 2017, 8, 684. [Google Scholar] [CrossRef] [PubMed]
  45. Fromm, J.; Lautner, S. Electrical signals and their physiological significance in plants. Plant Cell Environ. 2006, 30, 249–257. [Google Scholar] [CrossRef]
  46. Bowling, D. [23] Intracellular and intercellular pH measurement with microelectrodes. Methods Enzymol. 1989, 174, 331–338. [Google Scholar] [CrossRef]
  47. Kurkdjian, A.; Guern, J. Intracellular pH: Measurement and importance in cell activity. Annu. Rev. Plant Physiol. Plant Mol. Biol. 1989, 40, 271–303. [Google Scholar] [CrossRef]
  48. Voipio, J.; Pasrernack, M.; Macleod, K. Ion-sensitive microelectrodes. In Microelectrode Techniques: The Plymouth Workshop Handbook, 2nd ed.; Ogden, D., Ed.; The Company of Biologists Limited: Cambridge, UK, 1994; pp. 275–316. [Google Scholar]
  49. Kunkel, J.G.; Cordeiro, S.; Xu, Y.J.; Shipley, A.M.; Feijó, J.A. Use of Non-Invasive Ion-Selective Microelectrode Techniques for the Study of Plant Development. In Plant Electrophysiology; Springer: New York, NY, USA, 2006; Volume 5, pp. 109–137. [Google Scholar]
  50. Diaspro, A.; Chirico, G.; Usai, C.; Ramoino, P.; Dobrucki, J. Photobleaching. In Handbook of Biological Confocal Microscopy, 3rd ed.; Pawley, J., Ed.; Springer: Boston, MA, USA, 2006; pp. 690–702. [Google Scholar] [CrossRef]
  51. Schulte, A.; Lorenzen, I.; Böttcher, M.; Plieth, C. A novel fluorescent pH probe for expression in plants. Plant Methods 2006, 2, 7. [Google Scholar] [CrossRef] [PubMed] [Green Version]
  52. Scharnagl, C.; Raupp-Kossmann, R.; Fischer, S. Molecular Basis for pH Sensitivity and Proton Transfer in Green Fluorescent Protein: Protonation and Conformational Substates from Electrostatic Calculations. Biophys. J. 1999, 77, 1839–1857. [Google Scholar] [CrossRef] [Green Version]
  53. Zimmer, M. Green Fluorescent Protein (GFP): Applications, Structure, and Related Photophysical Behavior. Chem. Rev. 2002, 102, 759–782. [Google Scholar] [CrossRef]
  54. Martinière, A.; Desbrosses, G.; Sentenac, H.; Paris, N. Development and properties of genetically encoded pH sensors in plants. Front. Plant Sci. 2013, 4, 4. [Google Scholar] [CrossRef] [Green Version]
  55. Peele, B.; Gururaja, T.L.; Anderson, D.C. Characterization and use of green fluorescent proteins from Renilla mulleri and Ptilosarcus gurnyei for the human cell display of functional peptides. J. Protein Chem. 2001, 20, 507–519. [Google Scholar] [CrossRef]
  56. Behera, S.; Xu, Z.; Luoni, L.; Bonza, M.C.; Doccula, F.G.; De Michelis, M.I.; Morris, R.J.; Schwarzländer, M.; Costa, A. Cellular Ca2+ Signals Generate Defined pH Signatures in Plants. Plant Cell 2018, 30, 2704–2719. [Google Scholar] [CrossRef] [Green Version]
  57. Murashige, T.; Skoog, F. A Revised Medium for Rapid Growth and Bio Assays with Tobacco Tissue Cultures. Physiol. Plant. 1962, 15, 473–497. [Google Scholar] [CrossRef]
  58. Fulton, T.M.; Chunwongse, J.; Tanksley, S.D. Microprep protocol for extraction of DNA from tomato and other herbaceous plants. Plant Mol. Biol. Rep. 1995, 13, 207–209. [Google Scholar] [CrossRef]
  59. ZEISS ZEN. Digital Imaging for Light Microscopy. Downloads. Available online: https://www.zeiss.com/microscopy/int/products/microscope-software/zen.html#downloads (accessed on 10 September 2021).
  60. ImageJ. 2011. Available online: https://imagej.nih.gov/ij/ (accessed on 15 September 2021).
  61. Micro-Manager. Available online: https://micro-manager.org/ (accessed on 10 September 2021).
  62. GraphPad Curve Fitting Guide. Available online: https://static1.squarespace.com/static/564884dfe4b0734a6c40a22a/t/568a924c1115e06a4a3059bf/1451921996551/Prism-6-Curve-Fitting-Guide.pdf (accessed on 10 September 2021).
  63. IRSoft. Available online: https://www.testo.ru/ru-RU/funkcii_i_tekhnologii/po_testo_irsoft# (accessed on 10 September 2021).
  64. Geilfus, C.-M.; Mühling, K.H.; Kaiser, H.; Plieth, C. Bacterially produced Pt-GFP as ratiometric dual-excitation sensor for in planta mapping of leaf apoplastic pH in intact Avena sativa and Vicia faba. Plant Methods 2014, 10, 31. [Google Scholar] [CrossRef] [PubMed] [Green Version]
  65. Lafta, A.M.; Lorenzen, J.H. Effect of High Temperature on Plant Growth and Carbohydrate Metabolism in Potato. Plant Physiol. 1995, 109, 637–643. [Google Scholar] [CrossRef] [Green Version]
  66. Krauss, A.; Marschner, H. Growth rate and carbohydrate metabolism of potato tubers exposed to high temperatures. Potato Res. 1984, 27, 297–303. [Google Scholar] [CrossRef]
  67. Siemering, K.R.; Golbik, R.; Sever, R.; Haseloff, J. Mutations that suppress the thermosensitivity of green fluorescent protein. Curr. Biol. 1996, 6, 1653–1663. [Google Scholar] [CrossRef] [Green Version]
  68. Lim, C.R.; Kimata, Y.; Oka, M.; Nomaguchi, K.; Kohno, K. Thermosensitivity of Green Fluorescent Protein Fluorescence Utilized to Reveal Novel Nuclear-Like Compartments in a Mutant Nucleoporin NSP11. J. Biochem. 1995, 118, 13–17. [Google Scholar] [CrossRef]
  69. Yoshida, S.; Hotsubo, K.; Kawamura, Y.; Murai, M.; Arakawa, K.; Takezawa, D. Alterations of Intracellular pH in Response to Low Temperature Stresses. J. Plant Res. 1999, 112, 225–236. [Google Scholar] [CrossRef]
  70. Kadohama, N.; Goh, T.; Ohnishi, M.; Fukaki, H.; Mimura, T.; Suzuki, Y. Sudden Collapse of Vacuoles in Saintpaulia sp. Palisade Cells Induced by a Rapid Temperature Decrease. PLoS ONE 2013, 8, e57259. [Google Scholar] [CrossRef] [Green Version]
  71. Kawamura, Y. Chilling induces a decrease in pyrophosphate-dependent H+-accumulation associated with a DeltapH(vac)-stat in mung bean, a chill-sensitive plant. Plant Cell Environ. 2008, 3, 288–300. [Google Scholar] [CrossRef] [PubMed]
  72. Muñoz, T.; Ruiz-Cabello, J.; Molina-García, A.D.; Escribano, M.I.; Merodio, C. Chilling Temperature Storage Changes the Inorganic Phosphate Pool Distribution in Cherimoya (Annona cherimola) Fruit. J. Am. Soc. Hortic. Sci. 2001, 126, 122–127. [Google Scholar] [CrossRef]
  73. Kinoshita, T.; Nishimura, M.; Shimazaki, K. Cytosolic concentration of Ca2+ regulates the plasma membrane H+-ATPase in guard cells of Fava Bean. Plant Cell 1995, 7, 1333–1342. [Google Scholar] [CrossRef] [Green Version]
  74. Yan, X.; Wang, Z.; Huang, L.; Wang, C.; Hou, R.; Xu, Z.; Qiao, X. Research progress on electrical signals in higher plants. Prog. Nat. Sci. 2009, 19, 531–541. [Google Scholar] [CrossRef]
  75. Shi, Y.; Ding, Y.; Yang, S. Cold Signal Transduction and its Interplay with Phytohormones during Cold Acclimation. Plant Cell Physiol. 2015, 56, 7–15. [Google Scholar] [CrossRef]
  76. Niu, Y.; Xiang, Y. An Overview of Biomembrane Functions in Plant Responses to High-Temperature Stress. Front. Plant Sci. 2018, 9, 915. [Google Scholar] [CrossRef] [PubMed] [Green Version]
  77. Janicka-Russak, M.; Kabała, K. Abscisic acid and hydrogen peroxide induce modification of plasma membrane H+-ATPase from Cucumis sativus L. roots under heat shock. J. Plant Physiol. 2012, 169, 1607–1614. [Google Scholar] [CrossRef]
  78. Yudina, L.; Sherstneva, O.; Sukhova, E.; Grinberg, M.; Mysyagin, S.; Vodeneev, V.; Sukhov, V. Inactivation of H+-ATPase Participates in the Influence of Variation Potential on Photosynthesis and Respiration in Peas. Plants 2020, 9, 1585. [Google Scholar] [CrossRef]
  79. Zhang, J.-H.; Liu, Y.-P.; Pan, Q.-H.; Zhan, J.-C.; Wang, X.-Q.; Huang, W.-D. Changes in membrane-associated H+-ATPase activities and amounts in young grape plants during the cross adaptation to temperature stresses. Plant Sci. 2006, 170, 768–777. [Google Scholar] [CrossRef]
  80. Li, B.; Gao, K.; Ren, H.; Tang, W. Molecular mechanisms governing plant responses to high temperatures. J. Integr. Plant Biol. 2018, 60, 757–779. [Google Scholar] [CrossRef]
  81. Geilfus, K.M. The pH of the Apoplast: Dynamic Factor with Functional Impact under Stress. Mol. Plant 2017, 10, 1371–1386. [Google Scholar] [CrossRef]
  82. Wegner, L.H.; Zimmermann, U. Bicarbonate-Induced Alkalinization of the Xylem Sap in Intact Maize Seedlings as Measured in Situ with a Novel Xylem pH Probe. Plant Physiol. 2004, 136, 3469–3477. [Google Scholar] [CrossRef] [PubMed] [Green Version]
  83. Zhao, D.-J.; Chen, Y.; Wang, Z.-Y.; Xue, L.; Mao, T.-L.; Liu, Y.-M.; Wang, Z.-Y.; Huang, L. High-resolution non-contact measurement of the electrical activity of plants in situ using optical recording. Sci. Rep. 2015, 5, 13425. [Google Scholar] [CrossRef] [PubMed] [Green Version]
  84. Wilkinson, S. PH as a stress signal. Plant Growth Regul. 1999, 29, 87–99. [Google Scholar] [CrossRef]
  85. Sukhov, V.; Surova, L.; Sherstneva, O.; Katicheva, L.; Vodeneev, V. Variation potential influence on photosynthetic cyclic electron flow in pea. Front. Plant Sci. 2015, 5, 766. [Google Scholar] [CrossRef] [PubMed] [Green Version]
  86. Vodeneev, V.A.; Akinchits, E.K.; Orlova, L.A.; Sukhov, V.S. The role of Ca2+, H+, and Cl ions in generation of variation potential in pumpkin plants. Russ. J. Plant Physiol. 2011, 58, 974–981. [Google Scholar] [CrossRef]
  87. Sherstneva, O.N.; Vodeneev, V.; Katicheva, L.A.; Surova, L.M.; Sukhov, V. Participation of intracellular and extracellular pH changes in photosynthetic response development induced by variation potential in pumpkin seedlings. Biochemistry (Moscow) 2015, 80, 776–784. [Google Scholar] [CrossRef]
  88. Sukhov, V.; Surova, L.; Morozova, E.; Sherstneva, O.; Vodeneev, V. Changes in H+-ATP Synthase Activity, Proton Electrochemical Gradient, and pH in Pea Chloroplast Can Be Connected with Variation Potential. Front. Plant Sci. 2016, 7, 1092. [Google Scholar] [CrossRef] [Green Version]
  89. Kader, M.A.; Lindberg, S. Cytosolic calcium and pH signaling in plants under salinity stress. Plant Signal. Behav. 2010, 5, 233–238. [Google Scholar] [CrossRef] [Green Version]
  90. Westphal, L.; Strehmel, N.; Eschen-Lippold, L.; Bauer, N.; Westermann, B.; Rosahl, S.; Scheel, D.; Lee, J. pH effects on plant calcium fluxes: Lessons from acidification-mediated calcium elevation induced by the γ-glutamyl-leucine dipeptide identified from Phytophthora infestans. Sci. Rep. 2019, 9, 4733. [Google Scholar] [CrossRef]
Figure 1. The presence of the Pt-GFP gene in different plantlets of transformed potatoes. The primers for the PCR were selected for a 464 bp fragment of the Pt-GFP gene. M—markers of pART-Pt-GFP, (C+)—positive control using a cloning binary vector, mQ (C−)—negative control, NKM—transformants obtained by potatoes of the Nevsky variety transformation, Nevsky (non-tr)—untransformed plants of the Nevsky variety.
Agriculture 11 01131 g001
Figure 2. Analysis of the Pt-GFP presence in the stem cells of potato plants (bar 20 μm): (A) CLSM-images of cells of the transgenic and non-transgenic potato plants were obtained at λex = 405 nm, λex = 488 nm and λem = 505–525 nm, transillumination images are also shown; (B) The fluorescence emission spectra were obtained at λex = 405 nm and λex = 488 nm.
Agriculture 11 01131 g002
Figure 3. CLSM-images of various tissues and organs of potato plants with Pt-GFP sensor (bar 50 μm). λex = 488 nm and λem = 505–525 nm.
Agriculture 11 01131 g003
Figure 4. In-vivo calibration of the Pt-GFP sensor in a potato leaf using a full-scale fluorescence imaging system. F490/F395 is the ratio of the fluorescence intensity of the Pt-GFP sensor when excited at wavelengths of 490 and 395 nm, with a registration of fluorescence at 535/43 nm. The leaf was incubated in a solution with an appropriate pH value in the presence of the CCCP protonophore. Data are represented as mean ± SD (n = 5).
Agriculture 11 01131 g004
Figure 5. Fluorescence of purified Pt-GFP at different temperatures: (A) Fluorescence spectra at pH 5.0; (B) Fluorescence spectra at pH 7.4 (λex = 395 nm (green dotted lines), λex = 480 nm (green solid lines) and λem = 500–600 nm); (C) Excitation spectra at pH 5.0; (D) Excitation spectra at pH 7.4 (λex = 330–510 nm and λem = 530 nm); (E) Temperature dependence of F480/F395 ratio at pH 5.0 (red line) and pH 7.4 (blue line).
Agriculture 11 01131 g005
Figure 6. Cold-induced changes in pH and electrical potential (V) of potato leaf cells: (A) The scheme of the leaf (not detached from the plant) location and the position of the pH and V registration areas; (B) The effect of cooling of various degrees on the pH of the cytoplasm of cells (green line) and electrical potential (black line) in two areas indicated in scheme A (blue line indicates the change in leaf temperature, yellow stripes indicate the operating time of the Peltier device); Amplitudes of changes in pH (C) and electrical potential (D) at different degrees of cooling. Data are represented as mean ± SD (n = 5–7).
Agriculture 11 01131 g006
Figure 7. Heat-induced changes in pH and electrical potential (V) of potato leaf cells: (A) The scheme of the leaf (not detached from the plant) location and the position of the pH and V registration areas; (B) The effect of heating of various degrees on the pH of the cytoplasm of cells (green line) and electrical potential (black line) in two areas indicated in scheme A (red line indicates the change in leaf temperature, yellow stripes indicate the operating time of the Peltier device); (C) A diagram showing the determination of the amplitudes Δ1 (change in pH or V relative to the their level before stimulation) and Δ2 (change in pH or V between the initial level (before stimulation) and the level after stimulation) of multidirectional changes in pH or V (gray line), induced by heating (red line); Amplitudes of changes in pH (D) and V (E) at different degrees of heating. Data are represented as mean ± SD (n = 5–7).
Agriculture 11 01131 g007
Figure 8. Effect of local heating of the tip of a potato leaf on changes in pH and electrical potential (V) in unstimulated areas of a potato leaf: (A) The scheme of location of the heating resistor and the position of the pH and V registration areas; (B) Change in leaf temperature caused by heating the resistor to 52 °C for 4 min; (C) Induced by local heating changes in pH (green line) and electrical potential (black line) in the unstimulated area of potato leaf (red line indicates the temperature change, yellow stripes indicate the operating time of the heating resistor). Data are represented as mean ± SD (n = 5–7).
Agriculture 11 01131 g008
Figure 9. Effect of sodium orthovanadate (Na3VO4) treatment on changes in pH and electrical potential (V) in potato leaf cells: (A) The effect of Na3SO4 (solid green line) and standard solution (dotted green line) addition (black arrow) on pHcyt of potato leaf pieces; (B) The effect of Na3VO4 (solid lines) and standard solution (dotted lines) oh pHcyt and V changes under cooling and heating (blue line indicates the temperature change, yellow stripes indicate the operating time of the Peltier device); Cooling- and heating-induced changes in pH (C) and electrical potential (D) of leaves treated with sodium orthovanadate expressed as a percentage of the level of pH and V of the leaves treated with standard solution. Data are represented as mean ± SD (n = 7).
Agriculture 11 01131 g009
Publisher’s Note: MDPI stays neutral with regard to jurisdictional claims in published maps and institutional affiliations.

