Article

Predicting Possible Distribution of Tea (Camellia sinensis L.) under Climate Change Scenarios Using MaxEnt Model in China

Institute of Environment and Sustainable Development in Agriculture, Chinese Academy of Agricultural Sciences (CAAS), 12 Zhongguancun South Str., Beijing 100081, China
*
Author to whom correspondence should be addressed.
Agriculture 2021, 11(11), 1122; https://doi.org/10.3390/agriculture11111122
Submission received: 26 September 2021 / Revised: 21 October 2021 / Accepted: 4 November 2021 / Published: 10 November 2021
(This article belongs to the Section Ecosystem, Environment and Climate Change in Agriculture)

Abstract

:
Climate change has dramatic impacts on the growth and the geographical distribution of tea (Camellia sinensis L.). Assessing the potential distribution of tea will help decision makers to formulate appropriate adaptation measures to use the altered climatic resources and avoid the damage from climate hazards. The objective in this study is to model the current and future distribution of tea species based on the four SSPs scenarios using the MaxEnt model in China. For the modeling procedure, tea growth records in 410 sites and 9 climate variables were used in this paper. The area under the receiver operating characteristic (ROC) curve (AUC) was used to evaluate the performance of the model. The AUC value was over 0.9 in this study, showing the excellent simulation result of the model. In relation to the current distribution, areas of 82.01 × 10⁴ km2 (8.51% of total land area in China), 115.97 × 10⁴ km2 (12.03% of total land area in China), and 67.14 × 10⁴ km2 (6.97% of total land area in China) were recognized as Marginal, Medium, and Optimal climate suitable habitats for tea over China. Compared to the current distribution, most of the Optimal suitability areas in southeast China would be lost in four scenarios. The area of Marginal and Medium suitable habitats would expand in SSP370 and SSP585, especially in 2041–2061 and 2081–2100. The suitable area of tea would expand northwards and westwards, suggesting that additional new suitable habitats could be created for tea production with the future climate change, especially in Shandong, Henan, Guizhou, and Yunnan Provinces. This research would provide vital scientific understanding for policy making on tea production, tea garden site chosen and adopyion of adaptation methods in the future.

1. Introduction

Global climate change is happening at an unprecedented speed, which is partially accelerated by human activities. The evidence is shown from the IPCC (Intergovernmental Panel on Climate Change) report that temperature of global surface in 2011–2020 was 1.09 °C higher than 1850–1900, with larger increases over land (1.59 °C) than over the ocean (0.88 °C) [1]. In China, the annual average temperature increased at a rate of about 0.15 °C/10 years from 1901 to 2020, and the warming trend was more obvious in 1951–2020 with the rate of 0.26 °C/10 years. The past 20 years have been the warmest period since 1900, which had a profound impact on biodiversity, species distribution, community composition, vegetation pattern, ecosystem structure, function, and service [2].
Tea (Camellia sinensis L.) is widely distributed in tropical and subtropical mountainous areas over 50 countries and regions all over the world [3]. In China, the long history of tea cultivation and suitable environment provide favorable conditions for tea production, the yield and area of tea have been rising continuously and the tea industry has been booming in recent years [4]. As a green cash crop, the successful cultivation of tea is highly dependent on climate conditions, including moderate temperature, rainfall, solar radiation and so on [5,6,7]. Han et al. [8] found that tea yield will decrease by 11% to 35% due to extreme weather events, which may cause the fluctuations of tea prices. Meanwhile, the suitable area can be influenced in some provinces by climate warming. Jin et al. [9] demonstrated that the climate suitability of tea decreased significantly in the 1970s and increased obviously after the 1990s in Zhejiang Province because of the climate change. From 1981 to 2013, the suitability of main tea producing areas in Fujian Province showed a downward trend, and the decline in coastal counties was greater than that in mountainous counties [10]. On the contrary, tea planting suitability increased in the north production region, leading to the northern movement of tea production boundary in China due to the warming [4]. From 1961 to 2019, the limit of the suitable tea plant area in the eastern provinces in China moved obviously to north mountainous areas [11]. At present, the research on tea suitable areas is scattered, and the research contents are mostly based on the previous climate conditions. Future climate change may have a negative impact on the distribution areas of tea in China, but the research on the suitable regional distribution of tea at a national perspective is still relatively lacking.
In the future, the productivity and sustainability of tea gardens could be affected by the rising temperature and decreasing rainfall [12]. It has been found that in Sri Lanka, the monthly rainfall reduction of 100 mm would reduce productivity of 30–80 kg “made” tea/ha/month [13], and the change of rainfall also could reduce the labor demand of the whole tea garden sector in this country by about 1,175,000 man-days per year by 2050, which is likely to have considerable social and welfare implications [14]. However, the existing studies seldom investigate the changes of tea species niche in China. The variation of priority areas suitable for tea industry development under climate change is poorly understood. It is necessary to understand the distribution characteristics change of tea species under the climate change and the impact of climate performance on the potential habitats of tea, which could provide support for tea production planning and management. In modeling suitable distribution, species distribution model (SDMs) is often used to simulate species distribution and its ecological requirements based on the existing distribution data and related environmental factors [15]. Over the past decades, numerous SDMs from a range of methods, such as domain environmental envelope (DOMAIN), Ecological Niche Factor Analysis (ENFA) [16], Genetic Algorithm for Rule-set Production (GARP) [17], Artificial Neural Network (ANN) [18], and Maximum Entropy (Maxent), have been developed. The Maximum Entropy (Maxent) model is a density estimation and species distribution model, and it is a selective method based on the maximum entropy theory [19]. This was developed in 2006 and had played critical roles in species reserves planning, prediction of the potential distribution of invasive species, and spatial distribution of plant and animal species [20,21,22]. The model is robust in prediction capability and stability, and it is not affected by sample size and sample deviations [23]. Therefore, the MaxEnt model was chosen to simulate and analyze the distribution of suitable areas of tea species in the future at a national level in China based on new SSPs climate scenario data instead of RCPs. The results are expected to enhance scientific understanding of variation of priority areas suitable for the development of tea industry under climate change.
Studying the current and potential distribution of tea on a large scale can help to understand the dynamic of overall planting patterns under climate change, which could be used to determine the suitable area for tea cultivation in China. The objective of this study was to use the MaxEnt model to map the current potential distribution of tea (Camellia sinensis L.) by the key environmental variables that highly correlate with tea distribution, predict the potential distribution of tea species under future climate change scenarios, and evaluate the effects of climate change on the suitable habitat area of tea, all to identify the change suitable area under future climate change scenarios.

2. Materials and Methods

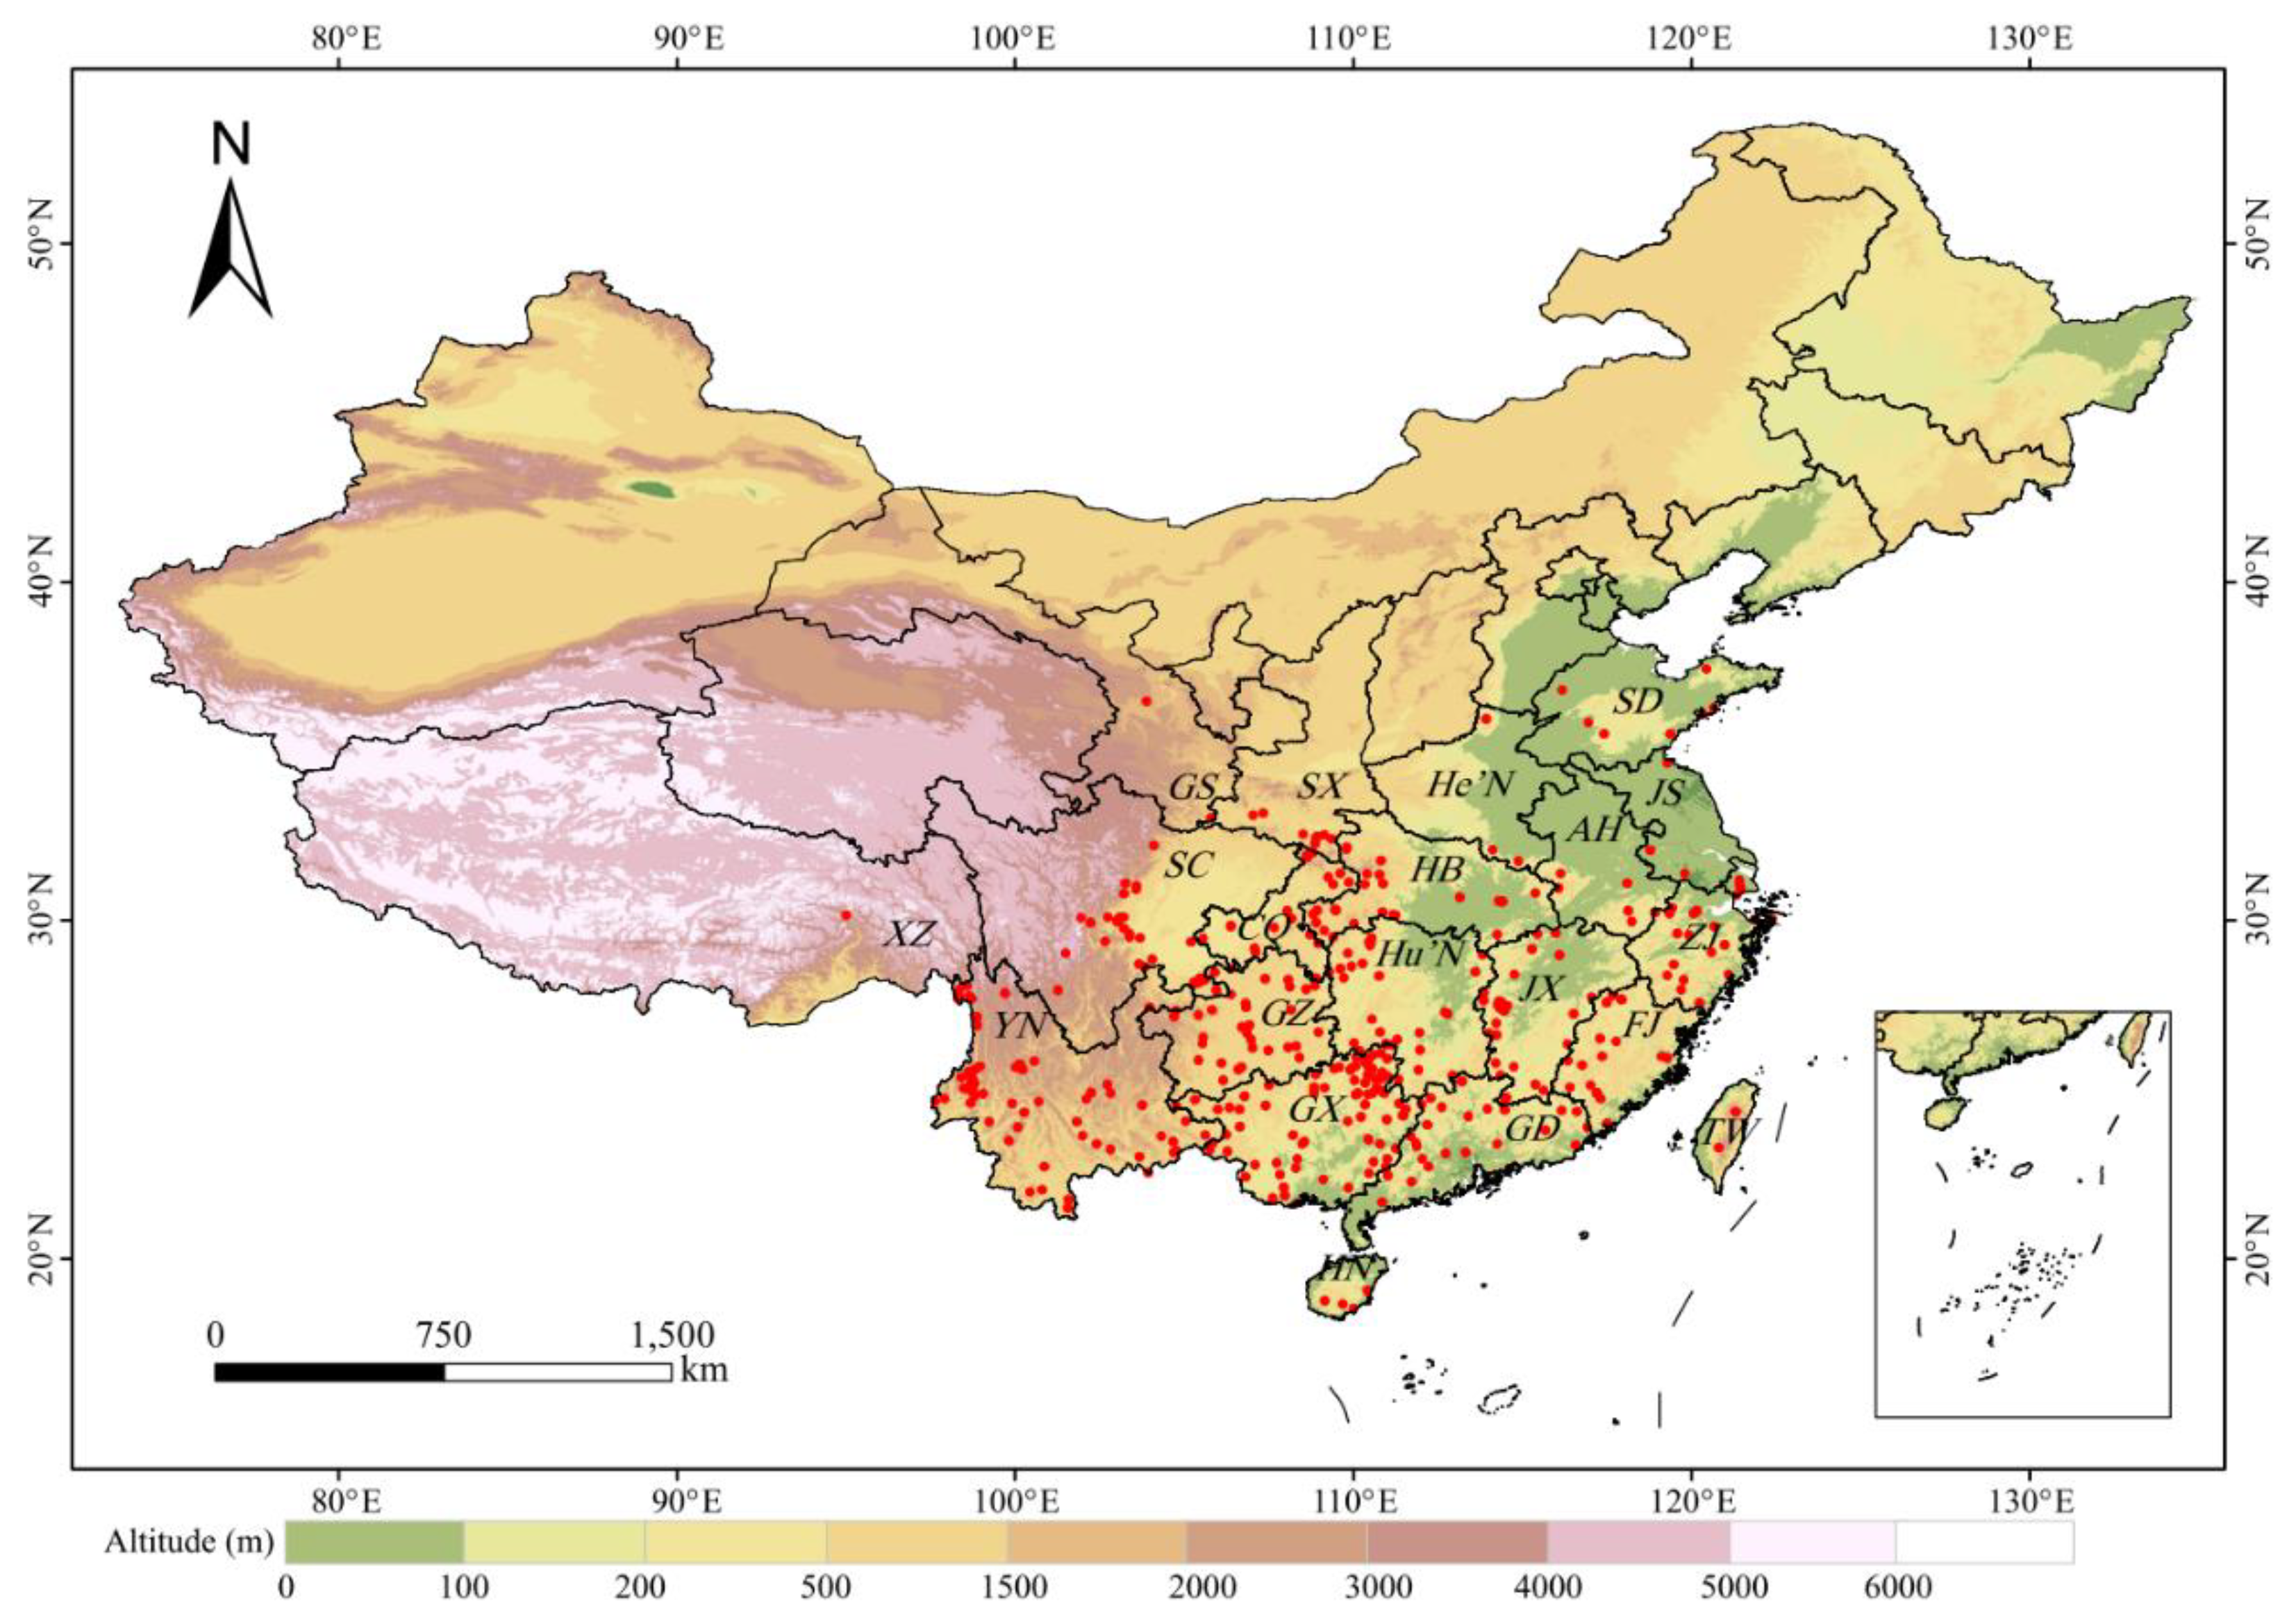
2.1. Species Data of Camellia sinensis

The tea occurrence data in Chinese mainland were collected from databases of Chinese Virtual Herbarium (CVH, http://www.cvh.ac.cn, last accessed on 20 October 2020) and the Global Biodiversity Information Facility (GBIF, http://www.gbif.org, last accessed on 20 October 2020). These two websites provide the most accurate and reliable location information of tea species. In this study, a total of 3921 occurrences data were obtained, out of which 2030 were collected from CVH and 1891 were collected from GBIF. Firstly, the GPS and Coordinate pick up system of Baidu Map (http://api.map.baidu.com/lbsapi/getpoint/index.html) were used to carry out geographic registration on the event records with detailed location information. Then, 2854 incomplete records as well as 657 duplicated entries were removed. Finally, 410 accurate existence points remained (Figure 1). The coordinates of latitude and longitude for each record were stored in an Excel database as “.csv” format with the title “species, longitude, latitude” for MaxEnt model building.

2.2. Bioclimatic Data

Bioclimatic variables are the key factors that determine the distribution of tea varieties [24]. Nineteen bioclimatic variables from WorldClim 2.1 (https://www.worldclim.org/data/cmip6/cmip6_clim2.5m.html, accessed on 20 October 2020) were extracted as environmental data [25]. The new version of 19 bioclimatic variables was released in January 2020 and the data records are from 1970 to 2000 period, which have been widely used to predict the current potential distribution of species in recent research due to the ecological meaning and can reflect the seasonal variation characteristics of temperature and precipitation [26,27]. WorldClim could provide four gridded global climate layers at 10 min, 5 min, 2.5 min, and 30 s in CGS_WGS_1984 projection [28]. Due to the diversity of climatic condition and topography in China in the short term, we chose the spatial resolution of 2.5 min (5 km2) for modeling. The datasets downloaded from WorldClim are in “tiff” format and were converted to ASCII files in ArcGIS by “Raster to ASCII”, for use in MaxEnt software.

2.3. Preprocessing of Bioclimatic Variables

Multicollinearity among variables may lead to over-fitting of the model and misinterpretation of the modeled results [29]. In order to avoid the influence of the cross-correlation of the 19 bioclimatic variables, the contribution rate of each variable was firstly evaluated by the Jackknife test in MaxEnt software version 3.4.1 (https://biodiversityinformatics.amnh.org/open_source/maxent/, accessed on 20 October 2020) with default setting, and then correlation analysis was carried by SPSS software version 22.0 (SPSS, Inc., Chicago, IL, USA) to eliminate the highly correlated variables [30]. If the absolute value of correlation coefficient of two variables was greater than 0.8, only one variable with a greater contribution was selected [31]. At last, the remaining 9 bioclimatic variables (bio2, bio3, bio6, bio7, bio10, bio12, bio14, bio15, and bio18) were selected to simulate the distribution of tea in China under current and future climatic conditions (Table 1, in bold). The change of land use and land cover, human interference, species diffusion and biological interactions were neglected in the modeling.

2.4. Species Distribution Modeling Procedure

In this study, the MaxEnt software [19] was used to model the current and future distribution of tea in China because it has better prediction capabilities and stability that will not be affected by small sample deviations and fewer samples [23,32,33]. The Species data were inputted in the box of Samples, and the Bioclimatic variables were inputted in the box of Environmental layers. The MaxEnt model was run with 10 replicates and 25% of random test percentage, the convergence threshold of 10−5, a maximum number of backgrounds points of 10,000, the maximum iterations as 1000, and a regularization parameter value of 0.5, an auto-feature option, and cloglog output format. Meanwhile, “Create response cures” and “Do Jackknife to measure variable importance” were chosen before running the model. Other values were kept as default [34].
The random test percentage was 25%, which means that 75% of the total database was used as the random sample to train the model, and other 25% of the total database was used to test the model predictions [35]. To avoid over-fitting of the test data, we set the regularization multiplier value as 0.5. The output format was default “cloglog” transform, which has the stronger theoretical justification than the logistic transform [36]. The auto features setting was used in this research based on the number of sample sizes. Phillips and Dudík [37] classified the features for sample sizes: auto features setting for more than 80 records, quadratic and hinge setting for 15–79 record, linear and quadratic for 10–14 record, and linear setting for sample sizes fewer than 10 records [24,38]. The Jackknife test (systematically leaving out each variable) was used to assess the contribution and the importance of each bioclimatic variables to the model [39].

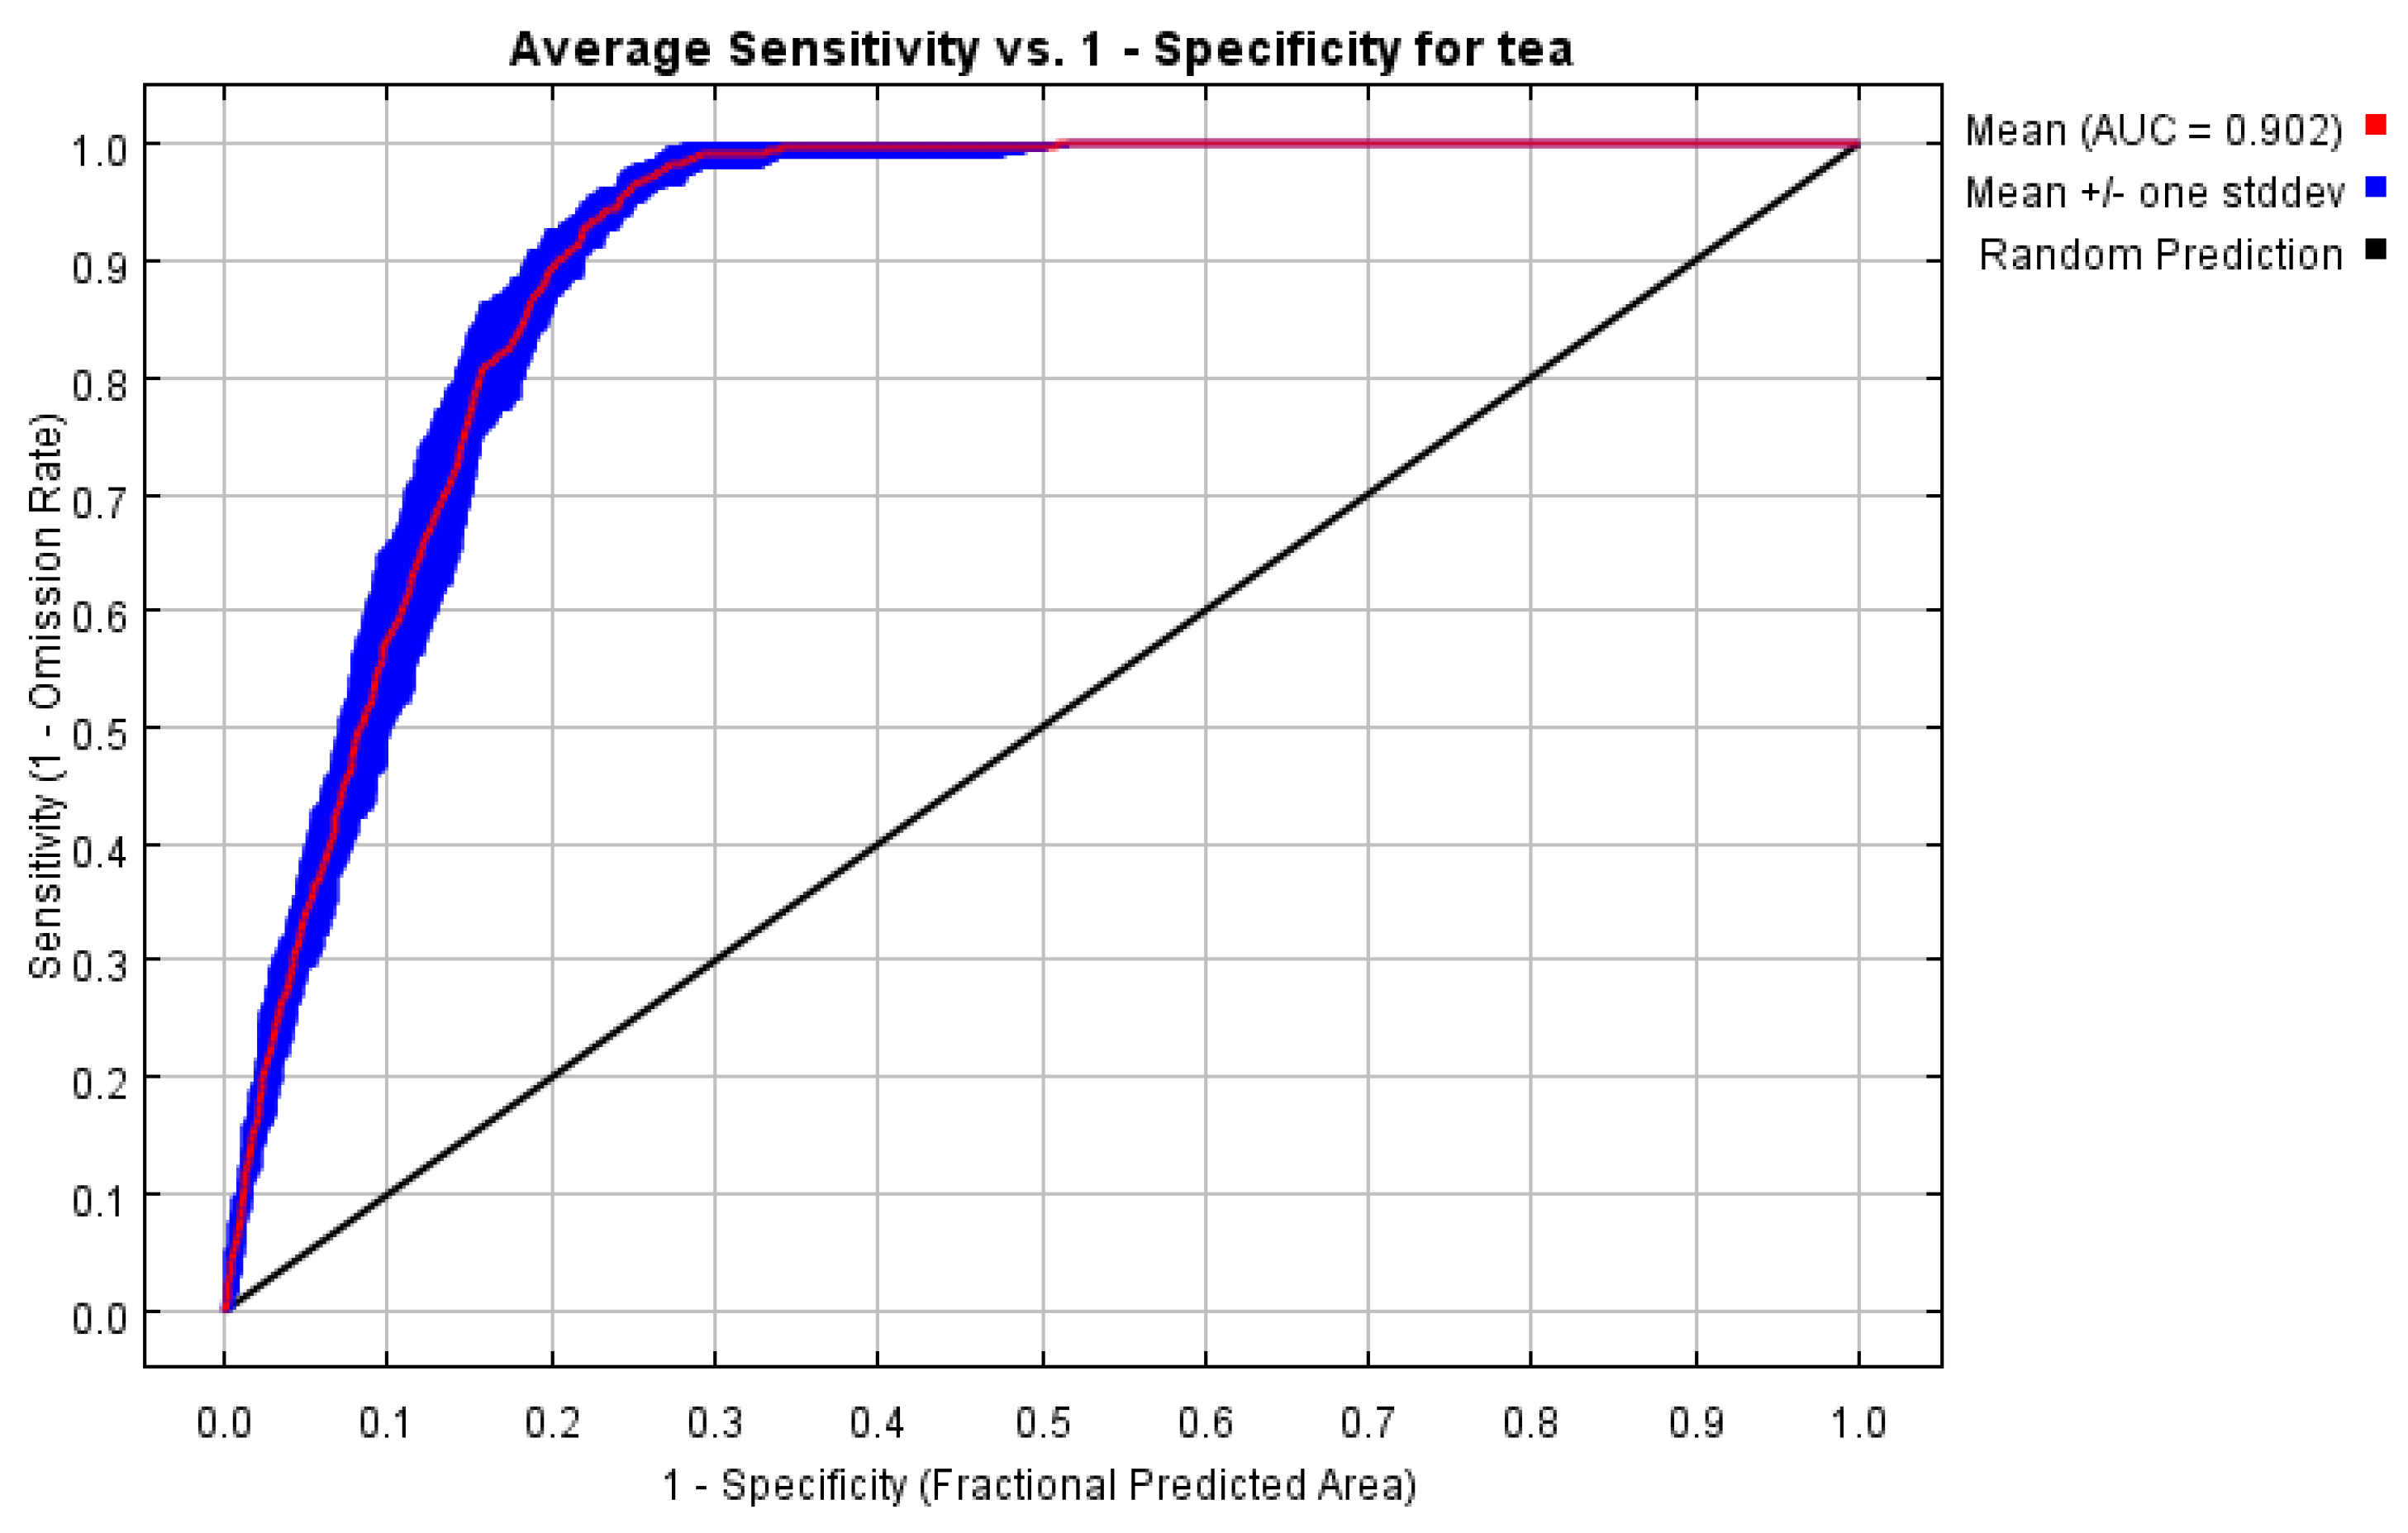
2.5. Evluating the Model Performance

The performance of this model was evaluated based on the computed receiver operating characteristic (ROC) curve and the area under the curve (AUC) [19,23]. Taking the false positive rate (the probability of being predicted as positive without the actual distribution of the species) as the horizontal axis and the true positive rate (the probability of being predicted as positive by species) as the vertical axis, the ROC curve was drawn [40]. The area surrounded by the curve and the horizontal axis was AUC (area under curve) value. In general, AUC values vary from 0.5 to 1, which could be divided into five classes: fail (0.5–0.6), poor (0.6–0.7), fair (0.7–0.8), good (0.8–0.9), and excellent (0.9–1) [41]. The closer the AUC value was to 1, the farther away from the random distribution, the greater the correlation between environmental variables and the predicted geographical distribution of species, and the more accurate the performance of the model, while AUC < 0.5 is a contingency difference, which can be regarded as a stochastic forecasting model, and rarely happens [42].

2.6. Future Spatial Change Detecation

The same nine bioclimatic variables were employed to analyze the future potential distribution of tea from 2040 to 2100. The global climate model, BCC-CSM2-MR (modeling data from the Beijing Climate Center Climate System Model) was used as future simulated climate at four emissions scenarios driven by different socio-economic assumptions named as Shared Socio-economic Pathways (SSPs) 126, 245, 370, and 585 with a 2.5 min spatial resolution, which were downloaded from WorldClim (http://www.ccafs-climate.org) and both available for three time-periods including 2050s (2041–2060), 2070s (2061–2080) and long-term 2090s (2081–2100) [43,44], which can better simulate the temperature and precipitation variables in Asia [45,46]. SSP126 represents the low end of the forced pathways in the future, updating the RCP2.6, and the radiative forcing in 2100 is 2.6 W/m2. SSP245 represents the medium part of the range of future forcing pathways and updates the RCP4.5 pathway. The radiation forcer will be stable at 4.5 W/m2 in 2100. SSP370 represents the medium to high end of the range of future forcing pathways, which the radiation forcing will stabilize at 7.0 W/m2 in 2100. SSP585 represents the high end of the range of future pathways, updating the RCP8.5 pathways, and its emissions are high enough to generate a radiative forcing of 8.5 W/m2 in 2100 [47].
After modeling the species distribution, the spatial changes were calculated for the future compared to the current by in ArcGIS 10 software. The prediction results of current and future were imported into ArcGIS by ASCII to raster” and reclassified as Unsuitable habitat (0–5%), Marginal suitable habitat (5–33%), Medium suitable habitat (33–67%), and Optimal suitable habitat (67–100%) [48,49]. In order to compare the future and current area variation and distributions, Unsuitable habitat, Marginal suitable habitat, Medium suitable habitat, and Optimal suitable habitat was further reclassified as 0, 1, 2, 3 and 4, and the current results layer was subtracted from the future results by the “subtraction” tool in Arctoolbox [50]. Area calculation of the suitable habitat and the subtraction result were carried out in ArcGIS 10.

3. Results

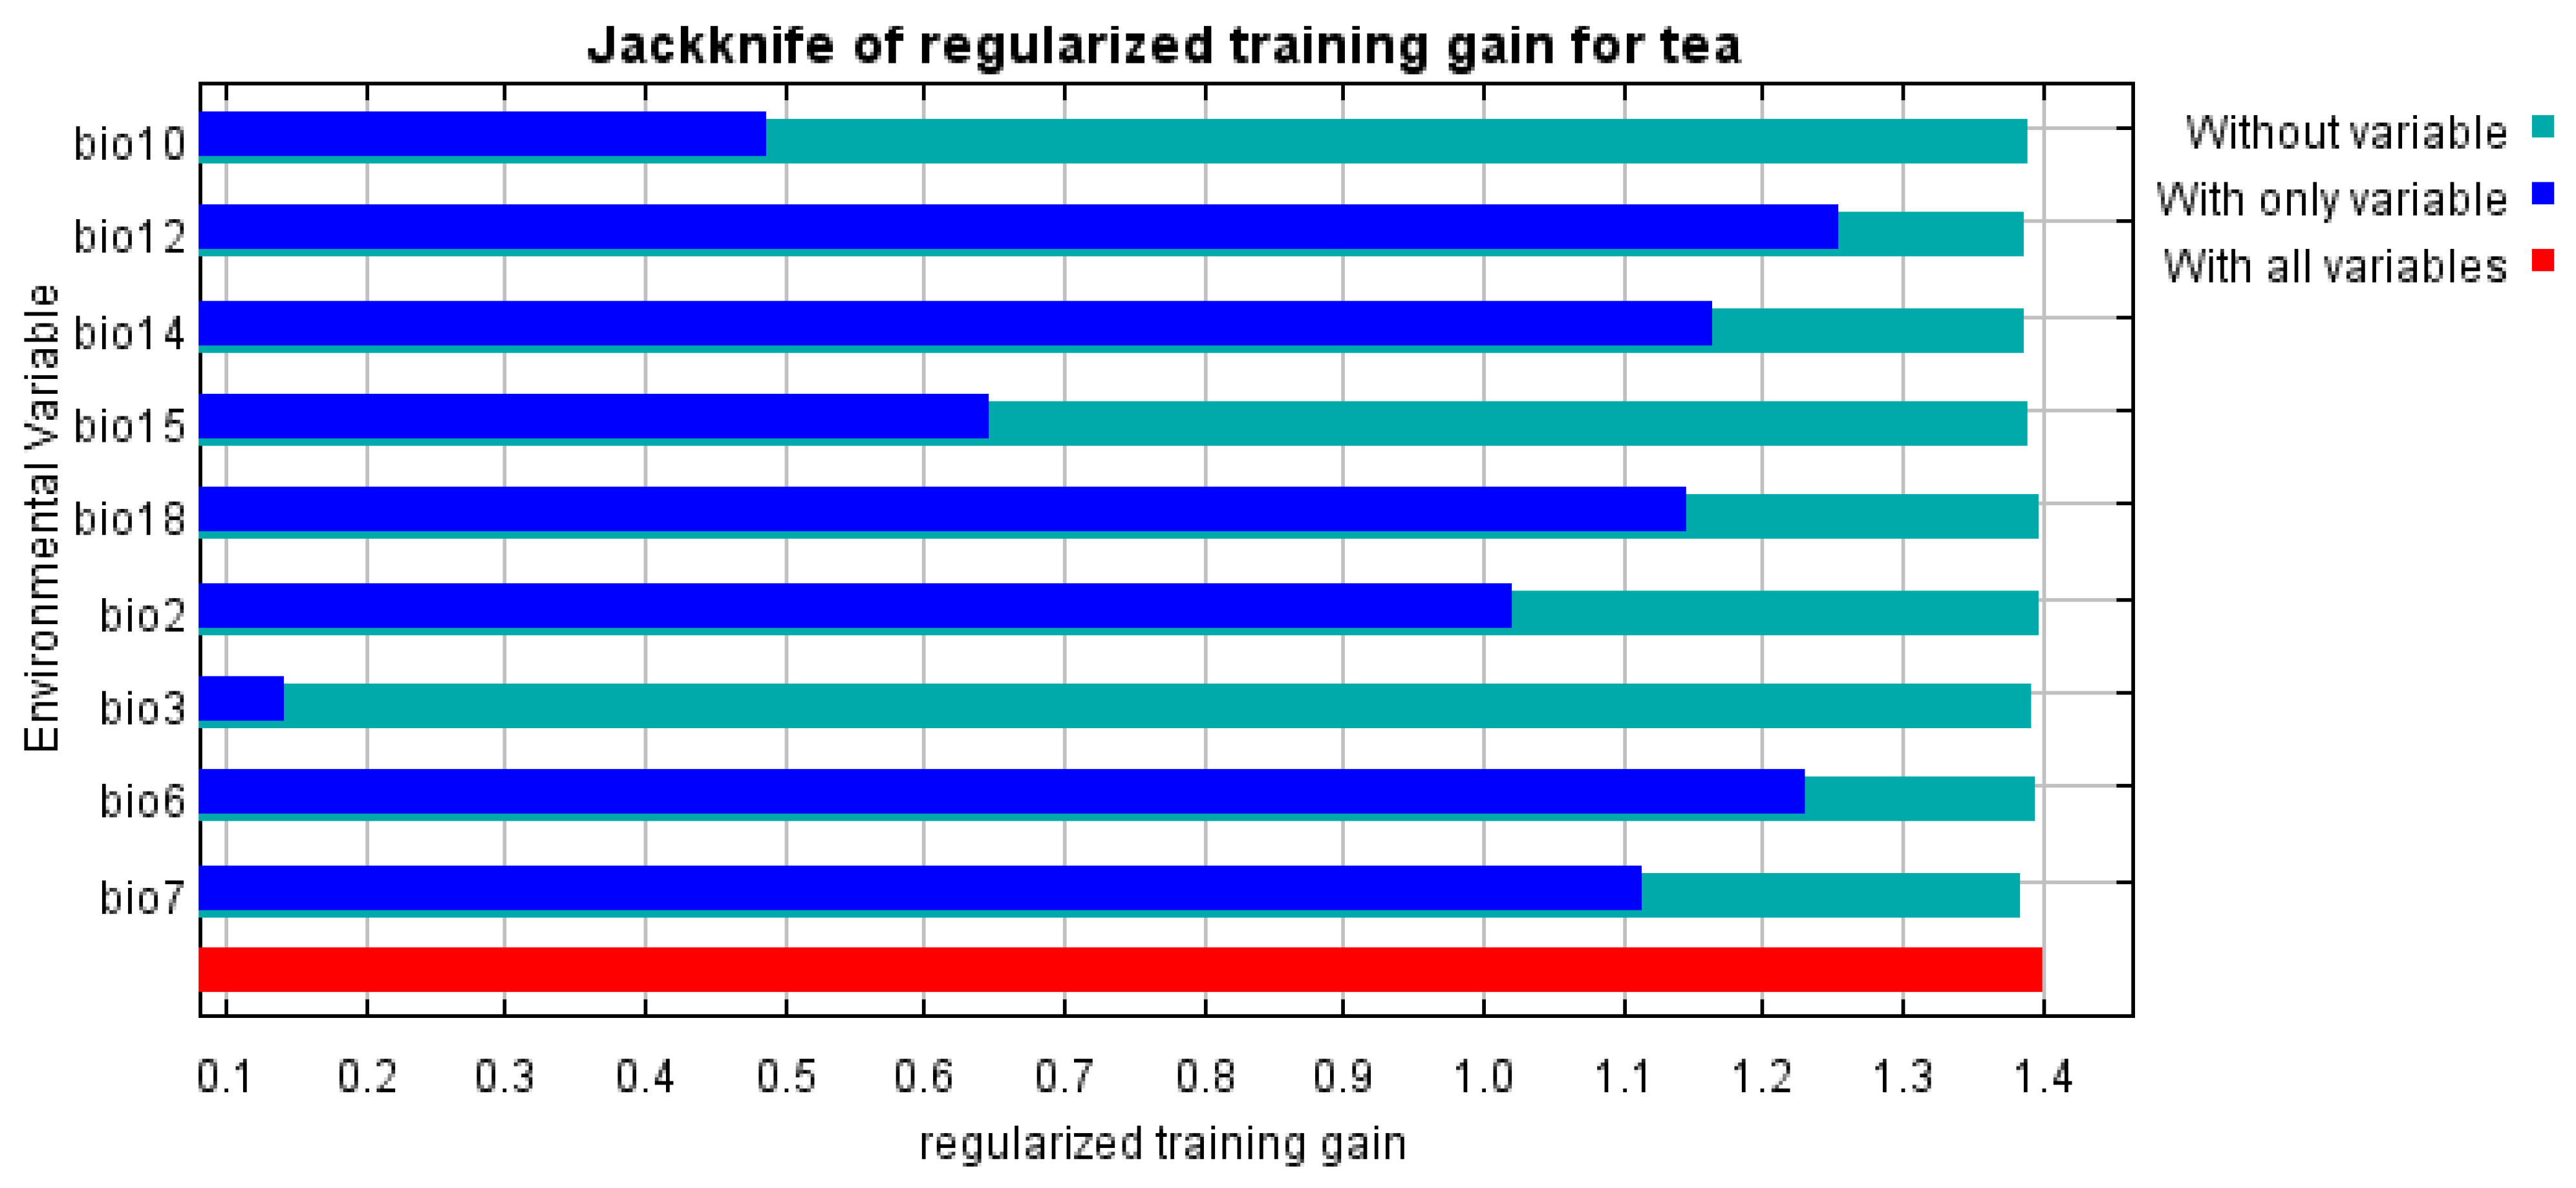
3.1. Model Performance and Variable Contributions

The average AUC value of the test data and training data in this study was 0.902 (Figure 2), indicating that this model performs excellent in modeling tea distribution in China. It is worth noting that the AUC values tend to be lower for species with wide distribution range [51,52].
The importance of the permutation of the predictor variables to the MaxEnt model are shown in Table 2. Among the input environmental variables, Temperature Annual Range (bio7) was most influential and contributed 51% to this model. Precipitation of Warmest Quarter (bio18) was the second most important variable with the permutation importance of 14%, followed by Min Temperature of Coldest Month (bio6) (9.7%) and Mean Temperature of Warmest Quarter (bio10) (8.9%). Precipitation of Driest Month (bio14) and Mean Diurnal Range (bio2) accounted for 4.9% and 4.2%. Annual Precipitation (bio12) and Precipitation Seasonality (bio15) had the smaller influence on the habitat model, which was 3.7% and 2.9%, respectively. Isothermality (bio3) only contributed 0.7%, which was the lowest contribution, as shown in Table 2. Meanwhile, the percent contributions of the environmental variables showed that Precipitation of Driest Month (bio14) had the greatest impact of 63.9% followed by Annual Precipitation (bio12) of 18.9%, while Temperature Annual Range (bio7) contributed 4.5%, and the lowest was Precipitation of Warmest Quarter (bio18), 0.3%.
An individual variable with highest training gain in Jackknife test means that it was the most significant bioclimatic variable with more contribution or information to species habitat distributions [53]. The results showed that the Annual Precipitation (bio12) and Min Temperature of Coldest Month (bio6) provided very high gains (>1.2) when used independently (Figure 3), indicating that bio12 and bio6 contained more useful information by themselves than the other variables did, and more sensitive to Camellia sinensis habitats suitability. Precipitation of Driest Month (bio14), Precipitation of Warmest Quarter (bio18), Mean Diurnal Range (bio2), and Temperature Annual Range (bio7) had moderate gain when used independently. Other variables such as Mean Temperature of Warmest Quarter (bio10), Precipitation Seasonality (bio15), and Isothermality (bio3), had low gains with few information when used in isolation.

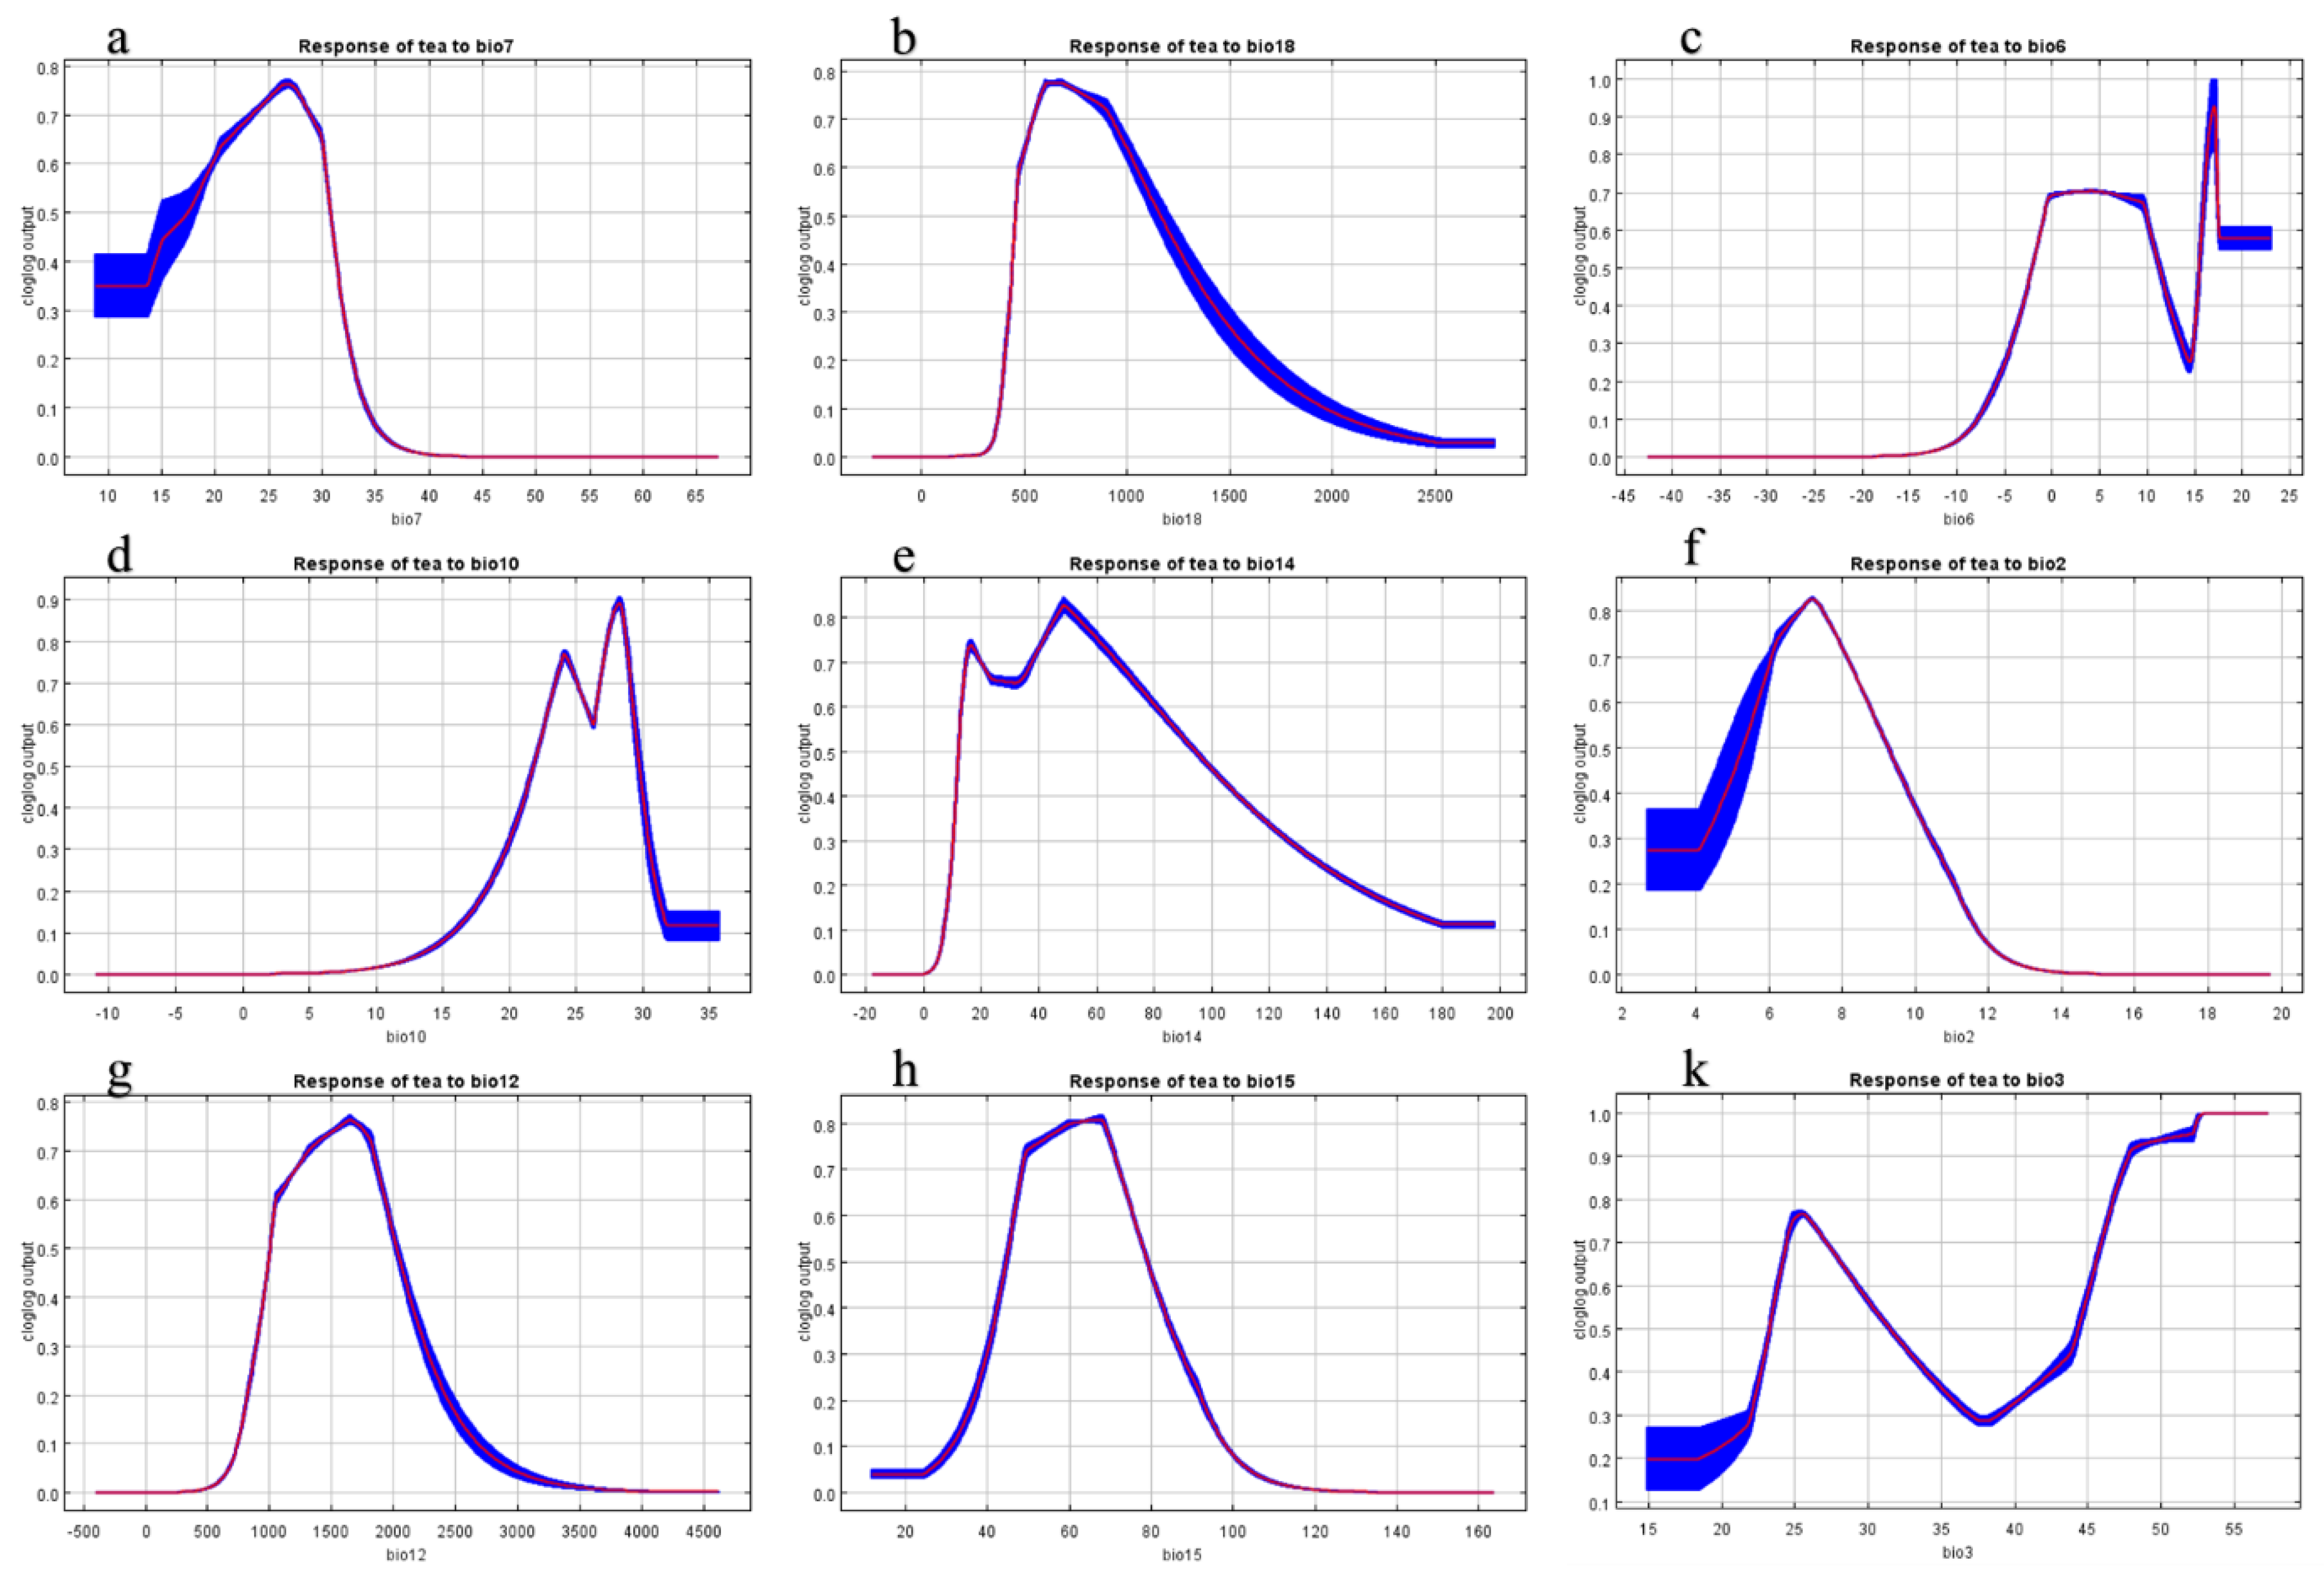
3.2. Variable Response Curves

The quantitative relationship between environmental variables and the logical probability of existence (also known as habitat suitability) is shown as the response curves in Figure 4, which could deepen the understanding of the species niche. Based on the results of the Jackknife test, each environmental factor was selected for modeling to reveal the climate characteristics’ impacts on tea suitable distribution area. According to the response curve of Temperature Annual Range (bio7), the probability of tea occurrence was lower than 26 °C (Figure 4a). The suitable range of Precipitation of Warmest Quarter (bio18) was from 500 to 900mm with a peak at 600mm (Figure 4b). The response curve of Min Temperature of Coldest Month (bio6) showed that habitat suitability of tea is associated with areas where the optimal temperature ranged over 0 °C, but it has a fluctuant range at 10 to 16 °C (Figure 4c). The response curve of Mean Temperature of Warmest Quarter (bio10) indicated that 27 °C would be conducive for the development of tea in Warmest Quarter (Figure 4d). The response curve of Precipitation of Driest Month (bio14) demonstrated that there was a wide range of precipitation from 17 to 180 mm to adapt to the tea habitat, and it reaches the peak at 48 mm (Figure 4e). The highest suitability of Mean Diurnal Range (bio2) was 7 °C, with the decreasing trend beyond 7 °C (Figure 4f). The response curve of Annual Precipitation (bio12) showed that tea prefers precipitation between 1300 and 1800 mm (Figure 4g). Precipitation Seasonality (bio15) is calculated from the ratio of the standard deviation between monthly total precipitation and monthly average total precipitation, indicating that the seasonal value of the highest precipitation of tea was about 70, and habitat suitability decreased with the increase of variation (Figure 4h). Based on the response curves of Isothermality (bio3), the highest suitability for tea occurred in the areas where bio3 was from 25 to 36, and over 45 (Figure 4k). However, the effects of bio15 and bio3 on the model performance are less important than other variables because of the low value of percent contribution and permutation importance (Table 2).

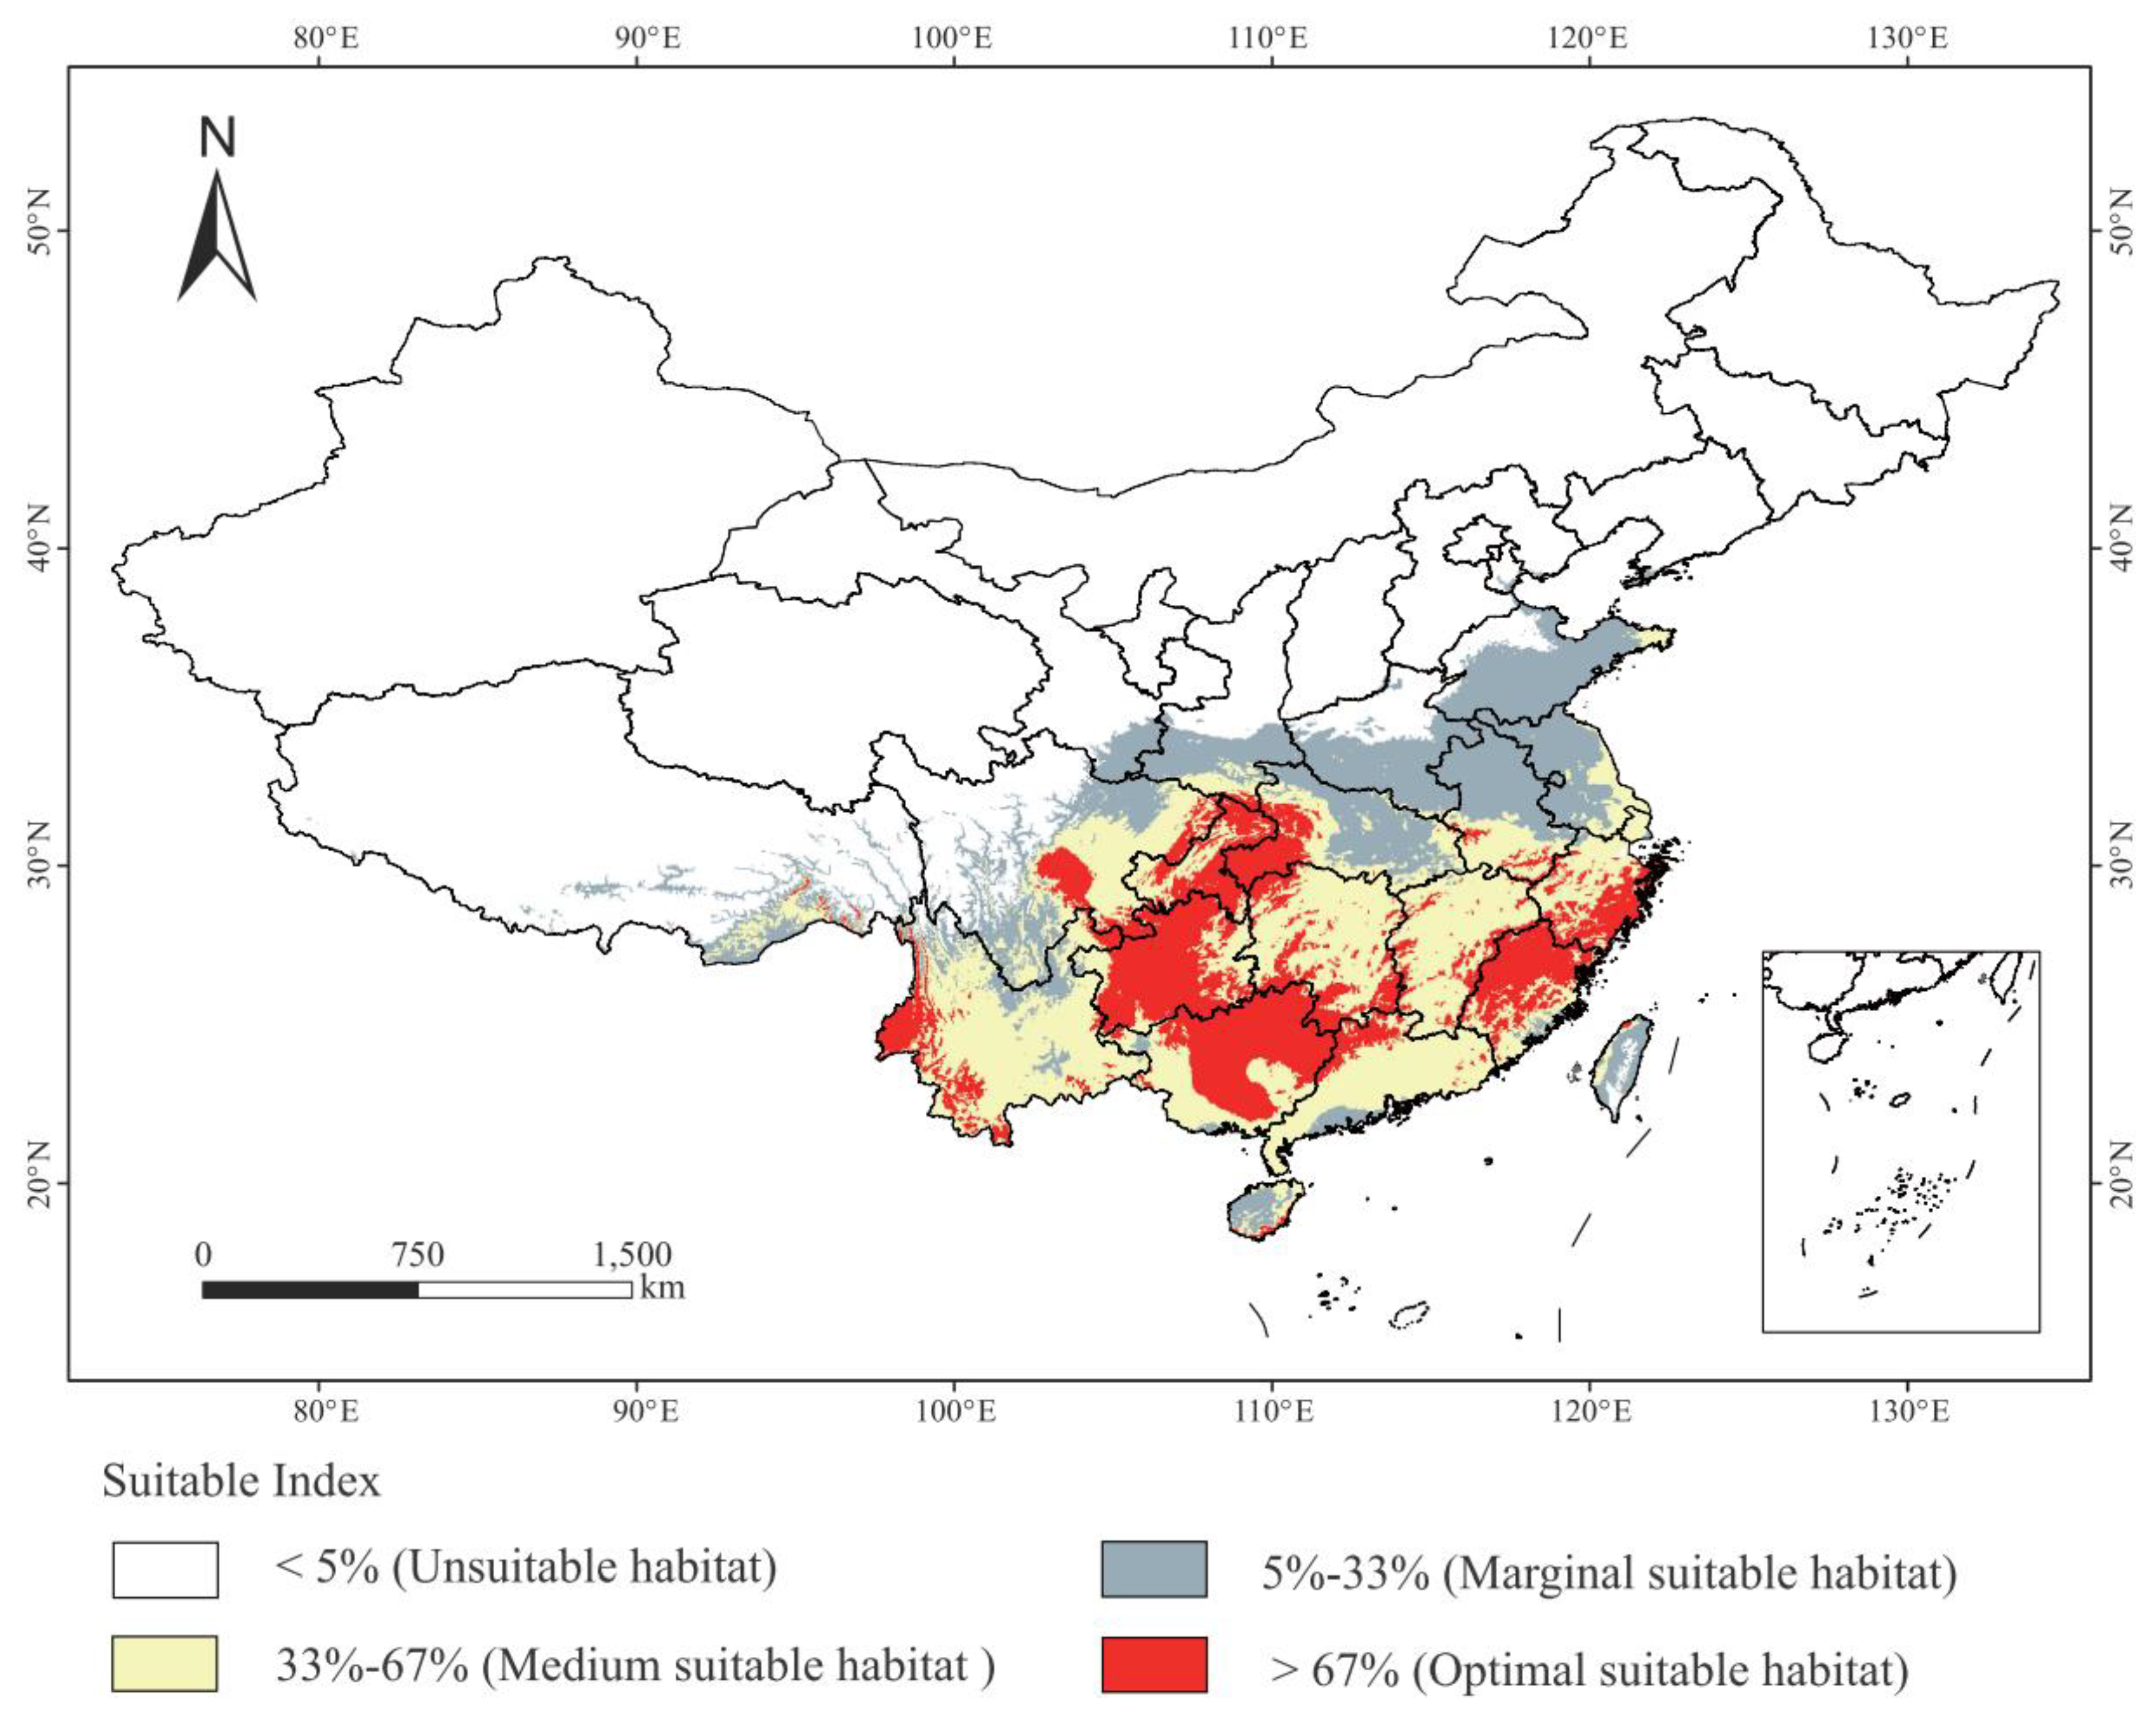
3.3. Simulated the Distribution of Suitable Habitats in Current Climate Condition

Based on the current bioclimate variables and tea distribution records, a climatically suitable habitat map was created by ArcGIS 10 (Figure 5). The result shows that the area from latitude 18° N to 39° N and from 93° E to 122° E was the primary potential suitable region of tea in China. The suitable habitats (including Marginal, Medium, and Optimal suitable habitat) accounted for approximately 26.89% (259.15 × 10⁴ km2) of the total land area, primarily located in 20 provinces or autonomous regions: Hainan, Yunnan, Guizhou, Guangdong, Guangxi, Fujian, Zhejiang, Hubei, Hunan, Jiangxi, Anhui, Chongqing, Jiangsu, Taiwan, central and southeast of Sichuan, southeast of Gansu, central and eastern Shandong, Southern Shaanxi, central and southern Henan, and southeast of Tibet. The Optimal suitable habitat for tea was remarkably located in central and southeast China, and accounted for approximately 8.25% (79.49 × 10⁴ km2) (Table S1) of the total land area, including the provinces of Chongqing, Guizhou, Guangxi, north of Guangdong, south of Zhejiang, northwest of Fujian, southwest of Yunnan, southeast of Sichuan, and southwest of Hubei, which was mainly located in the mountainous areas of east and southwest Yun-Gui Plateau, and hills of the southeast coast of China. The Medium suitable habitat accounted for 11.22% (108.15 × 10⁴ km2) of the total land area, including Hunan, southern Guangdong, central and eastern Yunnan, southern Anhui, eastern Hubei and Sichuan. Meanwhile, the area of Marginal suitable habitat was lower than that of Medium and Optimal, consisting of 7.42% (71.51 × 10⁴ km2) of the total land area, mainly located at southeast of Gansu, central and eastern Shandong, southern Shaanxi, central and southern Henan and some small regions of south Tibet and south Sichuan.

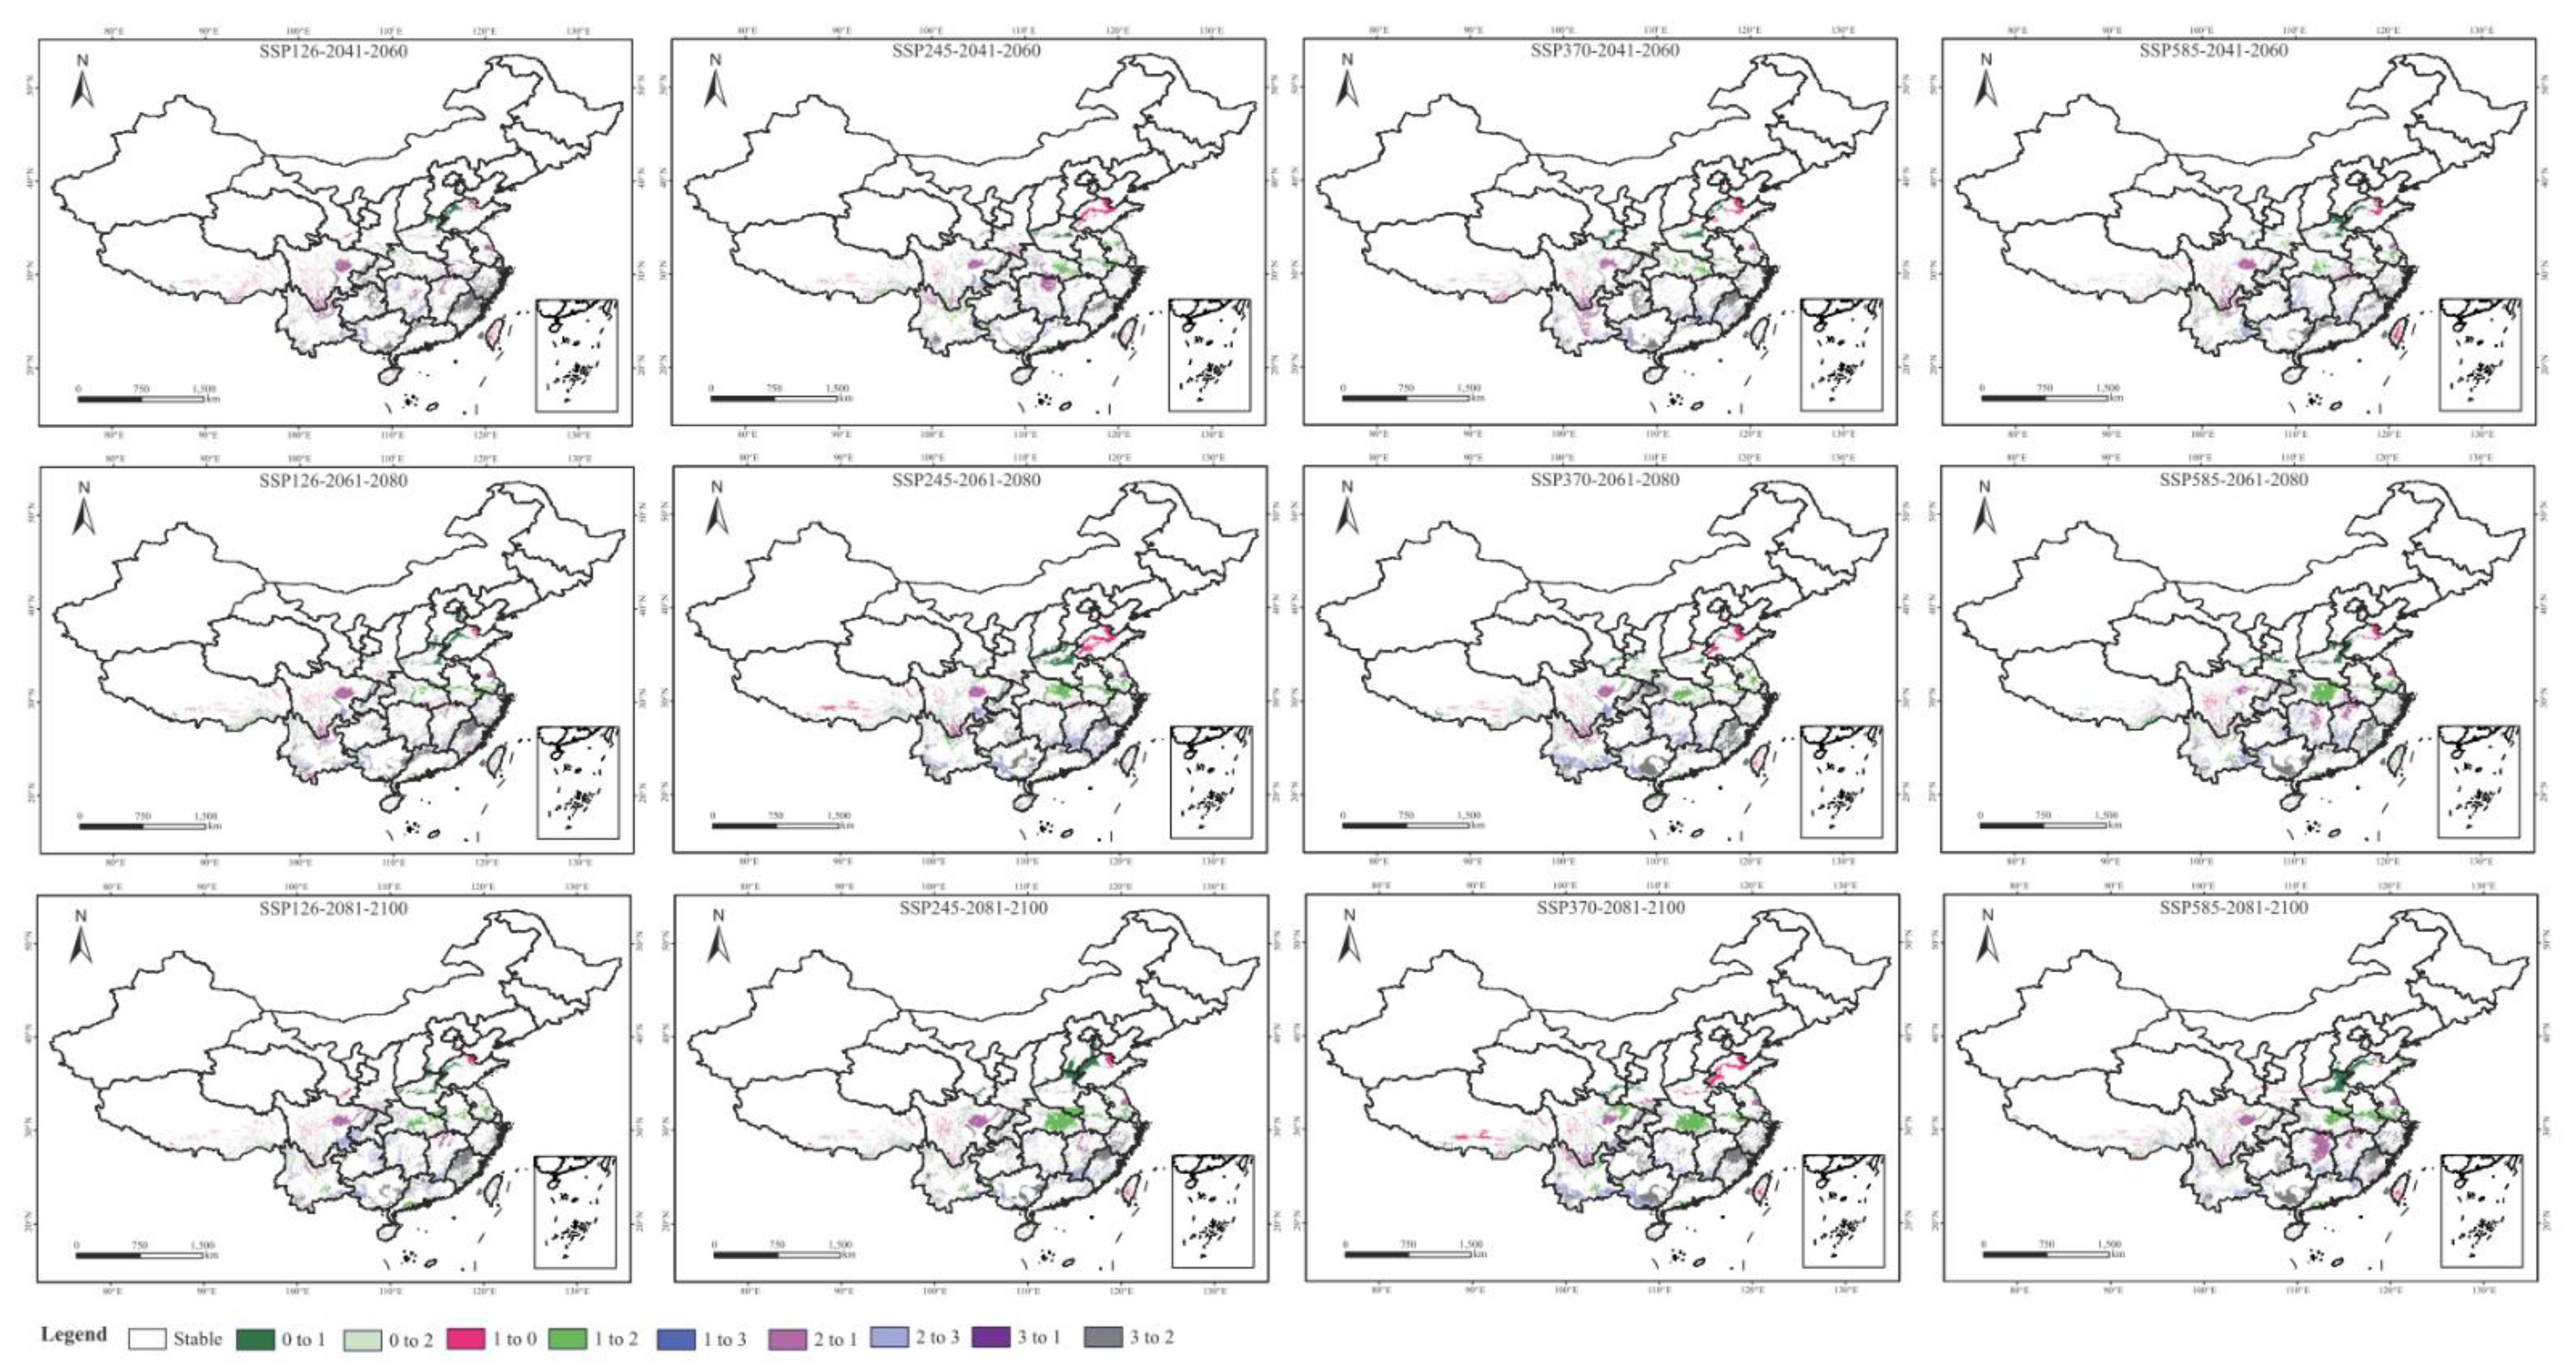
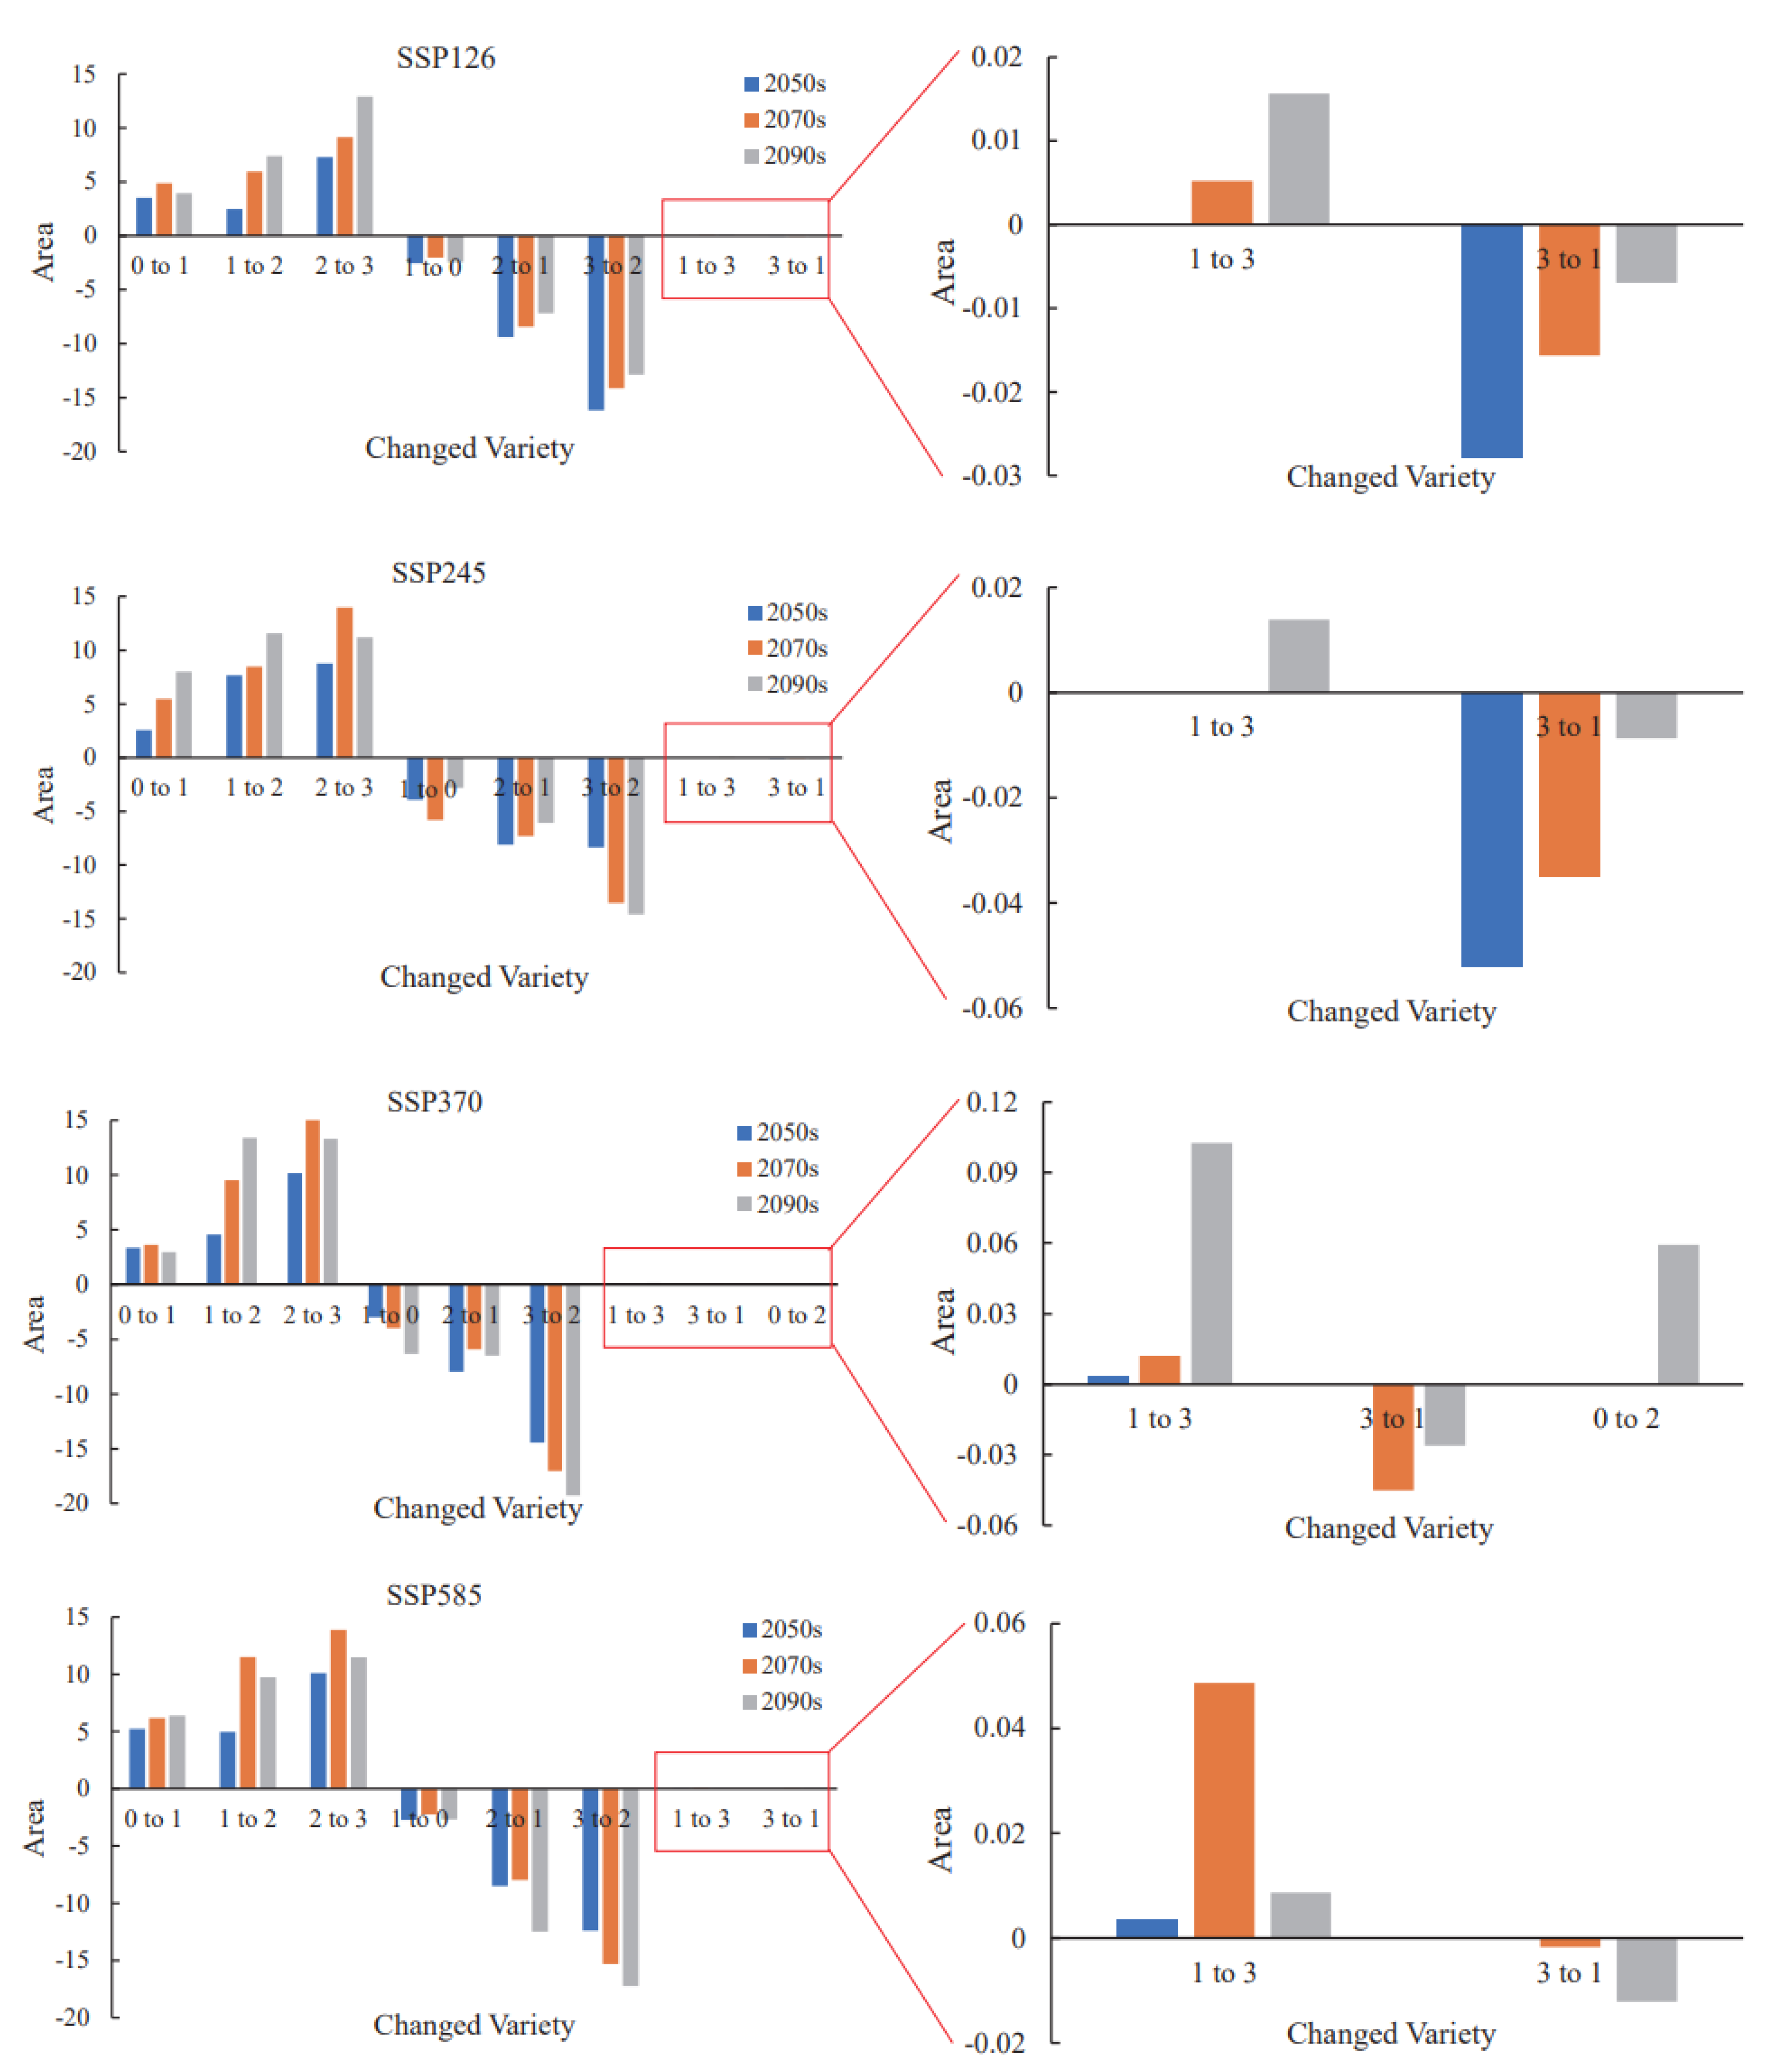
3.4. Changes in the Spatial Distribution of Habitats Suitability in the Future

Using the same classification standard in Figure 5, the future habitats suitability for tea can be divided into four classes (Figure S1). The distribution of suitable habitats category code is mapped in Figure 6 by comparing the current and future climate conditions under SSP126, 245, 370, and 585 for the years 2050s (2041–2060), 2070s (2061–2080), and 2090s (2081–2100). The category code “0” indicates Unsuitable habitat, “1” indicates Marginal suitable habitat, “2” indicates Medium suitable habitat, and “3” indicates Optimal suitable habitat. The regions with increased suitability in the future will mainly be located in the central and eastern Hubei Province, southern Anhui and Jiangsu Provinces, southern Yunnan Province, and northern Shandong and Henan Provinces. Under the current climatic conditions, these regions are in the Marginal or even Unsuitable habitat. However, the areas with reduced suitability are located at the Optimal area of current climate, including the junction of Zhejiang and Fujian Provinces, and the middle of Guangxi and Guangdong Provinces. Two major observations can be drawn as shown in Figure 6 and Figure 7. Firstly, the results showed that the suitability category code can change to sub-level, but hardly change across levels (Figure 7); that is, suitability can be increased from category code “1 to 2”, but hardly from “1 to 3”, which means that the impact of climate change on suitability is gradual and periodic. Secondly, the increased area of Marginal and Medium could lead to the increasing of suitable area, especially if the area of “0 to 1” leads to the expansion of the new habitat, which has different trends in different scenarios (Figure 6 and Figure 7).
In SSP126, there is a downward trend on suitability because of the suitability area of increasing category code (57.54 × 10⁴ km2) less than decreasing code (75.26 × 10⁴ km2) (Table S2), especially the area of category code 3 to 2 in the 2050s and 2070s, corresponding with the suitability decreasing in the coastal areas in southeast China, while the suitability of northern China increases, especially in southwestern Shandong. The area of Marginal and Medium habitat would increase in all study periods, but the area of Optimal habitat is lower than current in in 2070s and 2090s (Figure S1 and Table S1). Suitable planting area may be stable in SSP245 because the area of increasing of suitability is 77.70 × 10⁴ km2 while with decreasing of suitability is 70.58 × 10⁴ km2. It is worth noting that the newly occurring tea suitable area (0 to 1) in the 2090s are mainly located over the boundary of Shandong and Henan provinces and the northeast to the central of Hebei province in this scenario, but the Medium area increases to 124.87 × 10⁴ km2 in the 2090s (Figure S1 and Table S1), which is second only to that of SSP370 of 128.92 × 10⁴ km2 in the 2090s, while the Optimal area increases first and then decreases. In SSP370, the reduced area (84.21 × 10⁴ km2) will be more than the increased area (75.95 × 10⁴ km2), which is mainly due to the reduction of a large area of category code “3–2”, most of which is in the south of China, and even expanded to the southwest edge of Shaanxi in the 2090s (Figure 6). Meanwhile, Optimal suitability will be increased in the south of Yunnan province in SSP370 with the area of 67.54 × 10⁴ km2 (12.60% of total land area) by comparison with the current climate (Figure S1 and Table S1). The area in SSP585 will change significantly, and the suitable area of Shandong, Henan, Hubei, and Jiangsu will increase significantly with the increase of “0–1” and “1–2”, resulting in a larger increase (79.44 × 10⁴ km2) in area as compared to the decrease (44.88 × 10⁴ km2) in area (Figure 6 and Table S2). The southernmost part of the suitable area will reach the southern part of Hunan Province, with the increase of Marginal and decrease of Optimal (Figure 6 and Table S2).
In summary, compared with the current conditions, climate change in the future may have a negative impact on the optimal suitable habitat, but a positive impact on Medium and Marginal suitable habitat. The optimal suitable habitat will be lost in southeast China, especially in Fujian and Zhejiang province. However, areas of Medium and Marginal suitable habitat will increase, replacing the Optimal suitable area, especially in Guangxi and Yunnan province. At the same time, the new suitable area will be expanded from the middle of Henan and Shandong province to the north.

4. Discussion

Climate change has a crucial factor of changing geographical distribution of many species [54,55,56]. It is shown from the observation facts that climate change has led to the extinction of some species, and many species have escaped from their habitats to avoid the terrible climatic environment [57]. Therefore, predicting the response from species to climate change, especially their potential habitats distribution, can be regarded as a great effort to help the planning and decision-making to improve the sustainability and adaptability of ecosystems [58]. Previous studies have shown that various plants and animal species can transfer suitable areas to high altitude and high latitude regions, so as to avoid the adverse effects of extreme weather and utilize available climate resources [59,60,61,62]. In order to formulate countermeasures to adapt to climate change, it is necessary to predict the impact of climate change on the potential distribution pattern of species [63]. The MaxEnt model has been widely used to predict the potential distribution changes of species under different climatic scenarios because of its simple operation, high fitting accuracy and low requirement on sample numbers [64]. As a famous edible economic species, the potential distribution of tea and the impacts of climate change on it are little known. This study comprehensively analyzed the changes of suitable habitat of tea plants in China under the latest climate scenario, which provided an important reference for formulating sustainable development policies, planning and management strategies.

4.1. The Performance of MaxEnt Model

In this study, 410 species location data and 9 environmental variables were analyzed by MaxEnt to predict the distribution of tea in mainland China. Area under the curve (AUC) is an important model quality index to evaluate the model accuracy, because it provides a single measure of the accuracy of the overall model independent of selection threshold [65,66]. Generally, models with an AUC value greater than 0.75 might show good performance for niche model [23,67]. The AUC value of this study under current climate conditions is greater than 0.9, which indicates that the model has excellent fitting ability, and the results can objectively reflect the distribution of tea species. Furthermore, our simulation of the potential distribution of tea is only based on the occurrence data in native regions rather than occurrence data in exotic areas, which indicated that the climatic niche of tea is the realized niche instead of the fundamental niche [68,69]. Previous studies have shown that the realized niche is always smaller than the fundamental niche [70,71]. Our study of tea potential habitat was only based on the impact of climate variables and did not include the hydro-geological characteristics, due to data limitations.

4.2. Variable Influence on Tea Suitable Habitats Distribution

MaxEnt is a powerful suitability analysis model based on geographic information, which is mainly used for species prediction based on “existing” data, and environmental variables are very important for the model [23]. Many researchers use this model to predict the influence of all environmental factors or major environmental factors on the geographical distribution of species [53,72]. However, environmental variables are selected according to the different requirements, which could bring about problems such as autocorrelation and multicollinearity among these variables, thus negatively affecting the simulation results [73,74]. This study predicted the current and future climate suitability habitats based on the nine key climate factors with close correlation to tea distribution. The Temperature Annual Range (bio7) was found to be the most influential variable, with the permutation importance of 51% according to the results of the Jackknife test. Previous studies showed that temperature plays an important role in tea production and quality [14,75,76]. Meanwhile, temperature can also affect the distribution of tea by affecting water absorption, photosynthesis, transpiration, respiration, reproduction, and growth. The key Temperature Annual Range was 26 °C, which is higher than the result of Jayasinghe in Sri Lanka [24]. As a kind of rain-fed crop, tea growing needs a large amount of rainfall to maintain its life cycle and ensure the production of fresh leaves. The growth and production of tea plants are threatened by the uncertainty of rainfall brought by climate change [12]. Furthermore, climate change, especially global warming, changes the distribution pattern of precipitation. The precipitation in the dry season is a key indicator of tea survival [77]. In this study, it was found that the Precipitation of Driest Month (bio14) contributed a lot to the MaxEnt model (63.9%), ranging from 17 mm to 180 mm, and was used to evaluate the suitability of tea habitat. Precipitation will be diversified in the future [78], and extreme weather such as rainstorm or drought is expected to occur repeatedly, which will play a key role in the distribution of tea in China in the future.

4.3. Current and Future Dynamic Trend of Tea Suitable Habitats Distribution under Climate Change

Previous studies have shown that tea plants in China are distributed from 94° E to 122° E longitude, and from 18° N to 37° N latitude, but the economic planting areas are concentrated in the region between 94° E to 121° E eastwards and 18° N to 32° N northwards [78,79]. Our simulated potential distribution areas of tea are mainly located in the southeast of Tibet to the north of Shandong province, ranging from 93° E to 122° E and 18° N to 39° N, including 20 provinces or autonomous regions. In this study, only the natural geographical distribution of tea was considered, and areas with low temperature in winter, such as western Sichuan and parts of Tibet, will become potential low-level suitable areas.
Because of the uncertainty of future climate, there are obstacles to assessing the impacts of climate change on species distribution [80]. Numerous previous findings proved that global warming would have negative effects on ecosystems and species [81,82]. Our study indicated that the suitable area of tea species will expand in the future by the increasing of Marginal and Medium suitable area, mainly located in the mountainous regions such as southern Yunnan and Anhui Provinces by comparing spatial distribution and calculating area change. This indicated that under the current climate background, the area of the Optimal suitable area has reached the highest value, and there is little potential for future area increase. Other low-level suitable areas will become more conducive to production due to warming, and the potential for future increase is not great. In the period of 2081–2100, the Optimal habitat will decrease at SSP126, but there is an opposite trend between Medium and Marginal. However, in the high emission scenario SSP585, there are negative impacts of climate on Marginal in the 2070s and Medium in the 2050s, respectively. The areas that can be used for expanding production in the future are mainly located in Marginal and Medium areas, while the newly-increased production areas with great development potential are mainly located in the edge areas such as Shandong, Yunnan, and Henan. On the one hand, because of its high economic value, tea tree is different from other species, and it is mainly managed according to the management method of Gramineae crops in actual production. The development of tea to cope with climate change is highly dependent on social and economic input, and the benefits brought by tea production could promote the excavation of potential distribution areas, but this process is meaningful only when the climatic conditions of a certain area meet the requirements of tea production. On the other hand, according to the physiological characteristics of tea tree, as an evergreen plant, it is suitable for growing in a humid and warm environment, with limited resistance to cold and heat [83,84]. Under the climatic conditions of increasing CO2 concentration and temperature in the future, the temperature in northern Shandong and southern Shanxi will reach the minimum standard for tea growth, which will lead to the northward shift of the suitable regional boundary for its distribution. At the same time, due to the higher elevation in southwest China, the temperature in high altitude area will also rise, which will lead to the distribution boundary moving to southwest China. Moreover, the suitable area of tea will expand northward and west in response to global warming and social and economic development, suggesting that additional new suitable habitats will be created for Chinese tea production with the future climate change.

4.4. Other Uncertainty of Tea Distribution in the Future Climate Change

Due to changes of environmental factors caused by climate change, the suitable habitats of tea plants in China have changed, and it is difficult to formulate a suitable long-term tea production management plan for adapting to climate change [38]. The MaxEnt model is an important tool to simulate the suitable habitats distribution of the species, because it can predict suitable distribution areas under future climate change scenarios. It should be noted that, although the simulation results of the MaxEnt model have high accuracy, it does not mean that the suitable area is completely consistent with the actual distribution area [21]. The simulation result of the model is the maximum possible geographical distribution of tea, which is the maximum possible distribution range under ideal conditions. However, due to the limitation of data, the economic value of tea quality has not been considered, and not all simulated suitable areas have better quality and higher economic benefits. Moreover, the distribution of tea is affected not only by climate factors, but also by non-biological factors such as topography and soil. On the other hand, it is also influenced by social and economic development, human intervention, policies, and other human activities. Although there are many assumptions and uncertainties in the tea distribution model, this model is still the key data source for future suitability prediction [85], so as to evaluate scientific adaptation strategies at the level of species, community and ecosystem, and to offset the impact of future warming on tea distribution.

5. Conclusions

In this study, the present-day occurrence data of tea (Camellia sinensis L.) were used to predict the current and future potential suitable distribution habitats in China by MaxEnt model under four SSPs climate change scenarios. The main conclusions are as follows: (1) AUC value was over 0.9, which reveals that the model performance was excellent to predict the future suitable habitats of tea. The nine dominant climate factors were selected by correlation analysis and Jackknife test, in which bio14 (Precipitation of Driest Month) contributed the most, accounting for 63.9%, and bio7 was the most important to predict tea distribution, with the permutation importance accounting for 51%. (2) Under the current climatic condition, tea distribution areas were mainly located from south of Hainan to the north of Shandong province, including 20 provinces or autonomous regions. The most suitable climate zone was mainly located in the higher elevation zones including the central and eastern Guizhou, Chongqing, Zhejiang, and the coastal areas of Fujian Province. (3) Compared with current distribution, this study revealed that the suitable area would increase in the future climate change scenarios because of the expansion of Medium and Marginal suitable habitats in central and eastern Hubei Province, central Anhui and Jiangsu Provinces, southern Yunnan Province, and even northern Shandong and Henan Provinces. Only considering climate factors, tea production in western provinces such as Chongqing, Guizhou, Yunnan, and other provinces such as Shandong and Henan have great development space, so formulating the adaptative technology of tea production should be considered in these provinces.
The distribution map of tea potential habitat is helpful to strengthen land use management, create new tea gardens, increase farmers’ welfare, avoid competing for arable land with food production, and make the future distribution prediction an important backbone for formulating the development plan of the tea industry. Climate factors are considered in the distribution model, but the other factors such as socio-economic development, human intervention, policies, and other human activities have always played a significant role in species distribution, which should be strengthened in future study.

Supplementary Materials

The following are available online at https://www.mdpi.com/article/10.3390/agriculture11111122/s1, Figure S1: The potential distribution area of Tea based on the future bioclimatic variables at 2050s (2041–2060), 2070s (2061–2080), and 2090s (2081–2100), Table S1: Distribution areas (104× km2) under different suitability classes of Tea under current and future climate conditions, 2050s: 2041–2060, 2070s: 2061–2080, 2090s: 2081–2100, Table S2: The Spatial coverage area (104× km2) of habitat suitability category code at future scenarios. “0” indicates Unsuitable habitat, “1” indicates Marginal suitable habitat, “2” indicates Medium suitable habitat, “3” indicates Optimal suitable habitat; 2050s: 2041–2060, 2070s: 2061–2080, 2090s: 2081–2100.

Author Contributions

Conceptualization, Y.Z. and Y.X.; methodology, Y.Z. and L.Z.; software, Y.Z. and L.Z.; formal analysis, M.Z. and C.W.; writing–original draft preparation, Y.Z.; writing—review and editing, M.Z. and Y.X.; funding acquisition, M.Z. and Y.X. All authors have read and agreed to the published version of the manuscript.

Funding

This research was financially supported by the National Natural Science Foundation of China (No. 42001217).

Institutional Review Board Statement

Not applicable.

Informed Consent Statement

Not applicable.

Data Availability Statement

All data is contained within the article or Supplementary Materials.

Acknowledgments

The authors are grateful to Amatus Gyilbag for polishing the language.

Conflicts of Interest

The authors declare no conflict of interest.

References

  1. IPCC. Climate Change 2021: The Physical Science Basis; Cambridge University Press: Cambrdge, UK, 2021. [Google Scholar]
  2. CMA Climate Change Centre. Blue Book on Climate Change in China; Science Press: Beijing, China, 2021. [Google Scholar]
  3. Chang, K.; Brattlof, M. Socio-Economic Implications of Climate Change for Tea Producing Countries; FAO: Rome, Italy, 2015. [Google Scholar]
  4. FAO; CAAS. Carbon Neutral Tea Production in China–Three Pilot Case Studies; FAO: Rome, Italy, 2021. [Google Scholar]
  5. Ahmed, S.; Stepp, J.R.; Orians, C.; Griffin, T.; Matyas, C.; Robbat, A.; Cash, S.; Xue, D.; Long, C.; Unachukwu, U.; et al. Effects of extreme climate events on tea (Camellia sinensis) functional quality validate indigenous farmer knowledge and sensory preferences in tropical China. PLoS ONE 2014, 9, e109126. [Google Scholar] [CrossRef] [Green Version]
  6. Duncan, J.M.A.; Saikia, S.D.; Gupta, N.; Biggs, E.M. Observing climate impacts on tea yield in Assam, India. Appl. Geogr. 2016, 77, 64–71. [Google Scholar] [CrossRef]
  7. Rwigi, S.K.; Oteng’I, S.B.B. Influence of Climate on Tea Yields in Mount Kenya Region; University of Nairobi Department of Meteorology: Nairobi, Kenya, 2009. [Google Scholar]
  8. Han, W.Y.; Li, X.; Ahammed, G.J. Stress Physiology of Tea in the Face of Climate Change; Springer: Singapore, 2018. [Google Scholar]
  9. Jin, Z.; Ye, J.; Yang, Z.; Sun, R.; Hu, B.; Li, R. Climate suitability for tea growing in Zhejiang Province (in Chinese). Chin. J. Appl. Ecol. 2014, 25, 967–973. [Google Scholar] [CrossRef]
  10. Yu, H. Variation characteristics of climate suitability of tea in eastern Fujian (in Chinese). Mt. Res. 2016, 34, 424–425. [Google Scholar] [CrossRef]
  11. Tang, J.; Wang, P.; E, Y.; Ma, Y.; Wu, D.; Huo, Z. Climatic Suitability Zoning of Tea Planting in Mainland China. J. Appl. Meteorol. Sci. 2021, 32, 397–407. [Google Scholar]
  12. Wijertane, M.A. Vulnerability of Sri Lanka tea production to global climate change. Water Air Soil Pollut. 1996, 92, 87–94. [Google Scholar] [CrossRef]
  13. Wijeratne, M.A.; Anandacoomaraswamy, A.; Amarathunga, M.K.S.L.; Ratnasiri, J.; Basnayake, B.R.S.B.; Kalra, N. Assessment of impact of climate change on productivity of tea (Camellia sinensis L.) plantations in Sri Lanka. J. Natl. Sci. Found Sri. 2007, 35, 119–126. [Google Scholar] [CrossRef] [Green Version]
  14. Gunathilaka, R.P.D.; Smart, J.C.R.; Fleming, C.M.; Hasan, S. The impact of climate change on labour demand in the plantation sector: The case of tea production in Sri Lanka. Aust. J. Agric. Resour. Econ. 2018, 62, 480–500. [Google Scholar] [CrossRef]
  15. Heikkinen, R.K.; Luoto, M.; Araújo, M.B.; Virkkala, R.; Thuiller, W.; Sykes, M.T. Methods and uncertainties in bioclimatic envelope modelling under climate change. Prog. Phys. Geogr. Earth Environ. 2006, 30, 751–777. [Google Scholar] [CrossRef] [Green Version]
  16. Hirzel, A.H.; Hausser, J.; Chessel, D.; Perrin, N. Ecological-niche factor analysis: How to compute habitat-suitability maps without absence data? Ecology 2002, 83, 2027–2036. [Google Scholar] [CrossRef]
  17. Stockwell, D.; David, P. The GARP modelling system: Problems and solutions to automated spatial prediction. Int. J. Geogr. Inf. Sci. IJGIS 1999, 13, 143–158. [Google Scholar] [CrossRef]
  18. Thuiller, W. BIOMOD—Optimizing predictions of species distributions and projecting potential future shifts under global change. Glob. Chang. Biol. 2003, 20, 1353–1362. [Google Scholar] [CrossRef]
  19. Phillips, S.J.; Anderson, R.P.; Schapire, R.E. Maximum entropy modeling of species geographic distributions. Ecol. Model 2006, 190, 231–259. [Google Scholar] [CrossRef] [Green Version]
  20. Adams-Hosking, C.; Grantham, H.S.; Rhodes, J.R.; McAlpine, C.; Moss, P.T. Modelling climate-change-induced shifts in the distribution of the koala. Wildl. Res. 2011, 38, 122. [Google Scholar] [CrossRef]
  21. Gebrewahid, Y.; Abrehe, S.; Meresa, E.; Eyasu, G.; Abay, K.; Gebreab, G.; Kidanemariam, K.; Adissu, G.; Abreha, G.; Darcha, G. Current and future predicting potential areas of Oxytenanthera abyssinica (A. Richard) using MaxEnt model under climate change in Northern Ethiopia. Ecol. Process. 2020, 9, 6. [Google Scholar] [CrossRef] [Green Version]
  22. Shrestha, U.B.; Bawa, K.S.; Lumbsch, H.T. Impact of climate change on potential distribution of Chinese caterpillar fungus (Ophiocordyceps sinensis) in Nepal Himalaya. PLoS ONE 2014, 9, e106405. [Google Scholar] [CrossRef]
  23. Elith, J.; Graham, C.H.; Anderson, R.P.; Dudík, M.; Zimmermann, N.E. Novel methods improve prediction of species’ distri-butions from occurence data. Ecography 2006, 29, 129–151. [Google Scholar] [CrossRef] [Green Version]
  24. Jayasinghe, S.L.; Kumar, L. Modeling the climate suitability of tea [Camellia sinensis (L.) O. Kuntze] in Sri Lanka in response to current and future climate change scenarios. Agric. For. Meteorol. 2019, 272, 102–117. [Google Scholar] [CrossRef]
  25. Hijmans, R.J.; Cameron, S.E.; Parra, J.L.; Jones, P.G.; Jarvis, A. Very high resolution interpolated climate surfaces for global land areas. Int. J. Climatol. 2005, 25, 1965–1978. [Google Scholar] [CrossRef]
  26. Al-Obaidi, M.J.; Ali, H.B. Effect of Climate Change on the Distribution of Zoonotic Cutaneous Leishmaniasis in Iraq. J. Phys. Conf. Ser. 2021, 1818, 12052. [Google Scholar] [CrossRef]
  27. Chhogyel, N.; Kumar, L.; Bajgai, Y.; Sadeeka Jayasinghe, L. Prediction of Bhutan’s ecological distribution of rice (Oryza sativa L.) under the impact of climate change through maximum entropy modelling. J. Agric. Sci. 2020, 158, 25–37. [Google Scholar] [CrossRef]
  28. Rosenzweig, M.L. Species Diversity in Space and Time; Cambridge University Press: Cambrdge, UK, 1995. [Google Scholar]
  29. Sillero, N. What does ecological modelling model? A proposed classification of ecological niche models based on their under-lying methods. Ecol. Model 2011, 222, 1343–1346. [Google Scholar] [CrossRef]
  30. Rong, Z.; Zhao, C.; Liu, J.; Gao, Y.; Zang, F.; Guo, Z.; Mao, Y.; Wang, L. Modeling the Effect of Climate Change on the Potential Distribution of Qinghai Spruce (Picea crassifolia Kom.) in Qilian Mountains. Forests 2019, 10, 62. [Google Scholar] [CrossRef] [Green Version]
  31. Yang, X.; Kushwaha, S.P.S.; Saran, S.; Xu, J.; Roy, P.S. Maxent modeling for predicting the potential distribution of medicinal plant, Justicia adhatoda L. in Lesser Himalayan foothills. Ecol. Eng. 2013, 51, 83–87. [Google Scholar] [CrossRef]
  32. Kumar, S.; Stohlgren, T.J. Maxent modeling for predicting suitable habitat for threatened and endangered tree Canacomyrica monticola in New Caledonia. J. Ecol. Nat. Environ. 2009, 1, 94–98. [Google Scholar] [CrossRef]
  33. Pearson, R.G.; Raxworthy, C.J.; Nakamura, M.; Peterson, A.T. ORIGINAL ARTICLE: Predicting species distributions from small numbers of occurrence records: A test case using cryptic geckos in Madagascar. J. Biogeogr. 2007, 34, 102–117. [Google Scholar] [CrossRef]
  34. Phillips, S.J. A brief tutorial on MaxEnt. 2017. Available online: https://biodiversityinformatics.amnh.org/open_source/maxent/ (accessed on 20 October 2020).
  35. Zhang, K.; Sun, L.; Tao, J. Impact of Climate Change on the Distribution of Euscaphis japonica (Staphyleaceae) Trees. Forests 2020, 11, 525. [Google Scholar] [CrossRef]
  36. Phillips, S.J.; Anderson, R.P.; Dudík, M.; Schapire, R.E.; Blair, M.E. Opening the black box: An open-source release of Maxent. Ecography 2017, 40, 887–893. [Google Scholar] [CrossRef]
  37. Phillips, S.J.; Dudík, M. Modeling of species distributions with Maxent: New extensions and a comprehensive evaluation. Ecography 2008, 31, 161–175. [Google Scholar] [CrossRef]
  38. Li, Y.; Li, M.; Li, C.; Liu, Z. Optimized Maxent Model Predictions of Climate Change Impacts on the Suitable Distribution of Cunninghamia lanceolata in China. Forests 2020, 11, 302. [Google Scholar] [CrossRef] [Green Version]
  39. Li, G.; Du, S.; Wen, Z. Mapping the climatic suitable habitat of oriental arborvitae (Platycladus orientalis) for introduction and cultivation at a global scale. Sci. Rep. 2016, 6, 30009. [Google Scholar] [CrossRef] [PubMed] [Green Version]
  40. Wang, Y.; Xie, B.; Wa, F.; Xiao, Q.; Dai, L. Application of ROC curve analysis in evaluating the performance of alien species’ potential distribution models. Biodivers. Sci. 2007, 15, 365–372. [Google Scholar] [CrossRef]
  41. Swets, J. Measuring the accuracy of diagnostic systems. Science 1988, 240, 1285–1293. [Google Scholar] [CrossRef] [Green Version]
  42. Hanley, J.A.; McNeil, B.J. The Meaning under a Receiver Characteristic and Use of the Area Operating (ROC) Curve. Radiology 1982, 143, 29–36. [Google Scholar] [CrossRef] [PubMed] [Green Version]
  43. Moss, R.H.; Edmonds, J.A.; Hibbard, K.A.; Manning, M.R.; Rose, S.K.; van Vuuren, D.P.; Carter, T.R.; Emori, S.; Kainuma, M.; Kram, T.; et al. The next generation of scenarios for climate change research and assessment. Nature 2010, 463, 747–756. [Google Scholar] [CrossRef]
  44. Vuuren, D.P.V.; Edmonds, J.; Kainuma, M.; Riahi, K.; Thomson, A.; Hibbard, K.; Hurtt, G.C.; Kram, T.; Krey, V.; Lamarque, J.F. The representative concentration pathways: An overview. Clim. Chang. 2011, 109, 5. [Google Scholar] [CrossRef]
  45. Wu, T.; Song, L.; Li, W.; Wang, Z.; Zhang, H.; Xin, X.; Zhang, Y.; Zhang, L.; Li, J.; Wu, F.; et al. An overview of BCC climate system model development and application for climate change studies. Acta Meteorol. Sin. 2014, 28, 34–56. [Google Scholar] [CrossRef]
  46. Wu, T.; Lu, Y.; Fang, Y.; Xin, X.; Li, L.; Li, W.; Jie, W.; Zhang, J.; Liu, Y.; Zhang, L.; et al. The Beijing Climate Center Climate System Model (BCC-CSM): The main progress from CMIP5 to CMIP6. Geosci. Model Dev. 2019, 12, 1573–1600. [Google Scholar] [CrossRef] [Green Version]
  47. O’Neill, B.C.; Tebaldi, C.; van Vuuren, D.P.; Eyring, V.; Friedlingstein, P.; Hurtt, G.; Knutti, R.; Kriegler, E.; Lamarque, J.; Lowe, J.; et al. The Scenario Model Intercomparison Project (ScenarioMIP) for CMIP6. Geosci. Model Dev. 2016, 9, 3461–3482. [Google Scholar] [CrossRef] [Green Version]
  48. Wei, B.; Wang, R.; Hou, K.; Wang, X.; Wu, W. Predicting the current and future cultivation regions of Carthamus tinctorius L. using MaxEnt model under climate change in China. Glob. Ecol. Conserv. 2018, 16, e477. [Google Scholar] [CrossRef]
  49. Wang, R.; Li, Q.; He, S.; Liu, Y.; Wang, M.; Jiang, G. Modeling and mapping the current and future distribution of Pseudomonas syringae pv. actinidiae under climate change in China. PLoS ONE 2018, 13, e192153. [Google Scholar] [CrossRef] [Green Version]
  50. Anand, V.; Oinam, B.; Singh, I.H. Predicting the current and future potential spatial distribution of endangered Rucervus eldii eldii (Sangai) using MaxEnt model. Environ. Monit. Assess 2021, 193, 147. [Google Scholar] [CrossRef]
  51. McPherson, J.M.; Jetz, W. Effects of species’ ecology on the accuracy of distribution models. Ecography 2007, 30, 135–151. [Google Scholar] [CrossRef]
  52. Evangelista, P.H.; Kumar, S.; Stohlgren, T.J.; Jarnevich, C.S.; Crall, A.W.; Iii, J.B.N.; Barnett, D.T. Modelling invasion for a habitat generalist and a specialist plant species. Divers. Distrib. 2010, 14, 808–817. [Google Scholar] [CrossRef]
  53. Yi, Y.; Cheng, X.; Yang, Z.; Zhang, S. Maxent modeling for predicting the potential distribution of endangered medicinal plant (H. riparia Lour) in Yunnan, China. Ecol. Eng. 2016, 92, 260–269. [Google Scholar] [CrossRef]
  54. Bellard, C.; Bertelsmeier, C.; Leadley, P.; Thuiller, W.; Courchamp, F. Impacts of climate change on the future of biodiversity. Ecol. Lett. 2012, 15, 365–377. [Google Scholar] [CrossRef] [Green Version]
  55. Lenoir, J.; Gegout, J.C.; Marquet, P.A.; de Ruffray, P.; Brisse, H. A Significant Upward Shift in Plant Species Optimum Elevation During the 20th Century. Science 2008, 320, 1768–1771. [Google Scholar] [CrossRef] [PubMed]
  56. Lowe, C.B.; Kellis, M.; Siepel, A.; Raney, B.J.; Clamp, M.; Salama, S.R.; Kingsley, D.M.; Lindblad-Toh, K.; Haussler, D. Three Periods of Regulatory Innovation During Vertebrate Evolution. Science 2011, 333, 1019–1024. [Google Scholar] [CrossRef] [PubMed] [Green Version]
  57. Worth, J.R.P.; Harrison, P.A.; Williamson, G.J.; Jordan, G.J. Whole range and regional-based ecological niche models predict differing exposure to 21st century climate change in the key cool temperate rainforest tree southern beech (Nothofagus cunninghamii). Austral. Ecol. 2015, 40, 126–138. [Google Scholar] [CrossRef]
  58. Thuiller, W.; Lavorel, S.; Araújo, M.B. Niche properties and geographical extent as predictors of species sensitivity to climate change. Glob. Ecol. Biogeogr. 2005, 14, 347–357. [Google Scholar] [CrossRef]
  59. Parmesan, C.; Yohe, G. A globally coherent fingerprint of climate change impacts across natural systems. Nature 2003, 421, 37–42. [Google Scholar] [CrossRef] [PubMed]
  60. Root, T.L.; Price, J.T.; Hall, K.R.; Schneider, S.H.; Rosenzweig, C.; Pounds, J.A. Fingerprints of global warming on wild animals and plants. Nature 2003, 421, 57–60. [Google Scholar] [CrossRef] [PubMed]
  61. López-Martínez, V.; Sánchez-Martínez, G.; Jiménez-García, D.; Pérez-De La O, N.B.; Coleman, T.W. Environmental suitability forAgrilus auroguttatus (Coleoptera: Buprestidae) in Mexico using MaxEnt and database records of four Quercus (Fagaceae) species. Agric. For. Entomol. 2016, 18, 409–418. [Google Scholar] [CrossRef]
  62. Zahoor, B.; Liu, X.; Ahmad, B.; Kumar, L.; Songer, M. Impact of climate change on Asiatic black bear (Ursus thibetanus) and its autumn diet in the northern highlands of Pakistan. Glob. Chang. Biol. 2021, 27, 4294–4306. [Google Scholar] [CrossRef] [PubMed]
  63. Edmar, I.T.; Fischer, G.; van Velthuizen, H.; Walter, C.; Ewert, F. Global hot-spots of heat stress on agricultural crops due to climate change. Agric. For. Meteorol. 2013, 170, 206–215. [Google Scholar] [CrossRef]
  64. Nabout, J.C.; Magalhaes, M.R.; de Amorim Gomes, M.A.; Cunha, H.F.D. The Impact of Global Climate Change on the Geographic Distribution and Sustainable Harvest of Hancornia speciosa Gomes (Apocynaceae) in Brazil. Environ. Manag. 2016, 57, 814–821. [Google Scholar] [CrossRef]
  65. Evans, J.M.; Fletcher, R.J.; Alavalapati, J. Using species distribution models to identify suitable areas for biofuel feedstock production. Gcb Bioenergy 2010, 2, 63–78. [Google Scholar] [CrossRef]
  66. Saatchi, S.; Buermann, W.; ter Steege, H.; Mori, S.; Smith, T.B. Modeling distribution of Amazonian tree species and diversity using remote sensing measurements. Remote. Sens. Environ. 2008, 112, 2000–2017. [Google Scholar] [CrossRef]
  67. Ferrier, P.S. An evaluation of alternative algorithms for fitting species distribution models using logistic regression. Ecol. Model 2000, 128, 127–147. [Google Scholar] [CrossRef]
  68. Booth, T.H. Assessing species climatic requirements beyond the realized niche: Some lessons mainly from tree species distribution modelling. Clim. Chang. 2017, 145, 259–271. [Google Scholar] [CrossRef]
  69. Booth, T.H.; Nix, H.A.; Hutchinson, M.F.; Jovanic, T. Niche analysis and tree species introduction. For. Ecol. Manag. 1988, 23, 47–59. [Google Scholar] [CrossRef]
  70. Soberón, J.; Arroyo-Peña, B. Are fundamental niches larger than the realized? Testing a 50-year-old prediction by Hutchinson. PLoS ONE 2017, 12, e175138. [Google Scholar] [CrossRef]
  71. Zhang, X.; Li, G.; Du, S. Simulating the potential distribution of Elaeagnus angustifolia L. based on climatic constraints in China. Ecol. Eng. 2018, 113, 27–34. [Google Scholar] [CrossRef]
  72. Merow, C.; Smith, M.J.; Silander, J.A. A practical guide to MaxEnt for modeling species’ distributions: What it does, and why inputs and settings matter. Ecography 2013, 36, 1–12. [Google Scholar] [CrossRef]
  73. Elith, J.; Phillips, S.J.; Hastie, T.; Dudík, M.; Chee, Y.E.; Yates, C.J. A statistical explanation of MaxEnt for ecologists. Divers. Distrib. 2011, 17, 43–57. [Google Scholar] [CrossRef]
  74. Worthington, T.A.; Zhang, T.; Logue, D.R.; Mittelstet, A.R.; Brewer, S.K. Landscape and flow metrics affecting the distribution of a federally-threatened fish: Improving management, model fit, and model transferability. Ecol. Model 2016, 342, 1–18. [Google Scholar] [CrossRef]
  75. Lou, W.; Sun, S.; Wu, L.; Sun, K. Effects of climate change on the economic output of the Longjing-43 tea tree, 1972–2013. Int. J. Biometeorol. 2015, 59, 593–603. [Google Scholar] [CrossRef]
  76. Sitienei, B.; Juma, S.; Opere, E. On the Use of Regression Models to Predict Tea Crop Yield Responses to Climate Change: A Case of Nandi East, Sub-County of Nandi County, Kenya. Climate 2017, 5, 54. [Google Scholar] [CrossRef] [Green Version]
  77. De Costa, W.A.J.M.; Mohotti, A.J.; Wijeratne, M.A. Ecophysiology of tea. Braz. J. Plant Physiol. 2007, 19, 299–332. [Google Scholar] [CrossRef]
  78. Zhang, Y.; Fu, L.; Meng, C.; Zhang, L.; Xu, Y. Projected changes in extreme precipitation events over China in the 21st century using PRECIS. Clim. Res. 2019, 79, 91–107. [Google Scholar] [CrossRef]
  79. Huang, S. Meteorology of the tea plant in China: A review. Agric. For. Meteorol. 1989, 47, 19–30. [Google Scholar] [CrossRef]
  80. Xiao, Z.; Huang, X.; Zang, Z.; Yang, H. Spatio-temporal variation and the driving forces of tea production in China over the last 30 years. J. Geogr. Sci. 2018, 28, 275–290. [Google Scholar] [CrossRef] [Green Version]
  81. Rosenzweig, C.; Elliott, J.; Deryng, D.; Ruane, A.C.; Müller, C.; Arneth, A.; Boote, K.J.; Folberth, C.; Glotter, M.; Khabarov, N.; et al. Assessing agricultural risks of climate change in the 21st century in a global gridded crop model intercomparison. Proc. Natl. Acad. Sci. USA 2014, 111, 3268–3273. [Google Scholar] [CrossRef] [PubMed] [Green Version]
  82. Thomas, C.D.; Cameron, A.; Green, R.E.; Bakkenes, M.; Beaumont, L.J.; Collingham, Y.C.; Erasmus, B.F.; Siqueira, M.D.; Grainger, A.; Hannah, L. Extinction risk from climate change. Nature 2004, 427, 145. [Google Scholar] [CrossRef]
  83. Ashardiono, F.; Cassim, M. Climate Change Adaptation for Agro-forestry Industries: Sustainability Challenges in Uji Tea Cultivation. Procedia Environ. Sci. 2014, 20, 823–831. [Google Scholar] [CrossRef] [Green Version]
  84. Fu, C.; Zhu, Q.; Yang, G.; Xiao, Q.; Wei, Z.; Xiao, W. Influences of extreme weather conditions on the carbon cycles of Bamboo and Tea ecosystems. Forests 2018, 9, 629. [Google Scholar] [CrossRef] [Green Version]
  85. Wiens, J.A.; Stralberg, D.; Jongsomjit, D.; Howell, C.A.; Snyder, M.A. Niches, models, and climate change: Assessing the assumptions and uncertainties. Proc. Natl. Acad. Sci. USA 2009, 106, 19729–19736. [Google Scholar] [CrossRef] [Green Version]
Figure 1. Distribution of tea specimen occurrences in China. The red dots are the occurrence location; SD: Shandong, He’N: He’nan, SX: Shaanxi, GS: Gansu, SC: Sichuan, XZ: Tibet, CQ: Chongqing, HB: Hubei, AH: Anhui, JS: Jiangsu, ZJ: Zhejiang, JX: Jiangxi, Hu’N: Hu’nan, GZ: Guizhou, YN: Yunnan, GX: Guangxi, GD: Guangdong, FJ: Fujian, HN: Hainan, TW: Taiwan.
Agriculture 11 01122 g001
Figure 2. ROC curve and AUC value under the current period (10 replicated runs). The current period was from 1970 to 2000.
Agriculture 11 01122 g002
Figure 3. Results of Jackknife evaluations of the relative importance of predictor variables and their percentage contribution in Maxent model for tea species in China.
Agriculture 11 01122 g003
Figure 4. Response curves of climatic suitability for the major climate factors according to MaxEnt model. (a) response of tea to bio7 (Temperature Annual Range); (b) response of tea to bio18 (Precipitation of Warmest Quarter); (c) response of tea to bio6 (Min Temperature of Coldest Month); (d) response of tea to bio10 (Mean Temperature of Warmest Quarter); (e) response of tea to bio14 (Precipitation of Driest Month); (f) response of tea to bio2 (Mean Diurnal Range); (g) response of tea to bio12 (Annual Precipitation); (h) response of tea to bio15 (Precipitation Seasonality); (k) response of tea to bio3 (Isothermality).
Agriculture 11 01122 g004
Figure 5. The potential distribution area of tea based on the current bioclimatic variables and occurrence records.
Agriculture 11 01122 g005
Figure 6. Changes in the current potential distribution to future distribution under SSP 126, 245, 370, and 585 from 2041 to 2100. “0” indicates Unsuitable habitat, “1” indicates Marginal suitable habitat, “2” indicates Medium suitable habitat, “3” indicates Optimal suitable habitat.
Agriculture 11 01122 g006
Figure 7. The area changes of current habitats distribution to the projected future distribution at 2050s (2041–2060), 2070s (2061–2080), and 2090s (2081–2100) for tea. The longitudinal axis is the change of area (104 km2), in which the positive value is the increase of suitability and the negative value is the decrease of suitability; “0” indicates Unsuitable habitat, “1” indicates Marginal suitable habitat, “2” indicates Medium suitable habitat, “3” indicates Optimal suitable habitat.
Agriculture 11 01122 g007
Table 1. Climate variables used for modeling climatic niches.
CodeVariable NameUnit
bio1Annual Mean TemperatureoC
bio2Mean Diurnal RangeoC
bio3Isothermality (BIO2/BIO7) (×100)-
bio4Temperature Seasonality (standard deviation × 100)C of V
bio5Max Temperature of Warmest MonthoC
bio6Min Temperature of Coldest MonthoC
bio7Temperature Annual Range (BIO5-BIO6)oC
bio8Mean Temperature of Wettest QuarteroC
bio9Mean Temperature of Driest QuarteroC
bio10Mean Temperature of Warmest QuarteroC
bio11Mean Temperature of Coldest QuarteroC
bio12Annual Precipitationmm
bio13Precipitation of Wettest Monthmm
bio14Precipitation of Driest Monthmm
bio15Precipitation Seasonality (Coefficient of Variation)-
bio16Precipitation of Wettest Quartermm
bio17Precipitation of Driest Quartermm
bio18Precipitation of Warmest Quartermm
bio19Precipitation of Coldest Quartermm
The bolded variables were used in modeling.
Table 2. Percentage contribution and permutation importance of the predictor variables to the MaxEnt model.
VariablePercent ContributionPermutation Importance
bio1463.94.9
bio1218.93.7
bio67.89.7
bio74.551
bio102.38.9
bio151.12.9
bio20.74.2
bio30.60.7
bio180.314
Publisher’s Note: MDPI stays neutral with regard to jurisdictional claims in published maps and institutional affiliations.

