Article

Variability of Fruit Quality among 103 Acerola (Malpighia emarginata D. C.) Phenotypes from the Subtropical Region of Brazil

by
Daniela Farinelli
1,*,
Silvia Portarena
2,*,
Daniel Fernandes da Silva
3,
Chiara Traini
1,
Giordana Menegazzo da Silva
3,
Edvan Costa da Silva
3,
Joice Ferreira da Veiga
3,
Paola Pollegioni
2 and
Fabíola Villa
3
1
Department of Agricultural, Food and Environmental Sciences (DSA3), University of Perugia, Via Borgo XX Giugno 74, 06121 Perugia, Italy
2
Institute of Research on Terrestrial Ecosystems (IRET), National Research Council (CNR), Via Marconi 2, 05010 Porano, Italy
3
State University of Western Paraná (Unioeste), Marechal Cândido Rondon, Rua Pernambuco 1777, Brazil
*
Authors to whom correspondence should be addressed.
Agriculture 2021, 11(11), 1078; https://doi.org/10.3390/agriculture11111078
Submission received: 1 October 2021 / Revised: 28 October 2021 / Accepted: 29 October 2021 / Published: 1 November 2021
(This article belongs to the Section Agricultural Technology)

Abstract

:
Acerola fruit is one of the richest natural sources of ascorbic acid. As a consequence, acerola fruit and its products are in demand worldwide for the production of health supplements and for the development of functional products. Acerola phenotypes (103) were screened in Western Paraná State, in the Southern region of Brazil, and evaluated to obtain information on fruit quality characteristics with the aim of using them in future breeding programs. Principal Component and Hierarchical Cluster analysis were performed on all datasets to explore the variability among samples and to identify the main clusters. A great variability among phenotypes was observed, with potential for use in breeding programs. Seven phenotypes were selected as candidates in the next breeding program, characterized by high vitamin C content and yield, or higher values of fruit size and color parameters. Four belong to cluster 1 and three to cluster 2. Specifically, two phenotypes, belonging to cluster 2, showed the best performance in terms of vitamin C (2150 mg 100 g−1 pulp and 2625 mg 100 g−1 pulp respectively) and pulp yield (74.8% and 82.3% respectively), and one phenotype, belonging to cluster 1, for high pulp yield, fruit size and vitamin C content (80.3% 6.43 g and 2490 mg 100 g−1 pulp).

Graphical Abstract

1. Introduction

Acerola (Malpighia emarginata D. C.) is a tropical species, native to the Caribbean Islands and is adapted to the Northeastern region of Brazil [1]. The fruit is considered a super-fruit due to its high ascorbic acid content (vitamin C), which can reach up to 5% in the flesh [2,3], which is about 80 times more than the amount in oranges and lemons [4,5]. In addition to vitamin C, acerola contains many other functional substances, such as phenols, anthocyanins and carotenoids that make it a healthy food [6,7]. The fruit may be consumed fresh or used in the processing of several food products, especially in the pharmaceutical industry for vitamin C and phenol extraction, and as a foodstuff supplement [3,8,9,10]. The amount of vitamin C and phenols in acerola are generally the result of a complex combination of multiple factors such as cultivar, environment, and conditions of cultivation and storage [11,12,13,14,15,16,17]. To date, Brazil is the world’s largest producer of acerola [6] with more than 7000 hectares under cultivation. Among the various states, the most important are: Bahia (1466 ha), Paraná (919 ha), Rio Grande do Norte (800 ha), Rondônia (723 ha), Pernambuco (604 ha), Minas Gerais (466 ha), São Paulo (423 ha), Paraíba (400 ha), Ceará (320 ha) and Pará (300 ha) [18]. Recently there has been an increase in the demand for acerola in domestic and international markets, especially in the northern hemisphere, mainly due to the promotion of functional food consumption. The increased demand, especially by the pharmaceutical industry, has boosted the establishment of new orchards [1,19]. There are more than 42 acerola cultivars planted throughout Brasil, such as Apodi, Cabocla, Cereja, Frutacor, Okinawa, Oliver, Rochinha, Rubra and Sertaneja [20]. Among these, Okinawa, Sertaneja and Flor Branca are present in Minas Gerais, Sergipe, Bahia and Pernambuco States and Olivier and Waldy—Cati 30 in São Paulo State [1,21]. In addition, some cultivars have been released in São Paulo State, such as Sertaneja, Olivier, UEL3- Dominga, UEL4-Lígia, UEL5-Natália, UFRPE-7 and UFRPE-8 [22]. Other varieties such as Flor Blanca and BRS 366 have been released for the soil conditions in the country’s northeastern region, Pacajús—CE) [23]. Other varieties (BRS 235—Apodi, Mirandópolis, Waldy—Cati 30, BRS 238—Frutacor, Okinawa, BRS 236—Cereja and BRS 237—Roxinha) have been released from the Active Bank Germplasm located at the “Agência Paulista de Tecnologia dos Agronegócios”/APTA Regional—Alta Paulista [16] (Figure 1).
In the western region of Paraná State, in the Southern region of Brazil, acerola plantations are quite recent and are expanding slightly. In this region, based on the Köppen climate classification, the climate is of the Cfa type [24], that is, humid subtropical mesothermal. Annual rainfall varies from 1600 to 1800 mm, with rainfall well distributed throughout the year and hot summers; the average annual temperature in the region is between 22 °C and 23 °C [25]. Acerola plantations were established using a limited number of cultivars, selected from other geo-climatic areas, such São Paulo or other states. Their propagation from seedlings resulted in highly heterogeneous orchards in terms of fruit quality and yield [26]. This has led to some disadvantages, such as differences in plant and fruit characteristics, making certain farming practices difficult, particularly the harvesting systems [11,27,28]. Although the fruit quality parameters of acerola from different States of Brazil have been reported in the literature (Table 1), only one study has reported the biochemical and morphological characterization of 14 clones grown in a commercial orchards of Northern Paraná, usable for a breeding program [29].
No studies have reported the biochemical and morphological characterization of acerola phenotypes for the region of Western Paraná, where the commercial production of acerola is expanding in Brazil. In this context, to assess the variability in fruit quality among different individuals of acerola, it is of great importance to start breeding programs [35,36,37]. In particular, pre-screening within intraspecific phenotypes allows large amounts of acerola germplasm to be screened at a relatively low cost. It has the potential to hasten active selection of tree crops and to accelerate breeding programs that help enhance fruit yield and quality [38,39,40,41].
The objectives of this study were to: (1) characterize 103 acerola phenotypes using morphological and biochemical fruit parameters; (2) find possible correlations among the parameters studied; (3) explore the variability among fruit samples and to identify the main clusters by multivariate analysis; and (4) perform a pre-screening assessment, selecting the best phenotypes suitable for the pharmaceutical industry or as a foodstuff supplement, to be used in future acerola breeding programs in the state of Western Paraná.

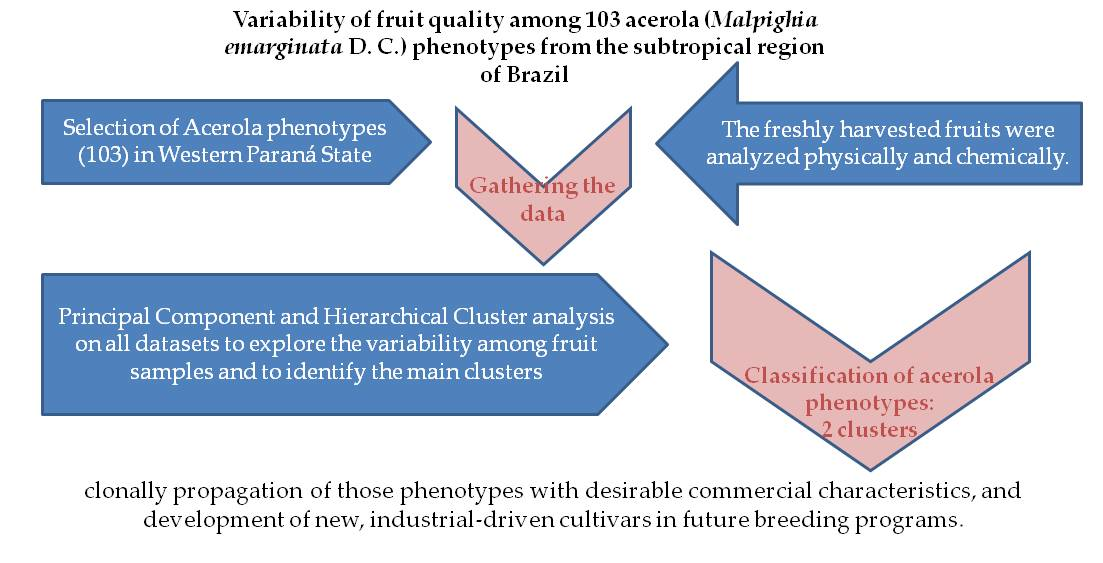
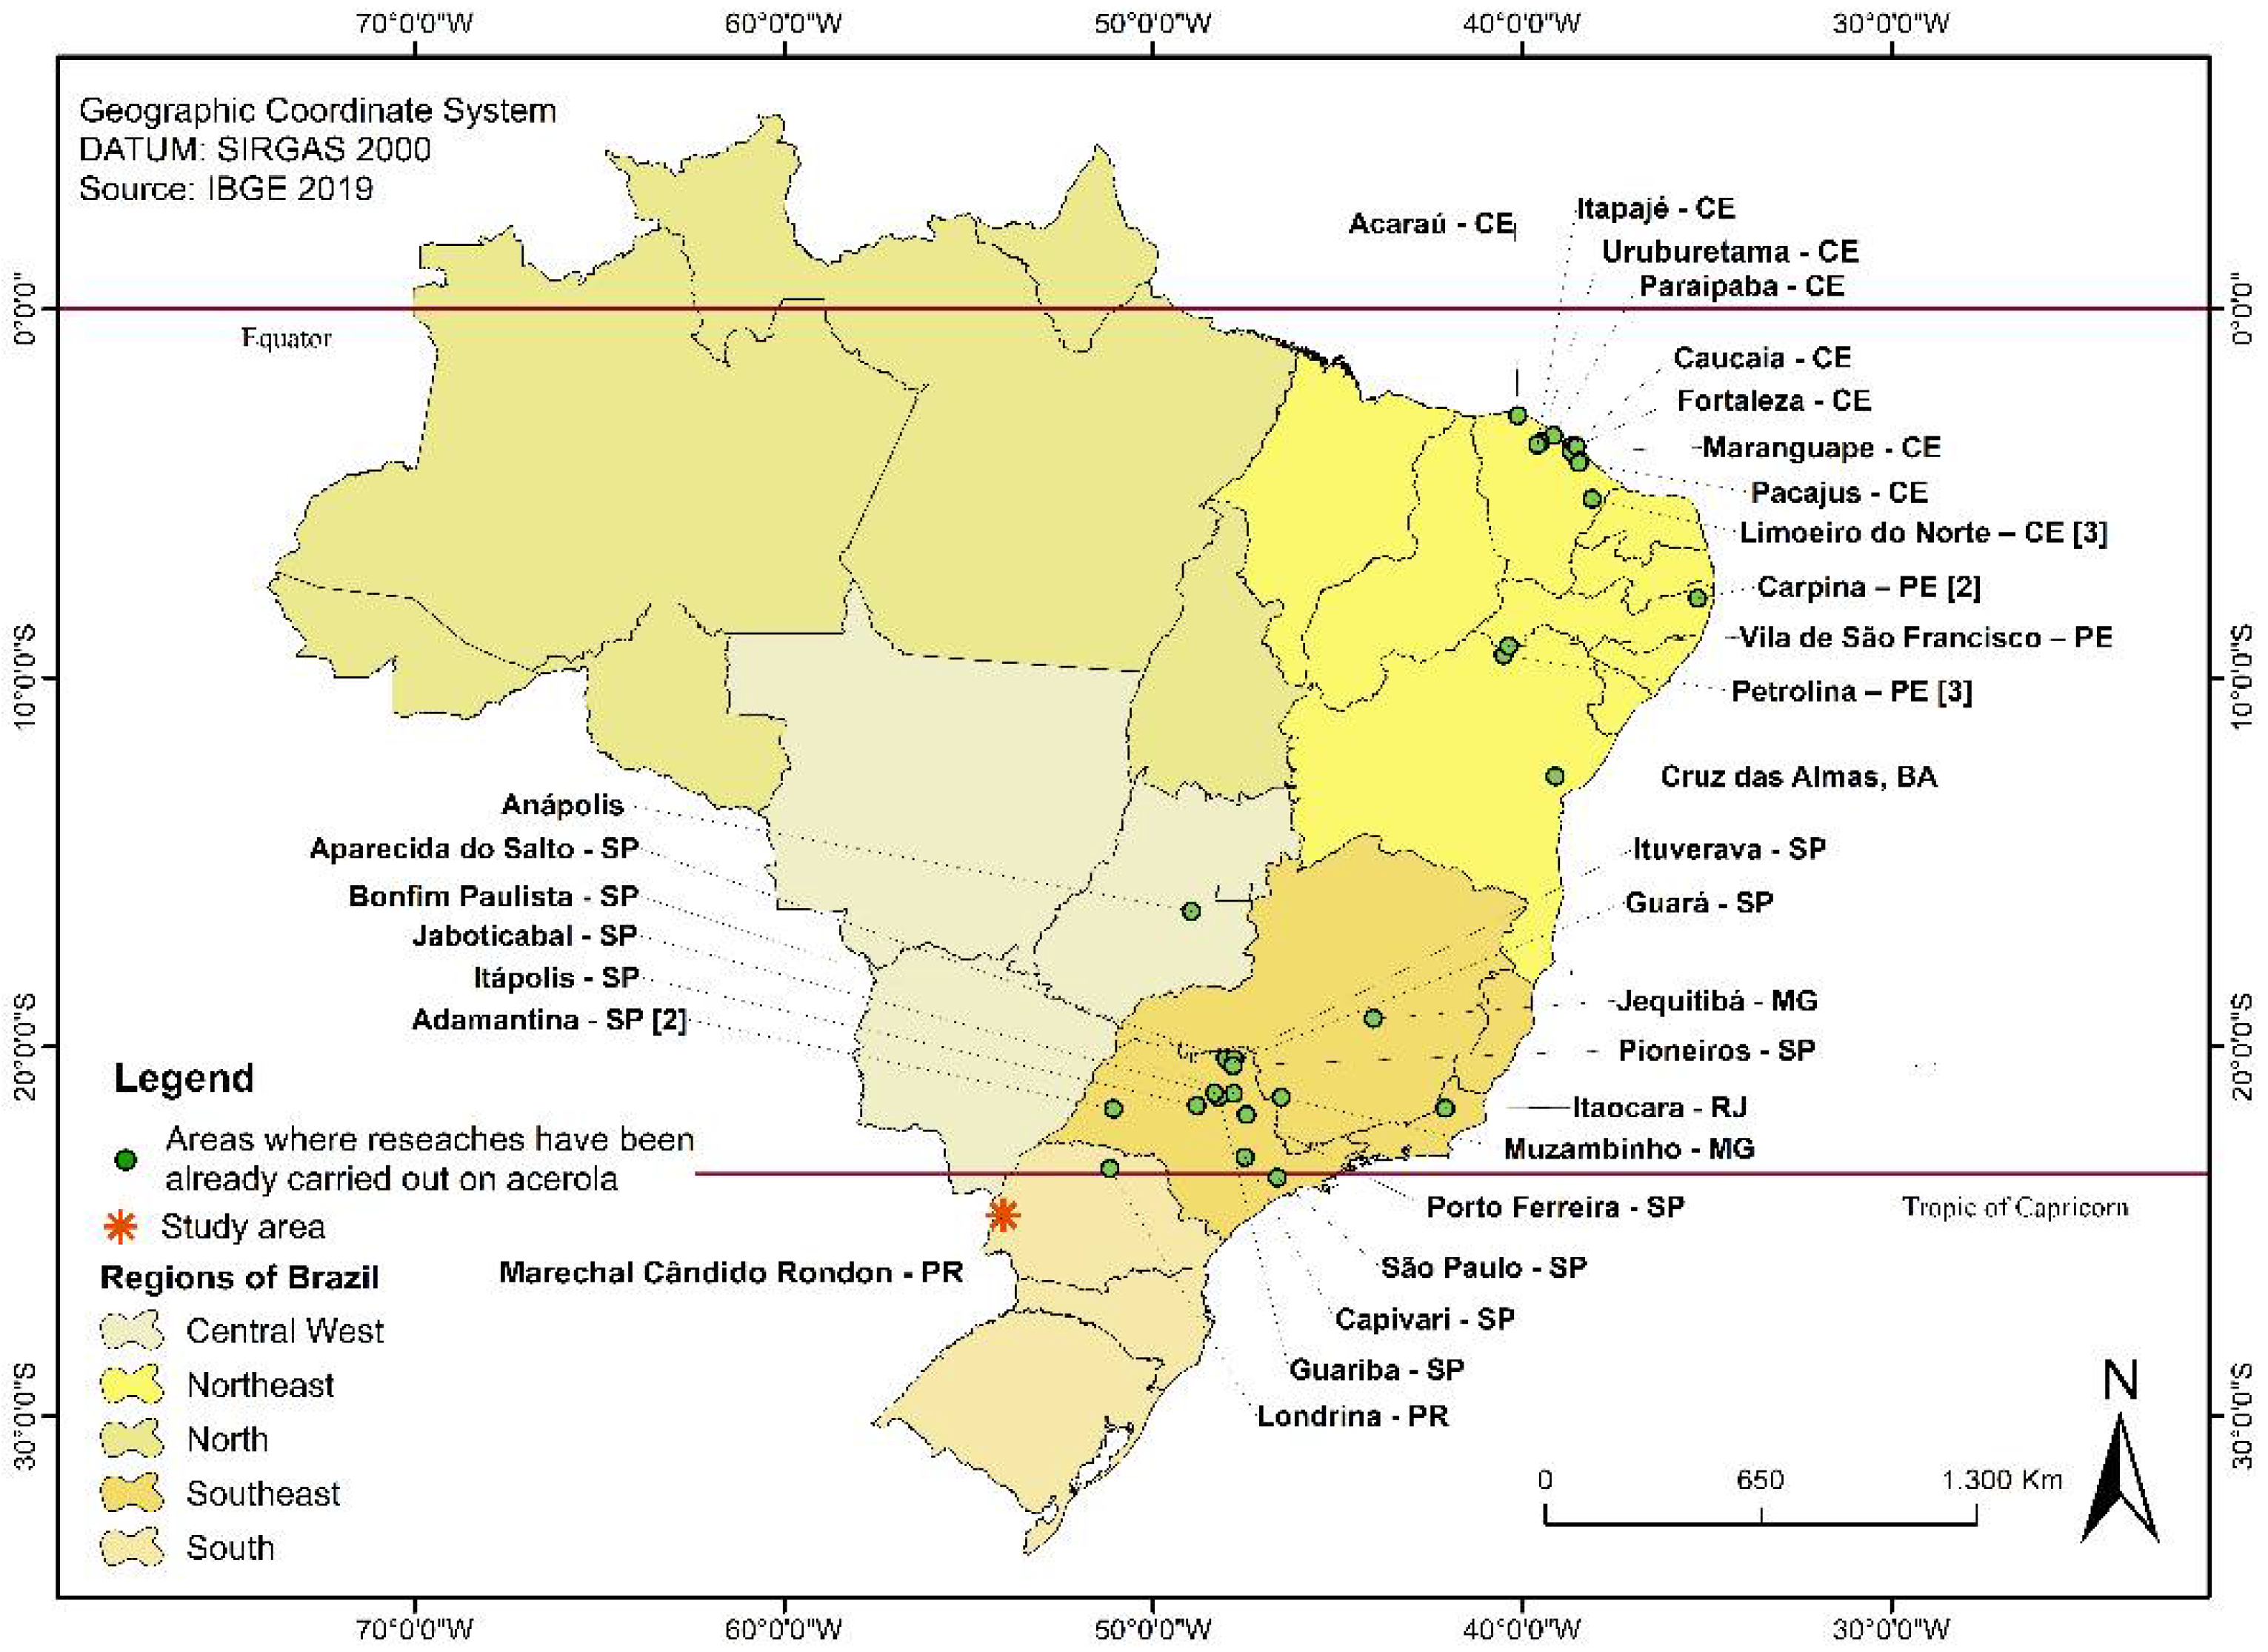
2. Materials and Methods
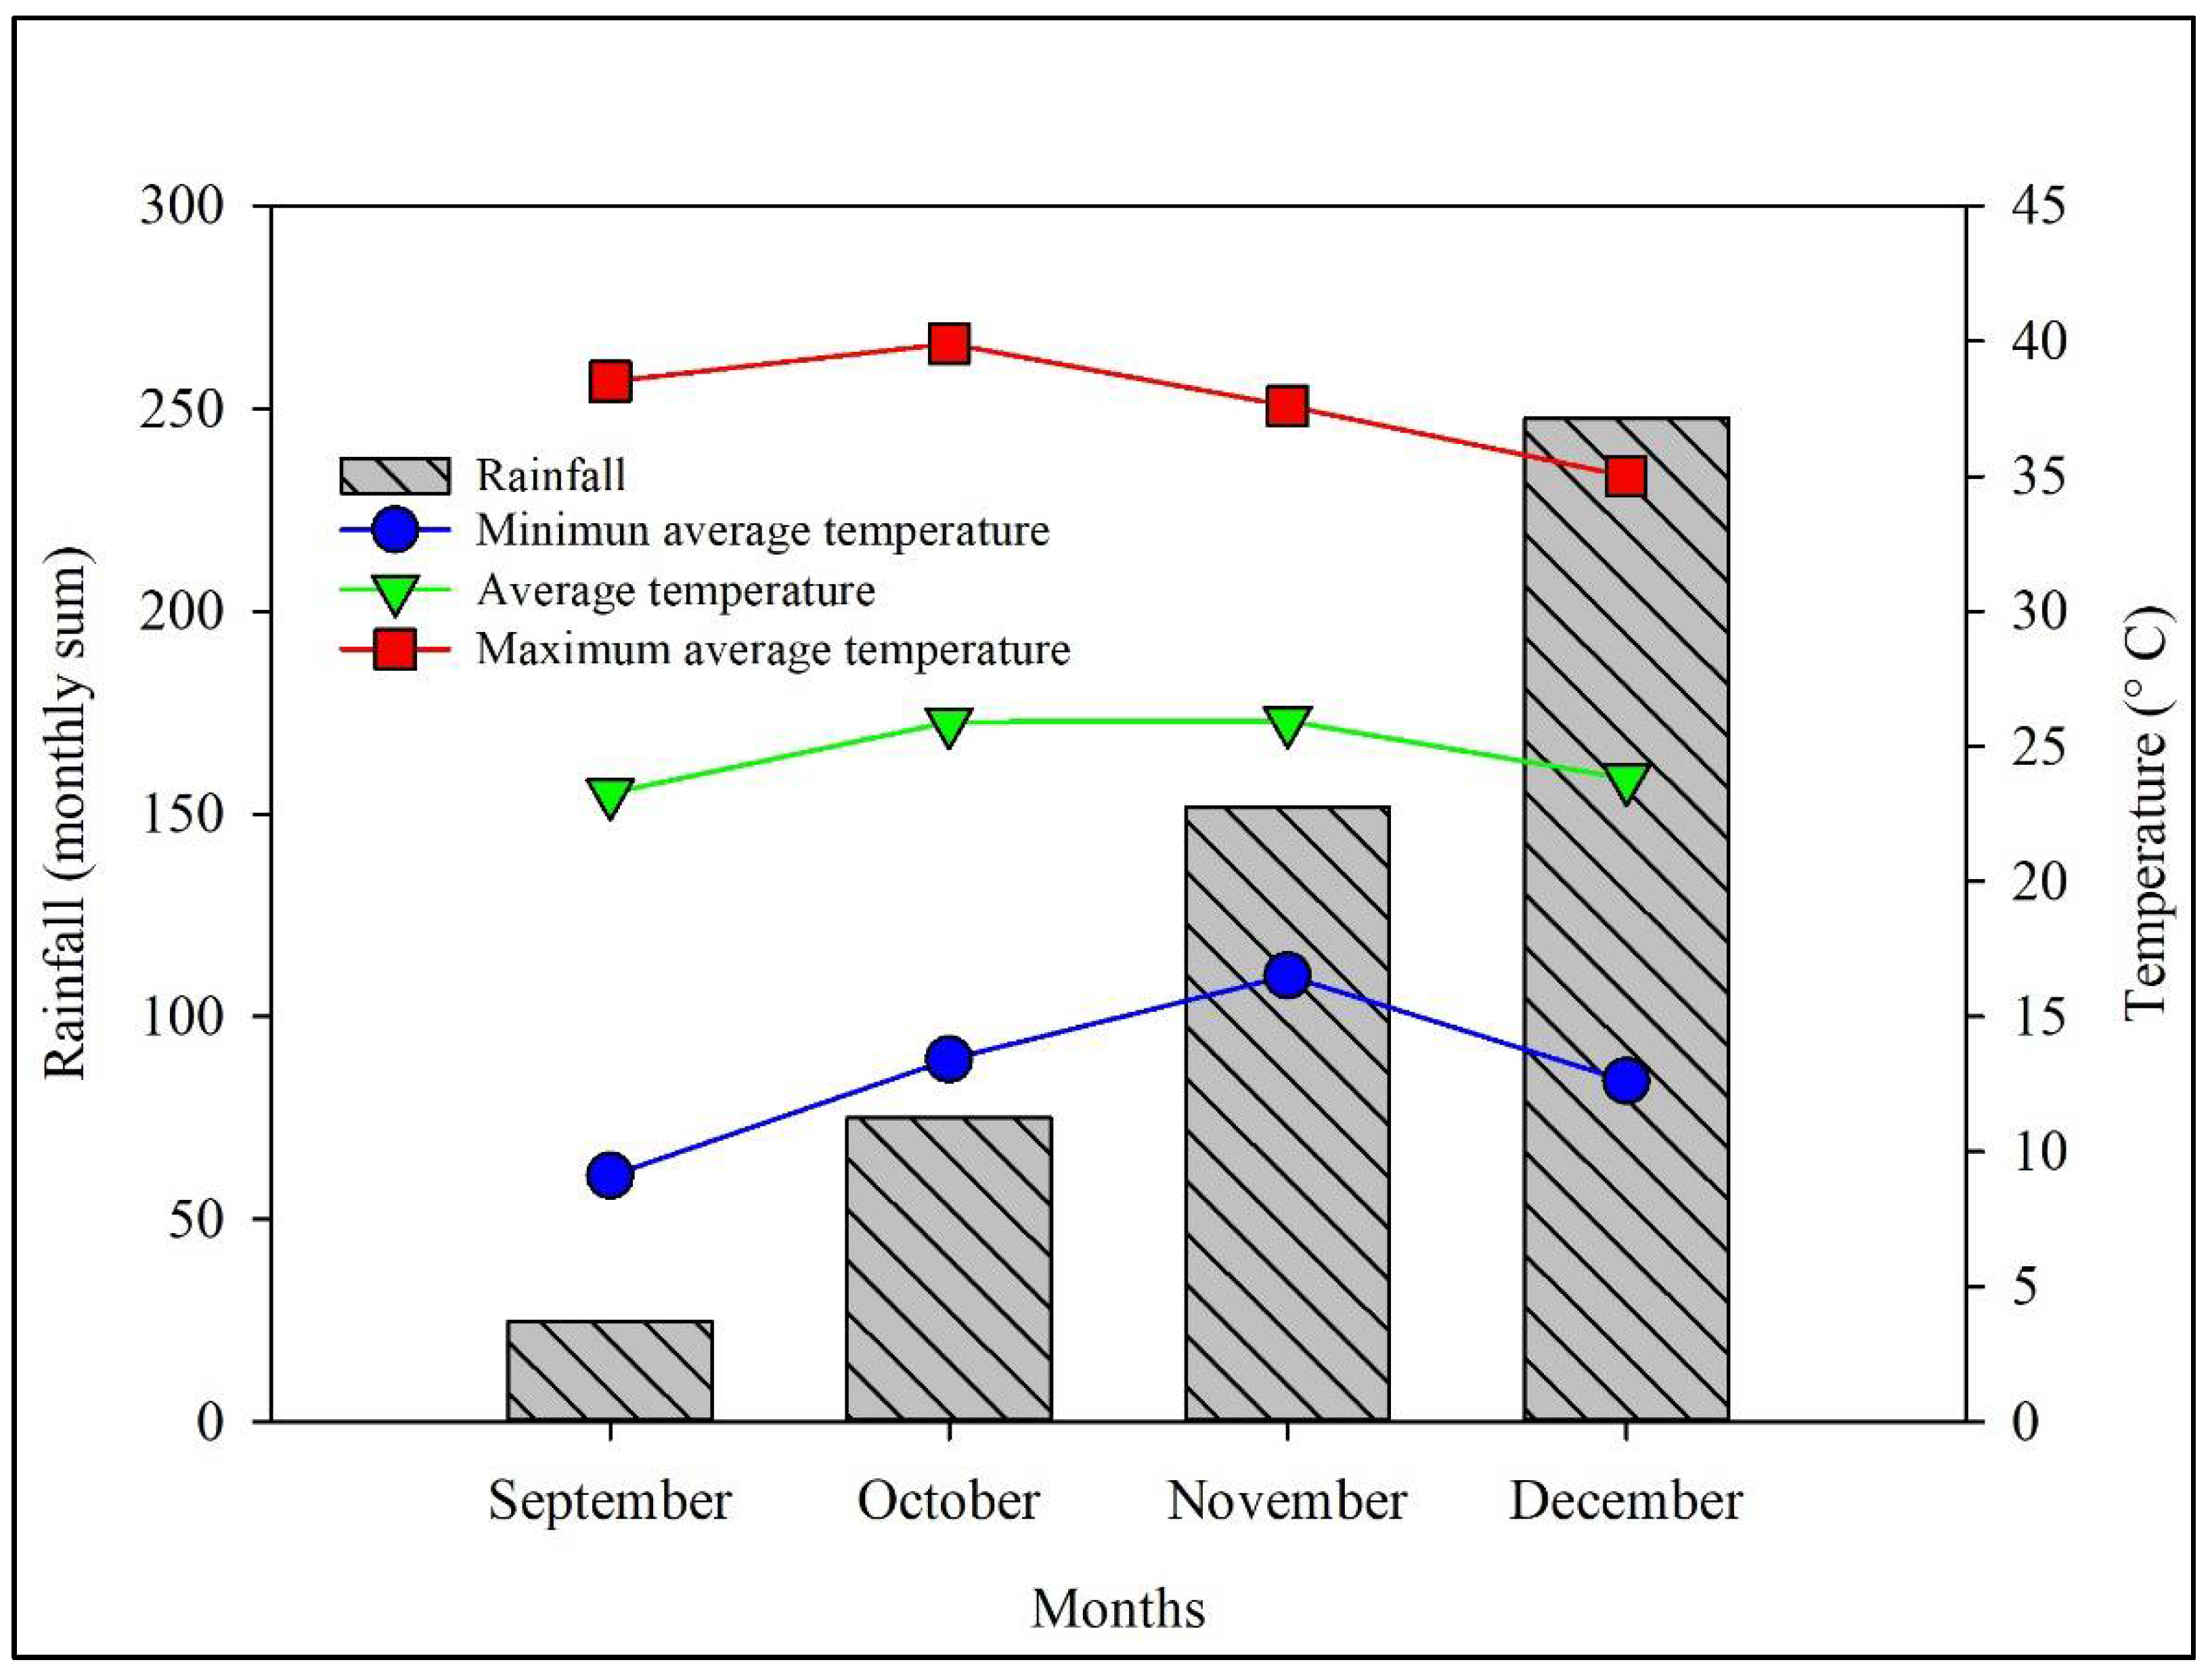
2.1. Sampling

A total of 103 Acerola trees (phenotypes) were selected for the sampling campaign. The trees were about 7 years old and showed a constant yield. The trees were located in different rainfed gardens of the Marechal Cândido Rondon city, in Western Paraná State, Brazil, located at a latitude of 24°33’23.26″ S and a longitude of 54°3’28.33″ W, 420 m above sea level. Acerola fruits were randomly collected from all parts of the canopy to obtain a representative sample from each tree. The fruits were harvested at full ripening (according to color), during the months of October–December 2019. Approximately one kilogram of fruit was harvested from each of the 103 trees, each one denoted as phenotype, and numbered from 1 to 103. The freshly harvested fruits were placed in paper bags and immediately taken to the Food Technology Laboratory at Western Paraná State University (UNIOESTE) where they were analyzed physically and chemically. For each phenotype, a fruit sample, comprising by 4 repetitions of 10 fruits each, were used to determine the physical and biochemical parameters of the fruits.
The meteorological data during the sampling period were recorded using the meteorological station of the Instituto Nacional de Meteorologia (Inmet) located at a latitude of 24°19′ S and a longitude of 54°01′ W, at 392 m above sea level. Rainfall ranged from 25 mm, in October, to 248 mm in December (Figure 2).
The average temperature varied from 23.3 °C to 25.9 °C; the maximum temperature ranged from 35 °C, in December, to 39.9 °C in October (Figure 2). Specifically, the average value of precipitation in October, November and December of the last ten years was, respectively 134 ± 22.3 mm; 167 ± 26.6 mm and 183 ± 41 mm, showing very constant climatic conditions [24,25]. This situation make it possible to limit the fruit quality evaluation during one year as also reported by other research groups on acerola [16,17,23,42,43,44].

2.2. Fruit Size, Weight, Color Parameters and Pulp Yield

A digital caliper was used to measure the length between the point of peduncle insertion and the apex of the fruit (longitudinal diameter), and the largest width measured perpendicularly to the peduncle (transverse diameter). The fresh weight of the fruits was also determined on a precision analytical balance, and the results are expressed in grams (g). The volume of the fruits was estimated, using 4 repetitions of 5 fruits each, by the water displacement method, based on immersing the fruits in a known volume of water in a graduated cylinder and determining the difference between the final and initial volume of water. The fruit volume is expressed in cm3. The same fruits of each sub-sample were analyzed for color parameters using a colorimeter (Konica Minolta® brand, Inc., model Sensy CR 400, Osaka, Japan). Color is expressed using the rectangular coordinate system L* a* b*, according to the Commission Internationale de l’Éclairage [45], where L* = percentage of the luminosity values (0% = black and 100% = white), a* = red (+) or green (−) and b* = yellow (+) or blue (−) [46]. Color was determined by measuring the color reading twice per fruit, in opposite areas, to avoid the influence of sun exposure on the fruit [16,47,48,49]. Finally, a sub-sample of 5 fruits from each repetition was de-pulped and the seeds were weighed to determine the pulp yield, expressed as percentage for each phenotype. The data are expressed as means ± standard error (Tables S1 and S2).

2.3. Biochemical Parameters: Soluble Solids, pH, Titratable Acidity, Vitamin C and Polyphenols

For each phenotype biochemical parameters were determined on sub-samples of 5 fruits from each repetition. The pulps were manually separated from the seeds and ground. The pulps were stored in small plastic bags and kept in a freezer at temperature of −80 °C until the time of analysis, performed one/two days later. Soluble solids content (SSC) was determined using a digital refractometer (MA871, Milwaukee, WI, USA) with automatic temperature compensation as described by [50]. The results are expressed as ° Brix (concentration of sucrose w/w). The ratio between soluble solids and titratable acidity (SSC/TA) was also calculated. The pH was determined on the stored pulp using an automatic pHmeter (Labmeter® PHS-3B, São Paulo, Brazil) as recommended by [50]. Titratable acidity (TA) was determined with phenolphthalene [51] and the results are expressed in grams of malic acid per 100 g of pulp, determined according to the methodology proposed by the Adolfo Lutz Institute [52]. The vitamin C (ascorbic acid) content was determined by titration (Tillmans modified method) based on the reduction of 2,6-dichloro-phenol-indophenol by ascorbic acid [53]. One gram of pulp was diluted in 100 mL of 0.5% oxalic acid and homogenized. Then, 5 mL of this solution was diluted to 50 mL with distilled water and titrated. The results are expressed as mg 100 g−1 FW (fresh weight). The content of total phenolic compounds was determined according to the conventional Folin−Ciocalteu spectrophotometric procedure described in [54]. Extracts were added to 1 mL Folin−Ciocalteu reagent (1 N), 2 mL Na2CO3 at 20% and 2 mL of distilled water and absorbance was read at 700 nm. Results were calculated from a standard curve of 98% gallic acid (0–50 μg) and are expressed as gallic acid equivalents (GAE) mg 100 g−1 FW. The analyses of pH, titratable acidity, vitamin C and total phenolics were performed in triplicate and data are expressed as means ± standard error (Table S2).

2.4. Statistical Data Analysis

To study the relevant data of the acerola phenotypes, the box plot data descriptive method was applied, using SigmaPlot®8.0, which provides a useful summary of a potentially large amount of data. In the box plot method, the input data set is split into quartiles. A box plot has a minimum value, lower quartile (10th), median, upper quartile (90th), and maximum value. The box plot goes from the lower quartile to the upper quartile. The difference between the upper quartile and the lower quartile is the length of the box. Inside the box of the box plot, a horizontal line is drawn, which is the median of the dataset. On the outside of the box, two more horizontal lines are drawn, one horizontal near the upper quartile, is called the upper whisker, and another line, near the lower quartile is called the lower whisker. The end points of the whiskers are typically defined as the most extreme data points [55].
Pearson coefficient was computed to check for the existence of a correlation among the biochemical and morphological variables. The values of correlation reported in the heat map matrix resulted significantly different per p < 0.05.
Hierarchical Cluster Analysis (HCA) was performed using the chemical and physical parameters of the phenotypes as input variables. Since the variables had different scales and units, HCA was calculated on the basis of autoscaled variables. Autoscaling consists in transforming each variable by subtracting its average value and then dividing it by its standard deviation. This transformation allows the data to be translated to the origin of the reference system since each variable will have an average value equal to zero, and this also makes the variability of each variable equally important [56]. The primary goal of HCA is to display the data in such a way as to emphasize their natural clusters and patterns in a two-dimensional space. The results, qualitative in nature, are usually presented as a dendrogram, making it possible to visualize the clusters and correlations among samples or variables. In HCA, the Euclidean distances between samples or variables are calculated and transformed into a similarity matrix whose elements are similarity indexes ranging from 0 to 1; a smaller distance means a larger index and therefore, greater similarity [57]. For hierarchical cluster analysis, the Ward’s linkage method with squared Euclidean distance as a measure of similarity was applied to the dataset. The quality of the dendrogram obtained after HCA was evaluated by the co-phenetic correlation coefficient, which represents a statistical criterion widely used, selecting the hierarchical clustering method when there is no prior knowledge of the pattern of clustering [58]. Principal component analysis (PCA) was also performed on the same input variables used for HCA analysis to explore the variability among samples and to detect the most discriminating variables. PCA summarizes the information contained in the data matrix in fewer independent PCs, obtained as linear combinations of the original variables, lying in the direction of maximum variance [59]. The data were statistically evaluated using the statistical environment.

3. Results and Discussion

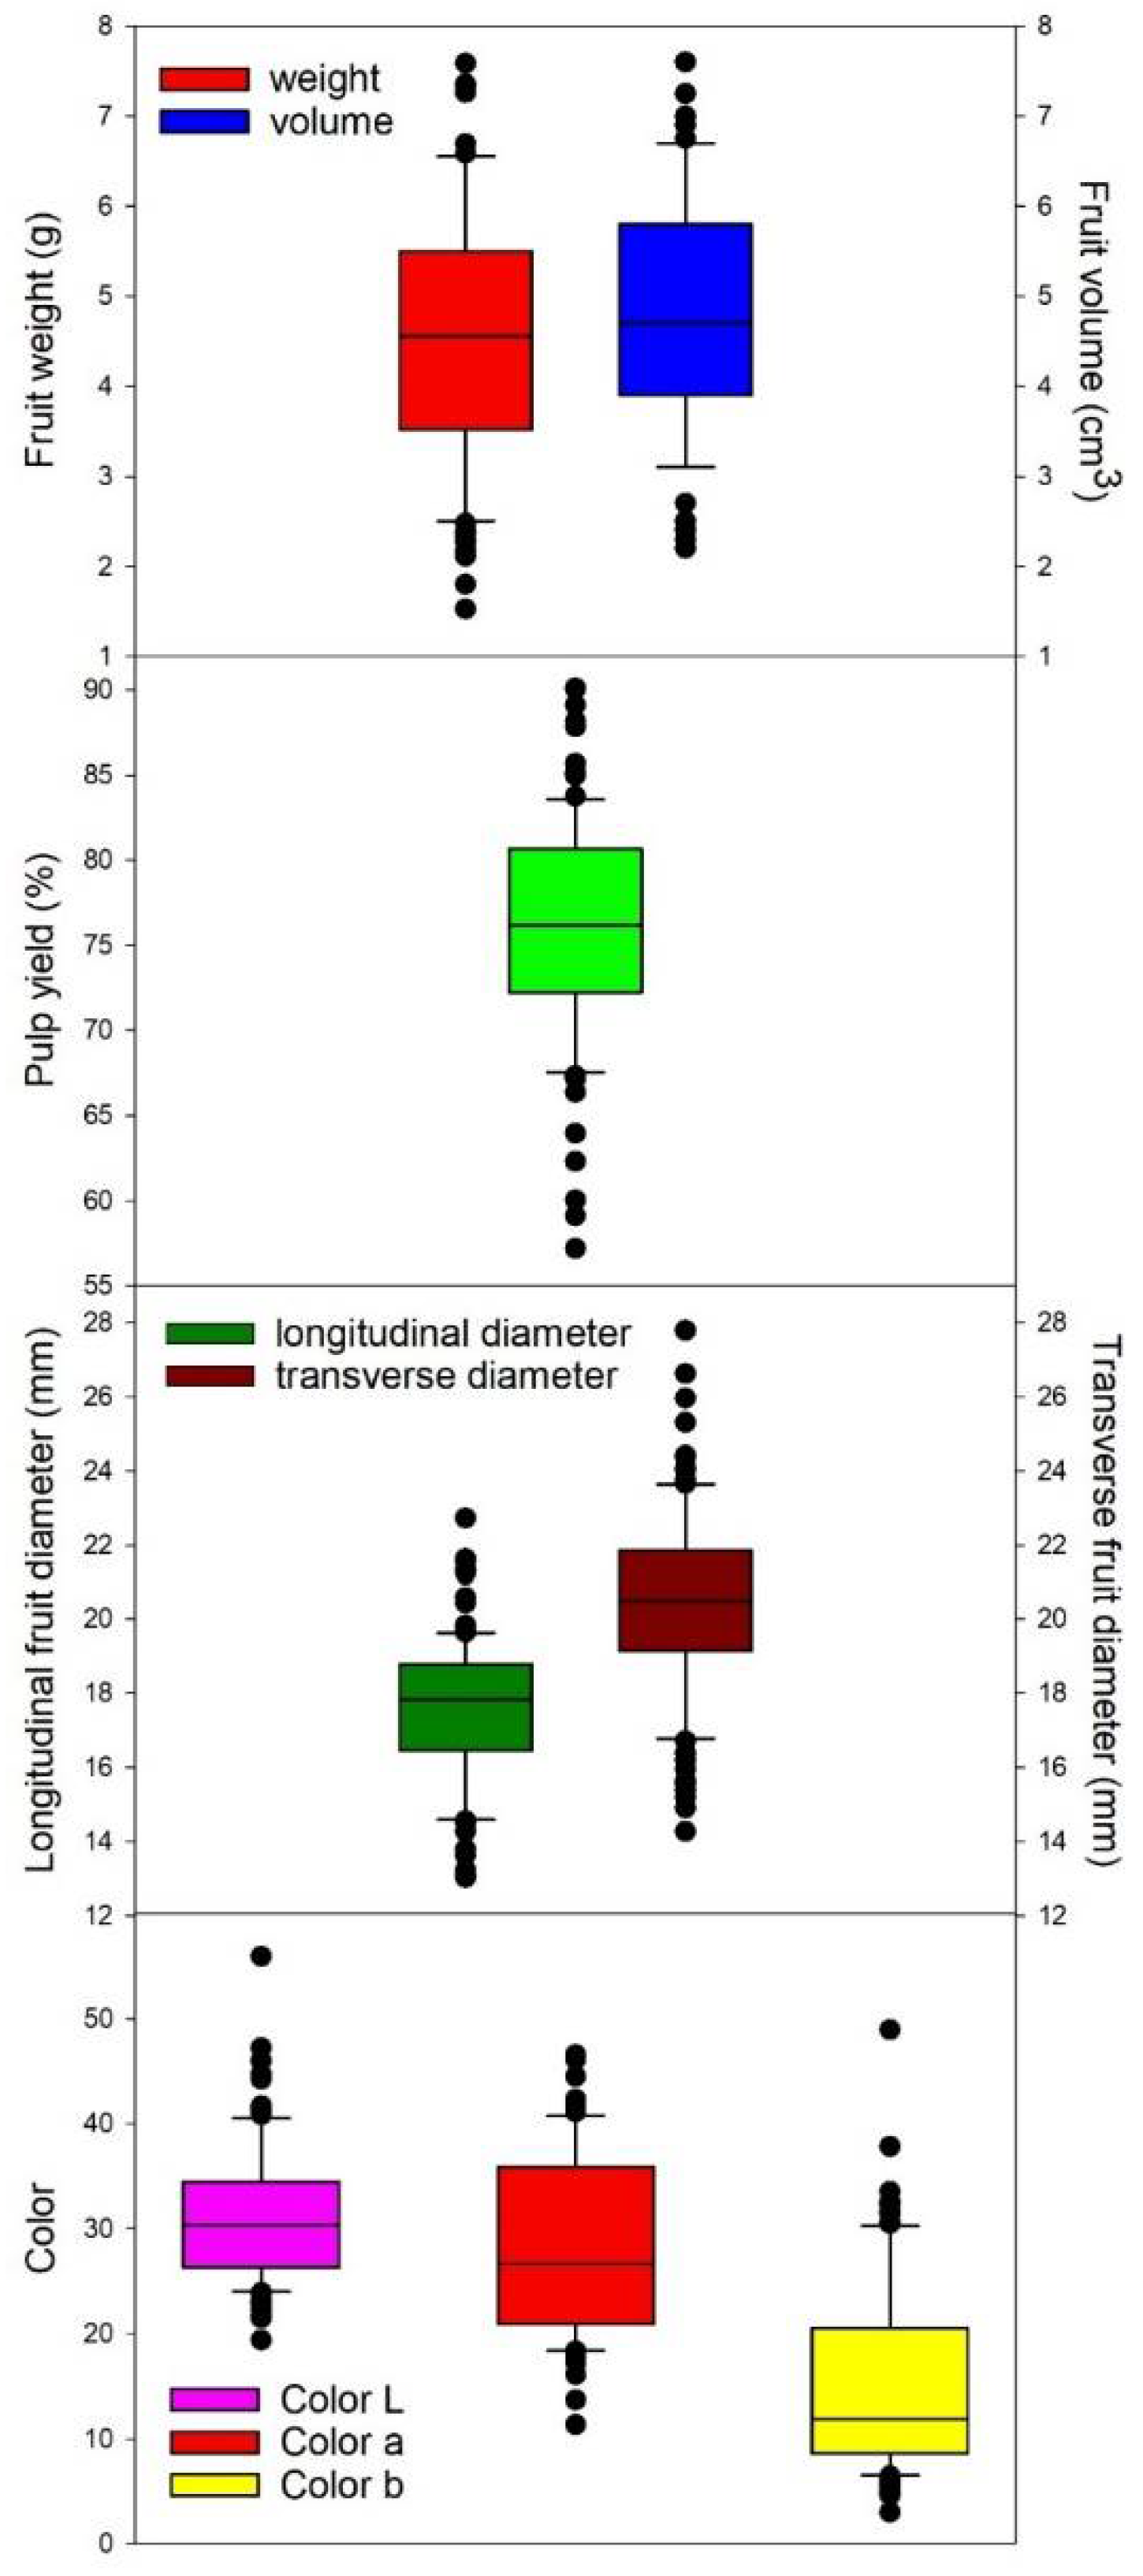
3.1. Morphological Characteristics of Acerola Fruits

The acerola fruits from the 103 phenotypes presented a large variability in terms of fresh weight, fruit volume, pulp yield, size and color parameters (Figure 3 and Table S1).
Fruit fresh weight varied from 1.53 g to 8.85 g with a mean value of 4.6 g and a median of 4.55 g (Figure 3 and Table S1). In 66% of the phenotypes, the mean fruit mass was over 4 g, the limit required by the industry [12] (Table S1). The range was within that reported in the literature, even though the minimum values were slightly lower (Table S3). Fruit volume varied from 2.2 cm3 to 9.40 cm3 with a mean value of 4.85 cm3 and a median value of 4.70 cm3 (Figure 3 and Table S1). The range was within that reported by Magalhães et al. [42] even though maximum values were higher (Table S3). Pulp yield ranged from 57.2% to 90.1% with a mean value of 76.05% and a median of 76.14% (Figure 3 and Table S1). These values are within the range reported by other authors [15,42,43], but with higher maximum values than those recorded by Carpentieri-Pípolo et al. [29] in northern Paraná, and in other areas of Brazil by Cavalcante et al. [22] (Table S3); they were even higher than the range recorded by Gomes et al. [11]. Data reported in Table S1 show that 6.8% of the phenotypes had a pulp yield of around 84%, which is a good amount for the pulp processing industry [42]. According to Magalhães et al. [42], this is an essential quality characteristic of acerola destined for processing, because it directly affects the cost/benefit ratio. The longitudinal diameter of the fruit ranged from 13.0 to 22.7 mm with a mean value of 17.5 mm and a median value of 17.8 mm. The transverse diameter ranged from 14.3 to 27.8 mm with a mean value of 20.4 mm and a median value of 20.5 mm (Figure 3 and Table S1). These ranges were slightly greater than those reported by Carpentieri-Pípolo et al. [29] who reported a mean longitudinal diameter between 9.40 and 18.60 mm and a transverse diameter between 8.53 and 17.40 mm, but they were within the ranges reported by others (Table S3). Only 2% of the phenotypes had transverse diameters less than 15 mm (numbers 67 and 75), the value which, according to Semensato and Pereira [12], is recommended for industrial use (Table S1). The analysis of longitudinal and transverse diameters showed that the fruit is wider, than long. According to Gonzaga Neto et al. [32], the larger the fruit, the easier and quicker it is to harvest because there is less labor involved and, consequently, production costs are reduced and the fruit is more attractive for consumption [42]. The colors of the acerola phenotypes varied greatly. The brightness index L ranged from 19.4 to 55.9 with a mean value of 31.2 and a median value of 30.4 (Figure 3 and Table S1). Similar high L values were observed by Mariano-Nasser et al. [16] and by Brunini et al. [43], while the lower values were lower than those reported in the literature (Table S3). Looking at the box plot, it can be seen that the L parameter of half of the phenotypes was over the median value, and the other half below, which is in agreement with data reported by Godoy et al. [29] (Figure 3). Parameter color a, corresponding to red, ranged from 11.3 to 46.6 with mean value of 28.3 and a median value of 26.6 (Figure 3 and Table S1), which was a wider range than those reported by Mariano-Nasser et al. [16] and by Figueiredo Neto et al. [20] (Table S3). Parameter color b, corresponding to yellow, showed an even wider range, ranging from 3.0 to 48.9, with a mean value of 14.9 and a median value of 11.9; both the mean and the minimum values were within the ranges reported in the literature (Table S3), but the maximum values were much higher (Figure 3 and Table S1). The comparison of color a and color b showed that yellow is predominant with respect to red, in agreement with Godoy et al. [30], except for two phenotypes (numbers 15 and 102) in which red is dominant, as indicated by the round symbols above the box (Figure 3 and Table S1). With the exception of phenotypes numbers 15 and 102, all the phenotypes were within the specifications required by the pharmaceutical industry that prefers orange colored acerola [12], discarding purple and yellow ones [60]; in fact, in agreement with Loápez [61], fruits are harvested when they begin to turn a pinkish-orange or light-red.

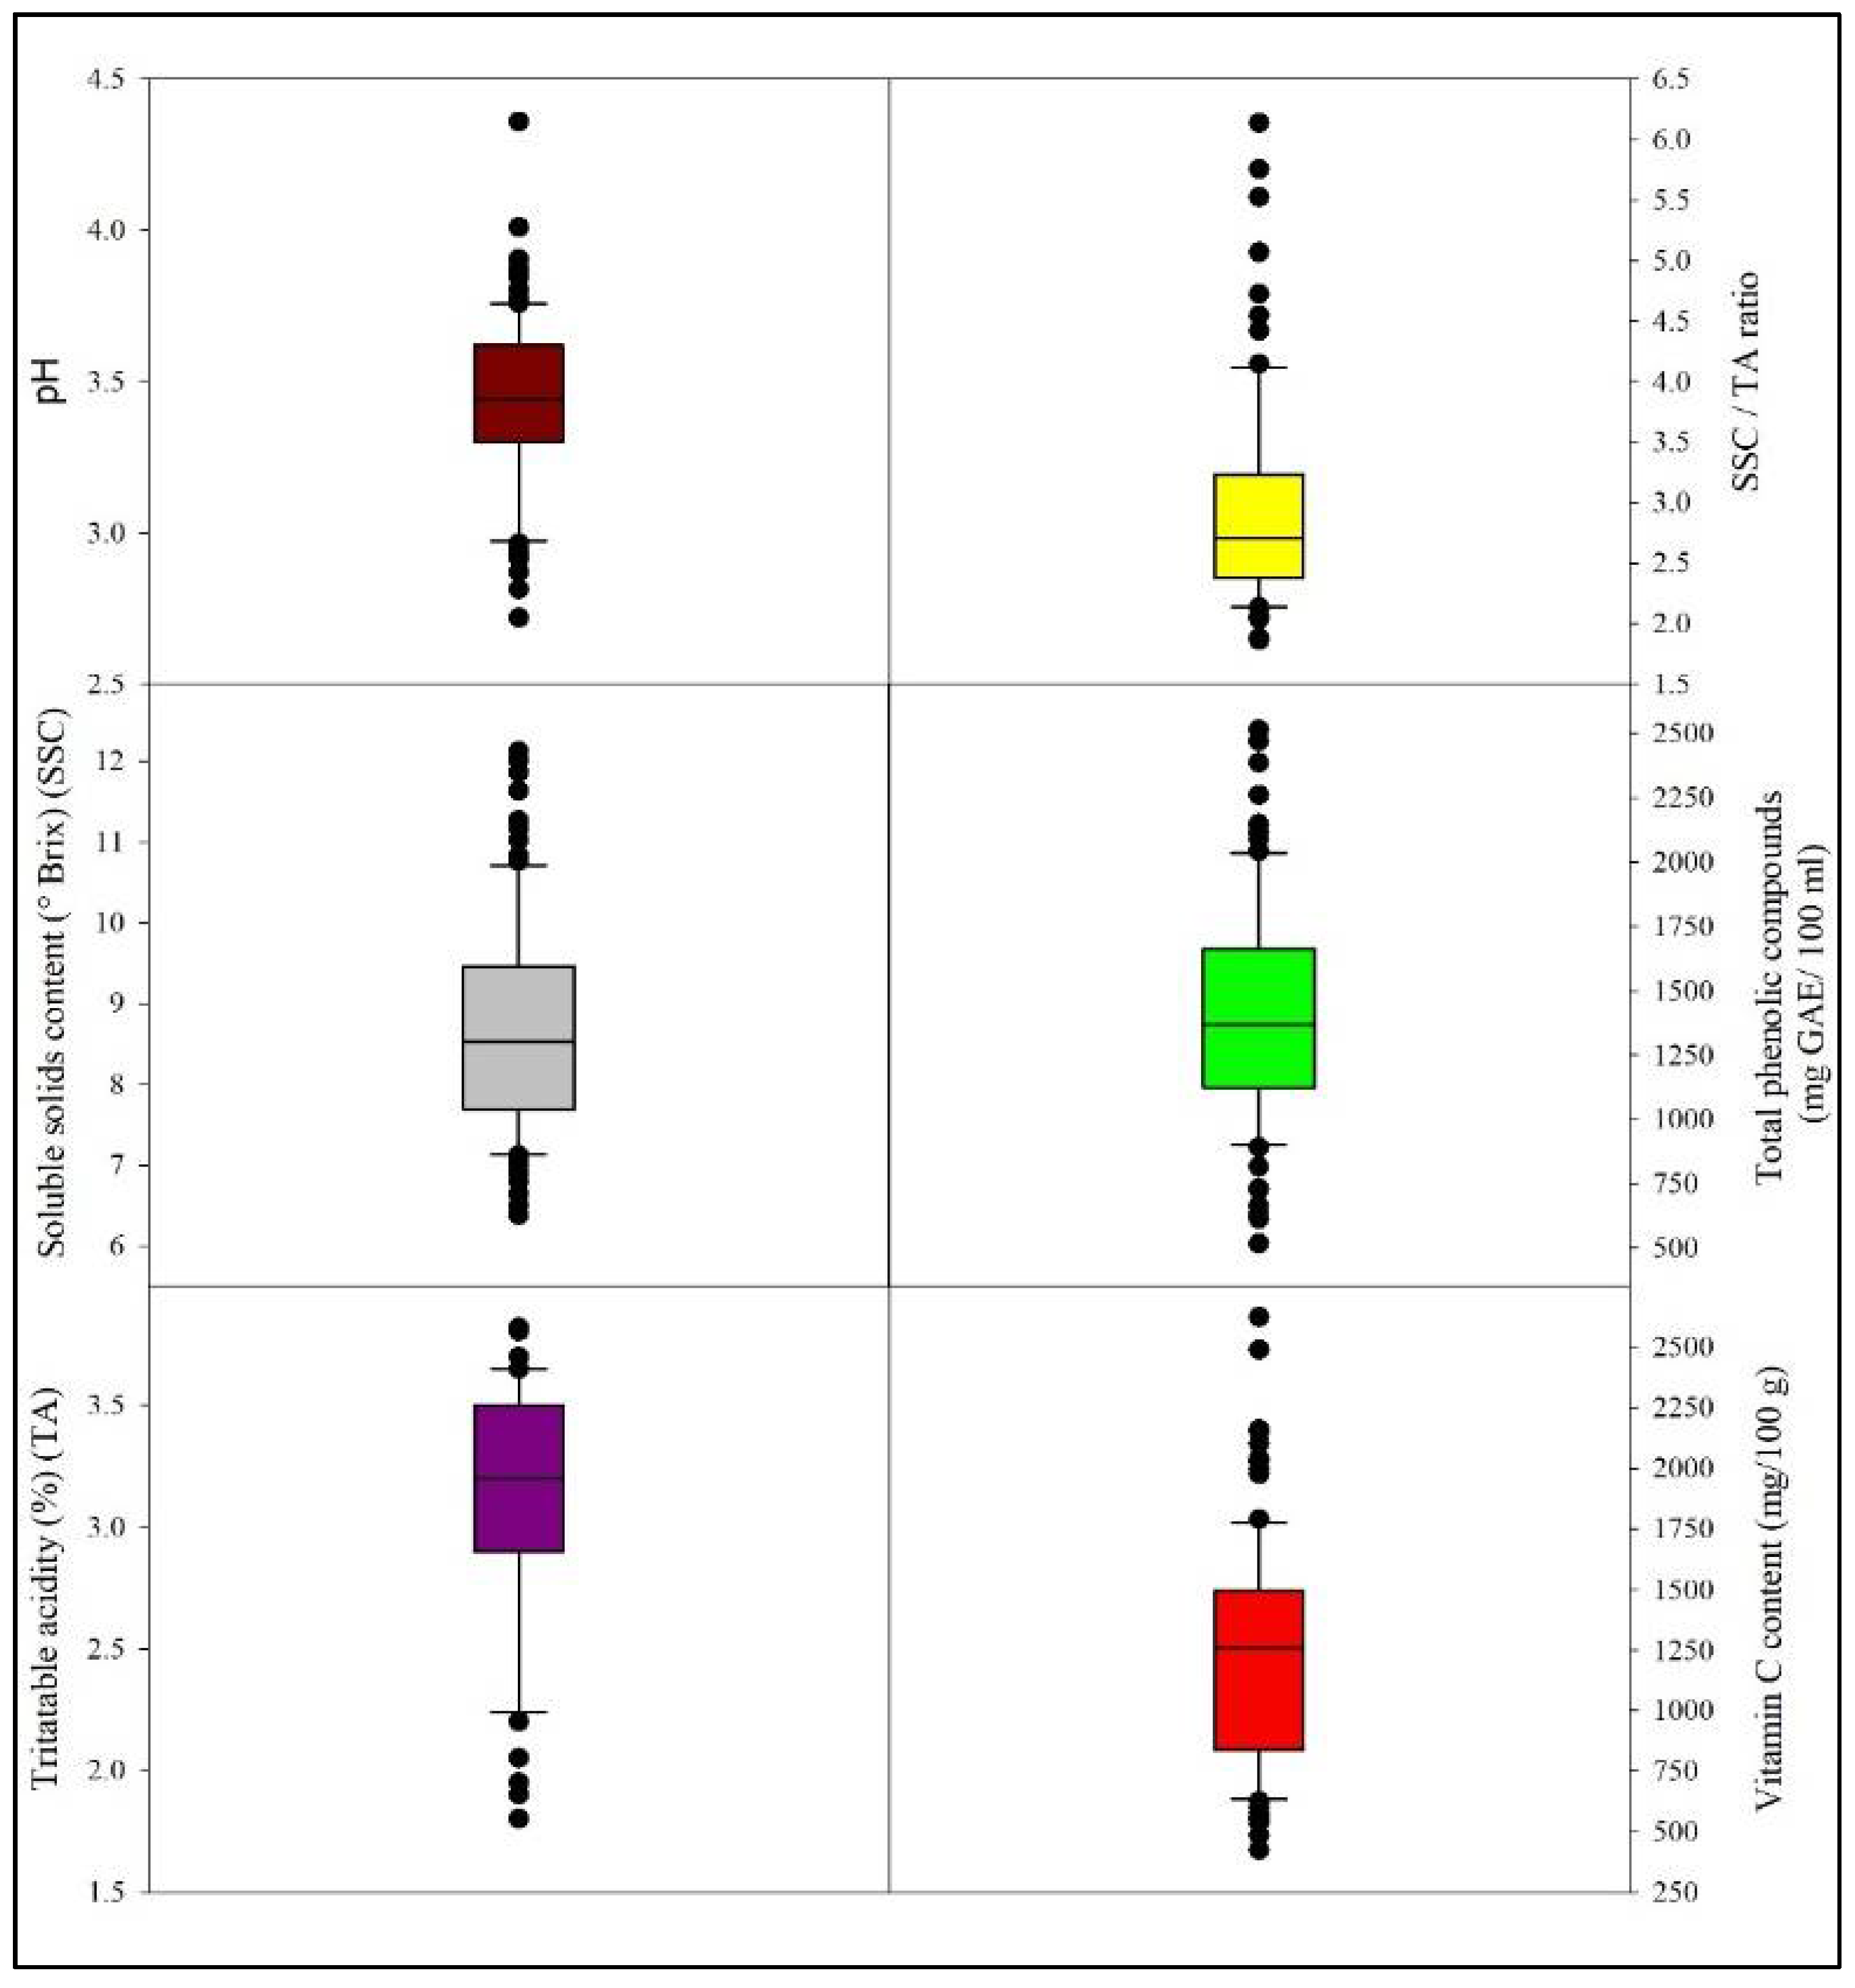
3.2. Chemical Characteristics of Acerola Fruits

The acerola fruits had a high variability in terms of vitamin C content, soluble solids, titratable acidity, pH, soluble solids/titratable acidity ratio and total polyphenols (Figure 4 and Table S2). The fruit SSC varied from 6.4° Brix to 12.1° Brix, with a mean value of 8.7 and a median of 8.5, in agreement with Musser et al. [31], who reported a range of 5–12° Brix in relation to different edaphoclimatic conditions in Brazil (Figure 4).
The variations in the present study were similar to those described by several authors [15,20,27,29,33] (Table 1). Carpentieri-Pípolo et al. [29] reported the highest SSC values with means between 8.0 and 15.8° Brix in acerola accessions from the northeastern region of Paraná. High values of SSC are important for consumption as fresh or processed fruit. Loápez [61] showed the SSC increased as the fruit ripened, or as the season progressed, and that it can be used as a ripening index. According to Alves et al. [62] normal maturation occurs when fruits are harvested with at least 6.5% soluble solids. All the phenotypes had values over this threshold except for number 16, which was slightly lower (6.38° Brix) (Table S2). The pH varied from 2.72 to 4.36 with a mean value of 3.43 and a median value of 3.44 (Figure 4 and Table S2). This range of variation is wider than that found in the literature (Table 1). It is noteworthy that, except for number 14, all phenotypes are in accordance with the specifications for fruit quality pulp determined by the “Ministério da Agricultura Pecuária e Abastecimento” (MAPA), which requires at least 5.5° Brix of soluble solids and a pH of 2.8 [63] (Table S2). In fact, pH is a very important parameter influencing the quality and safety of the fruit because it gives an indication of its storage potential (which is indicated by the development of acidity), and its assessment is very important in the industrial processing of fruit pulp. Titratable acidity (TA) varied from 0.4% to 3.8%, with a mean value of 3.1 and a median value of 3.2% (Figure 4 and Table S2). The lower values are similar to those reported in the literature, while the upper values are slightly higher than those described by Magalhães et al. [42], who reported values between 0.86 and 3.13% (Table 1). According to Nascimento et al. [64], high TA is important for fruit industrial processing, as it reduces the need to add artificial acidic substances, although this is not a limiting factor in genotype selection where other fruit quality parameters are satisfactory. On the other hand, low titratable acidity is important for consumption as fresh fruit [30,65]. The ratio between soluble solids and titratable acidity ranged considerably from 1.86 to 18.62, with a mean of 2.95 and a median of 2.70 (Figure 4 and Table S2). This wide range of variation was closer to those described by Cavalcante et al. [22] (5.44–19.39) and by Souza [23] (5.98–15.42). The minimum values were slightly lower than those reported in the literature, but higher than those reported by Semensato and Pereira [12] (Table 1). The ratio between SSC and titratable acidity indicates the degree of balance between the sugar and organic acid content of the fruit, which is directly related to fruit flavor [13]. Therefore, it is an important variable in the selection of table varieties, even for acerola, because the higher the ratio is, the sweeter the fruit [33,42]. The vitamin C content of the 103 phenotypes varied from 425 mg to 2625 mg/100 g pulp, with a mean value of 1240 mg/100 g pulp and a median value of 1260 mg/100 g pulp (Figure 4 and Table S2). In fact, 75.7% showed a mean content over the minimum (800 mg/100 g) recommended for breeding programs by Brazilian law [30,63] (Figure 4 and Table S2). Moreover, 52.4% of the phenotypes had a mean content of vitamin C above the threshold of 1200 mg/100 g pulp recommended by the “Instituto Brasileiro de Frutas” [66] for industrial use and 68.9% exceeded the limit of 1000 required for export to Europe and Japan (Table S2) [15]. Phenotype numbers 14, 29, 4, 66, 60, 37 and 99 had the highest vitamin C content, ranging from 2025 to 2625 mg/ 100 g pulp (Figure 4 and Table S2). Our results gave the highest range of vitamin C content among those reported in the literature, except for that reported by Figueiredo Neto et al. [20] in Petrolina (Pernambuco State) in two commercial cultivars (Okinawa and Sertaneja), with a maximum value of 3597 mg/ 100 g pulp (Table 1). However, our results are close to those reported by Carpentieri-Pípolo et al. [29], who analyzed fourteen genotypes of acerola in Northern Paraná State, obtaining values between 471 and 2404 mg/100 g pulp in ripe fruits (Table 1) and by Oliveira et al. [28], who analyzed 48 accessions in Itaocara (Rio de Janeiro State) and obtained values between 1116 and 2575 mg/100 g pulp in ripe fruits and by Nasser and Zonta [67] and Mariano-Nasser et al. [16], who obtained values between 825 and 2580 mg/100 g pulp in Adamantina (São Paulo State) (Table 1). The polyphenol content in the acerola fruits was also quite variable, ranging from 84 mg/kg to 3196 mg/kg with a mean value of 1397 mg/kg, a median value of 1367 mg/kg (Figure 4 and Table S2). Phenotype number 40 gave an exceptionally high value, equal to 3196 mg/kg. However, nearly 50% of the phenotypes had a polyphenol content ranging from 1173 to 1704 mg (Figure 4 and Table S2). Moreover, as vitamin C and polyphenol contents are of great interest to the pharmaceutical industry, these phenotypes have potential for use as clonal varieties. Although polyphenols are important in this fruit, there have been very few studies in acerola (Table 1). In fact, they are an excellent source of antioxidant activity and contribute to fruit color and flavor quality, producing astringency and bitterness [68]. Souza et al. [23] found values from 1562 to 2631 mg of gallic acid 100 g−1 of pulp; Mariano-Nasser et al. [16] reported values from 914 to 2428 mg of gallic acid 100 g−1 of pulp and França et al. [69] reported values from 1016 to 1801 mg of gallic acid 100 g−1 of pulp. However, the range of variation in these three studies was lower than the current study.
We assume that the physical and biochemical variations among the 103 phenotypes are due to intrinsic genetic differences [11,14,15,16,33,70] rather than to environmental, ripening and storage conditions since all samples were collected in the same area of Marechal Cândido Rondon city, at the same maturation and storage conditions (see Section 2).

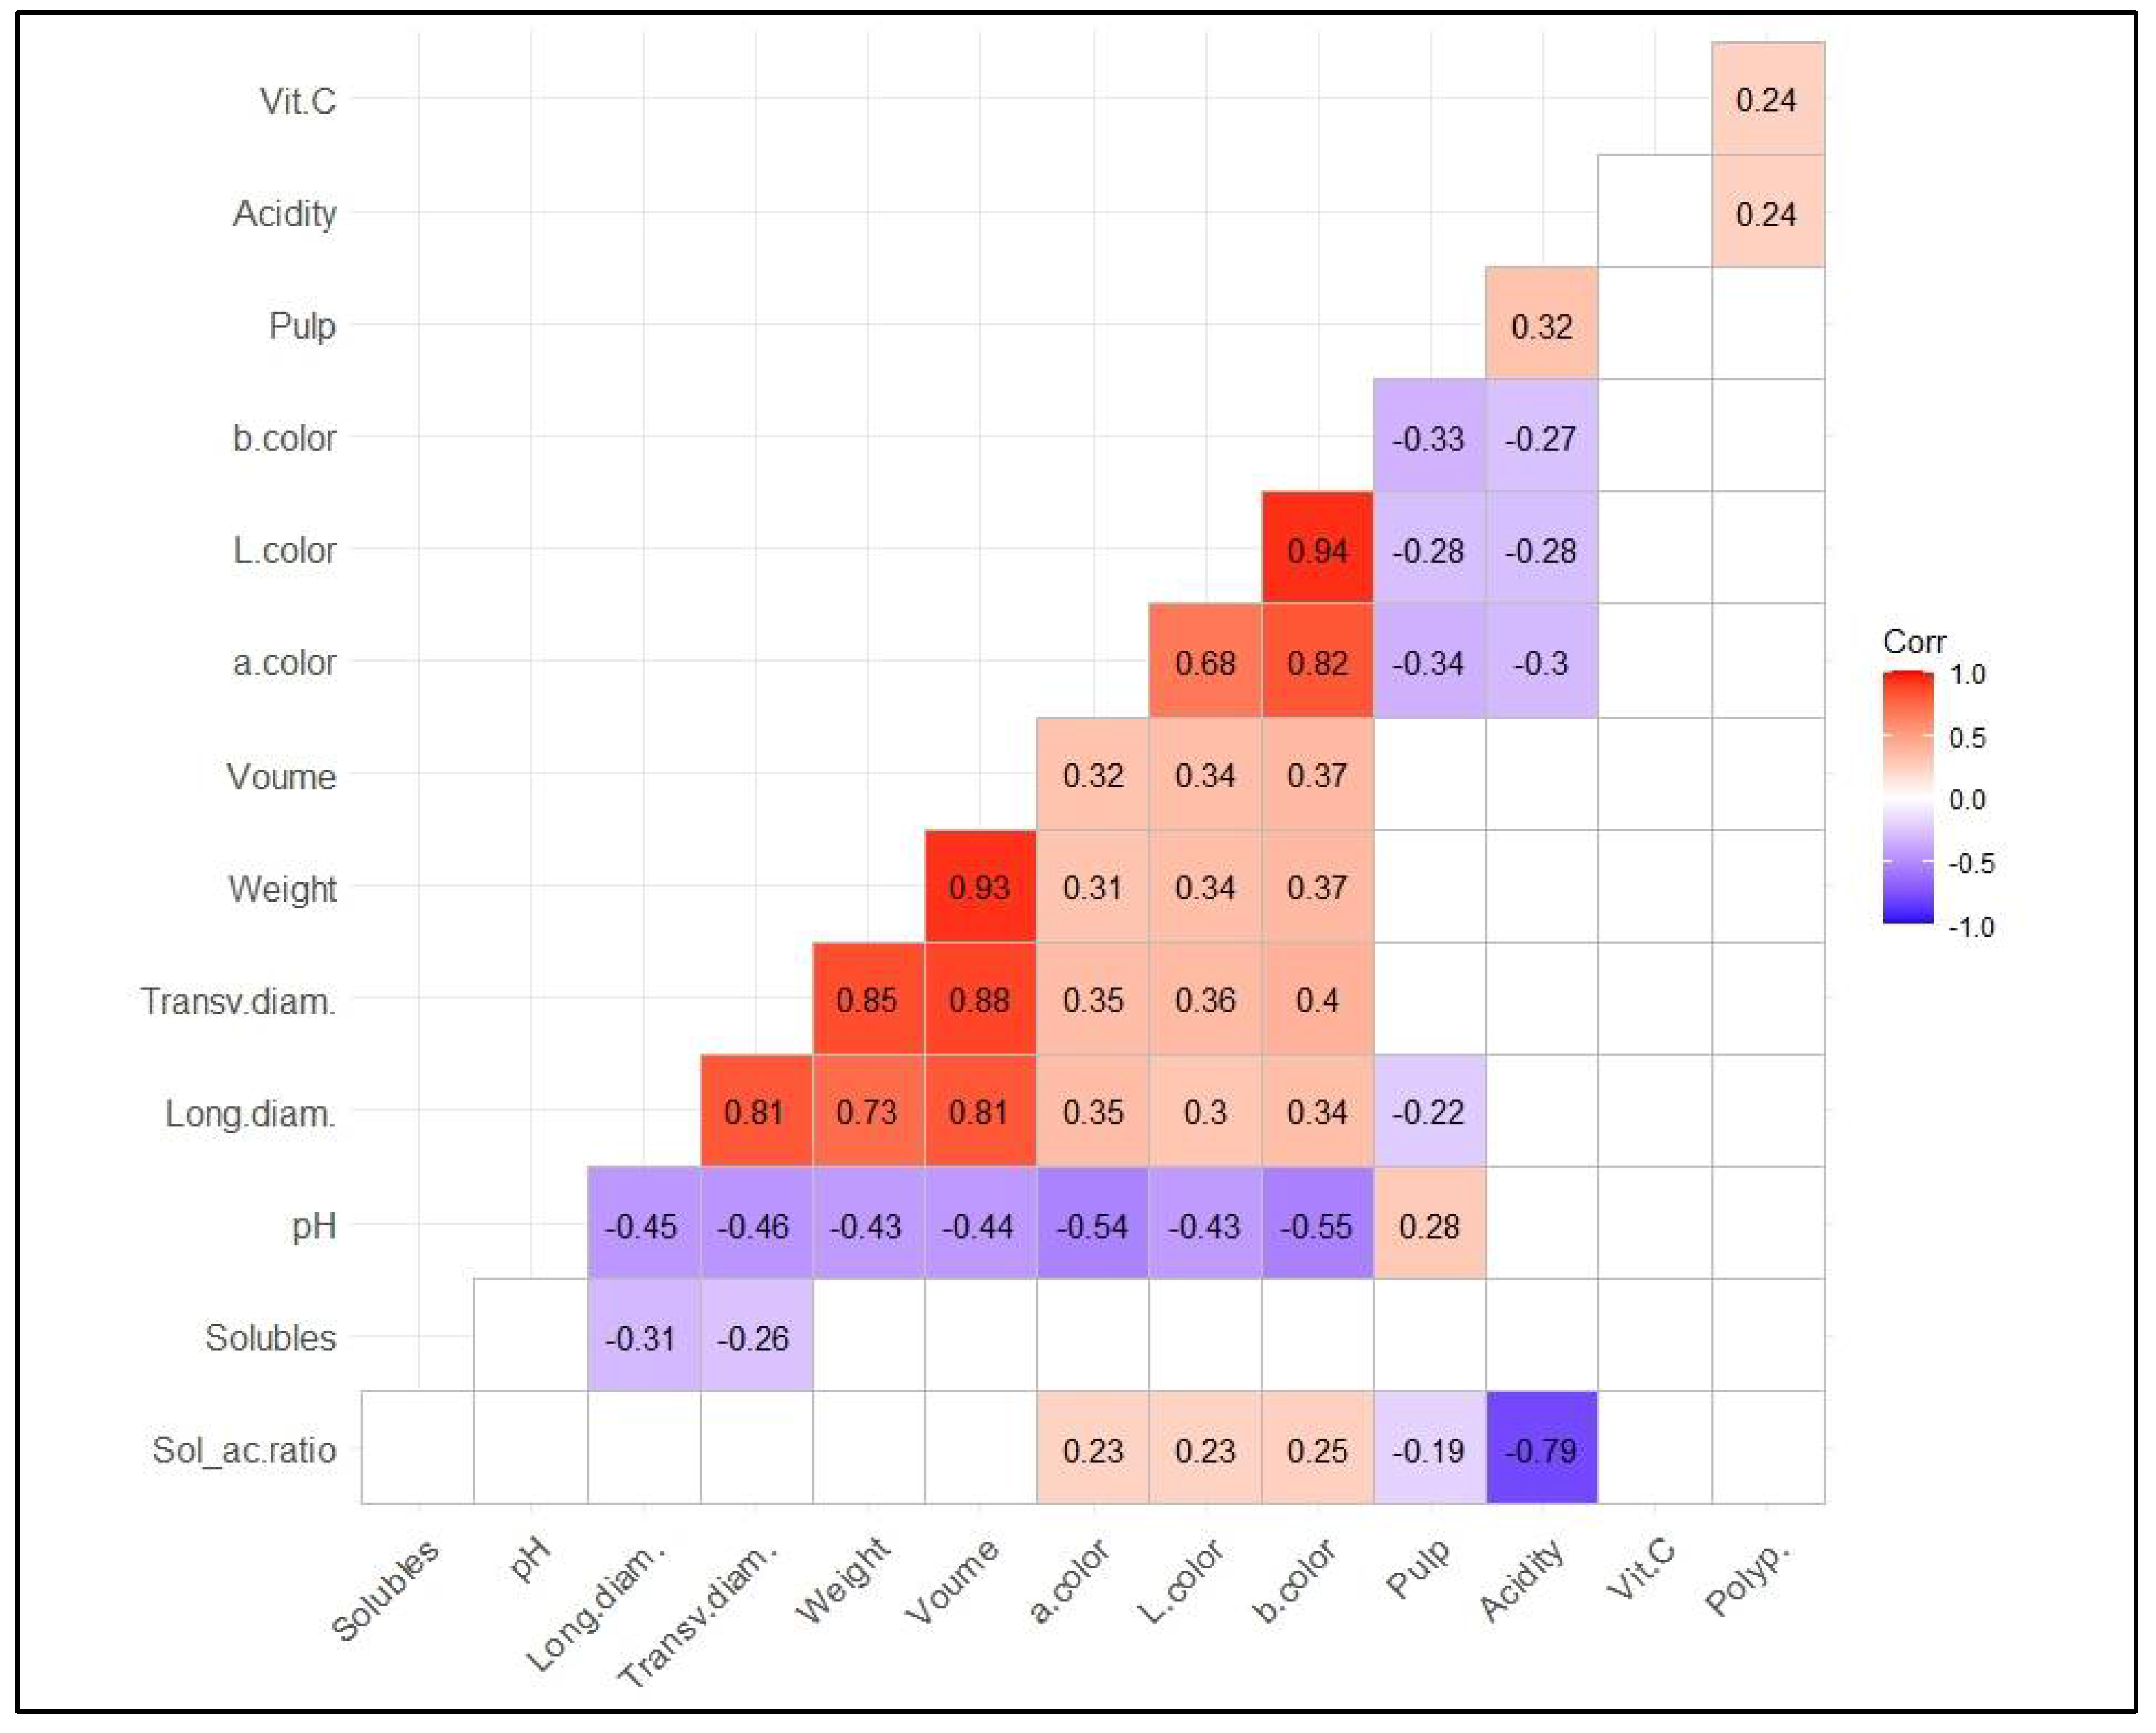
3.3. Correlations among Variables

Pearson’s correlation analysis was performed to examine the relationships among the fruit quality parameters. The results are shown in Figure 5.
Color traits showed the highest number of correlations (Figure 5). In particular, L, a and b were positively correlated with fruit size, but were negatively correlated with percentage of pulp, titratable acidity and pH (r = −0.55 for b color). Color is one of the most important factors in consumers’ decisions and hence affects the price of the fruit. pH influences the color of anthocyanins, and their stability and enzymatic coloration is also favored by lower pH values [71,72,73]. There were no significant correlations between vitamin C and fruit size (Figure 5). pH and SSC were negatively correlated with longitudinal diameter (r = −0.45), transverse diameter (r = −0.46), fruit weight and fruit volume (r = −0.43 and −0.44, respectively), so the larger the fruit size, the lower the pH and SSC, probably due to a dilution effect [74,75]. Fruit size, in terms of longitudinal and transversal diameter, was negatively correlated with pH and SSC. Furthermore, vitamin C and polyphenols were low, but significantly (p < 0.05) correlated (r = 0.24). This correlation, also reported by França et al. [69], can be explained as the fruit’s response to progressive oxidative stress. In fact, with ripening there is a reduction in oxygen scavenging enzyme activities and an increase in membrane lipid peroxidation, indicating that acerola ripening is characterized by progressive oxidative stress [3]. Moreover, enzymes such as ascorbate oxidase or peroxidase may accelerate ascorbic acid oxidation during ripening and therefore lead to its reduction [69]. In a recent review, Prakash and Baskaran [3] also reported that with ripening, vitamin C decreases and phenols degrade; the decrease in total vitamin C and total soluble phenol content reduction determine lower total antioxidant activity. Even if the reduction in vitamin C has a much more significant influence on acerola antioxidant capacity than phenolic compounds [7], the high capacity of ripe acerola fruits to sequester free radicals is due to their high content of vitamin C, in agreement with França et al. [69]. Although vitamin C content had a wide range of variation in the 103 phenotypes, there was no correlation with other fruit quality parameters (Figure 5).

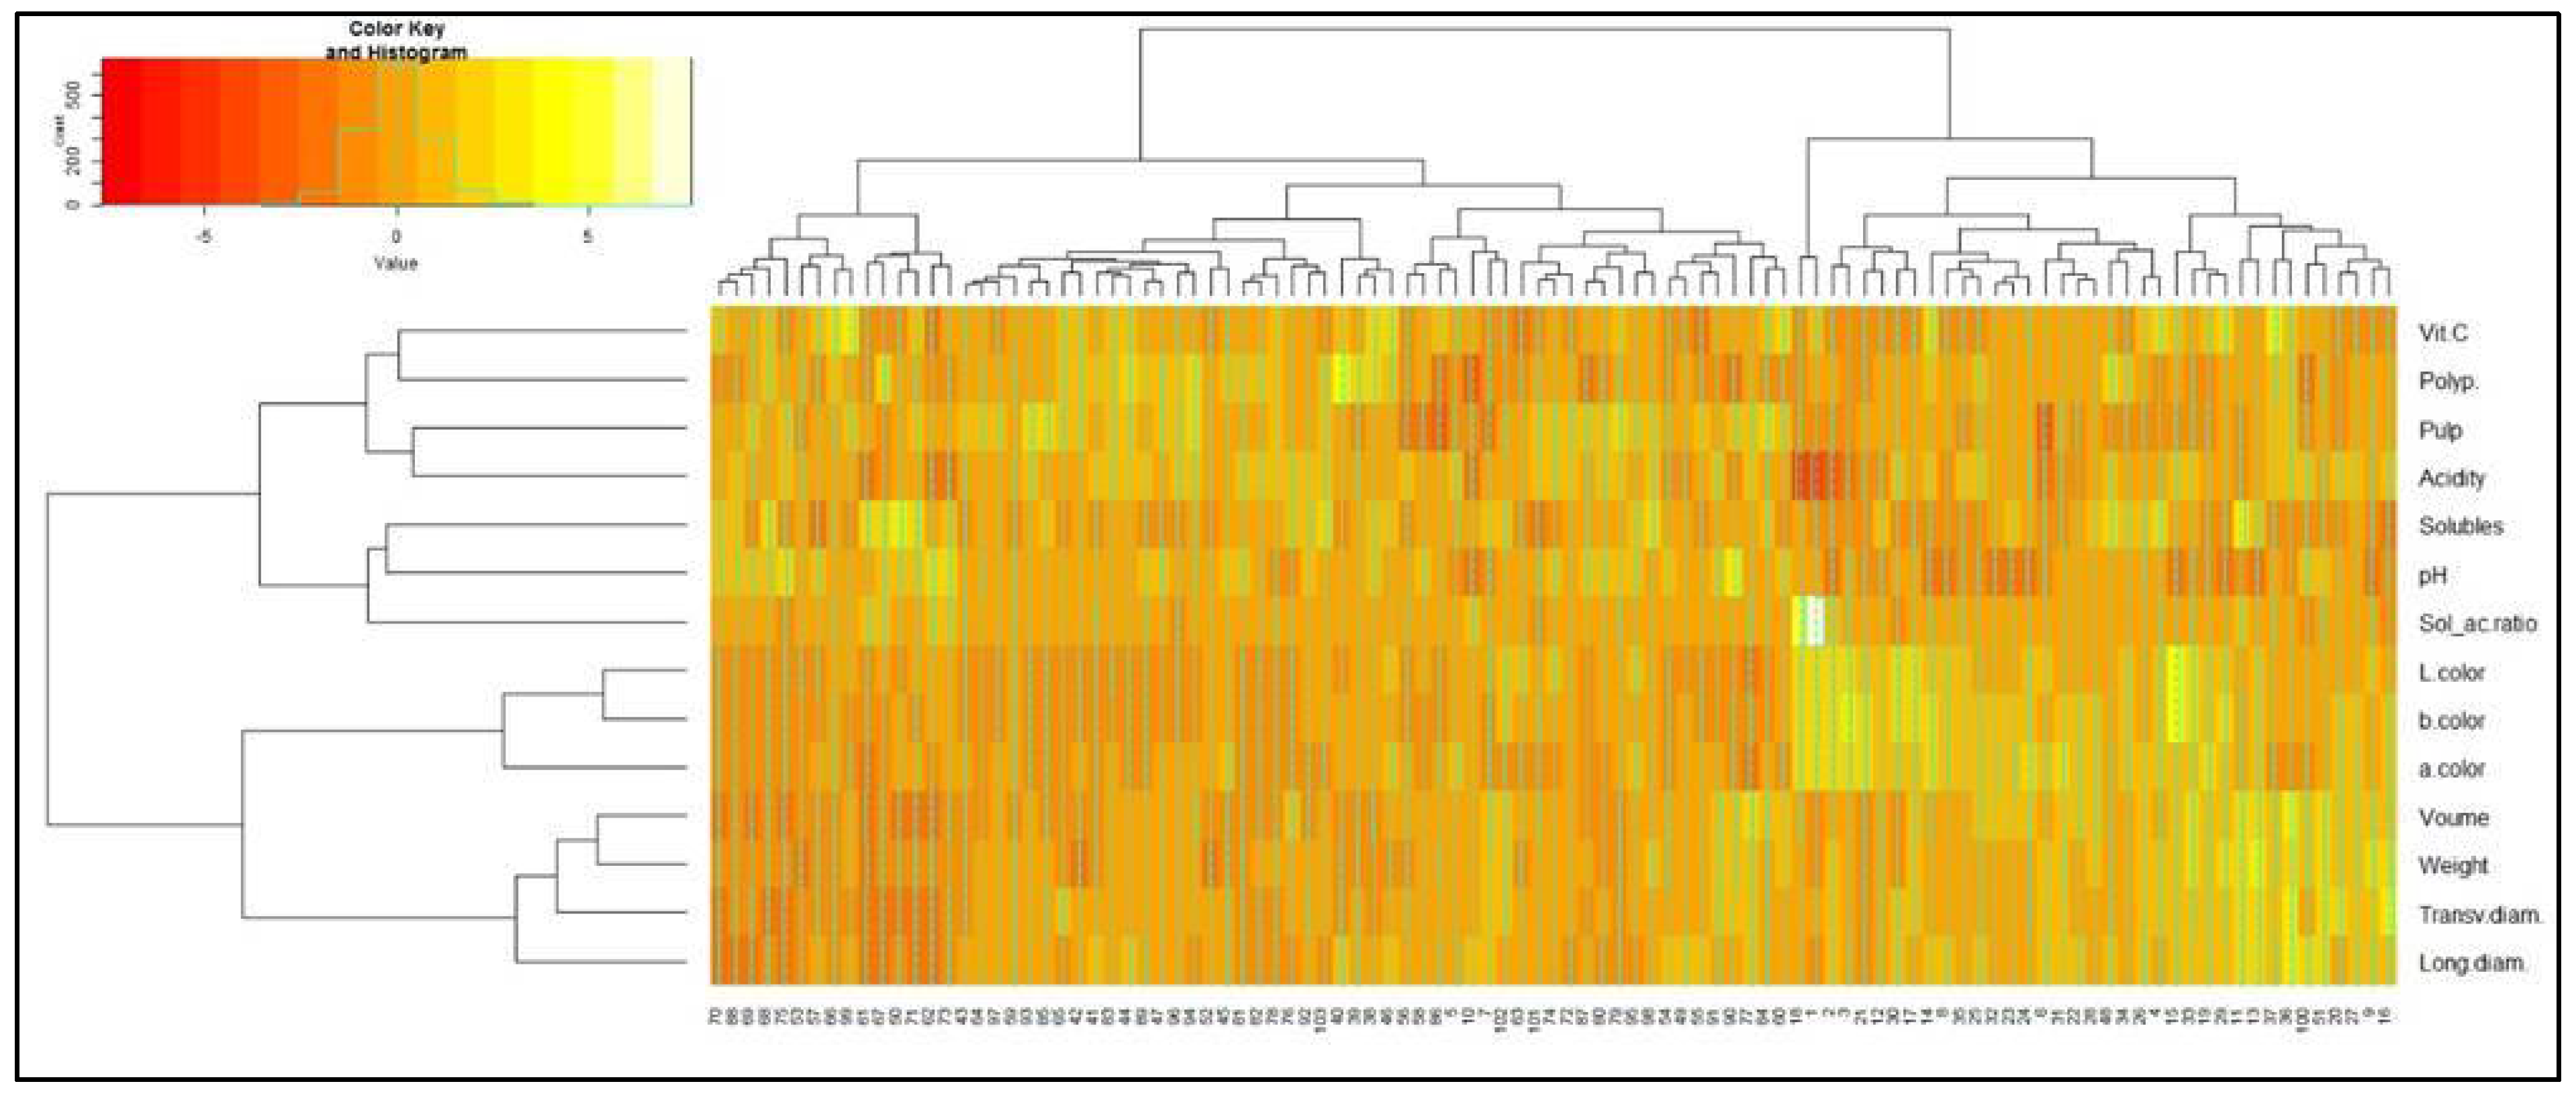
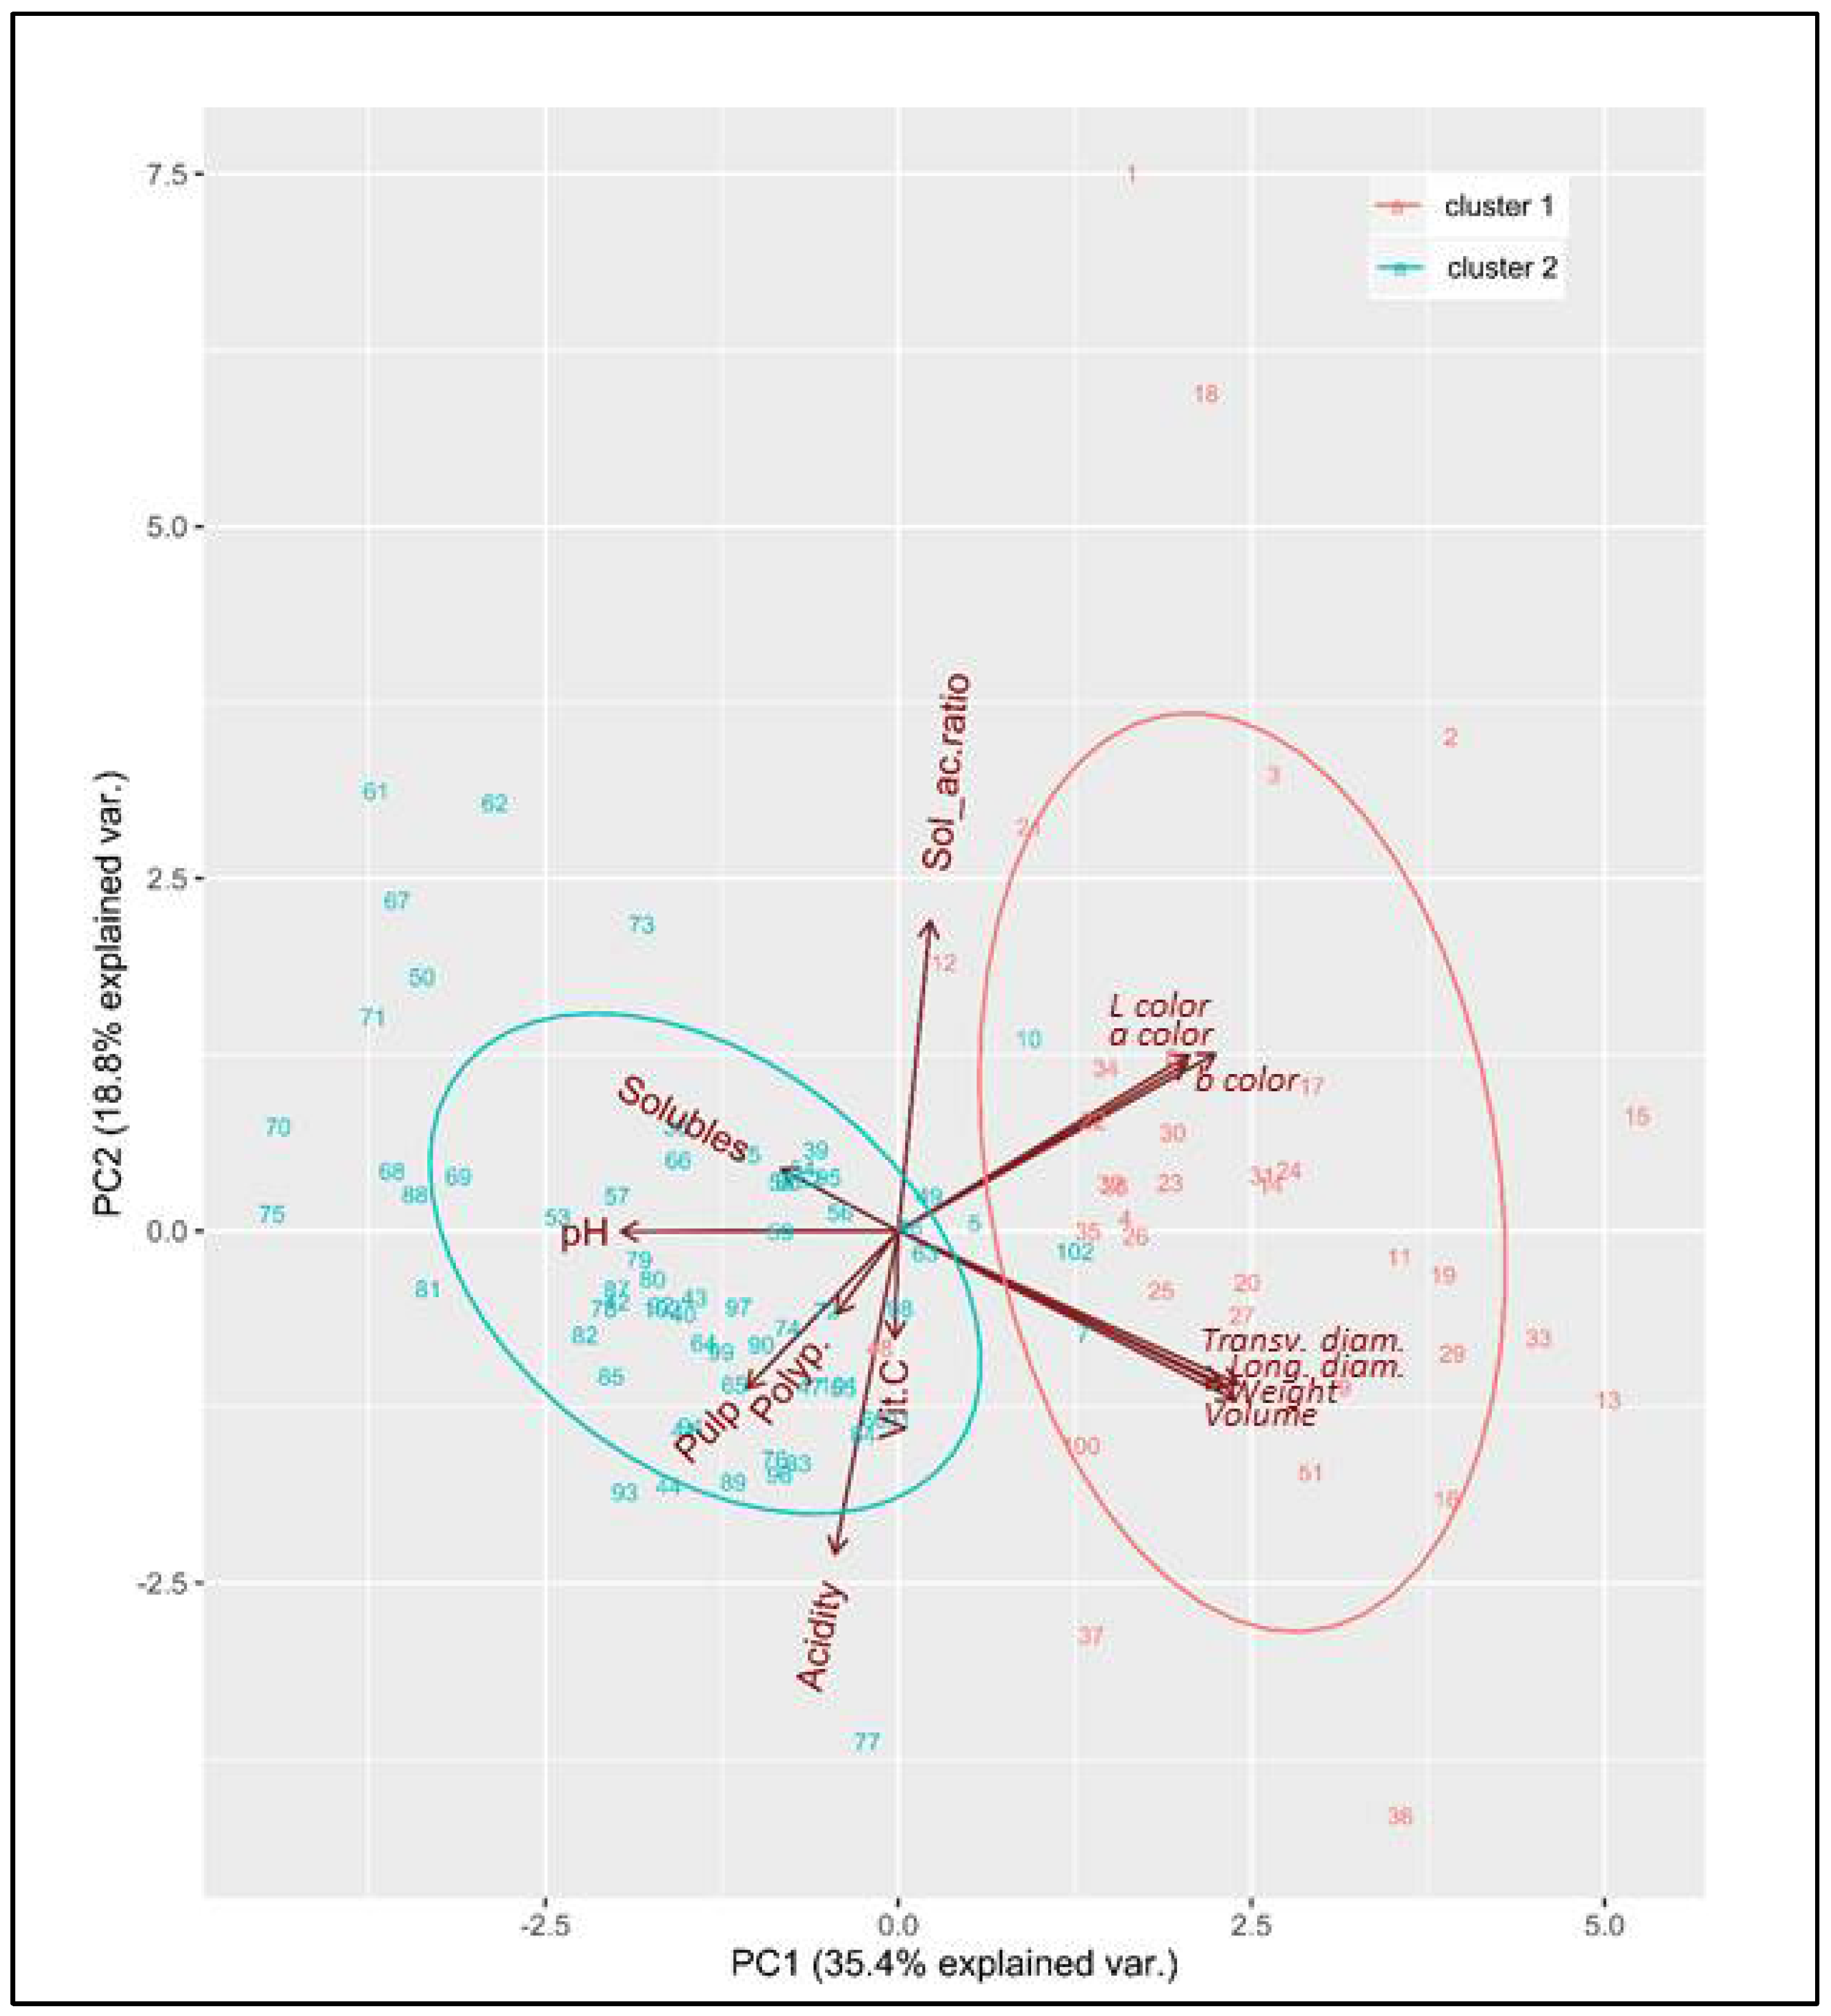
3.4. Classification of Acerola Phenotypes

The heat map row and column dendrogram, based on hierarchical clustering (Euclidean distances and Ward’s method) classification, provides a framework for exploring how the parameters may explain phenotypical differences among samples. It reveals information about how the samples and variables cluster together and provids insights into potential sample biases. The results reveal two distinct sample and variable clusters (Figure 6).
As observed from the color gradient (red = low intensity; yellow = high intensity), Ward’s linkage shows that fruit size and color parameters were the main sample clustering factors. Biochemical parameters presented a mixture of high and low values in both clusters. Cluster 1 encompassed 37 phenotypes. It was mostly characterized by relatively high intensity color parameters and fruit size. Moreover, two sub-groups could be traced. They differed based on color intensity and exhibited a pattern of divergence with weight and size parameters. Cluster 2 contained the largest number of samples (66). It was mainly characterized by low intensity color parameters that mostly overlapped with small fruit size and weight. It included great variability in the biochemical compounds with many samples having a high content of vitamin C, polyphenols and SSC. Samples from Cluster 2 were the most similar in terms of weight, volume and color. Biochemical parameters presented no clear clustering and were mixed inside each subgroup. However, the lowest values of pH and titratable acidity were correlated with the sub-cluster with high intensity color parameters, confirming the negative correlation between pH and color parameters (Figure 5). The soluble solids/titratable acidity ratio displayed relatively stable values in all the clusters, except for sample 1, which had the highest ratio (Table S2). The co-phenetic correlation coefficient calculated for the two main clusters was 0.7101, indicating the adequacy of the clustering method [76].
PCA was performed on the complete dataset to explore the variability among samples by combining all physical and biochemical parameters and to quantify the contribution of each parameter in determining the two main clusters obtained by HCA. The scatter plots shown in Figure 7 and Figure 8 show the geometrical distances among the 103 phenotypes within the bi-dimensional plane defined by the PC1-PC2 and PC1-PC3 variables.
The two sample groups, differing by color, corresponded to the clusters defined by HCA. Almost 55% of the total variance was explained by the first two PCs and 45.4% of the total variance is explained by PC1 and PC3. The main separation between the two clusters was obtained through PC1. The descriptors contributing the most in PC1 (35.4% of the total variance) were fruit size, color parameters and pH, confirming the results of the heat map cluster analysis (Figure 6). In particular, samples from cluster 1 (red symbols) showed higher values of fruit size and color parameters. Samples from cluster 2 (blue symbols) basically presented higher values of soluble solids, pH, polyphenols and pulp yield (Figure 7). The descriptors contributing the most in PC2 (18.8% of the total variance) were titratable acidity, and the soluble solids/titratable acidity ratio, the first being positively correlated with vitamin C (Figure 5). The descriptors contributing the most in PC3 (10.0% of the total variance) were polyphenols and vitamin C. Wide variability was also observed within each cluster. In particular, according to the PC1-PC2 plot, phenotypes from the upper-left position of the graph (Figure 7) showed the highest content of soluble solids and smallest fruit size. Conversely, phenotypes from the upper-left position of the graph (Figure 7) showed the largest fruit size but lower content of soluble solids. According to the PC1−PC3 plot, phenotypes that possessed negative values of PC3 (Figure 8) were characterized by the combination of high polyphenols and vitamin C content and lower values of soluble solids/titratable acidity ratio. The opposite biochemical characteristics were observed in phenotypes that possessed positive values of PC3 (Figure 8).
Cruz et al. [77] suggested performing crosses between parent accessions with the greatest possible divergence and good performance to increase heterosis and the chance of generating superior individuals; in fact, crosses between divergent phenotypes allows the heterotic effect to be exploited and segregating populations with greater variability in crosses to be obtained [28,78]. From an industrial point of view, acerola fruits from cluster 2 were the most interesting for their biochemical constituents, even if they had low average fruit size values (Figure 7, Tables S1 and S2).
The high performance of phenotypes 99 and 66, belonging to cluster 2, in terms of vitamin C and pulp yield could be decisive for increasing the vitamin C content in the acerola progeny. On the other hand, the high pulp yield, fruit size and vitamin C content in phenotype 37, belonging to cluster 1, indicate that this phenotype from the two classes of samples could be useful for crosses aimed at improving both the quality and yield of acerola (Figure 6, Figure 7 and Figure 9, Tables S1 and S2).
The suggested combination in breeding programs could produce promising progenies from which superior lines could originate. Anyway, phenotype 37, due to its superior chemical and physical characteristics, can already be propagated and compared with the most important acerola cultivars (Figure 5 and Figure 6, Tables S1 and S2). Four other phenotypes could be selected for their high content of vitamin C: numbers 4, 14, 29 (belonging to cluster 1) and number 60 (cluster 2); however, their fruit weight and pulp yield were outside the required parameters (Table S2). Therefore, together with the analysis of the performance of the phenotypes, studies on genetic divergence are of great importance for breeding programs because they assess the variability among phenotypes [37] and provide information for the identification of mother plants that can be used in crosses with a higher probability of obtaining superior progeny in the segregating generations [42,71]. However, it is not possible to capture the combining ability among parents based solely on their individual performance. The breeder must obtain crosses and evaluate the progenies or use techniques that allow a specific genotype combination to be predicted before the cross is performed [79]. Prospectively, the use of DNA markers to estimate genetic distances within the selected individuals will allow acerola phenotypes to be discriminated and the divergent phenotypes should be useful in genetic breeding [9,28].

4. Conclusions

This research explored the biochemical and morphological characterization, in terms of fruit quality, of 103 acerola phenotypes grown in the state of Western Paraná. A great variability was found in terms of fruit fresh weight, fruit volume, pulp yield, size and color parameters, similar to the findings of other studies conducted in other states of Brazil (as shown in Table 1 and Table S3). Similarly, vitamin C content, soluble solids, titratable acidity, pH, soluble solids/titratable acidity ratio and total polyphenols presented a high range of variability [15,20,27,29,31,33]. Fruit size was positively correlated with the color traits and negatively correlated with pH, SSC and pulp yield. Furthermore, vitamin C content was positively correlated with polyphenols [69].
The results of multivariate analysis revealed two distinct sample clusters. Phenotypes from cluster 1 showed higher values of fruit size and color parameters, while phenotypes from cluster 2 had higher values of SSC, pH, polyphenols, vitamin C and pulp yield. In particular, phenotypes numbers 37, 4, 14, 29 and the phenotype numbers 99, 60 and 66, belonging to the two different clusters, were the most interesting for the pharmaceutical industry or as a foodstuff supplement due to their high vitamin C content (2490, 2100, 2025, 2040, 2625, 2160 and 2150 mg 100 g−1 pulp respectively), yield (80.3, 70.1, 77.7, 76.8, 82.3, 83.0, and 74.8%, respectively) or higher values of fruit size (6.43, 6.05, 4.79, 7.33, 4.11, 5.64 and 3.11 g, respectively) and color parameters.
Specifically, the high performance of phenotypes 99 and 66, belonging to cluster 2, in terms of vitamin C and pulp yield, and phenotype 37, belonging to cluster 1, with high pulp yield, fruit size and vitamin C content, could be decisive for increasing vitamin C content in the progeny. Hence, these phenotypes from the two classes of samples could be useful for crosses aimed at improving both the quality and yield of acerola.
In conclusion, this characterization will make it possible to clonally propagate those phenotypes with desirable commercial characteristics, and will aid in the selection of useful traits desirable for the development of new, industrial-driven cultivars in future breeding programs.
In perspective, the selected phenotypes will be genotyped using microsatellite markers (SSR) to determine differences in the genetic make-up of the individuals and to develop and run a successful acerola breeding program in the state of Western Paraná state.

Supplementary Materials

The following are available online at https://www.mdpi.com/article/10.3390/agriculture11111078/s1, Figure S1: title; Table S1: Fruit characteristics and color parameters (mean ± S.E.) of 103 acerola phenotypes; Table S2: Chemical characteristics of the fruits (mean ± S.E.) of 103 acerola phenotypes; Table S3: Ranges of the principal physical characteristics of ripe acerola fruit reported in studies carried out in seven States of Brazil.

Author Contributions

Conceptualization, F.V. and D.F.; methodology, F.V. and D.F.; formal analysis, D.F., F.V. and S.P.; investigation, F.V., D.F.d.S., C.T., E.C.d.S., J.F.d.V. and G.M.d.S.; data curation, F.V., C.T. and D.F.d.S.; writing—original draft preparation, D.F., S.P. and F.V.; writing—review and editing, F.V., P.P. and D.F.d.S.; funding acquisition, F.V. and D.F. All authors have read and agreed to the published version of the manuscript.

Funding

This research was funded by CAPES (“Coordenação de Aperfeiçoamento de Pessoal de Nível Superior (CAPES)” and by “the University of Perugia and by Youth Fund—International Mobility for the stay granted in Brazil”. The research was carried out as part of the activity under the Cooperation Agreement between the University of Perugia and the University of West Paraná (Unioeste).

Institutional Review Board Statement

Not applicable.

Informed Consent Statement

Not applicable.

Data Availability Statement

Not applicable.

Conflicts of Interest

The authors declare no conflict of interest.

References

  1. Association of Official Agricultural Chemists. Official Methods of Analysis of AOAC International; AOAC International: Rockville, MD, USA, 2005. [Google Scholar]
  2. Ritzinger, R.; Ritzinger, C.H.S.P.R. Acerola. Addit. Inf. 2011, 32, 17–25. [Google Scholar]
  3. Mezadri, T.; Villaño, D.; Fernández-Pachón, M.S.; García-Parrilla, M.C.; Troncoso, A.M. Antioxidant compounds and antioxidant activity in acerola (Malpighia emarginata D. C.) fruits and derivatives. J. Food Compost. Anal. 2008, 21, 282–290. [Google Scholar] [CrossRef]
  4. Prakash, A.; Baskaran, R. Acerola, an untapped functional superfruit: A review on latest frontiers. J. Food Sci. Technol. 2018, 55, 3373–3384. [Google Scholar] [CrossRef]
  5. Rekha, C.; Poornima, G.; Manasa, M.; Abhipsa, V.; Devi, J.P.; Kumar, H.T.V.; Kekuda, T.R.P. Ascorbic acid, total phenol content and antioxidant activity of fresh juices of four ripe and unripe citrus fruits. Chem. Sci. Trans. 2012, 1, 303–310. [Google Scholar] [CrossRef]
  6. Ancos, B.; Fernández-Jalao, I.; Sánchez-Moreno, C. Compuestos funcionales en productos de Iv YV Gama. Rev. Iber. Tec. Post. 2016, 17, 130–148. [Google Scholar]
  7. Assis, S.A.; Fernandes, F.P.; Martins, A.B.G.; Oliveira, O.M.M.F. Acerola: Importance, culture conditions, production and biochemical aspects. Rev. Fruits 2008, 63, 93–101. [Google Scholar] [CrossRef] [Green Version]
  8. Xu, M.; Shen, C.; Zheng, H.; Xu, Y.; Xue, C.; Zhu, B.; Hu, J. Metabolomic analysis of acerola cherry (Malpighia emarginata D. C.) fruit during ripening development via UPLC-Q-TOF and contribution to the antioxidant activity. Food Res. Intern. 2020, 130, e108915. [Google Scholar] [CrossRef]
  9. Segtowick, E.C.D.S.; Brunelli, L.T.; Venturini Filho, W.G. Avaliação físico-química e sensorial de fermentado de acerola. Brazilian. J. Food Technol. 2013, 16, 147–154. [Google Scholar]
  10. Reis, E.F.; Pinto, J.F.N.; Assunção, H.F.; Silva, D.F.P. Diversidade genética de frutos de macaúba provenientes de 35 municípios de Goiás. Pesqui Agropecu Bras. 2017, 52, 277–282. [Google Scholar] [CrossRef] [Green Version]
  11. Belwal, T.; Devkota, H.P.; Hassan, H.A.; Ahluwalia, S.; Ramadan, M.F.; Mocan, A.; Atanasov, A.G. Phytopharmacology of acerola (Malpighia spp.) and its potential as functional food. Trends Food Sci. Technol. 2018, 74, 99–106. [Google Scholar] [CrossRef]
  12. Gomes, J.E.; Perecin, D.; Martins, A.B.G.; Almeida, E.J.D. Variabilidade fenotípica em genótipos de acerola. Pesqui Agropecu Bras. 2000, 35, 2205–2221. [Google Scholar] [CrossRef] [Green Version]
  13. Semensato, L.R.; Pereira, A.S. Características de frutos de genótipos de aceroleira cultivados sob elevada altitude. Pesqui Agropecu Bras. 2000, 35, 2529–2536. [Google Scholar] [CrossRef] [Green Version]
  14. Chitarra, M.I.F.; Chitarra, A.B. Pós-Colheita de Frutas E Hortaliças: Fisiologia e Manuseio, 3rd ed.; Editora UFLA: Lavras, Brazil, 2005; p. 785. [Google Scholar]
  15. Hanamura, T.; Uchida, E.; Aoki, H. Changes of the composition in acerola (Malpighia emarginata D. C.) fruit in relation to cultivar, growing region and maturity. J. Sci. Food Agric. 2008, 88, 1813–1820. [Google Scholar] [CrossRef]
  16. Maciel, M.I.S.; Mélo, E.; Lima, V.; Souza, K.A.; Silva, W. Caracterização físico-química de frutos de genótipos de aceroleira (Malpighia emarginata D. C.). Food Sci. Technol. 2010, 30, 865–869. [Google Scholar] [CrossRef] [Green Version]
  17. Mariano-Nasser, F.D.C.; Nasser, M.D.; Furlaneto, K.A.; Ramos, J.A.; Vieites, R.L.; Pagliarini, M.K. Bioactive compounds in different acerola fruit cultivares. Semina Ciências Agrárias 2017, 38, 2505–2514. [Google Scholar] [CrossRef] [Green Version]
  18. Ribeiro, B.S.; Freitas, S.T. Maturity stage at harvest and storage temperature to maintain postharvest quality of acerola fruit. Sci. Hortic. 2020, 260, e108901. [Google Scholar] [CrossRef]
  19. Santos, S.M.; Vasconcelos, A.M.; Oliveira, V.S.; Clemente, E.; Costa, J.M. Evaluation of physical and physicochemical characteristics of Malpighia emarginata D. C. from the state of Ceará. Int. J. Biochem. Res. Rev. 2012, 2, 152–163. [Google Scholar] [CrossRef]
  20. Ferreira, R.M.A.; Aroucha, E.M.M.; Souza, P.A.; Queiroz, R.F. Ponto de colheita da acerola visando à produção industrial de polpa. Rev. Verde Agro Des. Sust. 2009, 4, 5. [Google Scholar]
  21. Figueiredo Neto, A.; Reis, D.; Alves, E.; Gonçalves, E.; Anjos, F.D.; Ferreira, M. Determinação de vitamina e avaliação físico-química em três variedades de acerola cultivadas em Petrolina-PE. Nucleus 2014, 11, 83–92. [Google Scholar] [CrossRef]
  22. Furlaneto, F.P.B.; Nasser, M.D. Panorama da cultura da acerola no estado de São Paulo. Pesq. Tecn. 2015, 12, 1–6. [Google Scholar]
  23. Cavalcante, I.H.L.; Beckmann, M.Z.; Martins, A.B.G.; Campos, M.C.C. Preliminary selection of acerola genotypes in Brazil. Fruits 2007, 62, 27–34. [Google Scholar] [CrossRef]
  24. Souza, K.O.D.; Moura, C.F.H.; Brito, E.S.D.; Miranda, M.R.A.D. Antioxidant compounds and total antioxidant activity in fruits of acerola from cv. Flor Branca, Florida Sweet and BRS 366. Rev. Bras. Frut 2014, 36, 294–304. [Google Scholar] [CrossRef] [Green Version]
  25. Alvares, C.A.; Stape, J.L.; Sentelhas, P.C.; Gonçalves, J.L.M.; Sparovek, G. Köppen’s climate classification map for Brazil. Meteorol. Zeitschrift 2013, 22, 711–728. [Google Scholar] [CrossRef]
  26. Caviglione, J.H.; Kiihl, L.R.B.; Caramori, P.H.; Oliveira, D.; Galdino, J.; Borrozino, E.; Pugsley, L. Cartas Climáticas do Estado do Paraná; IAPAR: Londrina, Brazil, 2000. [Google Scholar]
  27. Ritzinger, R.; Ritzinger, C.H.S.P.; Fonseca, N.; Machado, C.F. Advances in the propagation of acerola. Rev. Bras. Frut. 2018, 40, e928. [Google Scholar] [CrossRef] [Green Version]
  28. Moura, C.F.H.; Alves, R.E.; Figueiredo, R.W.; Paiva, J.R. Avaliações físicas e físico-químicas de frutos de clones de aceroleira (Malpighia emarginata D. C.). Rev. Ciên Agron 2007, 38, 52–57. [Google Scholar]
  29. Oliveira, J.G.; Gomes Filho, A.; Pereira, M.G.; Viana, A.P.; Souza Filho, G.A.; Lopes, G.E.M. Diversidade genética de aceroleiras (Malphigia emarginata D. C.), utilizando marcadores moleculares RAPD e características morfoagronômicas. Rev. Bras. Frut 2009, 31, 162–170. [Google Scholar] [CrossRef] [Green Version]
  30. Godoy, R.C.B.; Matos, E.L.S.; Amorim, T.D.S.; Sousa Neto, M.A.; Ritzinger, R.; Waszczynskyj, N. Avaliação de genótipos e variedades de acerola para consumo in natura e para elaboração de doces. Bol. CEPPA 2008, 26, 197–204. [Google Scholar] [CrossRef] [Green Version]
  31. Musser, R.D.S.; Lemos, M.A.; Lima, V.L.A.G.D.; Mélo, E.D.A.; Lederman, I.E.; Santos, V.F.D. Características físico-químicas de acerola do banco ativo de germoplasma em Pernambuco. J. Food Sci. Technol. 2004, 24, 556–561. [Google Scholar] [CrossRef] [Green Version]
  32. Gonzaga Neto, L.; Mattuz, B.; Santos, C.A.F. Caracterização agronômica de clones de aceroleira (Malpighia spp.) na Região do Submédio São Francisco. Rev. Bras. Frut 1999, 21, 110–115. [Google Scholar]
  33. Estevam, M.I.F.; Souza, P.A.; Maracajá, P.B.; Batista, E.M.; Reges, B.M. Physicochemical of acerola varieties in two stages of maturation. Rev. Verde Agro Des. Sust. 2018, 13, 459–465. [Google Scholar] [CrossRef]
  34. Freitas, R.V.S.; Souza, P.A.; Coelho, E.L.; Silva, M.S.; Batista, E.M.; Ferreira, E.D.O. Caracterização Físico-Química de Variedades De Acerolas Em Dois Estádios De Maturação. In Proceedings of the VII Congresso Norte Nordeste de Pesquisa e Inovação. Palmas—Tocantins (CONNEPI); 2012. Available online: https://pdfs.semanticscholar.org/9a4a/502022e7fc307e16a10133dff12a52dcce1a.pdf (accessed on 28 October 2021).
  35. Carpentieri-Pípolo, V.; Destro, D.; Prete, C.E.C.; Gonzales, M.G.N.; Popper, I.; Zanatta, S.; Silva, A. Seleção de genótipos parentais de acerola com base na divergência genética multivariada. Pesqui Agropecu Bras. 2000, 35, 1613–1619. [Google Scholar] [CrossRef]
  36. Moura, N.F.; Chaves, L.J.; Naves, R.V. Caracterização física de frutos de pequizeiro (Caryocar brasiliense Camb.) do cerrado. Rev. Árv. 2013, 37, 905–912. [Google Scholar] [CrossRef] [Green Version]
  37. Almeida Júnior, E.B.; Chaves, L.J.; Soares, T.N. Genetic characterization of a germplasm collection of cagaiteira, a native species of the cerrado. Bragantia 2014, 73, 246–252. [Google Scholar] [CrossRef] [Green Version]
  38. Silva, V.A.; Machado, J.L.; Resende, J.C.; Oliveira, A.L.; Figueiredo, U.J.; Carvalho, G.R.; Ferrão, M.A.G.; Guimarães, R.J. Adaptability, stability, and genetic divergence of conilon coffee in Alto Suaçuí, Minas Gerais, Brazil. Crop. Breed. Appl. Biotechnol. 2017, 17, 25–31. [Google Scholar] [CrossRef] [Green Version]
  39. Shimono, H.; Farquhar, G.; Brookhouse, M.; Busch, F.A.; O’Grady, A.; Tausz, M.; Pinkard, E.A. Prescreening in large populations as a tool for identifying elevated CO2-responsive genotypes in plants. Funct. Plant. Biol. 2018, 46, 1–14. [Google Scholar] [CrossRef] [Green Version]
  40. Bianco, R.L.; Panno, G.; Avellone, G. Characterization of Sicilian olive genotypes by multivariate analysis of leaf and fruit chemical and morphological properties. J. Agric. Sci. 2013, 5, 211–229. [Google Scholar] [CrossRef] [Green Version]
  41. Mendoza, C.H.G.; Céron-Souza, I.; Arango, L.V. Agronomic evaluation of a Colombian passion fruit (Passiflora edulis Sims) germplasm collection. Agron 2018, 16, 1649–1659. [Google Scholar]
  42. Akça, Y.; Yuldaşulu, Y.B.; Murad, E.; Vahdati, K. Exploring of walnut genetic resources in Kazakhstan and evaluation of promising selections. Int. J. Hortic. Sci. Technol. 2020, 7, 93–102. [Google Scholar]
  43. Magalhães, D.S.; Rufini, J.C.M.; Albuquerque, A.S.; Viol, R.E.; Fagundes, M.C.P.; Menezes, T.P. Genetic diversity among accessions of acerola based on the quality of fruits. Comun. Scient 2018, 9, 133–141. [Google Scholar] [CrossRef]
  44. Brunini, M.A.; Macedo, N.B.; Coelho, C.V.; Siqueira, G.F.D. Caracterização física e química de acerolas provenientes de diferentes regiões de cultivo. Rev. Bras. Frut. 2004, 10, 486–489. [Google Scholar] [CrossRef] [Green Version]
  45. Corrêa, C.V.; Gouveia, A.M.S.; Martins, B.N.M.; Jorge, L.G.; Lanna, N.B.L.; Tavares, A.E.B.; Mendonça, V.Z.; Evangelista, R.M. Influence of ripening stages on physicochemical characteristics of acerola fruits. Rev. Ciênc. Agr. 2017, 40, 808–813. [Google Scholar] [CrossRef]
  46. Commission Internationale de l’Eclairage. Official Recommendations of the International Commission on Illumination; Publication CIE: Vienna, Austria, 1986. [Google Scholar]
  47. McGuire, R.G. Reporting of objective color measurements. HortScience 1992, 27, 1254–1255. [Google Scholar] [CrossRef] [Green Version]
  48. Viúda-Martos, M.; Ruiz-Navajas, Y.; Zaldivar-Cruz, J.M.; Kuri, V.; Fernández-López, J.; Carbonell-Barrachina, A.A.; Pérez-Álvarez, J.A. Aroma profile and physico-chemical properties of artisanal honey from Tabasco Mexico. Int. J. Food Sci. 2010, 45, 1111–1118. [Google Scholar] [CrossRef]
  49. Mondragón-Cortez, P.; Ulloa, J.A.; Rosas-Ulloa, P.; Rodríguez-Rodríguez, R.; Vázquez, J.A.R. Physicochemical characterization of honey from the West region of México. CyTA J. Food 2013, 11, 7–13. [Google Scholar] [CrossRef]
  50. Ali, M.M.; Woods, M.; Caravan, P.; Opina, A.C.; Spiller, M.; Fettinger, J.C.; Sherry, A.D. Synthesis and relaxometric studies of a dendrimer-based pH-responsive MRI contrast agent. Chem. Eur. J. 2008, 14, 7250–7258. [Google Scholar] [CrossRef] [Green Version]
  51. Instituto Adolfo Lutz. Normas Analíticas do Instituto Adolfo Lutz. Métodos Químicos E Físicos Para Análise De Alimentos, 2nd ed.; IMESP: São Paulo, Brazil, 1985. [Google Scholar]
  52. Benassi, M.T.; Antunes, A.J. A comparison of metaphosphoric and oxalic acids as extractants solutions for the determination of Vitamin C in selected vegetables. Arq. Biol. Tecn. 1988, 31, 507–513. [Google Scholar]
  53. Georgé, S.; Brat, P.; Alter, P.; Amiot, M.J. Rapid determination of polyphenols and vitamin C in plant-derived products. J. Agric. Food Chem. 2005, 53, 1370–1373. [Google Scholar] [CrossRef] [PubMed]
  54. Streit, M.; Gehlenborg, N. Points of view: Bar charts and box plots. Nat. Methods 2014, 11, 117. [Google Scholar] [CrossRef] [PubMed]
  55. Wise, B.M.; Gallagher, N.B. The process chemometrics approach to process monitoring and fault detection. J. Process. Control. 1996, 6, 329–348. [Google Scholar] [CrossRef]
  56. Granato, D.; Katayama, F.C.U.; Castro, I.A. Assessing the association between phenolic compounds and the antioxidant activity of Brazilian red wines using chemometrics. LBWTAP 2010, 43, 1542–1549. [Google Scholar] [CrossRef]
  57. Matta, L.B.D.; Tomé, L.G.O.; Salgado, C.C.; Cruz, C.D.; Silva, L.D.F. Hierarchical genetic clusters for phenotypic analysis. Acta Sci. Agron. 2015, 37, 447–456. [Google Scholar] [CrossRef]
  58. Portarena, S.; Leonardi, L.; Scartazza, A.; Lauteri, M.; Baldacchini, C.; Farinelli, D.; Famiani, F.; Ciolfi, M.; Brugnoli, E. Combining analysis of fatty acid composition and δ13C in extra-virgin olive oils as affected by harvest period and cultivar: Possible use in traceability studies. Food Control. 2019, 105, 151–158. [Google Scholar] [CrossRef]
  59. Lima, P.C.C.; Souza, B.S.; Souza, P.S.; Borges, S.D.S.; Assis, M.D.O.D. Caracterização e avaliação de frutos de aceroleira. Rev. Bras. Frut. 2014, 36, 550–555. [Google Scholar] [CrossRef] [Green Version]
  60. Adriano, E.; Evangelista, R.M. Qualidade de fruto da aceroleira cv. Olivier em dois estádios de maturação. Rev. Bras. Frut. 2011, 33, 541–545. [Google Scholar] [CrossRef]
  61. Loápez, A.P. Relation of maturity to some fruit characters of the West Indian cherry. J. Agric. Univ. P. R. 1963, 47, 193–200. [Google Scholar]
  62. Alves, R.E.; Chitarra, A.B.; Chitarra, M.I.F. Postharvest physiology of acerola (Malpighia emarginata D. C.) fruits: Maturation changes, respiratory activity and refrigerated storage at ambient and modified atmospheres. Acta Hortic. 1995, 370, 223–230. [Google Scholar] [CrossRef]
  63. Brasil. Instrução Normativa n. 01, de 7 de janeiro de 2000. In Regulamento Técnico Geral Para Fixação Dos Padrões De Identidade E Qualidade Para Polpa De Fruta; Diário Oficial [da] República Federativa do BRASIL: Brasilia, Brazil, 2000; pp. 54–55. [Google Scholar]
  64. Nascimento, J.F.; Barroso, B.S.; Tostes, E.D.S.L.; Silva, A.D.S.S.; Silva Júnior, A.C.S. Análise físico-química de polpas de acerola (Malpighia glabra L.) artesanais e industriais congeladas. PubVet 2018, 12, 131. [Google Scholar] [CrossRef] [Green Version]
  65. Seymour, G.B.; Tucker, G.A. Avocado. In Biochemistry of Fruit Ripening; Springer: Dordrecht, The Netherlands, 1993; pp. 53–81. [Google Scholar]
  66. Instituto Brasileiro de Frutas. Soluções Fruta a Fruta: Acerola; IBRAF: São Paulo, Brazil, 1995. [Google Scholar]
  67. Nasser, M.D.; Zonta, A. Caracterização de frutos de genótipos de aceroleira em função de estádios de maturação. Tecn. Ciên. Agrop. 2014, 8, 76–78. [Google Scholar]
  68. Vendramini, A.L.; Trugo, L.C. Chemical composition of acerola fruit (Malpighia punicifolia L.) at three stages of maturity. Food Chem. 2000, 71, 195–198. [Google Scholar] [CrossRef]
  69. França, L.G.; Alves Filho, E.; Ribeiro, L.B.; Evangelista, J.S.B.; Silva, L.M.; Souza, P.A.; Aragão, F.A.S. Metabolomic profiling of acerola clones according to the ripening stage. J. Food Meas. Charact. 2020, 30, 1–9. [Google Scholar]
  70. Nakasone, H.Y.; Miyashita, R.K.; Yamane, G.M. Factors affecting ascorbic acid content of the acerola (Malpighia glabra L.). J. Am. Soc. Hortic. Sci. 1966, 89, 161–166. [Google Scholar]
  71. Oliveira, L.D.S.; Moura, C.F.H.; Brito, E.S.; Mamede, R.V.S.; Miranda, M.R.A. Antioxidant metabolism during fruit development of different acerola (Malpighia emarginata D. C.) clones. J. Agric. Food Chem. 2012, 60, 7957–7964. [Google Scholar] [CrossRef]
  72. Wahyuningsih, S.; Wulandari, L.; Wartono, M.W.; Munawaroh, H.; Ramelan, A.H. The Effect of pH and Color Stability of Anthocyanin on Food Colorant. In Proceedings of the IOP Conference Series: Materials Science and Engineering, Surakarta, Indonesia, 18–19 October 2016; Volume 193, p. 12047. [Google Scholar]
  73. Rotili, M.C.C.; Villa, F.; Braga, G.C.; França, D.L.B.; Rosanelli, S.; Laureth, J.C.U.; Silva, D.F. Bioactive compounds, antioxidant and physic-chemical characteristics of the dovyalis fruit. Acta Sci. Agric. 2018, 40, e35465. [Google Scholar] [CrossRef]
  74. Baldicchi, A.; Farinelli, D.; Micheli, M.; Di Vaio, C.; Moscatello, S.; Battistelli, A.; Walker, R.P.; Famiani, F. Analysis of seed growth, fruit growth and composition and PEPCK occurrence in apricot (Prunus armeniaca L.). Sci. Hort. 2015, 186, 38–46. [Google Scholar] [CrossRef]
  75. Famiani, F.; Bonghi, C.; Chen, Z.H.; Drincovich, M.F.; Farinelli, D.; Lara, M.V.; Proietti, S.; Rosati, A.; Vizzotto, G.; Walker, R.P. Stone fruits: Growth and nitrogen and organic acid metabolism in the fruits and seeds—A review. Front. Plant. Sci. 2020, 11, 1427. [Google Scholar] [CrossRef] [PubMed]
  76. Rohlf, F.J.; Fisher, D.R. Tests for hierarchical structure in random data sets. Syst. Biol. 1968, 17, 407–412. [Google Scholar] [CrossRef]
  77. Cruz, C.D.; Regazzi, A.J.; Carneiro, P.C.S. Modelos Biométricos Aplicados Ao Melhoramento Genético; UFV: Viçosa, Brazil, 2004; Volume 1, 480p. [Google Scholar]
  78. Bianchi, F.G.; Balbi, R.V.; Pio, R.; Bruzi, A.T.; Silva, D.F.D. Parent’s choice and genetic divergence between cambuci fruit tree accessions. Crop. Breed. Appl. Biotechnol. 2017, 17, 214–220. [Google Scholar] [CrossRef] [Green Version]
  79. Mihaljevic, R.; Schön, C.C.; Utz, H.F.; Melchinger, A.E. Correlations and QTL correspondence between line per se and testcross performance for agronomic traits in four populations of European maize. Crop. Sci. 2005, 45, 114–122. [Google Scholar] [CrossRef]
Figure 1. Map of Brazil with symbols indicating the areas where research has already been carried out on acerola.
Agriculture 11 01078 g001
Figure 2. Seasonal variation of maximum/minimum/average temperature, monthly accumulated rainfalls recorded from October to December 2019.
Agriculture 11 01078 g002
Figure 3. Box plots of physical parameters. Whiskers (error bars) above and below the box indicate the 90th and 10th percentiles. The horizontal line shows the median value. Symbols display extreme data points. Each dot represents the mean value of 4 replicates of ten fruits each.
Agriculture 11 01078 g003
Figure 4. Box plots of chemical parameters. Whiskers (error bars) above and below the box indicate the 90th and 10th percentiles. The horizontal line shows the median value. Symbols display extreme data points. Each dot represents the mean value of four replicates of five fruits each.
Agriculture 11 01078 g004
Figure 5. Heat map correlation matrix representing correlations (Pearson coefficients) among the biochemical and morphological variables. The values of correlation reported in the heat map resulted significantly different per p < 0.05.
Agriculture 11 01078 g005
Figure 6. Dendrogram of variables obtained through cluster analysis (Ward’s method) representing the Euclidean distances of the 103 acerola phenotypes.
Agriculture 11 01078 g006
Figure 7. Scatter plot of the scores of acerola samples on the two-dimensional plane defined by PC1 and PC2 as calculated from the complete dataset by PCA. Samples are grouped according to the HCA results (the confidence level of 0.95 defines the ellipses in such manner that approximately 95% of the new observations from that group fall inside the ellipse).
Agriculture 11 01078 g007
Figure 8. Scatter plot of the scores of acerola samples on the two-dimensional plane defined by PC1 and PC3 as calculated from the complete dataset by PCA. Samples are grouped according to the HCA results (the confidence level of 0.95 defines the ellipses in such manner that approximately 95% of the new observations from that group fall inside the ellipse).
Agriculture 11 01078 g008
Figure 9. Ripe acerola fruits of phenotype number 37.
Agriculture 11 01078 g009
Table 1. Ranges of the principal acerola chemical characteristics reported in the literature from studies carried out in nine states of Brazil, with respect to ripe fruits.
LocationGeographic CoordinatesCultivarVitamin C Content (mg/100
g Pulp)
Soluble Solids Content (° Brix) (SSC)Titratable Acidity (%)
(TA)
SSC/
TA
Ratio
pHTotal Polyphenols
(mg/kg Gallic Acid)
Source
Anápolis, Goiás Sate1000
m a.s.l.
9 genotypes348–15035.4–8.270.68–1.680.40–0.952.34–3.15 [12]
Cruz das Almas, Bahia State CMF 017, Rubra and Cabocla911–11927.88–8.840.83–1.355.84–10.713.29–3.60 [30]
Carpina, Pernambuco State7°51′04″ S, 35°14′27″ W,
178 m a.s.l.
12 genotypes1057–20326.2–10.31.09–1.894.4–6.42.98–3.37 [31]
Petrolina, Pernambuco State 42 genotypes779–24445.3–9.20.79–1.90 3.11–3.70 [32]
Petrolina, Pernambuco State Flor Branca,1786–35978.43–12.7 [20]
Okinawa and Sertaneja
São Francisco Valley, Pernambuco State09°09′ S,
40°22′ W,
365 m a.s.l.
Flor Branca and Junko2160–27707.7–8.61.52–1.883.0–8.312.97–3.75 [17]
Carpina, Pernambuco State7°51′04″ S,
35°14′27″ W, 178 m a.s.l.
18 genotypes: PL26 to PL45750–16786.66–11.460.96–1.973.79–7.062.9–3.5 [15]
Limoeiro do Norte, Ceará State5°20′ S,
38°5′ O
BV1, BV2, BV4, BV6, and C6P3531–10876.32–7.480.97–1.026.49–7.633.21–3.59 [33]
Limoeiro do Norte, Ceará State 38 clones and
Sertaneja, Flor branca, Camta 40.2, Monami, Okinawa, Mineira and Barbados
501–18555.7–11.10.53–1.524.32–11.943.31–3.91 [27]
Limoeiro do Norte, Ceará State BV1, BV2, BV3 and C6P3732–10876.32–7.480.97–1.026.49–7.633.21–3.59 [34]
Acaraú, Caucaia, Maranguape, Paraipaba, Uruburetama and Itapajé, Ceará State A1 to A7968–13494.7–5.30.86–0.995.33–5.743.39–3.59 [18]
Pacajús, Ceará State Flor Branca, BRS366863–13646.63–9.460.61–1.065.98–15.423.18–3.681562–2631[23]
Publisher’s Note: MDPI stays neutral with regard to jurisdictional claims in published maps and institutional affiliations.

