Article

Profile of the Small-Scale Farms Willing to Cooperate—Evidence from Lithuania

by
Jolanta Droždz
1,*,
Vlada Vitunskienė
2 and
Lina Novickytė
3
1
Faculty of Economics and Business Administration, Vilnius University, 10222 Vilnius, Lithuania
2
Faculty of Bioeconomy Development, Vytautas Magnus University, 44248 Kaunas, Lithuania
3
Government Strategic Analysis Center, 01108 Vilnius, Lithuania
*
Author to whom correspondence should be addressed.
Agriculture 2021, 11(11), 1071; https://doi.org/10.3390/agriculture11111071
Submission received: 4 October 2021 / Revised: 25 October 2021 / Accepted: 29 October 2021 / Published: 30 October 2021

Abstract

:
Cooperatives cover a large part of the agricultural sectors and have substantial market shares in agri-food supply chains in the EU Western countries. They account for approximately half of agricultural trade in the EU. By contrast, in the EU Western countries, where farmer cooperatives are widespread and successful, agricultural cooperation in Lithuania has developed intermittently in the last century. We still have very limited knowledge of why the country’s agricultural producers (especially smallholder farmers) are reluctant to cooperate in Lithuania. The aim of this study is to assess the level of the willingness to cooperate among smallholder farmers in Lithuania and to draw up the profiles of small-scale farms that participate in and intend to join cooperatives and, conversely, that do not participate in cooperatives and do not intend to do so. To achieve this goal, a representative survey of small-scale farms was conducted. Results of surveys carried out in 2019 in Lithuania on a group of 1002 small-scale farms showed that only 8% of the surveyed farms participate in producer groups or cooperatives, while another 8% intend to participate. Small-scale farms in Lithuania have weak market integration, with no bargaining power on input and output markets. The vast majority of small-scale farms are reluctant to participate in cooperative activities in Lithuania. Therefore, this study aimed to determine the profile of a small farm that tends to cooperate. The main social characteristics of farm managers and economic factors of farms willing to cooperate have been identified.

1. Introduction

There are more than forty thousand agricultural cooperatives in Europe with nine million farmer members [1]. Cooperatives cover a large part of the agricultural sectors and have substantial market shares in agri-food supply chains in the European Union (EU) western countries. They account for approximately half of agricultural trade in the EU and over half in some member states such as Austria, Denmark, Finland, France, Ireland, the Netherlands, and Sweden. Moreover, the market shares of cooperatives differ considerably with respect to sectors [2,3]. According to Ollila [4], not only ideological or sociological but also economic reasons justify the existence of cooperatives. The existence of cooperative organizations in today’s business environment, particularly in agriculture, signals their continued ability to provide value to their members [5] by increasing farms’ (especially small-scale farms) competitiveness on the national and international markets [6,7]. Agricultural cooperatives have provided a model for overcoming the disadvantages of small-scale farming for more than 150 years [8]. It should be added that the process of farm cooperation in modern Lithuania was decisively influenced by the historical path of agricultural development and the experience of the agricultural community.
By contrast, in the EU Western countries where farmers’ cooperatives are widespread and successful, agricultural cooperation in Lithuania has developed intermittently in the last century. The cooperation of farmers developed in the second and third decades of the 20th century, based on the classical principles of cooperation, was completely destroyed by the collectivization of farms into pseudo-cooperative kolkhoz at the beginning of the Soviet era. Moreover, farmers’ households were allowed to use only up to 60 acres of land. The collective farms that operated during the Soviet regime (1945–1989) still maintain a non-beneficial image of anti-cooperation, deterring farmers from joining cooperatives. After the restructuring of independent Lithuanian agriculture in the early 1990s, cooperation between newly established family farms and corporate companies in agriculture has not been expanding and is still very weak. Cooperation among farmers is not widespread in Lithuania—only about 12% of the country’s farmers are involved in cooperatives [9]. The research of Borychowski et al. [10] included Lithuania and showed that the production scale was the key determinant of the resilience of small-scale farms in the countries. Moreover, the main way to achieve the higher benefits of increasing the production should be combined with strengthening the market integration of agricultural producers, so the cooperation issue becomes even more relevant. This study extends an established direction of the resilient development of the small-scale farms in Lithuania.
EU Western researchers are looking for the reasons why agricultural producers in the 21st century are choosing a cooperative structure based on classical principles of cooperation [11], and we still have very limited knowledge of why the country’s agricultural producers (especially smallholder farmers) are reluctant to cooperate in Lithuania. The main aim of this study is to assess the level of the willingness to cooperate among smallholder farmers in Lithuania and to draw up the profiles of small-scale farms that participate in and intend to join cooperatives and, conversely, that do not participate in cooperatives and do not intend to do so.
To achieve this aim, a representative survey of small-scale farms was conducted. We employed the results of surveys carried out in 2019 in Lithuania on a group of 1002 small-scale farms. The study results contribute to a better understanding of the cooperative or non-cooperative behaviour of small-scale farms.

2. Literature Overview

2.1. Reluctance to Cooperate

An overview of the research conducted on farm co-operation in Lithuania revealed that the main reasons for the attitude of Lithuanian farmers towards co-operation have not changed for a long time. The farmer and expert survey data show [12] that the main reasons for farmers’ reluctance to cooperate and change are their individuality, lack of trust in collective (cooperative) actions and new ideas, internal competition, and inability to find a joint agreement on different issues.
Both farmers and managers of agricultural companies do not consider cooperation to be a matter of necessity; for them, according to experts, daily work on the farm is of greater value than changes in the area of cooperation. In addition, they feel that there is a lack of time for collaborative actions due to the high workload. Other authors have also identified distrust between people, unwillingness to change their habits, and a lack of time for cooperative activities as the main barriers of the development of farm cooperation processes in Lithuania [13,14,15]. Tuna and Karantininis [15] conducted a social network analysis and found that there are low levels of social capital (structural, which refers to the presence of a network of access to people and resources, as well as cognitive aspects, such as norms, values, trust, attitudes, and beliefs) in agricultural cooperatives in post-socialist countries. A lack of time and money for cooperative activities, a lack of leaders, and bureaucratic shortcomings have been emphasized as the main obstacles for cooperation in Russia [7].
In some studies, a low awareness of the benefits of contractual integration among farmers was observed along with a weak willingness to cooperate because of the low bargaining power of farmers [16,17]. Kahneman and Tversky’s Prospect Theory [18] shows that individuals tend to avoid potential losses rather than seek potential benefits. Agricultural cooperatives in post-socialistic countries often fail to justify their purpose [15]. Czyzewski et al. [19] confirm that human capital plays a significant role in contractual governance and requires special attention. The positive correlations between the length of education and willingness to join agricultural cooperatives have been observed in several studies [20,21,22,23]. Education contributes to the quality of human capital. Martey et al. [24] argue that, through educational processes, farmers gain the ability to cooperate and to participate in social activities, while others conclude that better educated and self-confident farmers appreciate contractual integration more than others [20,21,22].
Other research claims that it can be difficult to organize work and communication processes in cooperative enterprises and it is time consuming to establish new collaborations [25]. On the other hand, an expansion in production is expected to increase production costs unless it is achieved solely through an increase in productivity via costless improved management practices [26]. In addition, exchanges of raw agricultural products are governed by stable contractual relations between farms and buyers when talking about modern markets [27], which also hinders the merging of farms into cooperatives in Lithuania. The data also show that farmers tend to compete with each other and cannot understand the benefits of cooperation [28]. The study from Miceikienė et al. [29] shows that difficult access to financial funds also limits the growth potential of agricultural cooperatives. Agricultural cooperatives face the problem of financing due to higher operational risk.
The low involvement of small-scale family farms in the activities of formal cooperatives is influenced by informal mutual assistance when farmers share machinery and experience in agricultural production and help each other with a high workload during the season [25]. Informal cooperation is of continual importance for small-scale farms [25,30]. Such informal cooperation, similar to mutual assistance and based on trust and the constant fostering of personal relationships, often occurs in Lithuania between neighbours or relatives. Informal cooperation between farmers was identified as one of the main reasons for non-cooperation of farmers in Lithuania [14]. This can be thought of as being particularly common for small-scale farmers.
In summary, three groups of factors can be distinguished, due to which farmers in Lithuania are reluctant to cooperate:
  • Psychological factors include a bad association with the Soviet-era “kolchozes”, producers’ distrust of each other, a low level of economic awareness among farmers, a lack of leaders, a lack of successful stories, and exaggeration of negative experiences being a cooperative member.
  • Economic factors and legal issues include a lack of financial funds to start a successful economic activity, the employment of specialists, a lack of financial support, the lack of a system for regulating the equitable distribution of value added throughout the value chain, and changing law.
  • Organisational factors include a lack of awareness of the benefits cooperatives bring, a lack of professional consulting and coaching facilities available to cooperative members, and a diverse level of knowledge and skills of existing consultants.
Nevertheless, small-scale farms have little opportunity to compete in the traditional market through individual activities, so one of the options is local food systems, and the way they are created is through farmers’ cooperation [25,31]. As long as the level of farmers’ cooperation is low, the market share is low as well [32], so market integration through cooperation is essential for small-scale farms in order to improve their market position.

2.2. Incentives for Cooperation

The establishment and development of different forms of business cooperation, particularly in small-scale agriculture, must depend on the initiative and willingness of the farmer to actively participate in and join the different forms of business cooperation [6]. Many authors have raised the problem of contractual integration of farms and their drivers. Recent examples are Abate [33], Kispál-Vitai et al. [11], Ciliberti et al. [34], Ncube [35], Souza et al. [36], and Candemir et al. [3]. Many positive effects have been found on farms participating in cooperation activities, which should be an incentive for other farms to get involved in the process as well. The efficiency of farm activities increases after they join a cooperative and the financial situation of all farms improves [37]. Cooperatives can help producers in several ways, two of which are specific to their activities in the market: countervailing power and competitive criterion, i.e., market price regulator [11]. In the case of horticulture, producer groups and organisations play a significant role in the modernisation processes [38]. Cooperatives or other producer organizations give small-scale farms the opportunity to get involved in modern agricultural value chains, especially as traditional markets are dominated by large farms [39]. Producer organizations help to reduce barriers to market entry for small producers [40]. The experience of Western European and Scandinavian countries proves that small and medium-sized farms operating through a cooperative increase their bargaining power in the market, become more competitive, and reduce production and logistics costs.
It is therefore important to emphasize, that cooperation not only contributes to the reduction of production costs, but also helps to organize certain markets [36]. Cooperatives can improve smallholder farmers’ access to both input and output markets and strengthen their competitive position in different ways, both on an internal and international level [6,13]. For instance, cooperatives enable farmers to bargain collectively with both sellers of inputs and buyers of farm products, can decrease transaction costs and improve transaction efficiency, and can support the information flow between farmers and the market and thus help farmers to meet the specific requirements of high value-added food markets [41]. Ortega et al. [42] proved this positive effect for coffee producers in Rwanda, where cooperative membership was linked to greater access to inputs and an increase in income. Cooperatives can reduce market risk for their members and joint liability groups to enable access to microfinance when there is limited collateral [43], can use a collective quality label or create their own brands and create a product differentiation, and can help farmers to cope with market imperfections [3]. Cooperatives are as response to the weak bargaining power of individual farms on a market [41,44].
Cooperation promotes the development of common infrastructure (machinery, logistics, and transport), integrated food production and processing methods, and common agricultural practices [25]. Joint activities help farmers to improve production processes and logistics management and reduce food loss and waste along the entire supply chain [45]. Cooperatives and other types of organization in agriculture provide increased access to information, but also access to credits, equipment, and other types of subsidies and support [15]. Agarwal and Dorin’s [46] study on group farming in France identified reasons why farmers in some regions are more likely to cooperate than in others: cooperation is more prevalent in regions with low economic inequality and with a predominance of small or medium-sized farms; more labour-intensive farms engaged in agricultural activities, i.e., livestock farmers are more likely to cooperate than cereal farmers; and it is influenced by demographic factors, such as the agricultural education of farmers. It can be added that this is influenced by the historical conditions of agricultural development in the regions or countries. Members of the agricultural cooperatives to a large extent assess their groups in social terms rather than only on economic ones [47]. Cooperation activities not only have a positive impact on the welfare of the members of cooperatives, but in general, joint activities also increase living standards in rural areas, preserve and influence the development of rural lifestyles, and prevent some rural territories from becoming extinct [7]. Thus, the social aspect of the analysed problem is also important. Based on the analysed literature, both social and economic factors were selected for further analysis.

3. Materials and Methods

In the preparation stage for this study, we defined small-scale farms in Lithuania and performed a regression analysis to determine whether there is a relationship between the physical and economic size of the farm, which could help to identify typical small-scale farms in Lithuania. The definition of a small-scale farm makes it easier to understand which farms are covered in the study. Small-scale farms are classified as farms with less than EUR 25,000 of standard output (SO). Moreover, the criterion of the physical farm size under hectares of the UAA was applied in this analysis, and its cut-off threshold determination was based on the analysis of the relationship between the economic and physical size of farms (up to 20 ha) [48]. The further research process was carried out in the three stages presented in Table 1.
In the first stage, the main characteristics of the small-scale farms in Lithuania were set according to the 2016 Farm Structures Survey data (Statistics Lithuania, 2018 and EUROSTAT, 2019). This part of the analysis allowed us to investigate the main characteristics of the small-scale farms in Lithuania: the number of small-scale farms, percentage of the total farms, utilized agricultural area covered by the small-scale farms, level of subsistence, economic size, and employment level in the small-scale farms in Lithuania.
In the second stage of the study, a survey of small-scale farms was conducted in 2019 (sample of 1002 small farms from all Lithuanian Counties as determined by the stratified selection process, based on the above definition). The random sample is representative of a 95% confidence level, 0.5 fraction, and 3% maximum error. In order to determine the spread of operating cooperatives and their structural features and the coverage of farmers’ involvement in them, the Lithuanian Agricultural Cooperatives and Cooperative Companies’ 2019 survey conducted by the Chamber of Agriculture of the Republic of Lithuania was used as additional information survey data (N = 102). The study was supplemented by a survey of cooperatives, conducted in 2019 (sample of 102 cooperatives from Lithuania). The sample covers 58% of the cooperatives operating in Lithuania in 2019. Additional data help to determine which cooperatives are operating in Lithuania, their size (by members), and the activities they are engaged in.
We used the data, which allowed us to set the level of willingness to cooperate among the small-scale farmers in Lithuania, to set up the market integration level (both on input and output markets) position, the level of bargaining power, the level of vertical and horizontal integration, the management of production and price risks, and the willingness to participate in cooperative actions and contractual integration in the broader sense. All data collected for the study are under the international FAMFAR Project “The role of the small farms of the sustainable development of agri-food sector in the countries of Central and Eastern Europe”, financed by the Polish Agency for Academic Exchange (NAWA).
In the third stage of the study, chosen variables from the survey data of small-scale farms (N = 1002) were used to define the characteristics and profile of farm managers and farms who are willing or are reluctant to cooperate. The descriptive research method is an important part of the analysis of primary data and provides a basis for comparing variables with derived statistical tests. In many instances, description can also point toward causal understanding and to the mechanisms behind causal relationships [49]. Thus, this study (and the chosen survey methodology) is a first step in isolating a sample of cooperative small-scale farms from the overall sample of the whole survey and compiling a profile of a cooperative farm based on the methods of descriptive statistics. This type of descriptive research can be especially informative when we do not yet have enough understanding of a phenomenon.
The question in the survey was: What are your plans for participating in the cooperative and/or producer group? Possible answers were as follows: (a) I am participating and plan to continue my membership; (b) I am participating but plan to terminate my membership; (c) I do not participate, but I plan to get involved in the activities of the cooperative and/or producer group; (d) I am not present and do not plan to participate; (e) I have not heard anything about it; (f) I have no opinion. Three groups of farms were created: (1) farms willing to cooperate (123 farms, covers “a” and “c” answers); (2) farms reluctant to cooperate (576 farms, covers “b” and “d” answers), and (3) farms having no opinion (263 farms, covers “e” and “f” answers). The study sought to identify the main differences between these groups. Both social and economic components of the profile were examined to ensure the fullest possible picture. Social factors covered in the study pertained to the farm managers and included age, gender, level of education, socio-economic group, and participation in social and/or cultural events. The farm profile was defined based on economic variables such as total farm area (ha), market value of the farm (in euros), total agricultural production value (in euros), income structure (as a percentage of income from agriculture, or work, self-employment, pension, social transfers, remittances, or other sources in total farm income), and the level of direct support in agriculture income (%). All these variables were selected based on the literature review and can explain the essential features of farms’ behaviour. Descriptive statistics of the dataset are presented in Table A1 and Table A2.

4. Results

4.1. Small-Scale Farms’ Performance in Lithuania

According to the Farm Structures Survey in 2016, there were 150,320 farms in Lithuania, excluding farms with less than 1 ha of UAA and from agricultural activity generated revenue of less than EUR 1520 per year (Statistics Lithuania, 2018). Most of them were small in physical or economic nature. In terms of physical size, half of all farms had less than 5 hectares of utilized agricultural area (UAA), while a further one-third farmed on an area 10–20 hectares in size. At the other end of the physical size scale, only 7.2% of farms had more than 50 hectares.
Along with their small physical size, most farms in Lithuania are small in economic terms as well. Table 2 presents data (in absolute and relative terms) for farms with less than EUR 25,000 of SO per year, which for this analysis will be considered as a cut-off threshold for economically small farms in this article. In 2016, there was nearly 103.5 thousand farms in Lithuania with a standard output less than EUR 8000, while a further 22.6 thousand farms had a standard output within the range from EUR 15,000 to EUR 24,999 per year. Together, very small and medium-small farms accounted for more than four-fifths (84%) of all farms in Lithuania, whereas their share of standard output was slightly more than a quarter (26%). Together they cover about a third of Lithuania’s UAA.
As indicated in Table 2, half of the small-scale farms are subsistence-oriented, meaning their households consume more than half of the final farm production. The highest proportion of subsistence and semi-subsistence farms is in the group of very small farms in economic terms and in physical size.
In terms of the relationship between physical and economic size, the linear regression analysis based on the sample from the whole population of family farms (N = 1298) data from the Lithuanian FADN [48] shows that the physical farm size in UAA hectares has a positive relationship with the economic farm size in euros of SO (r2 = 0.844, p < 0.000). Meanwhile, in the sample of economically small-scale farms (N = 461), a strong dependence of farm standard output on physical farm size expressed in UAA was not found (r2 = 0.303, p < 0.000). This indicates that small-scale farms of the same size in physical terms can be extremely different by size in economic terms for various reasons, in particular the type of farming.

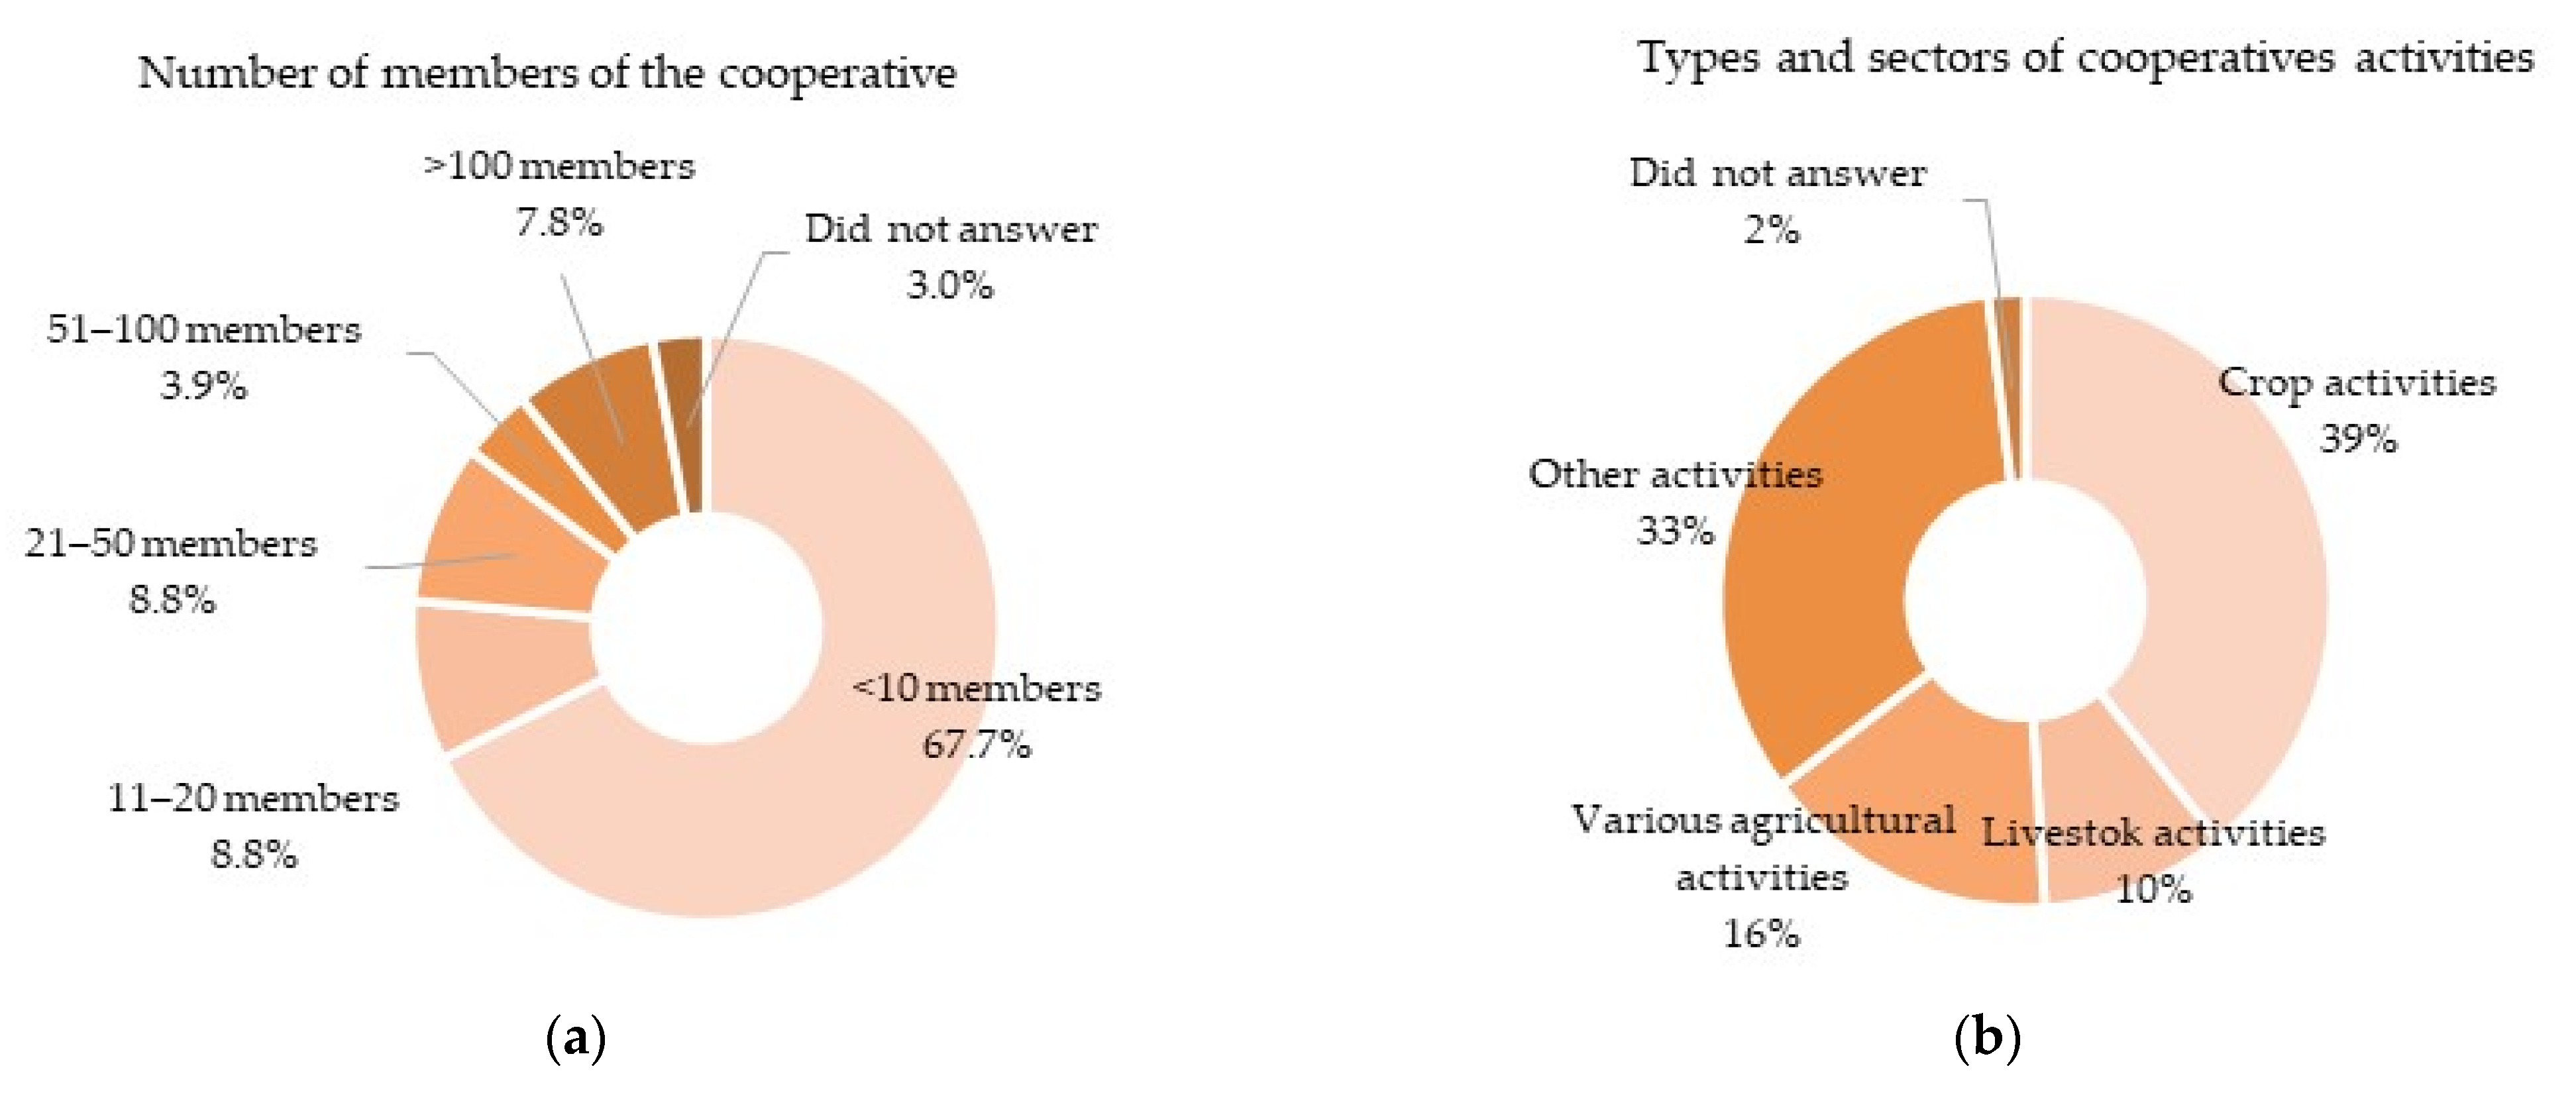
4.2. Extent of the Involvement of Small Family Farms in Cooperation in Lithuania

According to the physical size of the farm, the farms participating in the survey were distributed as follows: 14.3% were “three-hectare” farms (up to 3 ha of land), so named according to the Seimas of the Republic of Lithuania resolution of 1990 “On the expansion of homestead plots of rural residents to 2–3 hectares”; 39.5% of farms were a physical size of 3 to 10 ha; and the remainder (46.2%) were 10 to 20 ha.
Based on the data of the Lithuanian Chamber of Agriculture, 323 cooperative units engaged in agricultural activities were registered at the beginning of 2019. However, the investigation revealed that 147 cooperatives were suspended, terminated, or in liquidation and only 176 of them remained operating. Most agricultural cooperatives are relatively small. For example, a survey of 102 cooperatives (58% of the cooperatives operating at the time) showed that two-thirds of cooperatives have no more than ten members each, and over one hundred members have only around 8% of cooperatives (Figure 1a). Half of the cooperatives are engaged in crop and livestock production (Figure 1b). “Various agricultural activities” means that members of the cooperatives are mixed farming farms (i.e., non-specialized crop and non-specialized livestock farms). “Other activities” means that agricultural cooperatives perform various other functions such as providing other services to farms (e.g., tillage, harvesting, purchase of fertilizers).
Particularly after having joined the EU in 2004, Lithuania promoted agricultural service cooperatives among small-scale farmers. However, cooperative development was not as successful as anticipated. Their market share remained relatively low. The Lithuanian Rural Development Programs provide benefits to agricultural cooperatives, so the cooperative development depends on state support.
The vast majority of farmers or almost half of the farms surveyed sell food and agricultural products on the market without any agreement, and only 4% sell products within a producer group or a cooperative group (Figure 2a) while, another 10% base sales on long-term contracts. However, when asked to indicate which sales channel allows for a higher price, almost one-fifth indicated that these were sales through producer organizations or cooperatives (Figure 2b).
More than 45% of the small-scale farms surveyed obtain the necessary raw materials and other inputs from their own farm, and only 2% have regular agreements with input suppliers (Figure 3a); an even smaller proportion of smallholder farmers in Lithuania set the terms of the contract (Figure 3b). The position of small-scale farms in the input market is very weak, without making a significant contribution to forming terms of contracts or negotiating more favourable input prices.
Taking into consideration the production process and price risk management the vast majority of small-scale farms in Lithuania use only the compulsory insurance, which is usually mandatory when receiving investment support for a farm. Participation in producer groups or cooperatives is also not considered as a possible risk management tool for price fluctuations and is used by only a small part (only 2%) of Lithuanian smallholder farmers (Figure 4a). As many as 57% of small family farms do not participate in cooperatives and do not intend to become members, and 22% have no opinion on this issue at all (Figure 4b).
The research shows that very small “three-hectare” farms are not involved in the activities of any formal cooperatives. Only about a tenth of them plan to do so. Almost one-sixth of 3–10 ha working farms and almost one-fifth of 10–20 ha working farms participate or plan to participate in a cooperative.

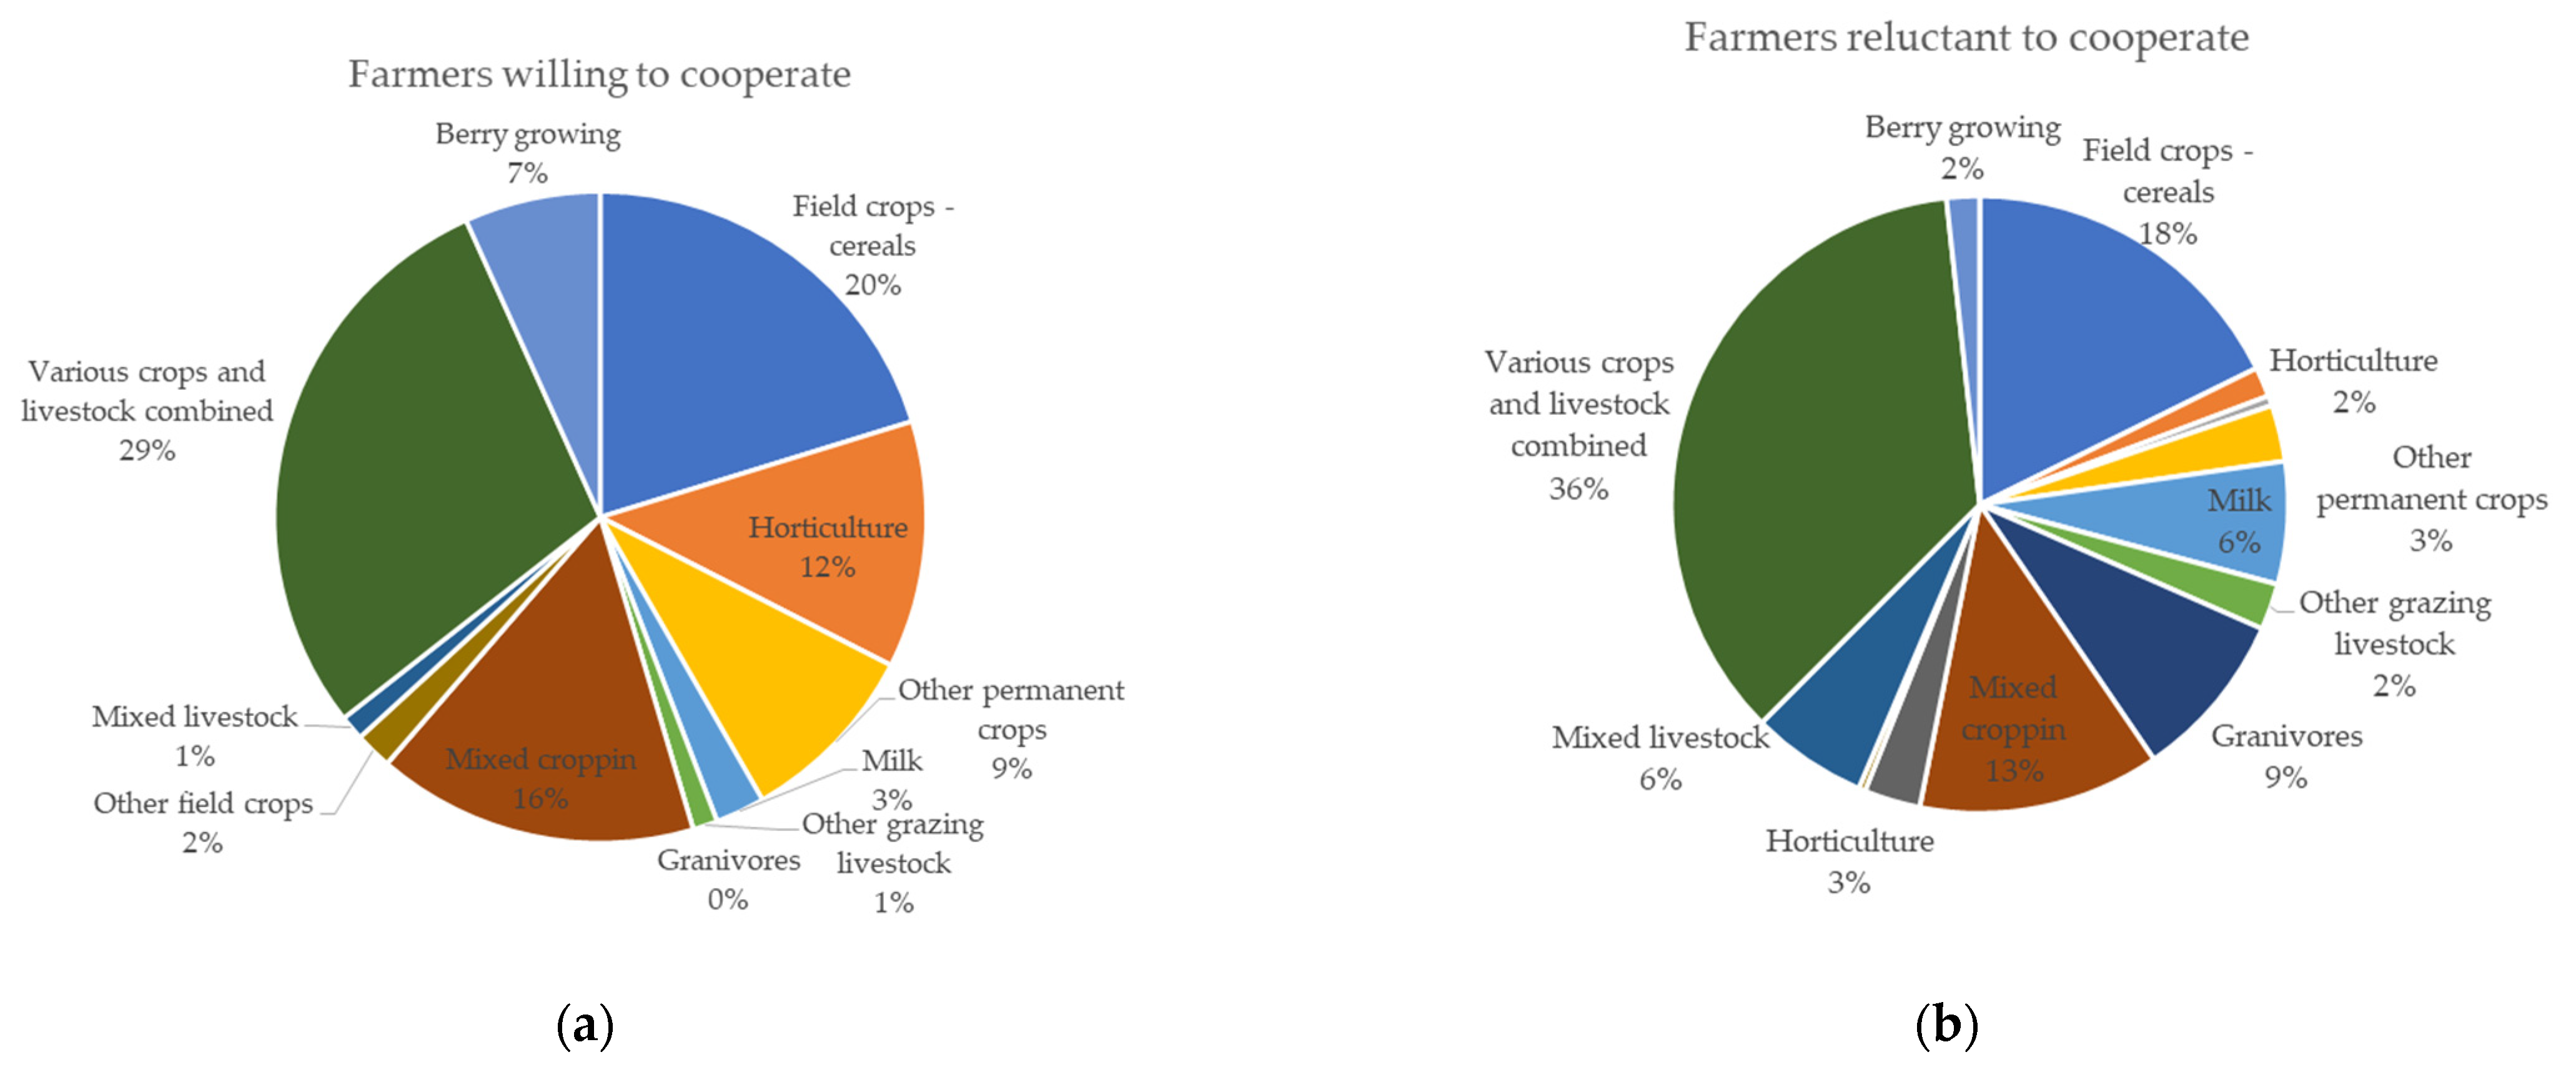
4.3. The Profile of Small-Scale Farms Willing to Cooperate in Lithuania

The profile of the small-scale farm managers in Lithuania was assessed from a social point of view: the age structure, gender, education, socio-economical group, and participation in social and/or cultural events were assessed. Meanwhile, the profile of small-scale farms was assessed in economic terms by farm size and type, income structure, share of support in farm income, farm capital assets, and self-sufficiency in capital resources.
The distribution of small-scale farms in Lithuania by the age of farm managers corresponds to the normal distribution. The share of farm managers under the age of 50 (51% of farm managers) and over 50 (49%) is roughly equal among the small-scale farms surveyed. The age of the farm manager seems to be an important factor in fostering the cooperation processes in Lithuania. As presented in Figure 5, the average age of those who are willing to cooperate or have no opinion (not decided yet) is lower than the age of those farm managers who are reluctant to cooperate, reaching on average about 46 years and 49 years, respectively.
No significant differences are observed when analysing the gender distribution of farm managers. Both women and men as farm managers are almost equally distributed into the three groups examined (Figure 6a). A small difference is observed in the group that tends to cooperate, in which there is a higher number of women among farm managers than men. However, it would be difficult to answer from the current analysis whether this is a significant or random difference, so it is suggested that the gender aspect be analysed in detail in further studies to determine the extent to which this influences the final decisions of the farm manager in contractual integration.
Assessing the education of smallholder farmers in Lithuania, it was found that there are no farm managers who have only primary education. The majority of small-scale farm managers in Lithuania have a professional or higher education (Figure 6b). A bachelor’s degree education predominates in the group where the tendency to cooperate is assessed. A master’s level education suggests that a farm manager will choose a profession outside of agriculture. Agricultural education does not have a significant impact on willingness to cooperate. Generally, farmers with higher education are more active in cooperative activities, especially those with a bachelor’s degree.
The socio-economic group of smallholder farmers in Lithuania varies among the three analysed groups. The groups of farmers reluctant to cooperate and farmers who have no opinion about cooperation are rather similar, with the predominance of farm manager employment and a higher share in total income from other agricultural activities (Figure 7a). Farm managers who are willing to cooperate are self-employed in agriculture and earn a higher income from agricultural activities even when they have an additional income from hired work.
The ratio of income from agricultural activity to total farm income is weighed in favour of income from agricultural activity. The part of the income from hired work is of high importance in total small-scale farm income. The results presuppose the conclusion that it is difficult for a small-scale farm in Lithuania to survive only from agricultural activities; therefore, farmers tend to maintain alternative sources of income, and agricultural activities are developed in parallel. Surprisingly, there are retirees among those who tend to cooperate. This means that older people with more experience are also interested in participating in joint activities and see added value in it.
Taking into consideration the level of participation in social and/or cultural events of smallholder farmers in Lithuania, it seems that the group of farmers who are willing to cooperate participate less in social activities in comparison to the other analysed groups (Figure 7b).
The next block of indicators relates to economic position of the smallholder farmers willing to cooperate. Figure 8a,b presents the farm size and the dependency of the farm on agricultural support, respectively. There is a slight difference between the analysed groups in terms of the physical size of the farm. The logical conclusion is that the larger the size of the farm, the more likely it is to cooperate. The differences between the average farm sizes of the individually analysed groups are small. The lower the share of direct payments and other support in agricultural income, the more likely farms are to cooperate. Conversely, a farm is less likely to cooperate when a higher amount of its income is from direct and other support.
Farming type structures in the group of farms willing to cooperate comprise mixed farms and crop farms (Figure 9a) with obvious differences in horticulture and berry growing compared to those reluctant to cooperate (Figure 9b). Livestock farms are more likely to refuse cooperation.
The analysis of farm income structure shows that the percentage of income from different sources in total farm income differs. Farmers willing to cooperate have a higher income from agricultural activities and lower income from hired work and self-employment in comparison to those reluctant to cooperate (Figure 10a). The latter are more dependent on pensions, social transfers, and other sources of income (Figure 10b). However, it should be noted that there are also retirees who support cooperation and participate in it.
Examining the value of the output of small-scale farms, it can be seen that those with higher values of output are the more supportive of cooperation. Moreover the overall value of production is outweighed by the value of crop products (Figure 11a,b). Figure 12a,b shows the total farm assets and farm assets by type. The average value of assets is higher for those farms which are willing to cooperate (albeit very minimally); the 75% quantile is also more inclined to cooperate. Based on the sample analysed, on average, farms with higher total assets tend to cooperate. The dispersion of non-cooperators is higher.
In summary, from the profile of the small-scale farms in Lithuania willing to cooperate, we consider that the average age of those who are willing to cooperate is lower than the age of those farm holders who are reluctant to cooperate. No significant differences can be observed when analysing the gender distribution of farm holders. A bachelor’s degree education level predominates in the group where the tendency to cooperate was assessed. Smallholder farmers who are willing to cooperate are self-employed in agriculture and get a higher income from agricultural activities even when they have additional income from hired work. Taking into consideration the level of participation in social and/or cultural events of smallholder farmers in Lithuania, it seems that the group of farmers who are willing to cooperate participate less in social activities in comparison to the other analysed groups. Regarding the physical size of the farm, the larger the size of the farm, the more likely it is to cooperate. The lower the share of direct payments and other support in agricultural income, the more likely farms are to cooperate. Examining the value of the output of small-scale farms, it can be seen that higher values of output relate to more support of farm cooperation. Moreover, the overall value of production is outweighed by the value of crop products. Farms with a higher value of total assets are more willing to cooperate than those with a higher value of farm assets.

5. Discussion

The participation of small-scale farmers in Lithuania in producer groups or cooperatives remains very low in the absence of a sufficient breakthrough compared to previous studies [13]. A specific study on dairy farmers’ business strategies in Central and Eastern Europe [50] showed that Lithuanian farmers (especially milk producers) had the least interest in cooperation and chain integration. Often, this participation is only declared on paper, where farmers fictitiously join producer groups or cooperatives in order to obtain the benefits offered by the government and remain outside the joint cooperative activities. This finding proves the assumption that post-communist smallholders generally disapprove of group cooperation. Economic incentives are therefore key in forming positive intentions to join cooperatives or producer groups [51]. Even when farmers are in favour of cooperation, only one in five farmers is involved in joint activities among small farms [6]. Lithuanian researchers still have a very limited understanding of why the country’s agricultural producers (especially small ones) do not engage in cooperation activities. Low involvement of small family farms in formal cooperatives might be influenced by informal mutual assistance, which is not accounted for, but has long traditions and has gained trust.
Most agricultural cooperatives are relatively small. The level of market integration of the small-scale farms in Lithuania is very low, even when the possibility to get a higher price is understood. In previous research [13], the expectation of receiving a higher purchase price as the main reason for cooperative creation was also observed. In addition, Pareigienė and Ribašauskienė [13] found that additional factors, such as EU and national support for the development of the cooperative, and access to the services provided by the cooperative are important and influence farmers’ decisions to join cooperatives in Lithuania. Dendup and Aditto [52] found that the support measures were positively and strongly linked to the participation of farmers in the cooperative. Hao et al. [41] find that cooperative membership has a positive impact on selling to wholesalers and a negative impact on selling to small retailers but has no significant impact on selling to the cooperative. As products sold through cooperatives generally comply with relatively stringent food quality and safety standards, these results imply that policies promoting cooperative members to sell their products through cooperatives are likely to have a significant impact on food quality and food safety.
Smallholder farmers in Lithuania have a weak position on the market with no bargaining power; only 4% (one in twenty-four small-scale farms) sell their products within a producer group or cooperative. The results from Borychowski et al. [10] show that the resilience of farms (including Lithuania) was significantly influenced by market integration. Our study revealed that only 2% (one in fifty small-scale farms) affect the purchase prices of raw materials. More than half, i.e., 57%, of small-scale farms do not plan to join any type of cooperation and only 8% of the small-scale farms in Lithuania have intentions to join a producer group or cooperative in the future. Higher production increases the income of small-scale farms, as they are in the stage of increasing economies of scale. The effect of a higher scale of production is lower fixed unit costs, lower labour intensity, and higher bargaining power in the supply chain [10,41]. Small-scale farms have a weak market position in the input market without making a significant contribution to forming terms of contracts or negotiating more favourable input prices. Similar results were obtained in Dendup and Aditto’s study [52]. The poor market, production issues like inaccessibility to inputs, and weak group cohesion among members hinder the performance of agricultural cooperatives in Bhutan. Small-scale farms in Lithuania use only the compulsory risk management tool and only 16% of the total sample are willing to cooperate.
The age of the farmers seems to be important factor in fostering the contractual integration processes. The younger a small-scale farm manager is, the more positive is his perception of cooperation activities. Dendup and Aditto’s [52] study showed the positive and significant relationship of agricultural cooperatives with the age of the farmer. A literature overview shows that the age of the producer is usually associated with risk aversion and more diversified production. Together, they contribute to higher food security, and they may also stabilise agricultural income, which is an element of socio-economic sustainability. According to Gadanakis et al. [53], the relationship between a farmer’s age and the farm’s eco-performance was positive. This was explained by the greater experience of the manager [52,53]. Otherwise, age negatively affected resilience at a significant level (α = 0.01) in Lithuania according to a study based on the same dataset as used in this study [10].
Neves et al. [26] found that, in Brazil, higher education and smaller property sizes are associated with membership in agricultural cooperatives. In Lithuania, a bachelor’s degree is predominant in the group of farms willing to cooperate, but there was no significant impact of education on resilience in Lithuania according to Borychowski et al. [10] study. The farm size analysis showed different results: the larger the size of the farm in Lithuania is, and more likely it is to cooperate. Dendup and Aditto’s [52] study showed the positive and significant relationship of agricultural cooperatives and farm size. The study from Borychowski et al. [10] found that the farm area variable was significant in Lithuania, but negatively influenced the farm resilience. In the same study it was determined that animal production had a significant positive impact on farm resilience [10] in Lithuania. However, our study showed that livestock farms are reluctant to cooperate in order to strengthen their position on the market. This point was also proved in [50], which notes that dairy producers from Lithuania have the least interest in cooperation and chain integration among the analysed countries.
In the conditions of the dominance of corporations in food chains (vertical integration), reasoning would require horizontal cooperation, as the scale of production in family farms may turn out to be too small [54]. Offering large product batches is a necessity for farmers for their overall presence on the market (both domestic and foreign) as there is a growing level of concentration of the wholesale and retail commercial network in most countries in the world [55]. A structural approach to the issue of the organisation of the producer groups or cooperatives on the market and long-term financial and institutional stimulation is needed, accompanied by promotion actions.
Despite the low level of cooperation in Lithuania, farmers’ willingness to cooperate should be maintained by explaining the benefits of cooperation. Kovačic et al. [6] suggested supporting small-scale farms in the joint purchase of reproduction materials, joint appearance on the market, and cross-funding (loans), detecting those which could be the initiators of cooperation activities. Generalizing the main resources, regulating work in a cooperative, promoting leadership, and informing farmers about the main benefits of cooperation are suggested as the main points in the cooperation development study carried out in Russia by Nekrasov et al. [7]. Proper agricultural and food price policies can incentivise private investment in agriculture and private banking institutions (including cooperatives) to increase their coverage in rural areas, thus strengthening farmers’ resilience and risk-coping capacities [56]. Authors have even suggested international financial cooperation models. Dendup and Aditto [52] suggested promoting contractual integration through higher value-added products and improved processing, active education, and training.
Special attention should be paid to the strengthening of human capital, e.g., the training of cooperation managers, qualitative development of the network of marketing specialists, and consultants presenting and highlighting the added value generated by the cooperation. Other key variables are access to credit and extension services. Jeanneaux et al. [57] suggested implementing a strategic management approach, where cooperative members can identify their own situations with the help of a third party. The provision of governmental rural extension services mostly targets family-owned farms [26]. Providing positive examples of joining agricultural cooperatives should deliver additional incentives for farmers to cooperate in order to extract these additional benefits from cooperation [15]. Although this may be a difficult task, as young farmers in Lithuania are reluctant to use the advisory services for the development of cooperative activities [58].
New forms of information provision and inclusive cooperative activities should be encouraged in order to attract farmers, especially those of a younger age. New forms of cooperation must be offered to farmers, especially to smallholder ones. This requires the preparation of a legal framework for the establishment and development of service provision cooperatives, introducing sharing-economy principles in farming, etc. Fulton and Giannakas [59] found that procompetitive and distributional impacts of cooperatives depend critically on the sensitivity of price in the downstream retail market, the nature of the cooperative’s governance structure, and the open or closed nature of cooperative membership. Ramanauskas [60] suggests that the perspective organisational form of the producer groups might be a combination of a net cooperative and a private (public) company or state capital institution. However, there is no legal basis for that in Lithuania. Šumylė and Ribašauskienė [61] emphasized that the future of the producer groups in Lithuania lies in servitisation.

6. Conclusions

This study aims to assess the level of the willingness to cooperate among smallholder farmers in Lithuania and to draw up the profiles of small-scale farms that participate in and intend to join cooperatives. The profiles of the smallholder farmers were assessed from a social point of view: the age structure, gender, education, socio-economical group, and participation in social and/or cultural events were assessed. In addition, farms’ economical and financial ratios were included to draw the profile of the small-scale farm; the main indicators used in the analysis were farm size and type, income structure, share of support in total farm income, the farm market value of assets, and the level of capital resources. The research results show that participation of small-scale farms in the co-operatives or producers’ groups is very low. The small-scale farms which are willing to cooperate are distinguished by the larger physical size of the farm, the lower share of direct payments and other support in agricultural income, a higher value of output, and a higher value of total assets. Additionally, younger farmers with a bachelor’s degree who are self-employed in agriculture and get higher income from agricultural activities are more willing to participate in cooperative activities, regardless of gender.
In this case, the chosen analysis method (descriptive statistics) stands on its own as a research product, because the position of the small-scale farms in Lithuania and its characteristics have not previously been investigated. The analysis is based on the unique sample of small-scale farms of the Republic of Lithuania. A descriptive research method was chosen to identify the factors and characteristics of cooperative farms. The creation and description of a cooperative farm profile allows (in further research) the picture of the farm to be defined and the essential features of the farm to be identified, which are thought to form the basis for the development of farm cooperation. The direction of further research would allow for the identification of causal relationships and the establishment of a list of factors that significantly determine the participation of farms in joint activities (cooperation).
The findings of this study are important in guiding policy makers with regard to decisions on small-scale farms’ cooperation development. The results of this study are also important for the farmers themselves and for other stakeholders because they can build closer relationships to develop common and sustainable future partnerships.
The presented study did not evaluate the causal relationship between the different indicators which may influence the participation in contractual integration; future research could fill in this gap which in turn could be expanded to a deeper analysis of smallholder farmers’ behaviour and willingness to participate in cooperation using causal analysis and other econometric and statistical methods. Based on this research, we propose that the farmers’ preferences for participating in cooperation should be assessed using qualitative research methods such as co-creation and design thinking.

Author Contributions

Conceptualization, J.D. and V.V.; methodology, J.D. and V.V.; validation, J.D. and V.V.; investigation, J.D. and V.V.; literature review, J.D. and V.V.; data curation, V.V. and L.N.; writing—original draft preparation, J.D. and V.V.; writing—review and editing, J.D., V.V. and L.N.; visualization, V.V. and L.N.; supervision, V.V.; project administration, J.D. All authors have read and agreed to the published version of the manuscript.

Funding

This research was funded under the international FAMFAR Project “The role of the small farms of the sustainable development of agri-food sector in the countries of Central and Eastern Europe“ (2019–2021), financed by the Polish National Agency for Academic Exchange (NAWA), agreement no. PPI/APM/2018/1/00011/U/001.

Institutional Review Board Statement

Not applicable.

Informed Consent Statement

Not applicable.

Data Availability Statement

Data is contained within the article.

Acknowledgments

We appreciate the Chamber of Agriculture of the Republic of Lithuania for the assistance in conducting the interviews and gathering the data for the study.

Conflicts of Interest

The authors declare no conflict of interest. The views expressed are those of the author(s) and do not necessarily represent those of the Government Strategic Analysis Center.

Appendix A

Table A1. Descriptive statistics of the main quantitative variables.
VariableObs.MeanStd. Dev.MinMax
Age100247.6113.681977
Women49047.7313.672077
Men51247.4913.651974
Total farm area (ha)100210.495.92120
Direct payments and other support in agricultural income (%)100254.9325.475100
Income structure, agricultural (%)100239.1923.764100
Income structure, work (%)100242.0432.020100
Income structure, self-employment (%)10029.7218.19095
Income structure, pensions (%)10027.3919.24080
Income structure, social transfers, (%)10021.428.11075
Income structure, remittances (%)10020.142.75076
Income structure, other sources (%)10020.122.10040
Total value of agricultural production, total (euro)10025614.284900.82048,000
Total value of agricultural production, plant (euro)10023287.054368.11048,000
Total value of agricultural production, animal (euro)10022330.623477.31023,000
Estimated market value of farm, total (euro)100251,308.2437,690.97600205,000
Estimated market value of farm, land (euro)100227,146.4922,571.490130,000
Estimated market value of farm, capital assets (euro)100221,832.3421,538.600140,000
Estimated market value of farm, livestock (euro)10022501.9674559.91080,000
Table A2. Descriptive statistics of the main qualitative variables.
VariableFrequencyVariableFrequency
Sex Participation in a social and/or cultural events
Female490Yes784
Male512No218
Education Farm type
No education1Field crops—cereals185
Primary0Horticulture38
Secondary32Wine3
Vocational454Other permanent crops43
General58Milk47
Bachelor’s degree340Other grazing livestock25
Master’s degree117Granivores52
Socio-economic group Mixed cropping108
Self-employers in agriculture268Horticulture17
Hired workers549Other field crops34
Self-employers, employers (in in other activities)76Mixed livestock41
Pensioners96Various crops and livestock combined388
Socially supported12Berry growing21
Households living on social transfers1

References

  1. Ajates, R. Agricultural cooperatives remaining competitive in a globalised food system: At what cost to members, the cooperative movement and food sustainability? Organization 2020, 27, 337–355. [Google Scholar] [CrossRef]
  2. Gonzalez, R.A. Farmers’ cooperatives and sustainable food systems in Europe. Routledge 2018, 11, 45. [Google Scholar]
  3. Candemir, A.; Duvaleix, S.; Latruffe, L. Agricultural cooperatives and farm sustainability–A literature review. J. Econ. Surv. 2017, 35, 1118–1144. [Google Scholar] [CrossRef]
  4. Ollila, P. Farmers’ cooperatives as market coordinating institutions. Ann. Public Coop. Econ. 2007, 65, 81–102. [Google Scholar] [CrossRef]
  5. Munch, D.M.; Schmit, T.M.; Severson, R.M. Assessing the value of cooperative membership: A case of dairy marketing in the United States. J. Co-Oper. Organ. Manag. 2021, 9, 100129. [Google Scholar] [CrossRef]
  6. Kovačic, D.; Juračak, J.; Žutinic, D. Willingness of farmers to cooperate. Field Study Results in the Zagreb Rural Area. Druš. Istraž. Zagreb God. 2001, 6, 1119–1129. [Google Scholar]
  7. Nekrasov, R.V.; Gusakova, E.P.; Afanaseva, E.P. Problems in Agricultural Cooperation Development in Russia (Case Study of Samara Region). HS Web Conf. 2019, 62, 08003. [Google Scholar] [CrossRef] [Green Version]
  8. Wolz, A.; Zhang, S.; Ding, Y. Agricultural production cooperatives and agricultural development. Leibniz Inf. Cent. Econ. Work. Pap. CIRIEC 2020, 4, 1452. [Google Scholar]
  9. Vitunskienė, V.; Droždz, J.; Bendoraitytė, A.; Lauraitienė, L. Representing the interests of small farms in the market through cooperatives: Effect on producers’ price/Mažų ūkių interesų atstovavimas rinkoje per kooperatyvus: Poveikis gamintojų kainai. Manag. Theory Stud. Rural Bus. Infrastruct. Dev. 2020, 42, 561–570. [Google Scholar] [CrossRef]
  10. Borychowski, M.; Stępień, S.; Polcyn, J.; Tošović-Stevanović, A.; Ćalović, D.; Lalić, G.; Žuža, M. Socio-Economic Determinants of Small Family Farms’ Resilience in Selected Central and Eastern European Countries. Sustainability 2020, 12, 10362. [Google Scholar] [CrossRef]
  11. Kispál-Vitai, Z.; Regnard, Y.; Kövesi, K.; Guillotte, C.A. Cooperative case studies from three countries: Is membership a problem or a solution in the 21st century? Soc. Econ. 2019, 41, 467–485. [Google Scholar] [CrossRef] [Green Version]
  12. Atkočiūnienė, V.; Aleksandravičius, A.; Dautartė, A.; Vitunskienė, V.; Zemeckis, R. Farm Modernization in the Context of Markets and Rural Development: The Case of Lithuania/Ūkių Modernizacija Rinkų ir Kaimo Vystymosi Kontekste: Lietuvos Atvejis; Aleksandras Stulginskis University: Akademija, Lithuania, 2007. [Google Scholar]
  13. Pareigienė, L.; Ribašauskienė, E. Evaluation of Cooperation Development/Kooperacijos plėtros vertinimas. Manag. Theory Stud. Rural Bus. Infrastruct. Dev. 2008, 1, 127–133. [Google Scholar]
  14. Kuliešis, G.; Pareigienė, L. Evaluatinion of Attitudes to Cooperate / Nuostatų kooperuotis vertinimas. Manag. Theory Stud. Rural Bus. Infrastruct. Dev. 2010, 5, 108–115. [Google Scholar]
  15. Tuna, E.; Karantininis, K. Agricultural cooperatives as social capital hubs—A case in a post-socialist country. J. Co-Oper. Organ. Manag. 2021, 9, 100134. [Google Scholar] [CrossRef]
  16. Livingston, M.; Erickson, K.; Mishra, A. Standard and Bayesian random coefficient model estimation of US corn—Soybean farmer risk attitudes. In The Economic Impact of Public Support to Agriculture: An International Perspective; Ball, V., Fanfani, R., Gutierrez, L., Eds.; Springer: New York, NY, USA, 2010. [Google Scholar] [CrossRef]
  17. Stępień, S.; Polcyn, J. Risk management in small family farms in Poland. In Proceedings of the International Scientific Conference Economic Science for Rural Development, Jelgava, Latvia, 9–10 May 2019; pp. 382–388. [Google Scholar] [CrossRef]
  18. Kahneman, D.; Tversky, A. Prospects theory: An analysis of decision under risk. Econometrica 1979, 47, 263–292. [Google Scholar] [CrossRef] [Green Version]
  19. Czyzewski, B.; Sapa, A.; Kułyk, P. Human Capital and Eco-Contractual Governance in Small Farms in Poland: Simultaneous Confirmatory Factor Analysis with Ordinal Variables. Agriculture 2021, 11, 46. [Google Scholar] [CrossRef]
  20. Chagwiza, C.; Muradian, R.; Ruben, R. Cooperative membership and dairy performance among smallholders in Ethiopia. Food Policy 2016, 59, 165–173. [Google Scholar] [CrossRef]
  21. Mojo, D.; Fischer, C.; Degefa, T. The determinants and economic impacts of membership in coffee farmer cooperatives: Recent evidence from rural Ethiopia. J. Rural Stud. 2017, 50, 84–94. [Google Scholar] [CrossRef]
  22. Zhang, B.; Fu, Z.; Wang, J.; Tang, X.; Zhao, Y.; Zhang, L. Effect of householder characteristics, production, sales and safety awareness on farmers’ choice of vegetable marketing channels in Beijing, China. Br. Food J. 2017, 119, 1216–1231. [Google Scholar] [CrossRef]
  23. Jitmun, T.; Kuwornu, J.; Datta, A.; Anal, A. Factors influencing membership of dairy cooperatives: Evidence from dairy farmers in Thailand. J. Co-Oper. Organ. Manag. 2020, 8, 100109. [Google Scholar] [CrossRef]
  24. Martey, E.; Etwire, P.; Wiredu, A.; Dogbe, W. Factors influencing willingness to participate in multi-stakeholder platform by smallholder farmers in Northern Ghana: Implication for research and development. Agric. Food Econ. 2014, 2, 11. [Google Scholar] [CrossRef] [Green Version]
  25. Lutz, J.; Smetschka, B.; Grima, N. Farmer Cooperation as a Means for Creating Local Food Systems—Potentials and Challenges. Sustainability 2017, 9, 925. [Google Scholar] [CrossRef] [Green Version]
  26. Neves, M.d.C.R.; Silva, F.d.F.; Freitas, C.O.d.; Braga, M.J. The Role of Cooperatives in Brazilian Agricultural Production. Agriculture 2021, 11, 948. [Google Scholar] [CrossRef]
  27. Crespi, J.M.; Saitone, T.L.; Sexton, R.J. Competition in US farm product markets: Do long-run incentives trump short-run market power? Appl. Econ. Perspect. Policy 2012, 34, 669–695. [Google Scholar] [CrossRef] [Green Version]
  28. Melnikienė, R.; Vidickienė, D. Evaluation of the Lithuanian Agricultural Policy Based on the Analysis of Qualitative Structure. Public Policy Adm. 2019, 18, 52–67. [Google Scholar] [CrossRef] [Green Version]
  29. Miceikienė, A.; Binkienė, D.; Savickienė, J.; Butkuvienė, V. Opportunities and problems for financing of agricultural cooperatives / Žemės ūkio kooperatyvų finansavimo galimybės ir problemos. Sci. Stud. Account. Financ. Probl. Perspect. 2017, 11, 32–40. [Google Scholar] [CrossRef] [Green Version]
  30. Muriqi, S.; Fekete-Farkas, M.; Baranyai, Z. Drivers of cooperation activity in Kosovo’s agriculture. Agriculture 2019, 9, 96. [Google Scholar] [CrossRef] [Green Version]
  31. Vituskienė, V.; Droždz, J.; Lauraitienė, L.; Bendoraitytė, A. 2003–2018 study (evaluation) of agricultural policy measures with a view to a more effective agricultural policy and the economic and social viability of small and medium-sized farms. In Final Report of the R&D Project of the Research and Experimental Development Program. for Agriculture, Food, Fisheries and Rural Development 2015–2020; Vytautas Magnus University: Kaunas, Lithuania, 2020. [Google Scholar]
  32. Ciburiene, J. Farmers’ Cooperative in the Context of Economic Transformations in Lithuania. In Proceedings of the 2015 International Conference “Economic Science for Rural Development”, Jelgava, Latvia, 23–24 April 2015; pp. 134–141. [Google Scholar]
  33. Abate, G.T. Drivers of agricultural cooperative formation and farmers’ membership and patronage decisions in Ethiopia. J. Co-Oper. Organ. Manag. 2018, 6, 53–63. [Google Scholar] [CrossRef]
  34. Ciliberti, S.; Frascarelli, A.; Martino, G. Drivers of Participation in Collective Arrangements in the Agri-Food Supply Chain. Evidence from Italy Using a Transaction Costs Economics Perspective. Ann. Public Coop. Econ. 2020, 91, 387–409. [Google Scholar] [CrossRef]
  35. Ncube, D. The importance of contract farming to small-scale farmers in Africa and the implications for policy: A review scenario. Open Agric. J. 2020, 14, 59–86. [Google Scholar] [CrossRef]
  36. Souza, A.B.D.; Fornazier, A.; Delgrossi, M.E. Local food systems: Potential for new market connections for family farming. Ambiente Soc. 2020, 23, 4422. [Google Scholar] [CrossRef]
  37. Makutėnas, V.; Šukienė, A. Kooperacijos reikšmė ūkininkų ūkių veiklos efektyvumui. Manag. Theory Stud. Rural Bus. Infrastruct. Dev. 2017, 39, 203–214. [Google Scholar] [CrossRef] [Green Version]
  38. Klepacki, B.; Krajewski, J. Wykorzystanie środków pomocowych Unii Europejskiej w rozwoju infrastruktury logistycznej grup producenckich w ogrodnictwie (The use of the European Union’s aid funds in the development of logistics infrastructure of fruit producer groups in horticulture). Rocz. Nauk. Stowarzyszenia Ekon. Rol. I Agrobiz. 2015, 5, 136–140. [Google Scholar]
  39. Zakić, N.; Vukotić, S.; Cvijanović, D. Organisational models in agriculture with special reference to small farmers. Econ. Agric. 2014, 61, 225–237. [Google Scholar]
  40. Herbel, D.; Haddad, O.N. Successful farmer collective action to integrate food production into value chains. Food Chain 2012, 2, 164–182. [Google Scholar] [CrossRef]
  41. Hao, J.; Bijman, J.; Gardebroek, C.; Heerink, N.; Heijman, W.; Huo, X. Cooperative membership and farmers’ choice of marketing channels–Evidence from apple farmers in Shaanxi and Shandong Provinces, China. Food Policy 2018, 74, 53–64. [Google Scholar] [CrossRef]
  42. Ortega, D.L.; Bro, A.S.; Clay, D.C.; Lopez, M.C.; Tuyisenge, E.; Church, R.A.; Bizoza, A.R. Cooperative Membership and Coffee Productivity in Rwanda’s Specialty Coffee Sector. Food Secur. 2019, 11, 967–979. [Google Scholar] [CrossRef]
  43. Meuwissen, M.P.; Bottema, M.J.; Ho, L.H.; Chamsai, S.; Manjur, K.; de Mey, Y. The role of group-based contracts for risk-sharing; what are the opportunities to cover catastrophic risk? Curr. Opin. Environ. Sustain. 2019, 41, 80–84. [Google Scholar] [CrossRef]
  44. Vitunskienė, V. Žalio pieno vidaus rinkos struktūra ir koncentracija Lietuvoje. Manag. Theory Stud. Rural Bus. Infrastruct. Dev. 2019, 41, 576–588. [Google Scholar] [CrossRef] [Green Version]
  45. Radzevičius, G.; Ramanauskas, J.; Contò, F. Possibilities for reduction of food loss and waste: The case study of Lithuania’s producer cooperatives. Ital. J. Food Sci. 2015, 14, 99–102. [Google Scholar]
  46. Agarwal, B.; Dorin, B. Group farming in France: Why do some regions have more cooperative ventures than others? Env. Plan. A Econ. Space 2019, 51, 781–804. [Google Scholar] [CrossRef] [Green Version]
  47. Apparao, D.; Garnevska, A.; Shadbolt, N. Examining commitment, heterogeneity and social capital within the membership base of agricultural co-operatives—A conceptual framework. J. Co-Oper. Organ. Manag. 2019, 7, 42–50. [Google Scholar] [CrossRef]
  48. Vitunskienė, V.; Droždz, J.; Bendoraitytė, A.; Sapa, A. Small farms in Lithuania. In Small Farms in the Paradigm of Sustainable Development Case Studies of Selected Central and Eastern European Countries; Stępień, S., Maican, S., Eds.; Wydawnictwo Adam Marszałek: Toruń, Poland, 2020; Volume 14, pp. 75–99. Available online: https://marszalek.com.pl/small_farms.pdf (accessed on 28 October 2021).
  49. Loeb, S.; Dynarski, S.; McFarland, D.; Morris, P.; Reardon, S.; Reber, S. Descriptive Analysis in Education: A Guide for Researchers; NCEE 2017-4023; Department of Education, Institute of Education Sciences, National Center for Education Evaluation and Regional Assistance: Washington, DC, USA, 2017. [Google Scholar]
  50. Verhees, F.; Malak-Rawlikowska, A.; Stalgiene, A.; Kuipers, A.; Klopčič, M. Dairy farmers’ business strategies in Central and Eastern Europe based on evidence from Lithuania, Poland and Slovenia. Ital. J. Anim. Sci. 2018, 17, 755–766. [Google Scholar] [CrossRef] [Green Version]
  51. Möllers, J.; Traikova, D.; Bîrhală, B.A.M.; Wolz, A. Why (not) cooperate? A cognitive model of farmers’ intention to join producer groups in Romania. Post-Communist Econ. 2018, 30, 56–77. [Google Scholar] [CrossRef]
  52. Dendup, T.; Aditto, S. Performance and challenges of agriculture cooperatives in Bhutan. Khon Kaen Agr. J. 2020, 48, 1194–1205. [Google Scholar] [CrossRef]
  53. Gadanakis, Y.; Bennett, R.; Park, J.; Areal, F.J. Evaluating the Sustainable Intensification of arable farms. J. Environ. Manag. 2015, 150, 288–298. [Google Scholar] [CrossRef] [PubMed] [Green Version]
  54. Zegar, J.S. Kwestia agrarna w Polsce (The agrarian issue in Poland). Warsaw IERiGŻ-PIB 2018, 14, 575. [Google Scholar]
  55. Nosecka, B. Czynniki i Mierniki Konkurencyjności Zewnętrznej Sektora Ogrodniczego i jego Produktów (Factors and Measures of External Competitiveness of the Horticultural Sector and Its Products); Institute of Agricultural and Food Economics: Warsaw, Poland, 2017. [Google Scholar]
  56. Calicioglu, O.; Flammini, A.; Bracco, S.; Bellù, L.; Sims, R. The Future Challenges of Food and Agriculture: An Integrated Analysis of Trends and Solutions. Sustainability 2019, 11, 222. [Google Scholar] [CrossRef] [Green Version]
  57. Jeanneaux, P.; Capitaine, M.; Mauclair, A. PerfCuma: A framework to manage the sustainable development of small cooperatives. Int. J. Agric. Manag. 2018, 7, 68–79. [Google Scholar]
  58. Baležentis, T.; Ribašauskienė, E.; Morkūnas, M.; Volkov, A.; Štreimikienė, D.; Toma, P. Young farmers’ support under the Common Agricultural Policy and sustainability of rural regions: Evidence from Lithuania. Land Use Policy 2020, 94, 104542. [Google Scholar] [CrossRef]
  59. Fulton, M.; Giannakas, K. The Future of Agricultural Cooperatives. Annu. Rev. Resour. Econ. 2013, 5, 61–91. [Google Scholar] [CrossRef]
  60. Ramanauskas, J. Komanditinė kooperatinė bendrovė (kooperatyvas). Socialinės inovacijos skatinant žemės ūkio gamintojų organizacijų ir kooperacijos plėtrą: Tarptautinė mokslinė konferencija: 2016 m. birželio 16-17 d.: Conference proceedings. Vilnius LAEI 2016, 11, 50–52. [Google Scholar]
  61. Šumylė, D.; Ribašauskienė, E. Servitization of Lithuanian agricultural cooperatives. Manag. Theory Stud. Rural Bus. Infrastruct. Dev. 2017, 39, 510–523. [Google Scholar] [CrossRef]
Figure 1. Structure of Lithuanian agricultural cooperatives by the number of members (a) and types and sectors of activity (b) (N = 102 Cooperative survey data, 2019).
Agriculture 11 01071 g001
Figure 2. Type of relations with the market of Lithuanian small farms when selling food or agricultural products (a) or choosing the distribution channel to help reach higher selling prices (b) (N = 1002).
Agriculture 11 01071 g002
Figure 3. Types of agricultural inputs supply (a) and positioning in agricultural input transactions (b) of the small-scale farms in Lithuania (N = 1002).
Agriculture 11 01071 g003
Figure 4. Management of production and price risks (a) and willingness to participate in cooperative actions (b) in Lithuanian small-scale farms (N = 1002).
Agriculture 11 01071 g004
Figure 5. Distribution of smallholder farmers according to their age (N = 1002).
Agriculture 11 01071 g005
Figure 6. Distribution of smallholder farmers according to their gender (a) and the level of education (b) (N = 1002).
Agriculture 11 01071 g006
Figure 7. The socio-economic group of smallholder farmers in Lithuania (a) and participation in social and/or cultural events (b) (N = 1002).
Agriculture 11 01071 g007
Figure 8. Small-scale farm physical size in ha (a) and dependency of farm on agricultural support (b) (N = 1002).
Agriculture 11 01071 g008
Figure 9. Farming types of the groups of small-scale farms willing to cooperate (a) and reluctant to cooperate (b) (N = 1002).
Agriculture 11 01071 g009
Figure 10. Small-scale farm income structure in groups of small farms willing to cooperate (a) and reluctant to cooperate (b) (N = 1002).
Agriculture 11 01071 g010
Figure 11. The value of agricultural production in groups of small-scale farms willing to cooperate (a) and reluctant to cooperate (b) (N = 1002).
Agriculture 11 01071 g011
Figure 12. Farm assets in groups of small farms willing to cooperate (a) and reluctant to cooperate (b) (N = 1002).
Agriculture 11 01071 g012
Table 1. Research stages, main tasks, results, and data sources.
Research StagesTaskResultData Source
Preparation stageDefine the small-scale farm size in LithuaniaDefinition of the small-scale farm of the total Lithuanian farmsFarm Structures Survey data 2016 (Statistics Lithuania, 2018 and EUROSTAT, 2019)
Stage IExplore the main characteristics of the small-scale farms in Lithuania according the official statisticsSmall-scale farms’ performance in LithuaniaFarm Structures Survey data 2016 (Statistics Lithuania, 2018 and EUROSTAT, 2019)
Stage IIExplore the main characteristics and market integration level of the small-scale farms in Lithuania according to the primary data
Investigate the situation of the Agricultural Cooperatives and Cooperative Companies in Lithuania
Dataset on various characteristics and market integration level of small-scale farms in Lithuania
 
Dataset of Agricultural Cooperatives and Cooperative Companies acting in Lithuania (number, size, types. and sectors of activity)
Representative survey of small-scale farms in Lithuania, 2019 (N = 1002)
 
Cooperative survey data, 2019 (N = 102)
Stage IIIDraw up a profile of a smallholder farmer, small-scale farm willing to cooperate and compare to those reluctant to cooperateEconomic characteristics of farms and social profile of smallholder farmer investigatedRepresentative survey of small-scale farms in Lithuania, 2019 (N = 1002)
Table 2. The main statistical characteristics of economically small-scale farms * in Lithuania, 2016.
Economic Size Based on
Standard Output (SO)
Number of Farms% of
Total Farms
% of Farms Where Household Consumes >50% of the Final Production **UAA
in 1000 ha
% of
Total UAA
SO in 1000 €% of
Total SO
Number of AWU% of
Total AWU
Very small farms (<€8000)<€2000 46,30030.858.8164.45.641,3031.928,84019.4
€2000–<€4000 30,89020.560.4142.14.989,5714.023,17015.6
€4000–<€800026,33017.550.9221.47.6148,8046.721,81014.7
Total 103,52068.857.3527.918.1279,67812.673,82049.7
Medium-small farms (€8000–<€25,000)€8000–<€15,00016,39010.924.0257.68.8177,3348.017,26011.6
€15,000–<€25,00062504.23.4175.56.0118,5985.374805.0
Total22,64015.118.3433.114.8295,93213.324,74016.7
Total number of small-scale farms (<€25,000)126,16083.950.3961.032.9575,61025.998,56066.4
* Includes farms that produce agricultural products (crop or livestock), i.e., with SO higher than zero. According to the Farm Structures Survey in 2016, there were over 10,000 farms with zero SO in Lithuania. ** % of all farms in each specified economic size class. Source: own calculations based on EUROSTAT data.
Publisher’s Note: MDPI stays neutral with regard to jurisdictional claims in published maps and institutional affiliations.

