
Affordable Use of Satellite Imagery in Agriculture and Development Projects: Assessing the Spatial Distribution of Invasive Weeds in the UNESCO-Protected Areas of Cuba

 ,
,
Abstract
1. Introduction
2. Materials and Methods
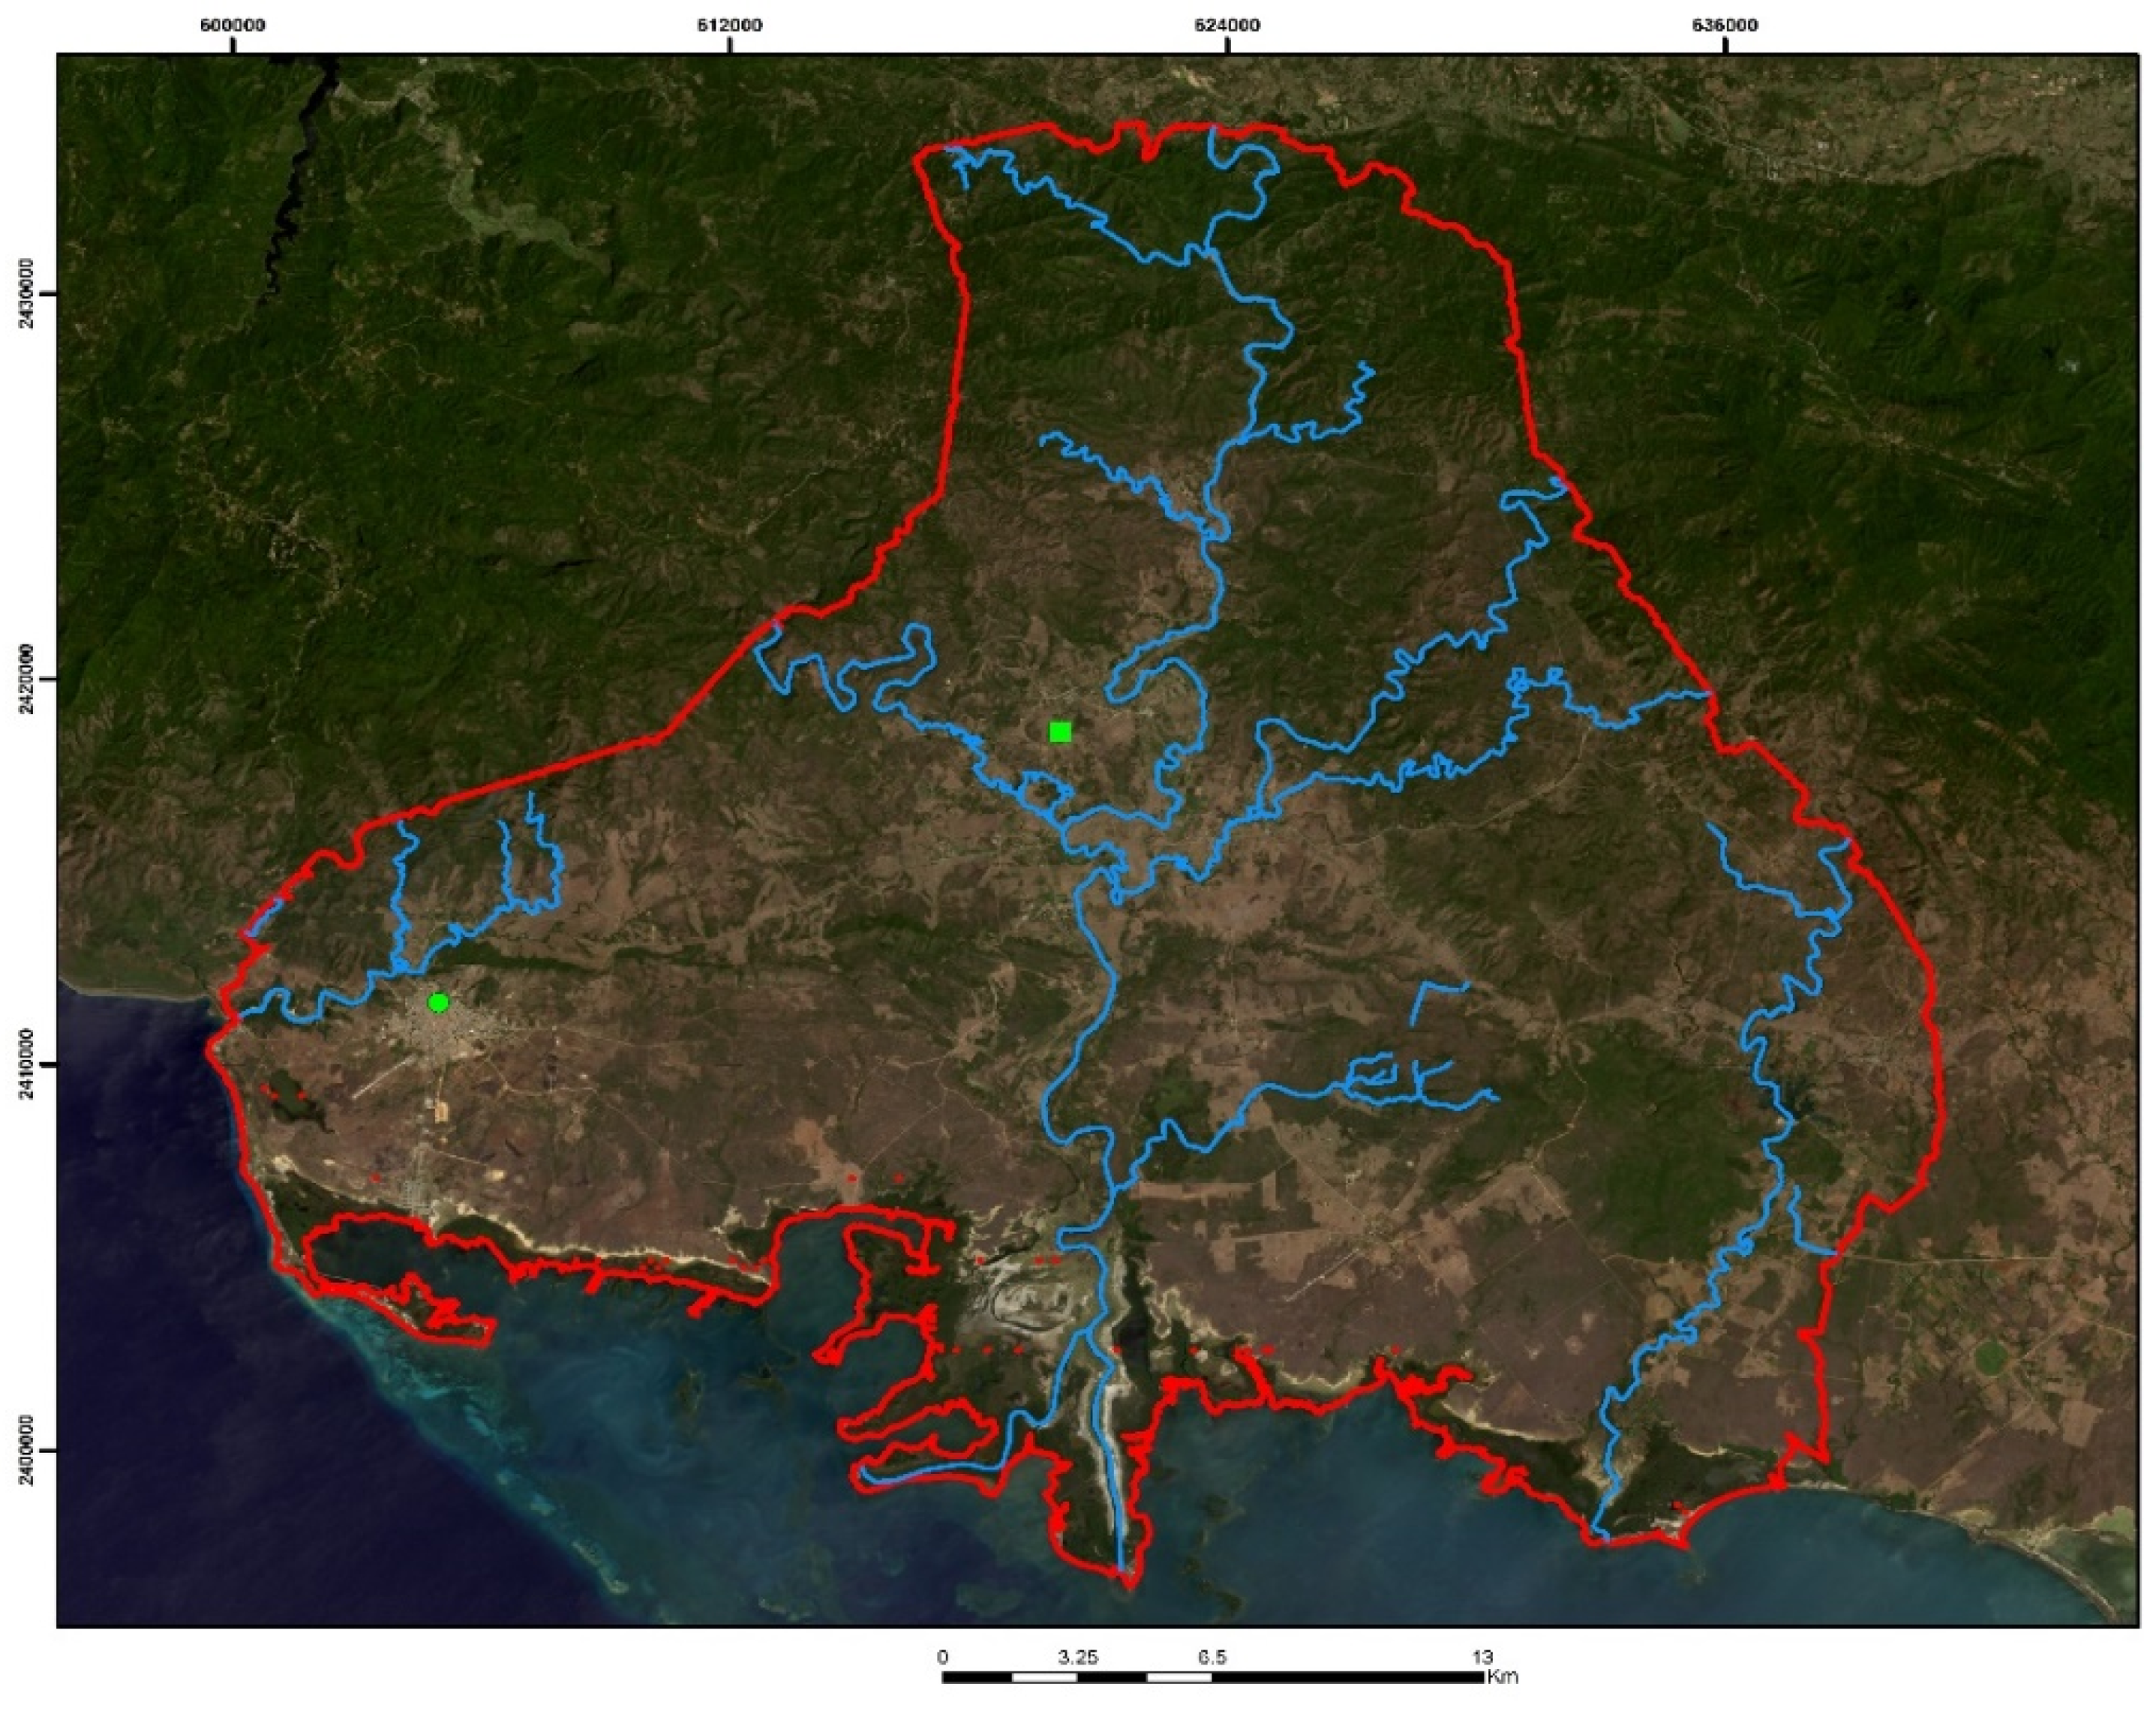
2.1. Study Area
2.2. Data
2.3. Supervised Classification of WorldView-2 Image
2.4. Supervised Classification of Landsat-8 Image
3. Results and Discussion
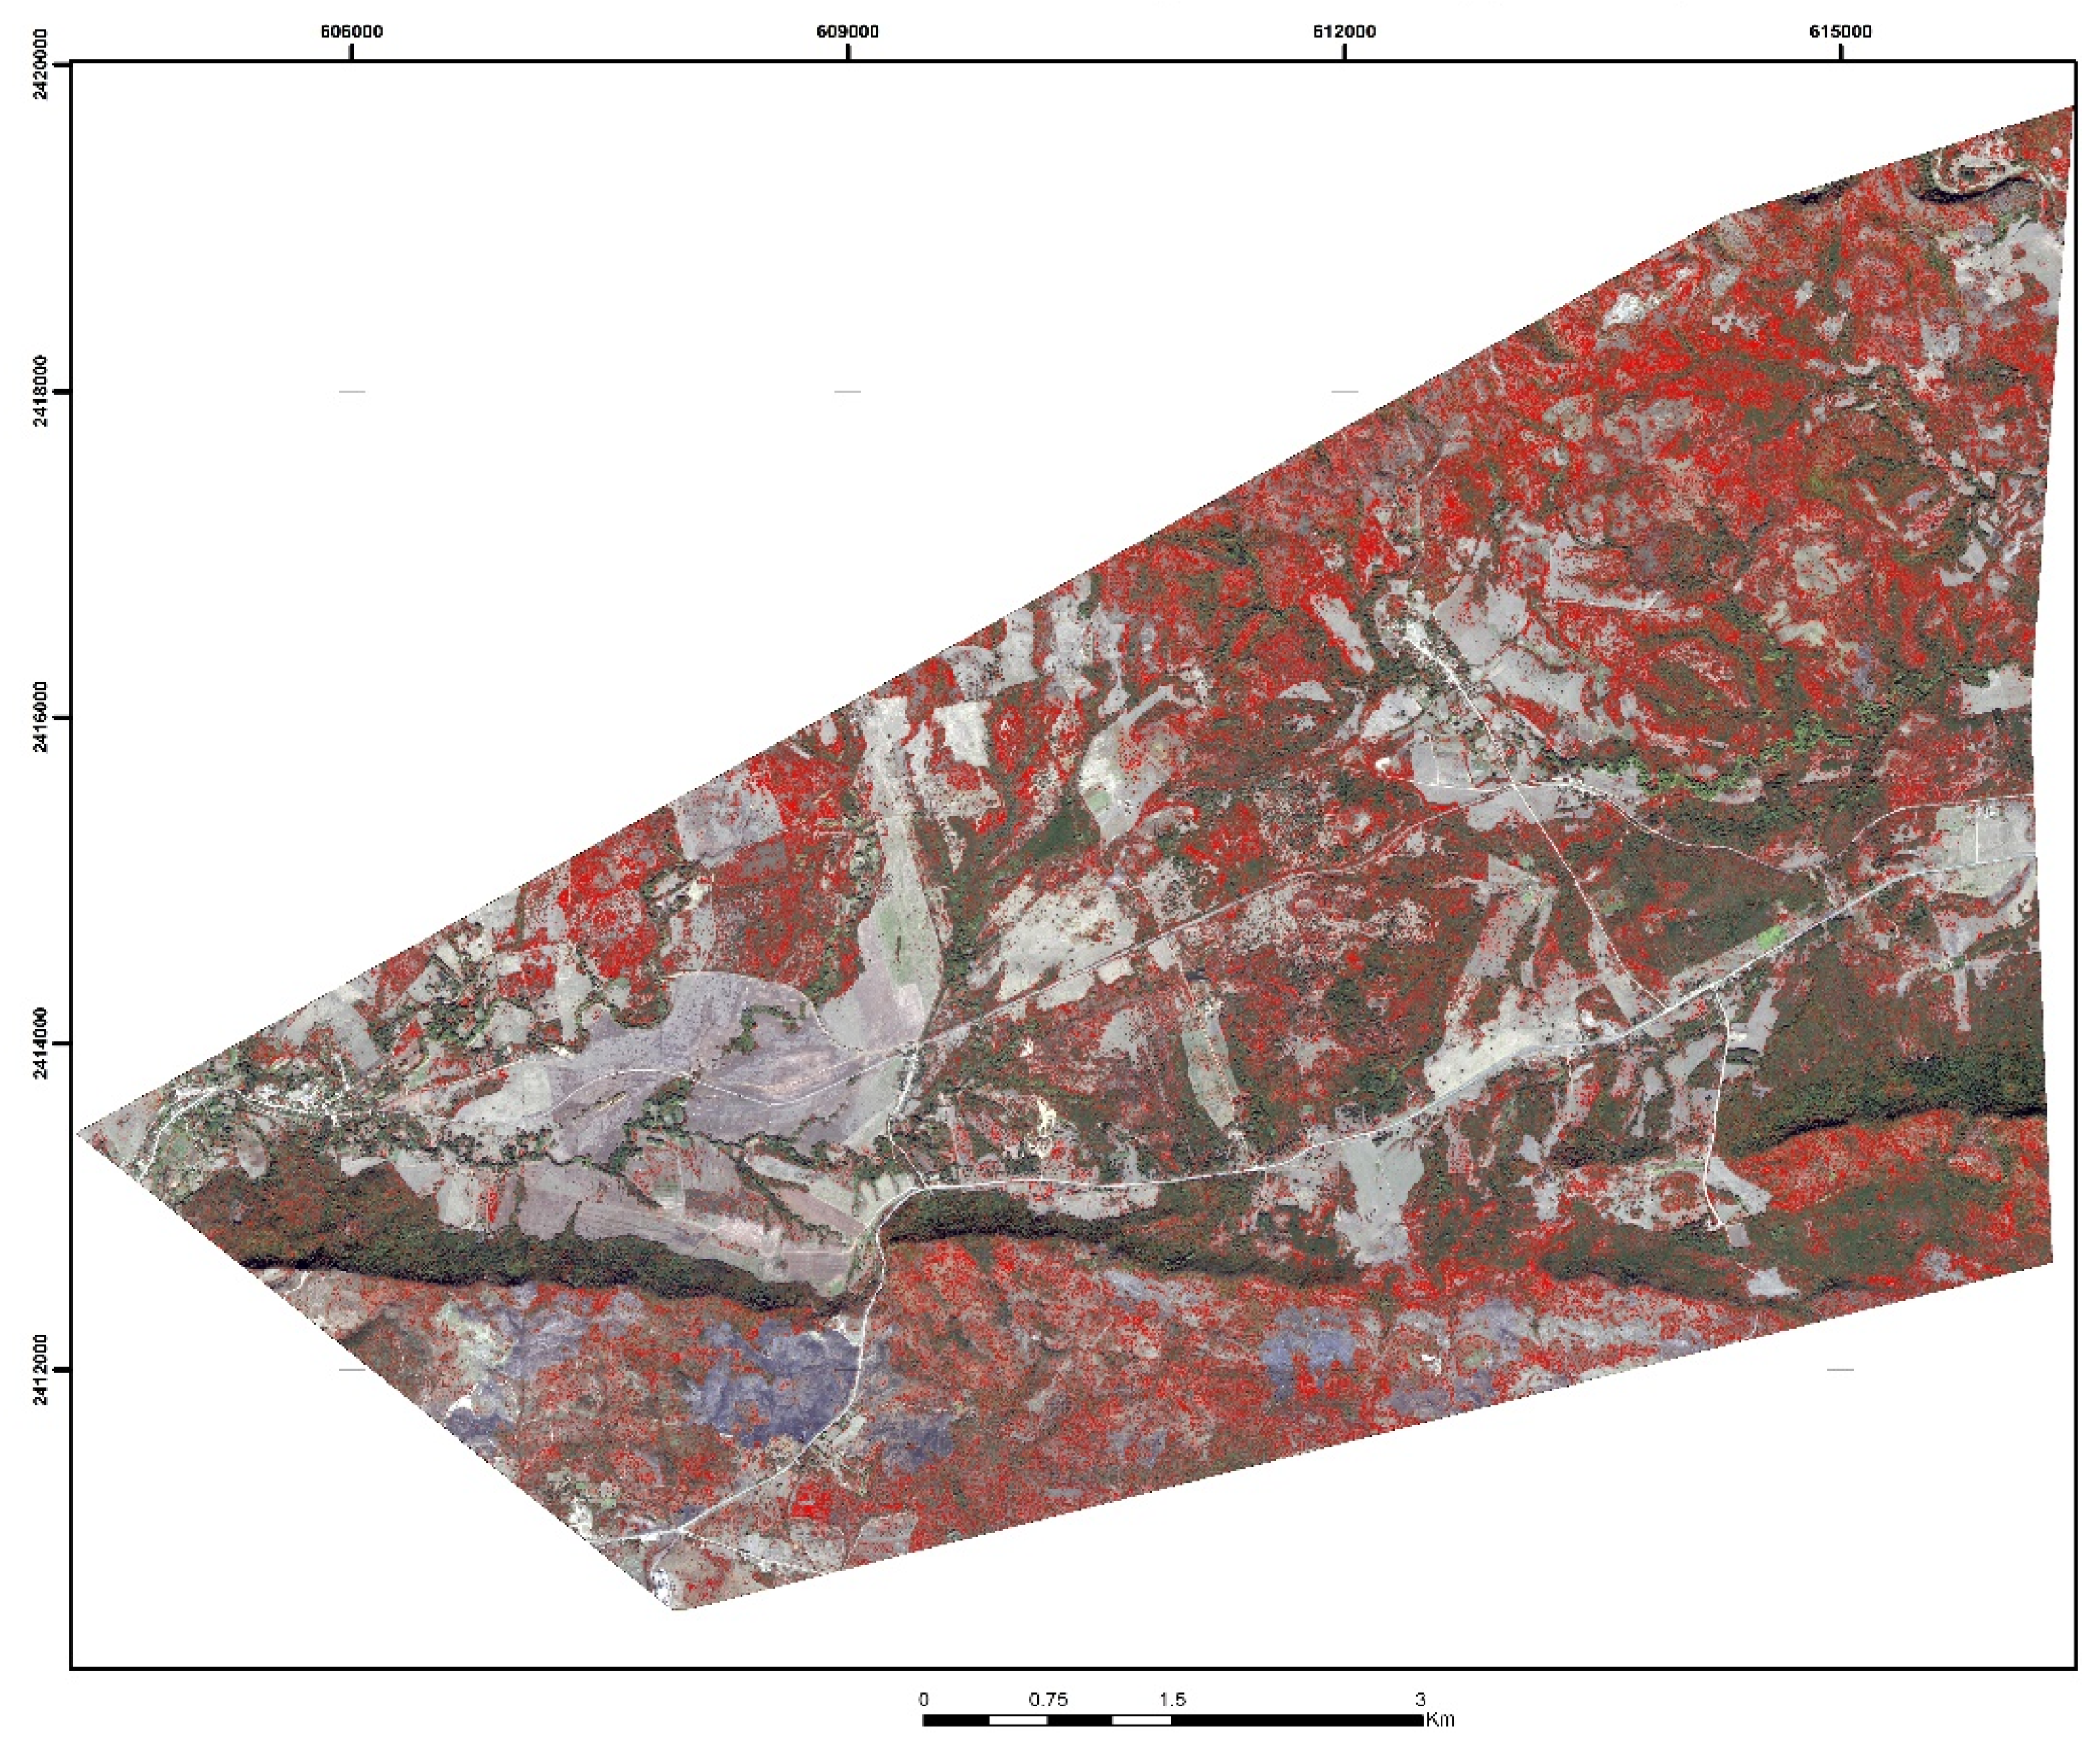
3.1. WorldView-2 Image
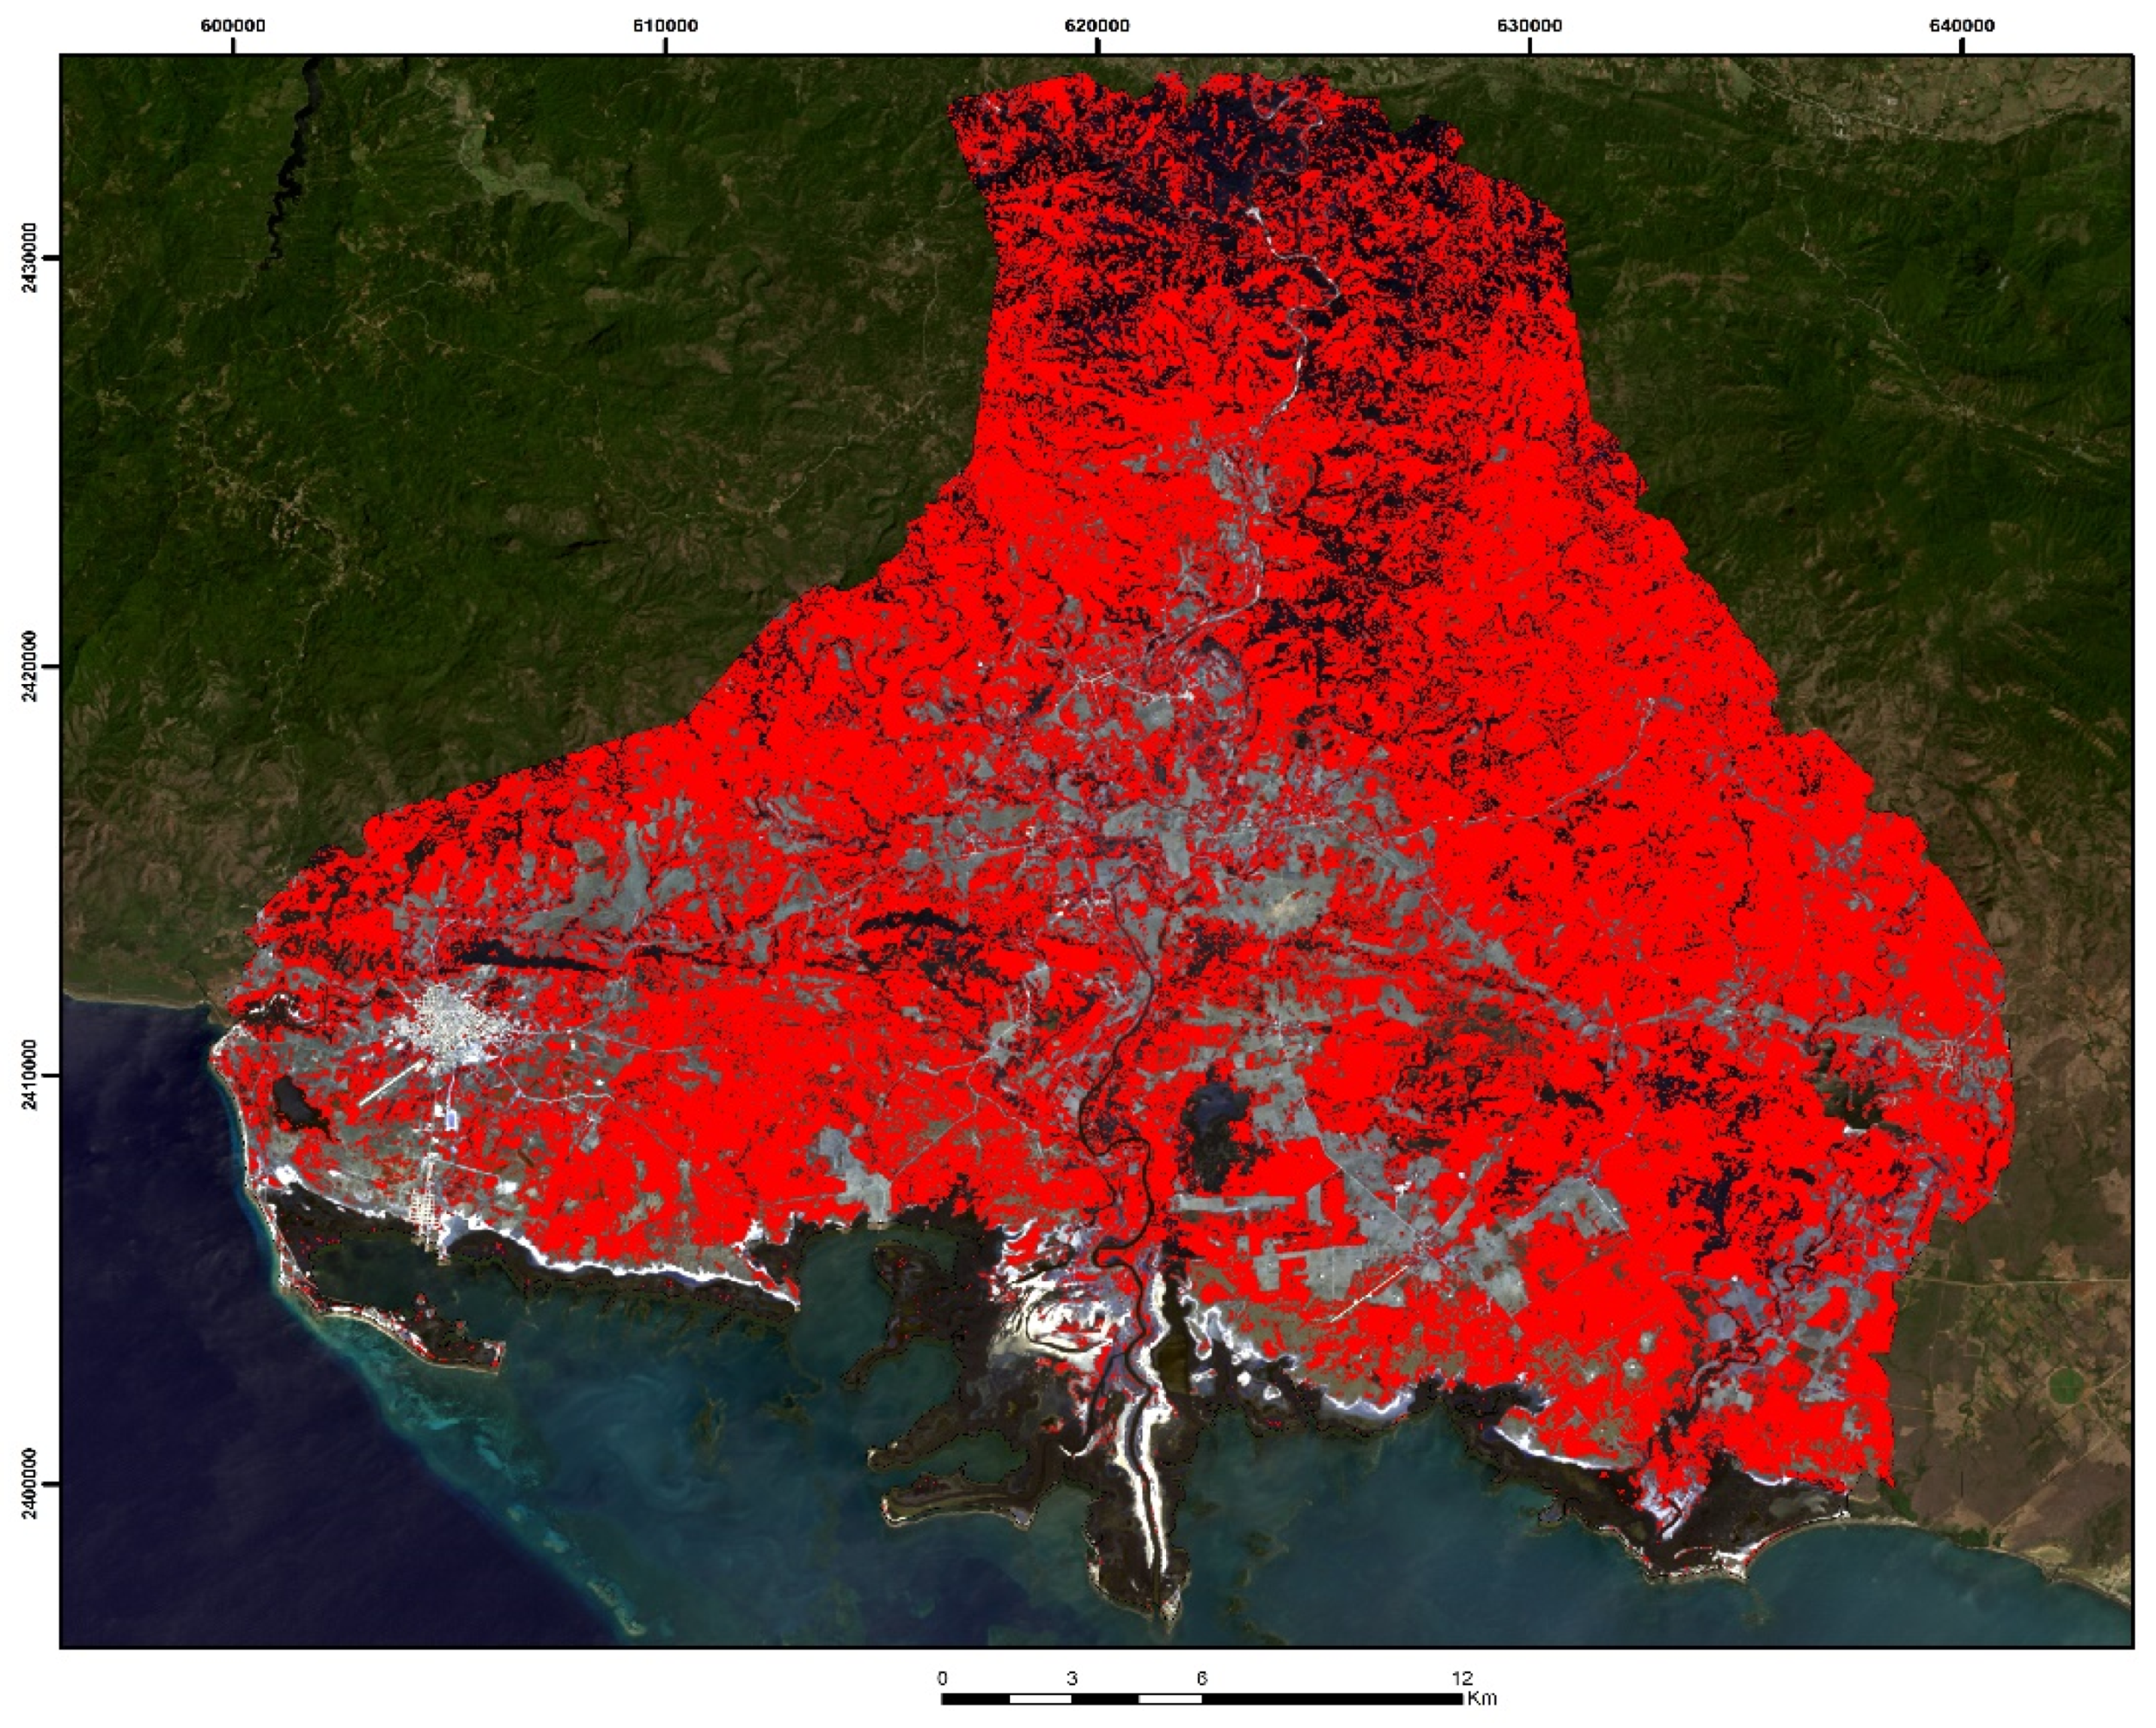
3.2. Landsat-8 Image
4. Conclusions
Author Contributions
Funding
Institutional Review Board Statement
Informed Consent Statement
Conflicts of Interest
Appendix A


References
- Germán, H.C.; Montesbravo, E.P.; Paredes Rodríguez, E.; Calas, P.B. Biologia Reproductiva de Dichrostachys Cinerea (L.) Wight & Arn. (Marabú). (I) Evaluación de Reproduccion Por Semillas. Fitosanidad 2008, 12, 39–43. [Google Scholar]
- Hernandez-Enriquez, O.; Alvarez, R.; Morelli, F.; Bastida, F.; Camacho, D.; Menendez, J. Low-Impact Chemical Weed Control Techniques in UNESCO World Heritage Sites of Cuba. Commun. Agric. Appl. Biol. Sci. 2012, 77, 387–393. [Google Scholar] [PubMed]
- Xie, Y.; Sha, Z.; Yu, M. Remote Sensing Imagery in Vegetation Mapping: A Review. J. Plant Ecol. 2008, 1, 9–23. [Google Scholar] [CrossRef]
- Chen, B.; Jin, Y.; Brown, P. Automatic Mapping of Planting Year for Tree Crops with Landsat Satellite Time Series Stacks. ISPRS J. Photogramm. Remote Sens. 2019, 151, 176–188. [Google Scholar] [CrossRef]
- Abburu, S.; Babu Golla, S. Satellite Image Classification Methods and Techniques: A Review. Int. J. Comput. Appl. 2015, 119, 20–25. [Google Scholar] [CrossRef]
- Paul, M.; Mather, M.K. Computer Processing of Remotely-Sensed Images: An Introduction; John Wiley & Sons: Hoboken, NJ, USA, 2011. [Google Scholar]
- Chen, B.; Tu, Y.; Song, Y.; Theobald, D.M.; Zhang, T.; Ren, Z.; Li, X.; Yang, J.; Wang, J.; Wang, X.; et al. Mapping Essential Urban Land Use Categories with Open Big Data: Results for Five Metropolitan Areas in the United States of America. ISPRS J. Photogramm. Remote Sens. 2021, 178, 203–218. [Google Scholar] [CrossRef]
- Hasmadi, M.; Hz, P.; Mf, S. Evaluating Supervised and Unsupervised Techniques for Land Cover Mapping Using Remote Sensing Data. Geogr. Malays. J. Soc. Space 2009, 5, 1–10. [Google Scholar]
- Panda, S.S.; Terrill, T.H.; Mahapatra, A.K.; Kelly, B.; Morgan, E.R.; van Wyk, J.A. Site-Specific Forage Management of Sericea Lespedeza: Geospatial Technology-Based Forage Quality and Yield Enhancement Model Development. Agriculture 2020, 10, 419. [Google Scholar] [CrossRef]
- Wiens, J.A. Spatial Scaling in Ecology. Funct. Ecol. 1989, 3, 385. [Google Scholar] [CrossRef]
- Blaschke, T.; Hay, G.J.; Kelly, M.; Lang, S.; Hofmann, P.; Addink, E.; Queiroz Feitosa, R.; van der Meer, F.; van der Werff, H.; van Coillie, F.; et al. Geographic Object-Based Image Analysis—Towards a New Paradigm. ISPRS J. Photogramm. Remote Sens. 2014, 87, 180–191. [Google Scholar] [CrossRef]
- Valjarević, A.; Milanović, M.; Valjarević, D.; Basarin, B.; Gribb, W.; Lukić, T. Geographical Information Systems and Remote Sensing Methods in the Estimation of Potential Dew Volume and Its Utilization in the United Arab Emirates. Arab. J. Geosci. 2021, 14, 1–15. [Google Scholar] [CrossRef]
- Clark, M.L. Comparison of Multi-Seasonal Landsat 8, Sentinel-2 and Hyperspectral Images for Mapping Forest Alliances in Northern California. ISPRS J. Photogramm. Remote Sens. 2020, 159, 26–40. [Google Scholar] [CrossRef]
- Oreti, L.; Giuliarelli, D.; Tomao, A.; Barbati, A. Object Oriented Classification for Mapping Mixed and Pure Forest Stands Using Very-High Resolution Imagery. Remote Sens. 2021, 13, 2508. [Google Scholar] [CrossRef]
- Sinoga, J.D.R.; Noa, R.R.; Perez, D.F. An Analysis of the Spatial Colonization of Scrubland Intrusive Species in the Itabo and Guanabo Watershed, Cuba. Remote Sens. 2010, 2, 740–757. [Google Scholar] [CrossRef]
- Sánchez, F.; De Julián, J.J.; Ordóñez, A. Tipologías Constructivas En Una Ciudad Patrimonio de La Humanidad: Trinidad, Cuba. Rev. Constr. 2010, 9, 89–97. [Google Scholar] [CrossRef][Green Version]
- Luis, J.; Díaz, D.; Celada, M.S.; Gutiérrez, E.Q. Determinación de La Dinámica Del Relieve En Territorios Montañosos: Un Nuevo Enfoque Geomorfológico Ambiental En La Sierra de Trinidad, Cuba Central. Investig. Geográficas 2002, 24–43. [Google Scholar] [CrossRef]
- Huang, L.; Ni, L. Object-Oriented Classification of High Resolution Satellite Image for Better Accuracy. In Proceedings of the 8th International Symposium on Spatial Accuracy Assessment in Natural Resources and Environmental Sciences, Shangai, China, 25–27 June 2008; pp. 211–218. [Google Scholar]
- Rwanga, S.S.; Ndambuki, J.M. Accuracy Assessment of Land Use/Land Cover Classification Using Remote Sensing and GIS. Int. J. Geosci. 2017, 8, 611–622. [Google Scholar] [CrossRef]
- Swain, P.H.; King, R.C. Two Effective Feature Selection Criteria for Multispectral Remote Sensing; LARS Technical Reports; Pardue University Libraries: West Lafayette, IN, USA, 1973. [Google Scholar]
- Weiss, M.; Jacob, F.; Duveiller, G. Remote Sensing for Agricultural Applications: A Meta-Review. Remote Sens. Environ. 2020, 236, 111402. [Google Scholar] [CrossRef]
- Ayala, R.M.; Menenti, M. Metodología Para Búsqueda Del Mejor Clasificador de Imágenes de Satélite. In Proceedings of the Teledetección, Medio Ambiente y Cambio Global, Lleida, España, 19–22 September 2001; Volume 2, pp. 469–472. [Google Scholar]
- Congalton, R.G. A Review of Assessing the Accuracy of Classifications of Remotely Sensed Data. Remote Sens. Environ. 1991, 37, 35–46. [Google Scholar] [CrossRef]
- Spiegel Murray, R.; Stephens, L.J. Schaum’s Outline of Statistics, 6th ed.; McGraw-Hill: New York, NY, USA, 2017; ISBN 978-1260011463. [Google Scholar]
- Upadhyay, P.; Ghosh, S.K.; Kumar, A. High Resolution Temporal Normalized Difference Vegetation Indices for Specific Crop Identification. ISPRS Int. Arch. Photogramm. Remote Sens. Spat. Inf. Sci. 2013, XL-1/W1, 351–355. [Google Scholar] [CrossRef]
- Chen, J. Leaf Pigment Content. Ref. Modul. Earth Syst. Environ. Sci. 2017, 1–17. Available online: https://doi.org/10.1016/B978-0-12-409548-9.10547-0 (accessed on 1 May 2021). [CrossRef]
- Lewis, G.; Schrire, B.; MacKinder, B.; Lock, M. Legumes of the World. Royal Botanic Gardens, Kew. Edinb. J. Bot. 2005, 62, 195–196. [Google Scholar]
- Anderson, J.R.; Hardy, E.E.; Roach, J.T.; Witmer, R. A Land Use and Land Cover Classification System for Use with Remote Sensor DataTitle; Geological Survey Professional Paper; U.S. Department of the Interior: Washington, DC, USA, 1976. [Google Scholar]
- Landis, J.R.; Koch, G.G. The Measurement of Observer Agreement for Categorical Data. Biometrics 1977, 33, 159. [Google Scholar] [CrossRef] [PubMed]
- Estoque, R.C.; Murayama, Y.; Akiyama, C.M. Pixel-Based and Object-Based Classifications Using High- and Medium-Spatial-Resolution Imageries in the Urban and Suburban Landscapes. Geocarto Int. 2015, 30, 1113–1129. [Google Scholar] [CrossRef]
- Pahlevan, N.; Schott, J.R.; Franz, B.A.; Zibordi, G.; Markham, B.; Bailey, S.; Schaaf, C.B.; Ondrusek, M.; Greb, S.; Strait, C.M. Landsat 8 Remote Sensing Reflectance (Rrs) Products: Evaluations, Intercomparisons, and Enhancements. Remote Sens. Environ. 2017, 190, 289–301. [Google Scholar] [CrossRef]
- Gates, D.M.; Keegan, H.J.; Schleter, J.C.; Weidner, V.R. Spectral Properties of Plants. Appl. Opt. 1965, 4, 11. [Google Scholar] [CrossRef]
- Stéphane Jacquemoud, S.L.U. Leaf Optical Properties; Cambridge University Press: New York, NY, USA, 2019. [Google Scholar]
- Godínez, C.D.; Plasencia, F.J.M.; Enríquez, N. Flora y Vegetación de Loma La Llaga, Cuenca Del Río San Pedro, Camagüey, Cuba. Polibotánica 2006, 21, 123–140. [Google Scholar]


| Vegetation and Land Use | |
|---|---|
| AG | Water |
| AL | Albizia procera (Roxb.) Benth. |
| AR | Vachellia farnesiana (L.) Willd. y Arn. |
| BG | Guazuma ulmifolia Lam. forest |
| C | Sugar Cane |
| CGM | Psidium guajava L. + Mangifera indica L. cultivation |
| GPA | Guazuma ulmifolia Lam., Roystonea regia (Kunth) O. F. Cook, Terminalia catappa L. |
| KG | Pennisetum purpureum Schumach |
| MMO | Melicoccus bijugatus Jacq. + Mangifera indica L. + others |
| MA | Dichrostachys cinerea |
| MYA | Dichrostachys cinerea + Vachellia farnesiana |
| MO | Dichrostachys cinerea + Others |
| PAY | Roystonea regia, Bursera simaruba (L.) Sarg., Cecropia schreberiana Miq. |
| PA | Acacia mangium Willd. plantation |
| PS | Grass |
| S | Shadow |
| UR | Urban |
| VR | Riparian vegetation |
| Vegetation and Land Use | |
|---|---|
| AG | Water |
| CGM | Psidium guajava L. + Mangifera indica L. cultivation |
| GPA | Guazuma ulmifolia Lam., Roystonea regia (Kunth) O. F. Cook, Terminalia catappa L. |
| MA | Dichrostachys cinerea |
| MYA | Dichrostachys cinerea + Vachellia farnesiana |
| PAY | Roystonea regia, Bursera simaruba (L.) Sarg., Cecropia schreberiana Miq. |
| PA | Acacia mangium Willd. plantation |
| PS | Grass |
| UR | Urban |
| VR | Riparian vegetation |
| CATEGORIES | AL | MA | MYA | C | PS | BG | AR | GPA | PAY | CGM | PA | KG | PA | A | S | UR | MO | VR | MMO |
|---|---|---|---|---|---|---|---|---|---|---|---|---|---|---|---|---|---|---|---|
| ALBIZIA | 0 | 1999 | 1988 | 2000 | 2000 | 1383 | 1999 | 2000 | 705 | 2000 | 2000 | 2000 | 2000 | 2000 | 2000 | 2000 | 792 | 1998 | 1959 |
| SICKLEBUSH | 1999 | 0 | 1855 | 1999 | 1966 | 1998 | 1981 | 1982 | 1999 | 1999 | 1723 | 2000 | 2000 | 2000 | 2000 | 2000 | 1989 | 1985 | 1805 |
| SICKLEBUSH AND AROMA | 1988 | 1855 | 0 | 2000 | 2000 | 1751 | 1712 | 2000 | 1991 | 2000 | 2000 | 2000 | 2000 | 2000 | 2000 | 2000 | 1858 | 2000 | 1955 |
| CANE | 2000 | 1999 | 2000 | 0 | 1473 | 2000 | 2000 | 1997 | 2000 | 1943 | 1957 | 1873 | 2000 | 2000 | 2000 | 2000 | 2000 | 2000 | 2000 |
| GRASS | 2000 | 1966 | 2000 | 1473 | 0 | 2000 | 2000 | 1987 | 2000 | 1685 | 1672 | 1972 | 2000 | 2000 | 2000 | 2000 | 2000 | 1996 | 1995 |
| GUACIMA FOREST | 1383 | 1998 | 1751 | 2000 | 2000 | 0 | 1868 | 2000 | 1409 | 2000 | 2000 | 2000 | 2000 | 2000 | 2000 | 2000 | 1218 | 2000 | 1978 |
| AROMA | 1999 | 1981 | 1712 | 2000 | 2000 | 1868 | 0 | 2000 | 1999 | 2000 | 2000 | 2000 | 2000 | 2000 | 2000 | 2000 | 1993 | 2000 | 1993 |
| RYEGRASS, PALM, ALMOND | 2000 | 1982 | 2000 | 1997 | 1987 | 2000 | 2000 | 0 | 1999 | 1999 | 1877 | 2000 | 2000 | 2000 | 2000 | 2000 | 1992 | 286 | 1447 |
| PALM, GUMBO-LIMBO, YAGRUMA | 705 | 1999 | 1991 | 2000 | 2000 | 1409 | 1999 | 1999 | 0 | 2000 | 2000 | 2000 | 2000 | 2000 | 2000 | 2000 | 552 | 1994 | 1923 |
| GUAYABA AND MANGO CULTIVATION | 2000 | 1999 | 2000 | 1943 | 1685 | 2000 | 2000 | 1999 | 2000 | 0 | 1927 | 1982 | 2000 | 2000 | 2000 | 2000 | 2000 | 2000 | 2000 |
| ACACIA PLANTATION | 2000 | 1723 | 2000 | 1957 | 1672 | 2000 | 2000 | 1877 | 2000 | 1927 | 0 | 2000 | 2000 | 2000 | 2000 | 2000 | 2000 | 1927 | 1881 |
| KING GRASS | 2000 | 2000 | 2000 | 1873 | 1972 | 2000 | 2000 | 2000 | 2000 | 1982 | 2000 | 0 | 2000 | 2000 | 2000 | 2000 | 2000 | 2000 | 2000 |
| PASTURELAND | 2000 | 2000 | 2000 | 2000 | 2000 | 2000 | 2000 | 2000 | 2000 | 2000 | 2000 | 2000 | 0 | 2000 | 2000 | 2000 | 2000 | 2000 | 2000 |
| WATER | 2000 | 2000 | 2000 | 2000 | 2000 | 2000 | 2000 | 2000 | 2000 | 2000 | 2000 | 2000 | 2000 | 0 | 2000 | 2000 | 2000 | 2000 | 2000 |
| SHADOW | 2000 | 2000 | 2000 | 2000 | 2000 | 2000 | 2000 | 2000 | 2000 | 2000 | 2000 | 2000 | 2000 | 2000 | 0 | 2000 | 2000 | 2000 | 2000 |
| URBAN | 2000 | 2000 | 2000 | 2000 | 2000 | 2000 | 2000 | 2000 | 2000 | 2000 | 2000 | 2000 | 2000 | 2000 | 2000 | 0 | 2000 | 2000 | 2000 |
| SICKLEBUSH AND OTHER | 792 | 1989 | 1858 | 2000 | 2000 | 1218 | 1993 | 1992 | 552 | 2000 | 2000 | 2000 | 2000 | 2000 | 2000 | 2000 | 0 | 1971 | 1731 |
| RIPARIAN VEGETATION | 1998 | 1985 | 2000 | 2000 | 1996 | 2000 | 2000 | 286 | 1994 | 2000 | 1927 | 2000 | 2000 | 2000 | 2000 | 2000 | 1971 | 0 | 1147 |
| MAMONCILLO, MANGO AND OTHER | 1959 | 1805 | 1955 | 2000 | 1995 | 1978 | 1993 | 1447 | 1923 | 2000 | 1881 | 2000 | 2000 | 2000 | 2000 | 2000 | 1731 | 1147 | 0 |
| Baseline Data | |||||||||||||||||||||
|---|---|---|---|---|---|---|---|---|---|---|---|---|---|---|---|---|---|---|---|---|---|
| CATEGORIES | MYA | C | VR | MMO | PS | BG | AR | GPA | PAY | CGM | PA | KG | PA | AG | S | UR | MO | AL | MA | TOTAL | Level of Accuracy |
| MYA | 56 | 0 | 0 | 0 | 0 | 0 | 0 | 0 | 0 | 0 | 0 | 0 | 0 | 0 | 0 | 0 | 0 | 0 | 1 | 57 | 98.2% |
| C | 0 | 9 | 0 | 0 | 1 | 0 | 0 | 0 | 0 | 0 | 0 | 1 | 0 | 0 | 0 | 0 | 0 | 0 | 0 | 11 | 81.8% |
| VR | 0 | 0 | 2 | 0 | 0 | 0 | 0 | 1 | 0 | 0 | 0 | 0 | 0 | 0 | 0 | 0 | 0 | 0 | 0 | 3 | 66.7% |
| MMO | 0 | 0 | 1 | 17 | 0 | 0 | 0 | 1 | 1 | 0 | 0 | 0 | 0 | 0 | 0 | 0 | 0 | 0 | 0 | 20 | 85% |
| PS | 0 | 1 | 0 | 0 | 3 | 0 | 0 | 0 | 0 | 0 | 0 | 0 | 0 | 0 | 0 | 0 | 0 | 0 | 0 | 4 | 75% |
| BG | 1 | 0 | 0 | 0 | 0 | 34 | 0 | 2 | 0 | 0 | 0 | 0 | 0 | 0 | 0 | 0 | 3 | 1 | 0 | 41 | 82.9% |
| AR | 0 | 0 | 0 | 0 | 0 | 0 | 4 | 1 | 0 | 0 | 0 | 0 | 0 | 0 | 0 | 0 | 0 | 0 | 0 | 5 | 80% |
| GPA | 0 | 0 | 0 | 0 | 0 | 0 | 0 | 1 | 0 | 0 | 0 | 0 | 0 | 0 | 0 | 0 | 0 | 0 | 0 | 1 | 100% |
| PAY | 0 | 0 | 0 | 0 | 0 | 0 | 0 | 0 | 15 | 0 | 0 | 0 | 0 | 0 | 0 | 0 | 3 | 0 | 0 | 18 | 83.3% |
| CGM | 0 | 0 | 0 | 0 | 0 | 0 | 0 | 0 | 0 | 5 | 0 | 0 | 0 | 0 | 0 | 0 | 1 | 0 | 0 | 6 | 83.3% |
| PA | 0 | 0 | 0 | 0 | 0 | 0 | 0 | 0 | 0 | 0 | 15 | 0 | 0 | 0 | 0 | 0 | 1 | 0 | 1 | 17 | 88.2% |
| KG | 0 | 0 | 0 | 0 | 1 | 0 | 0 | 0 | 0 | 0 | 0 | 3 | 0 | 0 | 0 | 0 | 0 | 0 | 0 | 4 | 75% |
| PA | 0 | 0 | 0 | 0 | 0 | 0 | 0 | 0 | 0 | 0 | 0 | 0 | 13 | 0 | 0 | 0 | 0 | 0 | 0 | 13 | 100% |
| AG | 0 | 0 | 0 | 0 | 0 | 0 | 0 | 0 | 0 | 0 | 0 | 0 | 0 | 0 | 0 | 0 | 0 | 0 | 0 | 0 | - |
| S | 0 | 0 | 0 | 0 | 0 | 0 | 0 | 0 | 0 | 0 | 0 | 0 | 0 | 0 | 2 | 0 | 0 | 0 | 0 | 2 | 100% |
| UR | 0 | 0 | 0 | 0 | 0 | 0 | 0 | 0 | 0 | 0 | 0 | 0 | 0 | 0 | 0 | 11 | 0 | 0 | 0 | 11 | 100% |
| MO | 0 | 0 | 0 | 0 | 0 | 1 | 0 | 0 | 0 | 0 | 0 | 0 | 0 | 0 | 0 | 0 | 8 | 1 | 0 | 10 | 80% |
| AL | 0 | 0 | 0 | 0 | 0 | 0 | 0 | 0 | 0 | 0 | 0 | 0 | 0 | 0 | 0 | 0 | 3 | 12 | 0 | 15 | 80% |
| MA | 0 | 0 | 0 | 0 | 0 | 0 | 1 | 0 | 0 | 0 | 0 | 0 | 0 | 0 | 0 | 0 | 0 | 0 | 18 | 19 | 94.7% |
| TOTAL | 57 | 10 | 3 | 17 | 5 | 35 | 5 | 6 | 16 | 5 | 15 | 4 | 13 | 0 | 2 | 11 | 19 | 14 | 20 | 257 | |
| Errors of omission | 1.7% | 10% | 33.3% | 0% | 40% | 2.9% | 20% | 83.3% | 6.2% | 0% | 0% | 25% | 0% | - | 0% | 0% | 57.9% | 14.3% | 10% | ||
| Overall accuracy = 8.7% | |||||||||||||||||||||
| CATEGORIES | CGM | PA | MA | GPA | MYA | VR | P | AG | UR | PAY |
|---|---|---|---|---|---|---|---|---|---|---|
| GUAYABA AND MANGO CULTIVATION | 0 | 2000 | 2000 | 2000 | 2000 | 2000 | 2000 | 2000 | 2000 | 2000 |
| ACACIA PLANTATION | 2000 | 0 | 1997 | 2000 | 2000 | 2000 | 2000 | 2000 | 2000 | 2000 |
| SICKLEBUSH | 2000 | 1997 | 0 | 1990 | 1086 | 1986 | 1994 | 2000 | 2000 | 2000 |
| GAUDIN, PALM, ALMOND | 2000 | 2000 | 1990 | 0 | 1992 | 1868 | 2000 | 2000 | 2000 | 1999 |
| SICKLEBUSH AND AROMA | 2000 | 2000 | 1086 | 1992 | 0 | 1998 | 2000 | 2000 | 2000 | 2000 |
| RIPARIAN VEGETATION | 2000 | 2000 | 1986 | 1868 | 1998 | 0 | 2000 | 2000 | 2000 | 1999 |
| PASTURELAND | 2000 | 2000 | 1994 | 2000 | 2000 | 2000 | 0 | 2000 | 2000 | 2000 |
| WATER | 2000 | 2000 | 2000 | 2000 | 2000 | 2000 | 2000 | 0 | 2000 | 2000 |
| URBAN | 2000 | 2000 | 2000 | 2000 | 2000 | 2000 | 2000 | 2000 | 0 | 2000 |
| PALM, GUMBO-LIMBO, YAGRUMA | 2000 | 2000 | 2000 | 1999 | 2000 | 1999 | 2000 | 2000 | 2000 | 0 |
| Baseline Data | ||||||||||||
|---|---|---|---|---|---|---|---|---|---|---|---|---|
| CATEGORIES | GPA | MYA | VR | PA | AG | UR | PAY | CGM | PAY | MA | TOTAL | Level of Accuracy |
| GPA | 15 | 0 | 0 | 0 | 0 | 0 | 0 | 0 | 0 | 1 | 16 | 93.7% |
| MYA | 1 | 20 | 0 | 0 | 0 | 0 | 0 | 0 | 0 | 4 | 25 | 80% |
| VR | 0 | 0 | 4 | 0 | 0 | 0 | 1 | 0 | 0 | 0 | 5 | 80% |
| PA | 0 | 0 | 0 | 25 | 0 | 1 | 0 | 0 | 0 | 0 | 26 | 96.1% |
| AG | 0 | 0 | 0 | 0 | 0 | 0 | 0 | 0 | 0 | 0 | 0 | - |
| UR | 0 | 0 | 0 | 1 | 0 | 10 | 0 | 0 | 0 | 0 | 11 | 90.9% |
| PAY | 2 | 0 | 0 | 0 | 0 | 0 | 38 | 0 | 0 | 0 | 40 | 95% |
| CGM | 0 | 0 | 0 | 1 | 0 | 0 | 0 | 7 | 0 | 0 | 8 | 87.5% |
| PAY | 0 | 0 | 0 | 1 | 0 | 0 | 0 | 0 | 14 | 0 | 15 | 93.3% |
| MA | 0 | 2 | 0 | 0 | 0 | 0 | 0 | 0 | 0 | 92 | 94 | 97.9% |
| TOTAL | 18 | 22 | 4 | 28 | 0 | 11 | 39 | 7 | 14 | 97 | 240 | |
| Errors of omission | 16.7% | 9% | 0% | 10.7% | - | 9% | 2.6% | 0% | 0% | 5.1% | ||
| Overall | ||||||||||||
| accuracy = 93.7% | ||||||||||||
Publisher’s Note: MDPI stays neutral with regard to jurisdictional claims in published maps and institutional affiliations. |
© 2021 by the authors. Licensee MDPI, Basel, Switzerland. This article is an open access article distributed under the terms and conditions of the Creative Commons Attribution (CC BY) license (https://creativecommons.org/licenses/by/4.0/).
Share and Cite
Moreno, E.; Zabalo, A.; Gonzalez, E.; Alvarez, R.; Jimenez, V.M.; Menendez, J. Affordable Use of Satellite Imagery in Agriculture and Development Projects: Assessing the Spatial Distribution of Invasive Weeds in the UNESCO-Protected Areas of Cuba. Agriculture 2021, 11, 1057. https://doi.org/10.3390/agriculture11111057
Moreno E, Zabalo A, Gonzalez E, Alvarez R, Jimenez VM, Menendez J. Affordable Use of Satellite Imagery in Agriculture and Development Projects: Assessing the Spatial Distribution of Invasive Weeds in the UNESCO-Protected Areas of Cuba. Agriculture. 2021; 11(11):1057. https://doi.org/10.3390/agriculture11111057
Chicago/Turabian StyleMoreno, Eduardo, Alberto Zabalo, Encarnacion Gonzalez, Reinaldo Alvarez, Victor Manuel Jimenez, and Julio Menendez. 2021. "Affordable Use of Satellite Imagery in Agriculture and Development Projects: Assessing the Spatial Distribution of Invasive Weeds in the UNESCO-Protected Areas of Cuba" Agriculture 11, no. 11: 1057. https://doi.org/10.3390/agriculture11111057
APA StyleMoreno, E., Zabalo, A., Gonzalez, E., Alvarez, R., Jimenez, V. M., & Menendez, J. (2021). Affordable Use of Satellite Imagery in Agriculture and Development Projects: Assessing the Spatial Distribution of Invasive Weeds in the UNESCO-Protected Areas of Cuba. Agriculture, 11(11), 1057. https://doi.org/10.3390/agriculture11111057