Article

Factors Influencing Wine Purchasing by Generation Y and Older Cohorts on the Serbian Wine Market

by
Ivan Balenović
1,*,
Svetlana Ignjatijević
2,
Goran Stojanović
3,
Jelena Vapa Tankosić
2,
Nemanja Lekić
4,
Olivera Milutinović
5,
Aleksandar Gajić
6,
Miloš Ivaniš
2,
Jelena Bošković
2,
Radivoj Prodanović
2,
Nikola Puvača
2,* and
Ljubica Duđak
1
1
Faculty of Technical Sciences, University of Novi Sad, Trg Dositeja Obradovića 6, 21000 Novi Sad, Serbia
2
Faculty of Economics and Engineering Management, University Business Academy in Novi Sad, Cvećarska 2, 21000 Novi Sad, Serbia
3
Faculty of Applied Sciences, University “Union-Nikola Tesla”, Dušana Popovića 22a, 18000 Niš, Serbia
4
Belgrade Business and Arts Academy of Applied Studies, Bulevar Zorana Đinđića 152a, 11070 Beograd, Serbia
5
Faculty of Management, University “Union-Nikola Tesla”, Njegoševa 1a, 21205 Sremski Karlovci, Serbia
6
Business College of Applied Studies “Prof. PhD Radomir Bojković”, Topličina 12, 37000 Kruševac, Serbia
*
Authors to whom correspondence should be addressed.
Agriculture 2021, 11(11), 1054; https://doi.org/10.3390/agriculture11111054
Submission received: 8 September 2021 / Revised: 16 October 2021 / Accepted: 18 October 2021 / Published: 27 October 2021
(This article belongs to the Special Issue Agricultural Food Marketing, Economics and Policies)

Abstract

:
This research investigates current preferences in wine purchase patterns and factors that affect the online purchase of wine by Generation Y and older cohorts in the Republic of Serbia. Our research utilizes descriptive statistics, chi-squared tests, the Mann–Whitney nonparametric test, and binary logistic regression. The results indicate that wine purchasing is conducted on an occasional basis—mostly monthly and weekly—with a tendency to buy wine throughout the whole year. The older cohort has a more pronounced rank, compared to Generation Y, regarding WTP for wines with a specific geographical origin and local wines. Although Generation Y and the older cohort have no habit of buying wine online, the information on geographical origin represents the most important online information related to online purchase intention. The strongest influence on online wine purchasing among members of the older cohort is a link that connects producers with consumers to allow the latter to obtain additional information and send remarks, suggestions, and/or praise, as well as a link to the winemakers’ association website, and the very significant influence of female gender. The strongest influence on online wine purchasing in Generation Y is the information on geographical origin. Female gender and income are also very significant. As wine consumption in the Republic of Serbia is gradually increasing, a growing interest in online wine purchases is expected. Our findings can provide useful information for building profiles of online wine consumers, depending on age cohort.

1. Introduction

With COVID-19, there has been a reduction in or complete cessation of wine production activities at many wineries, although, overall, the wine industry, for the period 2020–2025, is projected to increase in CAGR by 5.8%. There has also been an increase in demand for high-quality wines on the world market, with a rapid increase in the number of companies that produce wine in China, India, and Japan [1].
According to data from NationMaster and the World Health Organization, since 2014, Serbian wine consumption per capita has increased by 1.3% annually. In 2019, Serbia was ranked 10th globally in wine consumption per capita, with 4.13 L of pure alcohol [2]. Ivanišević and Jakšić [3] state that there are three wine-growing regions in Serbia: central Serbia, Vojvodina, and the region of Kosovo and Metohija, with 22 sub-regions and 77 vineyards. Grape production is carried out at a total of 80,341 vineyards, constituting 12.7% of the total number of agricultural holdings in the Republic of Serbia. As Lajko and Erdelji [4] pointed out, a total of 5032 ha is dedicated to vineyards in Vojvodina, and wine production is mainly based on family wineries of small and medium capacity [5]. The wine industry in Serbia is a significant sector of economic activity that has the potential to stimulate development in agricultural and rural areas. Increasing the quality of wine in the Republic of Serbia will contribute to the improvement of the country’s market position and its domestic and international competitiveness. Therefore, significant activities should be undertaken to motivate local wine producers to approach new potential markets. On the other hand, consumers should be educated on the quality of domestic wines and encouraged to develop a loyal relationship with local producers. The production of high-quality branded products with geographical indication would improve the recognizability of particular areas [6]. Wine, staff, cellar door, entertainment, education, and aesthetics are important for the development of the contemporary wine tourism experience [7].
Various researchers have tried to identify common behavioral attitudes in different age cohorts [8,9]. When defining age cohorts, McCrindle [10] pointed out that today’s generations are defined more sociologically than biologically. They refer to a cohort as people born in a similar period, within a comparable age or life stage, who are determined by similar events, trends, and developments. Lancaster and Stillman [11] defined four age groups: Traditionalists, born between 1900 and 1945; Baby Boomers, born between 1946 and 1964; Generation X, born between 1965 and 1977. As Markert [12] stated, who exactly belongs to the Boomers, Generation X, or Generation Y will never be clear. According to some authors, Generation Y is defined by the period 1982–2003 [13,14], 1977–1994 [15], 1978–1984 [16], or more broadly 1977–1994 [17], or even 1982–2002 [18]. In our research, Generation Y represents respondents who were born between the years 1981 and 1996. According to Gurău [19], they were born from 1980 to 1999. Lissitsai and Kol [20] pointed out that Generation Y came of age during the time of social media and social networks, supported by internationalization, with even strong influences from popular culture [21]. According to Kim [22], the representatives of Generation Y are, on the one hand, self-confident, self-reliant, energetic, and expressive, and, on the other hand, casual and fun [23]. As Palfrey and Gasser [24] stated, the life of a Gen Y is associated with digital technologies, whether in social interactions, friendships, civic activities, or hobbies. Wolburg and Pokrywcznski [25] concluded that Gen Ys were graduating from college as early as 1997, and that they are very well educated and self-reliant.
Some authors [26,27,28,29,30,31,32,33] suggested that segmentation according to age cohorts is more pronounced in developed markets. In emerging markets, the literature on cohort behavior is still limited; therefore, it is very important to critically investigate this emerging topic in the Republic of Serbia. This study should contribute to the literature, because the authors investigated the common patterns of behavior of age cohorts toward wine, which is also considered important for human health and wellbeing. The authors chose to research this area due to the growing production and consumption of wine in the Republic of Serbia. Therefore, the specific objectives of this research paper were to investigate current perceptions of wine and general attitudes connected to the wine-purchasing behavior of Generation Y and the older age cohort in the Republic of Serbia. The paper aimed to determine whether there are any differences in sociodemographic characteristics with respect to the wine-purchasing behavior of these groups. It then sought to identify the importance of online wine information, which determines online wine purchasing. This paper tries to fill a gap in the literature and explore differences in wine preferences among academic staff, because the research on perceptions and preferences of wine consumers in Serbia [34,35,36] is still limited.
After Section 1, the authors present the theoretical basis of their exploration of wine-purchasing behavior. The methodological framework focuses on the research objective and utilized research methods, and it is followed by the research findings and a discussion thereof. In the conclusion, the authors summarize their findings, present research limitations, and offer some policy recommendations.

2. Theoretical Background

Hanić [37] pointed out that, in the case of personal consumption products, due to the large number of consumers, there is a need for segmentation, and businesses seek similarity of customers in terms of certain characteristics. According to Novaković-Rajčić [38], consumer behavior is influenced by external (demographic, sociological, economic, and geographical) and internal factors (personality characteristics—attitudes, opinions, learning, and motives of consumers). In this regard, Hanić et al. [39] stated that economic theories of consumer behavior explain how consumers in a given situation allocate their income to the purchase of certain types of goods. According to Thompson [40], individuals maximize utility depending on price, income, and other socioeconomic factors [41,42]. Health and care for the environment, as well as taste, are important factors related to the consumption of food products; accordingly, Vapa Tankosić et al. [43] concluded that consumers readily opt for organic and local produce. Consumers especially value organic wine and are willing to pay a higher price for it [44,45,46,47], often stating that these products denote quality, freshness, and authenticity [48].
Lunardo and Rickard [49] explored the fun elements of wine labels and concluded that less fun labels reduce the perception of quality, and consumers ultimately demonstrate less willingness to pay more for the wine. Thus, Combris, Lecock, and Visser [50] indicated that consumers easily recognize Bordeaux wines based on their labels, because these are characteristics that are easily recognizable and can be identically perceived by all consumers. Lunardo and Guerinet [51] investigated the influence of wine labels on wine consumption and concluded that young people prefer label authenticity.
Mueller and Szolnoki [52] pointed to the fact that young people do not have a developed attitude toward wine or formed preferences toward external attributes of wine, and that people aged 18–40 mainly follow recommendations when deciding to buy wine [53]. For Australian consumers, the most important attribute influencing wine choice is that the wine has been tasted previously, followed by recommendation, and the grape variety [54]. Fountain and Fish [31] investigated the consumption of wine by young people from Australia and pointed out that sparkling wine is most frequently consumed by young female Australians. On the other hand, the findings of Ritchie [29] showed that men and women do not differ significantly according to wine consumption, and that age is not a key factor related to wine consumption. Danes consume large amounts of alcohol, and the most common beverage is wine; a large percentage of young people drink, and classical socioeconomic factors do not play a significant role in determining wine consumption patterns [55] or quantities consumed [56]. Rodríguez-Donate et al. [57] indicated that the probability of wine consumption is highest among adult men, while it is less common among young people and women. The probability of occasional consumption also increases with a higher level of education.
Concerning wine consumers in Italy, younger women, with a higher level of education and with children in the household [58], have expressed an interest in obtaining more information on the nutritional and health characteristics of wine via the label. Their expectations also extend to potential warnings about possible side-effects related to excessive wine consumption. For novice wine consumers, the brand name is not the most important parameter when buying wine, and they rely on the country-of-origin information; thus, they lack the information and knowledge to assess the difference in wine quality [59,60]. Agnoli, Capitello, and Begalli [61] underlined the relaxing and sociable associations of wine as the most important factors in wine purchase, while the health benefits of wine are insufficiently noticed. Contrary to the aforementioned view, St James and Christodoulidou [62] pointed out that wine consumption among Southern California wine consumers is associated with perceptions about the health benefits of wine. Among consumers in Australia, health benefits are not the most important factor in deciding on buying and consuming wine [63]. Health-oriented consumers are willing to pay more for highly enhanced quality wine [64].
The findings of Fountain and Fish [31], Barber et al. [30], Lunardo and Guerinet [51], Chrysochou et al. [65], Němcová and Staňková [66] confirmed that Generation Y represents a rising segment in wine consumption, and wine consumers of Generation Y are the focus of marketing experts [67]. Furthermore, according to State of the Wine Industry 2021, Generation Y increased their consumption to 20.3% in 2020 from 17% in 2019, representing a growing trend in consumption (an increase in consumption higher than in other age cohorts). According to Goldgehn [68], the members of Generation Y are committed to the use of technology, have developed brand awareness, and are loyal to it. Generation X and Y buy approximately the same amount of wine each month. Generation Y buys an average of 2.5 bottles, while Generation X buys up to 3.1 [30]. In the Republic of North Macedonia, respondents are willing to pay 600 MKD (10 EUR) for their favorite wine, and as many as 53% of respondents would pay 1000 MKD or more (16 EUR) [69]. As Chrysochou et al. [65] pointed out, Generation Y drinks wine in smaller quantities and more often buys wine in grocery stores, as opposed to the older cohort that more often buys wine in larger quantities in liquor and winery stores [65].
The online shopping behavior of consumers of different generations has been the focus of research in recent years. Under conditions of increased Internet use, new questions of service quality in online wine purchasing emerge [70]. Research on wine consumer preferences indicates the emergence of new online distribution channels and factors influencing the purchase of wine online [71]. Pucci [72] pointed out the importance of subjective and objective knowledge for online wine-purchasing intention. Consumers use the Internet to search for information and make purchases [20,73], thereby saving time [74,75]. Generation X consumers have more time to shop, but find it difficult to adopt novelties in shopping; hence, they are more focused on traditional forms of shopping. They use the Internet to obtain information and follow reviews in great detail [76], they are risk-averse [77], and the recommendations and opinions of others are important to them. Generation X may show a lack of loyalty to a brand or company. In contrast, Generation Y consumers are hedonistically oriented [78], and they have a different attitude toward shopping in general [79] and, therefore, also toward online shopping. Shopping for Generation Y is a pleasant and rewarding experience [80], it emphasizes their style, and they often react impulsively. Therefore, they pay less attention to the price and brand and are more focused on the quality and characteristics of the product [77,81]. In the online shopping environment, the wine producers and sellers must work on product differentiation, i.e., they must be transparent in terms of all information and, thus, reach price competitiveness [82], while also having in mind that some producers are not sufficiently trained for the online sale of wine, especially smaller wineries [83]. According to Bruwer and Wood [84], online wine buyers are mostly well-educated, high-income men, aged 35 to 44. The authors pointed out that the online sale of wine is most significantly influenced by the functionality of the website, followed by information on the wine and the price. Winery websites [85,86], ease of navigation [87], website security [88], information availability [89], and website appearance [86] are also proven to be significant factors that influence online purchase. Cho et al. [85] indicated that the sensory properties and geographical origin of a wine positively influence the decision to purchase, but that the quality of information and the quality of services can reduce the influence of the attributes of origin. Lim et al. [90] suggested that there is a significant relationship between factors influenced by social groups (subjective norms, image, and visibility) and the perceived usefulness of online wine sites. In Portugal, online wine buyers are mostly young, male, well-educated, high-income consumers, buying less than once a month. They are motivated by the ease of purchase, wider choice of wines, availability, and price. Positive reasons for buying include prices, origin/brand of wine, the recommendation of the online store, and their own experience [91]. The authors cited delivery problems, lack of trust in sellers, and transaction security as limiting factors for online wine shopping. Pellet and Lecat [92] pointed out that wine buyers effortlessly search the sites of supermarkets, shops, wine shops, wine clubs, and wineries over the Internet and mobile applications, as well as consult with friends. In this way, they research products, compare prices, and make orders. Interestingly, the wine is mostly bought for personal use or as gifts. User reviews and expert reviews inspire the greatest level of trust in wine buyers, and the possibility of adding an interactive function to the site, such as virtual and video tastings and virtual conversations with winemakers, can lead to increased sales.

3. Materials and Methods

The research was conducted in the Republic of Serbia over 6 months from June to December 2020. To ensure that the questionnaire was functional, two pretests were conducted at the university campus on a survey of 20 participants in the presence of the researchers. In this way, the authors wanted to pinpoint firsthand any problems encountered and to deal with any difficulties or misunderstandings in the process of responding to the survey. This resulted in the rephrasing of a number of questions and corrections and modifications to syntax and grammar. After pretesting the survey and correcting its face validity [93] in the light of review by experts and survey methodologists and the creation of a final version, the questionnaire was sent to 2000 email addresses of university campus staff. The survey was accompanied by an invitation to participate via email and assurances that responses would be anonymous. The participants were informed that the study was intended to explore attitudes concerning their wine-purchasing behavior.
Since Wolburg and Pokrywcznski [25] pointed out that Generation Y is very well-educated and self-reliant, this category of respondents was chosen as a focus for research. In our research, Generation Y was defined as respondents who were born between the years 1981–1996, and we used a filter for the age of the respondents (older than 1996) as a limit, since they were the generation completing their studies at the time of the research. Respondents born after this year were not included because they were still studying and were not economically independent. The consumers of Generation Y were appropriate for this type of research due to their frequent Internet use for various purchases and knowledge of the particulars of online wine buying.
The second method applied was snowball sampling employing interpersonal relations and connections among university students and staff to reach a large number of participants. The seed informants were identified, and the survey was forwarded to their networks who agreed to participate in the research [94,95,96]. The snowball method was chosen to identify and examine members of the population who share the same characteristics such as wine consumption and purchase [97,98]. Clear, accurate, and sufficiently detailed instructions were prepared for the respondents and research associates.
After the survey, 1438 of the questionnaires completed in full were returned (response rate of 72%), and the final research sample was composed of 1438 wine consumers. The first part of the questionnaire concerned collection of sociodemographic data on the wine consumers, including sociodemographic variables such as gender, qualifications, and level of monthly income. The second part of the questionnaire was focused on the consumers’ general attitudes connected with wine purchase rated on a Likert scale: frequency of wine purchase (once a week, several times during the week, once in two weeks, once a month, once in 3 months, and once in 6 months); size of wine bottle/package (bottle of 0.7 L, bottle of 1 L, and larger package); type of wine purchased (aromatized dessert wine, white, rose, red, and sparkling wine), the place of wine purchase (directly from the producer—winery, specialized beverage stores, retail stores, and fairs/events); periodicity of wine consumption (throughout the year or seasonally); the general knowledge on wines (without any knowledge, poor, moderate, and excellent); consumers’ willingness to pay for 1 L of wine (500 RSD/4.3 EUR, 700 RSD/6 EUR, 1000 RSD/8.6 EUR, 1500 RSD/12.8 EUR, and more than 1500 RSD/12.8 EUR); consumers’ willingness to pay more for a quality wine with a controlled geographical origin and local wine using a five-point scale (nothing more, up to 10%, 10–20%, 20–30%, and more than 30%); online wine purchase (yes/no). The third part of the questionnaire explored the respondents’ perceptions on the importance of various pieces of online information connected to online wine purchase intention such as information on the use of wine in culinary arts, videos on wine production, videos of the vineyards, list of literature or books on wine, links to the winemakers’ association website, current campaigns or promotions highlighted in the media and on social networks, information on wine geographical origin, characteristics of geographical origin, information on wine producer’s achievements or awards, tips from wine connoisseurs or experts, and a link that connects consumers with wine producers to obtain additional information, remarks, suggestions, or compliments (interval level from 1–5).
Therefore, the subject of the research was the assessment of the preference of Generation Y and the older cohort in wine consumption, encompassing different research questions. The first research question (RQ1) was whether the different age cohorts purchase wine and what are the general attitudes and behavior patterns of the age cohorts in wine purchase? The second research question (RQ2) was whether there are differences in sociodemographic variables and general attitudes connected to wine purchase between the respondents in both age cohorts? The third research question (RQ3) investigated which pieces of online information predict the online wine purchase intention of both age cohorts.
Descriptive statistics were used to investigate the current wine perceptions and general attitudes connected to the wine purchasing of Generation Y and the older cohort in the Republic of Serbia (RQ1). Using the chi-square [99] test, the authors sought to determine whether the difference in the sociodemographic characteristics and the general attitudes of the Generation Y and older cohort connected to wine purchase was of statistical significance (RQ2). To further test the differences in both age cohorts, the Mann–Whitney nonparametric test was applied [100,101,102]. Binary logistic regression was utilized to respond to the third research question (RQ3) [39,103,104], to determine which information helps predict online wine purchases by the respondents of both age cohorts. The dependent variable was the following question: Do you buy wine online? The independent variables were information on the use of wine in culinary arts, videos on wine production, videos of the vineyards, lists of literature or books on wine, links to the winemakers’ association website, current campaigns or promotions highlighted in the media and on social networks, information on geographical origin, characteristics of geographical origin, information on wine producer’s awards, advice from wine connoisseurs or experts, and links that connect producers with consumers to get additional information or send remarks, suggestions, and praise. In the first step, the listed variables were entered (older cohort and Generation Y) [105]. The significance level in all testing procedures was preset at α = 0.05. The collected data were analyzed in SPSS.

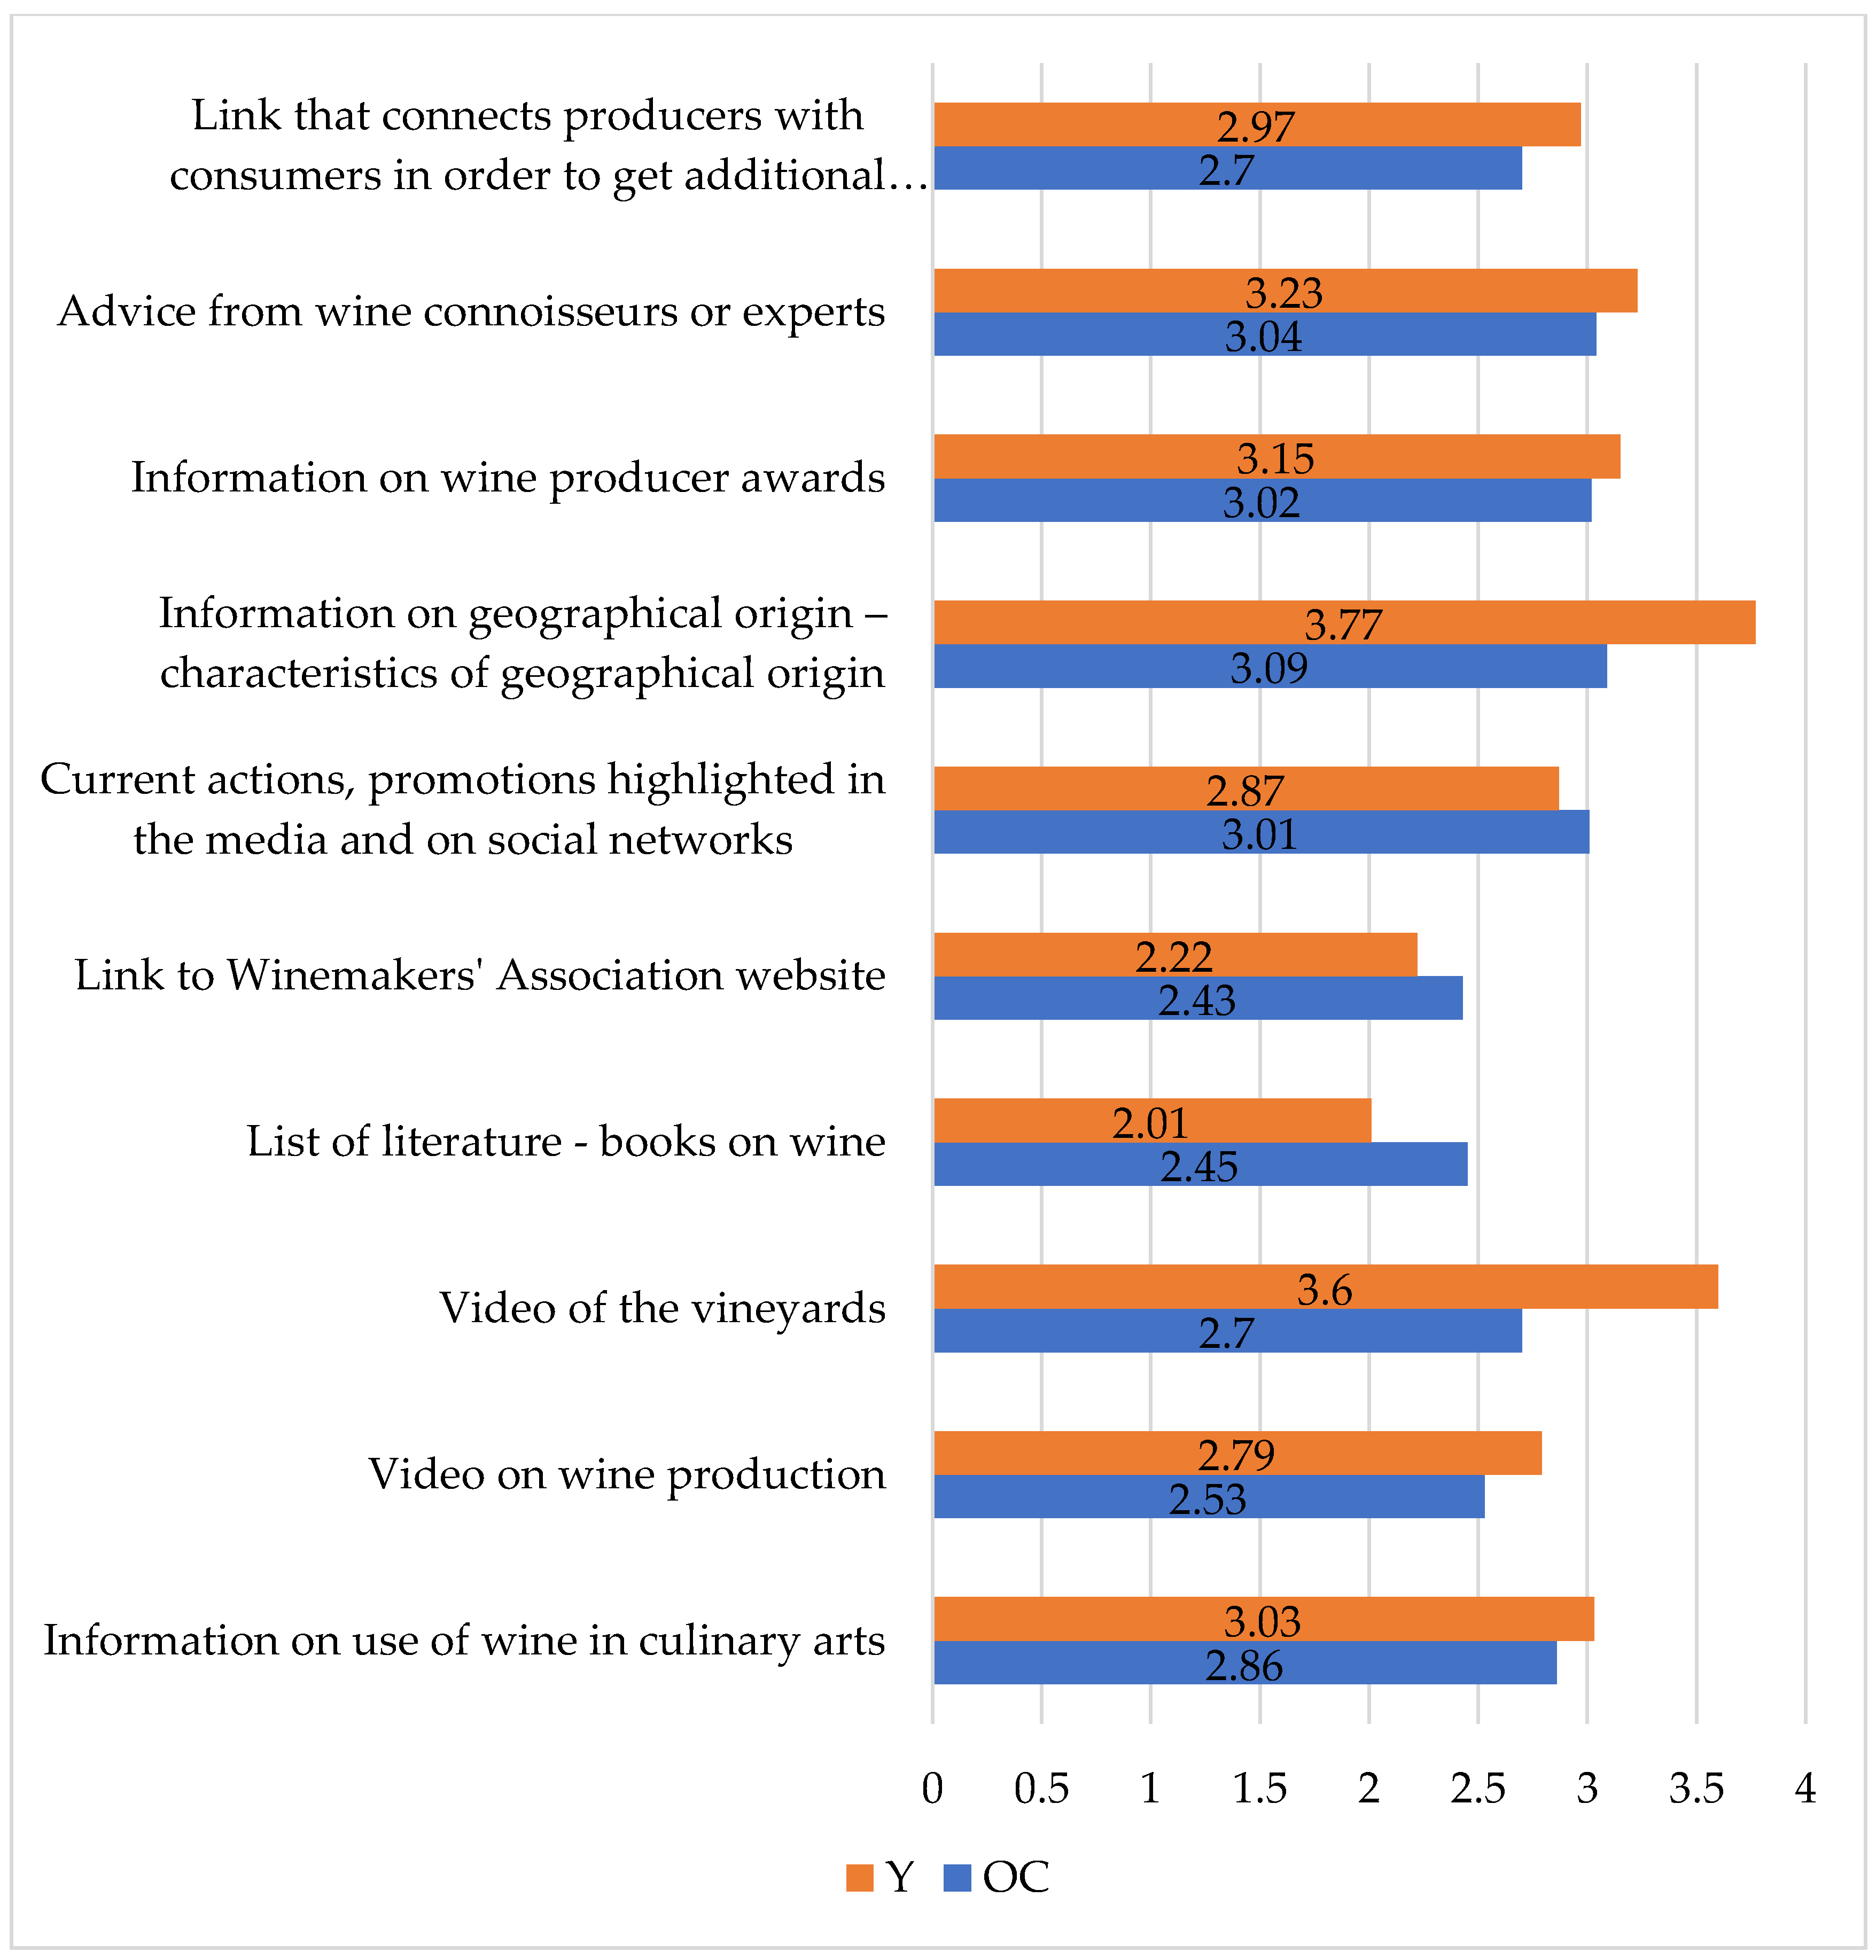
4. Results and Discussion

The total of 1438 wine consumers belonged to two age cohorts, Generation Y and the older cohort [65]. In the sample characteristics shown in Table 1, members of Generation Y represented 41.52% of the sample, while members of the older cohort made up 58.48%.
In the sample of Generation Y consumers, 76.5% were women, whereas, in the older cohort, women constituted 65.3% of the sample. The chi-square results show that there was a significant difference in the participants’ responses according to their gender, which is consistent with the conclusions of other researchers [29,31,35,38,43]. The sample was dominated by the population with a college diploma (67.2%), with a higher share of college graduates in the older cohort (86.6%). In Generation Y, there was a higher share of master’s and PhD degrees (35.3%), which reflects the sample structure of the university staff. The chi-square results expose a significant difference in the participants’ responses according to level of education, which is in line with other findings [35,38,58,65]. Considering that the surveyed sample of consumers was dominated by those with higher education, it is not surprising that the average income was in the range of 80,000–120,000 RSD (680 EUR to 1025 EUR) and more than 120,000 RSD (1025 EUR). Although the income structure was similar in both samples, a significant difference was found in the participants’ responses, according to the chi-square results [65].
From the results on the purchasing patterns of wine consumption in Table 2, we can see that the most common frequency of wine purchases in both age cohorts was monthly. The chi-square results show that there was a significant difference in the participants’ responses. Previous research [30,34,36] also indicated that the most common purchase of wine is once a month or less frequently [65]. The findings indicate the fact that the most common pattern among consumers is to buy a bottle of 0.7 L (76.7%). However, among the older cohorts, a much higher percentage bought bottles of 1 L (15.6%) and larger volumes of wine (18.7%). Among members of Generation Y, the largest percentage purchased wine by the 0.7 L bottle (92.1%) [36,65], and the chi-square results show that there was a significant difference in the participants’ responses according to volume.
When analyzing the type of wine that the respondents buy, we found that red wine (48.2%) and white wine (28.8%) dominated in consumption. A similar structure was present in Generation Y, where 45.4% bought red and 29.6% bought white wine. There were no significant differences in the participants’ responses concerning the type of wine purchased. According to the answers on the place of purchase, we obtained a clear picture that many respondents in both age cohorts, as many as 45.9%, had the habit of buying wine in retail outlets. Thus, retail facilities were the most represented, with a relatively high share of specialized shops (22.9%), which is in line with the findings of Annunziata et al. [58] that a majority of the consumers buy wine only from supermarkets, with only a limited number of the respondents buying from wine specialist stores [34,36,106]. The chi-square test was not of statistical significance.
The consumers of both age cohorts possessed a moderate knowledge of wine (42.9% and 76.4% for the older cohort and Generation Y, respectively). A statistically significant difference in the participants’ responses regarding their knowledge of wine was indicated by the chi-square results. The consumers of both cohorts tended to buy wine throughout the year, and the chi-Square test was of statistical significance.
According to the findings, 75.1% of the consumers as a whole would be willing to pay a price higher than 10 EUR per liter of wine. Both age cohorts were ready to pay up to 12.80 EUR or 1500 RSD for a bottle of wine (older cohort: 27.8%; Generation Y: 29.6%). Nack et al. [69] showed that a high percentage of consumers are willing to pay 10 EUR for 1 L. The average minimum price paid for a bottle of wine by Dutch consumers is 3.35 EUR, and Generation Y average spending on a bottle of wine was approximately 5.00 EUR per bottle [106].
It can be concluded that the largest number of respondents in both age cohorts (39.8%) were willing to pay a 10–20% margin for quality wine with controlled geographical origin, above the price of wine with no specified geographical origin. On the other hand, the largest number of respondents in both cohorts (36.9%) was willing to pay up to 10% higher margin for local wine, above the price of nonlocal wine. The wine consumption frequency can exert a positive effect on willingness to consume sustainable and local wine [107]. Therefore, with an appropriate marketing strategy and marketing program targeting the frequent wine consumer of above-average quality of wine and highlighting controlled geographical origin, a significantly higher price can be achieved than the one that most respondents currently pay [108]. Generation Y was most frequently willing to pay 10–20% more for wines of controlled geographical origin (43%) and local wines (36%) than for wine with no specified geographical origin and nonlocal wine, respectively. The chi-square test findings showed a difference in the participants’ responses according to their willingness to pay more for wines of geographical origin and for local wine [43,48,49], which is consistent with the conclusion of other researchers [34,109]. The findings indicate that Generation Y and older cohorts had almost no habit of buying wine online (85.3%), which is in line with the findings of this research, i.e., that wine is most often bought in retail stores [66].
To further verify the existence of differences in wine consumption attitudes between Generation Y and older cohort ordinal variables, the authors used the Mann–Whitney nonparametric test for ordinal variables (see Table 3). The test made it possible to confirm the existence of differences and confirm their characteristics. We started from the assumption that the respondents did not differ in their wine consumption attitudes, i.e., that there was no difference between the older cohort (OC) and Generation Y (Gen Y).
A comparison of the older cohort (OC) and Generation Y (Gen Y) for income categories showed that the category OC (n = 841) had a smaller mean rank (689.52) than the Gen Y category (n = 597) with a mean rank of (761.74). A statistically significant difference was found (U = 225,823.000, p = 0.000, r = 0.09). For the education categories, the Mann–Whitney test results showed that the category OC had a larger mean rank (861.37) than the Gen Y category with a mean rank of (519.65). A statistically significant difference was found (U = 131,730.000, p = 0.000, r = 0.49—moderate effect). For the question “How often do you buy wine?”, the category OC had a larger mean rank (741.41) than the Gen Y category with a mean rank of (688.64). A statistically significant difference was found (U = 232,615.500, p = 0.000, r = 0.0109). For the question “What size of wine do you buy?”, the OC had a larger mean rank (800.21) than the Gen Y category with a mean rank of (605.80). A statistically significant difference was found (U = 183,160.500, p = 0.000, r = 0.31—moderate effect). For the question “How much do you know about wines?”, the Mann–Whitney test showed that the category OC had a smaller mean rank (611.69) than the Gen Y category with a mean rank of (871.37). A statistically significant difference was found (U = 160,371.500, p = 0.000, r = 0.35—moderate effect). For the question “What price are you willing to pay for 1 L of wine?”, the category OC had a smaller mean rank (685.86) than the Gen Y category with a mean rank of (766.89). A statistically significant difference was found (U = 222,746.500, p = 0.000, r = 0.12). For the question “How much more are you willing to pay for a quality wine with a controlled geographical origin?”, the category OC had a larger mean rank (741.18) than the Gen Y category with a mean rank of (688.96). A statistically significant difference was found (U = 232,808.500, p = 0.000, r = 0.06). For the question “How much more are you willing to pay for local wine?”, the category OC had a larger mean rank (743.08) than the Generation Y category with a mean rank of (686.29). A statistically significant difference was found (U = 231,211.500, p = 0.000, r = 0.07).

4.1. Binary Logistic Regression Models

Figure 1 shows the scores for both Generation Y and the older cohort on the importance of online wine information in online wine purchase. The best-rated variables by the older cohort were information on the wine’s geographical origin, tips from wine connoisseurs or experts, and information on the wine producer’s awards. The best-rated variables by Generation Y were information on the wine’s geographical origin, the characteristics of the geographical origin, videos of the vineyards, and advice from wine connoisseurs or experts.
Binary logistic regression was conducted to determine what online information predicts the online wine purchase intention of both cohorts (Table 4 and Table 5). The model was initially tested with 10 independent variables and a dependent variable—online wine purchase. Multicollinearity testing was performed, and the presence of a correlation was checked. The correlation with the dependent variable was high, while, in the case of the independent variables, the correlation coefficients and VIF suggested that certain variables should be excluded from the model. Thus, the five independent variable models had a Cronbach’s alpha value greater than 0.7, meaning that the retained variables were reliable for further testing (older cohort: 0.874; Generation Y: 0.843). After performing hierarchical regression by entering the predictors, sociodemographic variables, and interactions (with method = enter in the SPSS program), we monitored the improvement of the model for predicting online wine purchases, i.e., the values of chi-square, Cox and Snell R-square, and Nagelkerke R-square, as shown in the blocks. To make the paper easier to read, we discuss the results for the older cohorts first and then Generation Y, as in Table 2 and Table 3.

4.1.1. Binary Logistic Regression for Older Cohort

To predict online wine purchase intention, a binary logistic regression was performed in three stages. The analysis was performed separately for each age cohort. Model 1 contained five variables (information on the geographical origin, information on the use of wine in the culinary arts, videos of the vineyards, current campaigns or promotions highlighted in the media and on social networks, and a link that connects producers with consumers to get additional information or send remarks, suggestions, praise). Model 1 was statistically significant χ2 (5, n = 1438) = 81.621, p = 0.000, which shows that the model distinguished the influence of predictors on the online purchase of wine. The model as a whole explained 15.3% (Cox and Snell R-square) and 20.5% (Nagelkerke R-square) of variance in online shopping and accurately classified 64% of cases. Model 2 was constructed with the addition of sociodemographic variables (gender, income, and education). Model 2 was statistically significant χ2 (8, n = 1438) = 111.164, p = 0.000, and the other parameters showed 20.2% (Cox and Snell R-square) and 27.1% (Nagelkerke R-square) of variance in online shopping and accurately classified 67.9% of cases. Lastly, Model 3 was constructed with the interaction of statistically significant variables with sociodemographic factors. The significance parameters of Model 3 were χ2 (12, n = 1438) = 131.521, p = 0.000; The model as a whole explained 23.5% (Cox and Snell R-square) and 31.4% (Nagelkerke R-square) of variance in online shopping and accurately classified 69.3% of cases.
The results of the partial contribution in Model 1 show that the variables information on the use of wine in culinary arts, a link that connects producers with consumers to get additional information or send remarks, suggestions, and praise, and a link to the winemakers’ association website were statistically significant [85,86,87,88,89,92]. The results indicate that consumers rely on the opinions of experts, regarding the properties of wine and its use [20,72,74,75,76,92]. The value of the exponential coefficient indicates that the increase in the information on the use of wine in culinary arts per unit of value caused the odds of online purchase to increase 0.258-fold. When a sociodemographic variable was introduced into the model and its interaction, the contribution of that variable increased slightly. A link that connects producers with consumers to get additional information or send remarks, suggestions, and praise had a large partial contribution which, upon increasing per unit, contributed to an increase in the odds of online shopping 2008-fold, and, upon introducing sociodemographic variables and interaction, the partial contribution of that variable increased (2216- and 2613-fold, respectively). The link to the winemakers’ association website had a significant partial contribution to the model. The value of the exponential coefficient indicates that the increase in the link to the winemakers’ association website, per unit value, increased the odds of online shopping 1314-fold, and the introduction of sociodemographic variables and their interaction increased the impact on online wine shopping (1151- and 4246-fold, respectively).
The results of the analysis in Model 2 show that, under the influence of sociodemographic factors, the significance of all variables (except for information on geographical origin [85] and a link to the winemakers’ association website) increased. It turns out that the influence of gender was statistically significant, and that women (in the older cohort) would buy wine 3.67-fold more often online, which is in line with the conclusions of [57,91]. Among the older cohort of respondents, a higher level of education and income resulted in a lower likelihood of buying wine online.
In Model 3, we saw the significant effect of the interaction of gender and information on the use of wine in culinary arts and income with a link that connects producers with consumers to get additional information or send remarks, suggestions, and praise. The results presented in Model 3 indicate that the influence of interaction and the sociodemographic variables led to a decrease in the influence of the information on geographical origin, as indicated in previous studies [85], as well as the variable of current campaigns or promotions highlighted in the media and on social networks, while, for other variables, the influence increased. The inclusion of the interaction intensified the influence of gender on the online purchase of wine in the older cohort, and the positive effect of the interaction indicates that the influence of gender became stronger. The negative effect of the interaction between income and a link that connect producers with consumers to get additional information or send remarks, suggestions, and praise indicates that the negative effect became stronger when deciding to buy wine online over time.

4.1.2. Binary Logistic Regression for Generation Y

Model 1 was statistically significant χ2 (5, n = 1438) = 66.254, p = 0.000, which shows that the model distinguished the influence of predictors on online wine purchases. The model as a whole explained 12.6% (Cox and Snell R-square) and 16.8% (Nagelkerke R-square) of variance in online shopping and accurately classified 62.8% of cases. Model 2 was built with the addition of sociodemographic variables (gender, income, and education). Model 2 was statically significant χ2 (8, n = 1438) = 118.786, p = 0.000, and the significance parameters were 21.5% (Cox and Snell R-square) and 28.7% (Nagelkerke R-square) of variance in online shopping; it accurately classified 70.7% of cases. Lastly, Model 3 was constructed for the interaction of statistically significant variables with sociodemographic factors. The significance parameters of Model 3 were χ2 (12, n = 1438) = 125.797, p = 0.000; Model 3 as a whole explained 22.6% (Cox and Snell R-square) and 30.2% (Nagelkerke R-square) of variance in online shopping and accurately classified 72.2% of cases.
The results of the partial contribution of variables in Model 1 show that the variables information on geographical origin [59,60] and videos of the vineyards were statistically significant. The value of the exponential coefficient indicates that the increase in information on geographical origin per unit of value caused the odds of online purchase to increase 1795-fold. When sociodemographic variables were introduced into the model and interacted with them, the contribution of that variable decreased slightly. A video of the vineyards had a negative partial contribution which, upon increasing by one unit, contributed to a 0.3-fold increase in the odds of online shopping, and, upon introducing sociodemographic variables and interaction, the partial contribution of that variable changed slightly in the positive direction.
The results of Model 2 show that, under the influence of sociodemographic factors, the significance of all variables (except for a video of the vineyards) was reduced. Gender’s influence was shown to be statistically significant, in contrast to [57,91], whereby women (in Generation Y) would buy wine 7932-fold more often online [58]. Among Generation Y respondents, a higher level of income led to a higher probability of buying wine online, while a higher level of education led to a lower likelihood of buying wine online, in contrast to [59,91].
In Model 3, we saw a significant effect of the interaction of income with information on geographical origin, which means that the quality of wine was especially important to these respondents [59,60,77,81]. The results shown in Model 3 indicate that the impact of interaction and sociodemographic variables led to an increase in the impact of information on geographical origin, videos of vineyards, and a link that connects producers with consumers to get additional information or send remarks, suggestions, and praise, while, for other variables, the influence was reduced. The inclusion of the interaction enhanced the impact of income on online wine shopping in Generation Y, and the positive effect of the interaction indicates that the impact of income became stronger, which is in line with other findings [84,91].

5. Conclusions

This study analyzed current wine perceptions and general attitudes of Generation Y and the older cohort connected to wine purchase in a sample of Serbian academic staff. The research findings show that, in both age cohorts, women were more inclined to purchase wine. Most of the older cohort of wine consumers had a collage diploma, while the Generation Y consumers had higher degrees (Master’s, PhD), which reflects the higher education levels and the higher average income in the chosen sample of the Serbian academic staff. Wine was purchased on an occasional basis, mostly monthly and weekly, in both age cohorts, with the greatest tendency of consumers in both age cohorts to buy wine bottles of 0.7 L. Additionally, the majority of consumers in both age cohorts bought red wine. Both age cohorts bought wine mainly in retail outlets, with a tendency to buy wine throughout the year, without any pronounced seasonal variation. Both age cohorts claimed to possess a moderate knowledge of wine; therefore, we can conclude that greater wine education campaigns would be needed in the future. The older cohort and Generation Y would be willing to pay a price higher than 10 EUR per liter of wine and were willing to pay a margin of 10–20% for quality wine with controlled geographical origin. The older cohort expressed a WTP up to a 10% higher margin for local wines, while Generation Y showed a higher WTP of 10–20% for the purchase of local wine. Members of Generation Y and the older cohort had virtually no habit of buying wine online. The findings also show that, for Generation Y and the older cohort, information on geographical origin represented the most important online information related to online purchase.
The second objective of the study was to explore differences in sociodemographic characteristics and general attitudes connected to the wine purchases of the Generation Y and the older cohort using the chi-square test. The findings show that significant differences do exist (level of education, level of income, frequency of wine purchase, size of wine bottle, periodicity of wine consumption, general knowledge on wines, consumers’ willingness to pay for 1 L of wine, and consumers’ willingness to pay more for quality wine with a controlled geographical origin and local wine and online wine purchase). To further verify the existence of differences in wine consumption attitudes between Generation Y and the older cohort ordinal variables, a Mann–Whitney nonparametric test for ordinal variables was employed. The Mann–Whitney nonparametric test allowed us to confirm the existence of differences and to establish their characteristics. For education levels and questions “How often do you buy wine?”, “What size of wine do you buy?”, “How much more are you willing to pay for a quality wine with a controlled geographical origin?”, and “How much more are you willing to pay for local wine?”, the Mann–Whitney test showed that the older cohort category had a larger mean rank than Generation Y. As per the income level and questions “How much do you know about wines?” and “What price are you willing to pay for 1 L of wine?”, the Mann–Whitney test showed that the older cohort category had a smaller mean rank than the Generation Y category, with statistical significance.
The third objective was to identify which online information predicts the online wine purchase intention of both age cohorts. Binary logistic regression for the older cohort and Generation Y was performed in three stages, separately for each age cohort.
The findings of the partial contribution of variables for the older cohort show that the variables information on the use of wine in culinary arts, a link that connects producers with consumers to get additional information or send remarks, suggestions, and praise, and a link to the winemakers’ association website were statistically significant in the regression. The value of the exponential coefficient indicates that, with a unit increase in the information on the use of wine in culinary arts, the odds of online shopping increased; when sociodemographic variables and interactions with them were introduced, the contribution of those variables increased slightly. A link that connects producers with consumers to get additional information or send remarks, suggestions, and praise had a large partial contribution, and the introduction of sociodemographic variables and interaction increased the partial contribution of that variable. A link to the winemakers ’association website had a significant partial contribution to the model. The introduction of the sociodemographic variables and the interactions increased the impact on online wine purchase. The influence of gender was statistically significant, and women (in the older cohort) bought wine more online. Among the older cohort, a higher level of education and income resulted in a lower likelihood of buying wine online. Lastly, the findings indicate a significant effect of the interaction of gender and information on the use of wine in culinary arts and income with links that connect producers with consumers to get additional information or send remarks, suggestions, and praise. The impact of interaction on the sociodemographic variables led to a reduction in the impact of information on geographical origin and current campaigns or promotions highlighted in the media and on social networks. The inclusion of the interaction intensified the influence of gender on online wine purchase in the older cohort.
The findings of the partial contribution of variables using binary logistic regression for Generation Y in Model 1 show that the variables information on geographical origin and videos of the vineyards were statistically significant. The result indicates that an increase in the information on geographical origin increased the odds of online shopping. When the sociodemographic variables were introduced into the model and the interaction with them, the contribution of that variable decreased slightly. Videos of the vineyards had a negative partial contribution, and, with the introduction of the sociodemographic variables and the interaction, the partial contribution of that variable changed slightly in a positive direction. Gender’s influence was statistically significant, whereby women (in Generation Y) bought wine more often online. Among Generation Y respondents, a higher level of income resulted in a higher likelihood of buying wine online, whereas a higher level of education had the opposite effect.
These findings are in line with Sohn et al. [110,111], who stated that consumers seem to integrate online store atmospherics (social cues) in their virtual shopping environment [112,113] to form online purchase intentions; therefore, enhanced wine sales can be spurred by increasing the level of social cues on the websites, with chat boxes, customer reviews, or pictures. Promotional activities on wine e-commerce websites [114] should be enhanced, having in mind that the promotional activities related to wine and the dissemination of wine consumption culture are not at a satisfactory level in the Republic of Serbia [36,115]. These findings provide a useful insight into all the similarities and differences of both age cohorts, reflecting the importance of added value activities presented online that are important motivators for online wine purchase for both generations. A small percentage of consumers, from both Generation Y and the older cohort, currently purchase wine online. Thus, an understanding of all the factors that drive preferences in wine purchase can be of assistance to wine marketers to adopt marketing strategies tailor-made to these age cohorts. Promotional online activities should be targeted to Generation Y preferences to develop a trust experience that can translate into repeated online wine purchases. Policymakers with information on the behavioral attitudes of both age cohorts could implement specific marketing campaigns directed at creating a positive perception of the Serbian wine sector. The analyzed factors of wine preferences could be the first step toward a better understanding of the consumer’s willingness to pay for quality wines with a controlled geographical origin and for local wines. The Serbian wine market is slowly developing, and this kind of orientation toward quality attributes could be useful for the marketing strategies of local wine producers. Our findings suggest that additional online information, such as the use of wine in culinary arts, short videos, sales promotions, and interactive links that connect producers with consumers with direct communication, could be a useful tool to promote online wine purchase. Therefore, this study addressed some practical implications for wine e-commerce websites that could be used for attracting potential consumers and for motivating the consumers to purchase wine through a winery’s website or e-commerce platforms. Our findings, from this research conducted in the Republic of Serbia, may potentially be different from findings in countries where the wine market is at a mature stage of development, which may represent a limitation. Furthermore, the sample does not represent the entire population, as it constituted 2.2% of the university population. Therefore, future studies could cover a larger sample, based on other sampling and processing techniques, to obtain further insights.

Author Contributions

Conceptualization, S.I. and J.V.T.; methodology, G.S.; software, S.I.; validation, N.L., I.B. and A.G.; formal analysis, N.P.; investigation, M.I. and R.P.; resources, O.M.; data curation, S.I.; writing—original draft preparation, I.B.; writing—review and editing, J.V.T.; visualization, N.P.; supervision, J.B. and L.D.; project administration, J.V.T.; funding acquisition, S.I. All authors have read and agreed to the published version of the manuscript.

Funding

This research received no external funding.

Institutional Review Board Statement

Not applicable.

Informed Consent Statement

Not applicable.

Data Availability Statement

Data are contained within the article.

Acknowledgments

This research was supported by grant No. 680-00-00071/2020-02 “Improving the competitiveness of the wine sector of Serbia—EduNaWi” of the “Republic of Serbia, Ministry of Agriculture, Forestry and Water Management”. This research was a part of the PhD thesis by Ivan Balenović, entitled “Human capital in the function of forming social entrepreneurship”.

Conflicts of Interest

The authors declare no conflict of interest.

References

  1. Wine Market-Growth, Trends, Covid-19 Impact, and Forecasts (2021–2026). The Global Wine Market Is Segmented by Product Type (Still Wine, Sparkling Wine, and Fortified Wine and Vermouth), by Color (Red Wine, Rose Wine, and White Wine), by Distribution Channel (On-Trade and Off-Trade), and by Geography. Available online: https://www.mordorintelligence.com/industry-reports/wine-market?gclid=CjwKCAiAgJWABhArEiwAmNVTB1jQxH8y1INEg6fzT9MWq-5ZzVKtm29q3I2so7eDub4qropm9Q1prBoCt5YQAvD_BwE (accessed on 9 April 2021).
  2. Serbia-Wine Consumption per Capita. Available online: https://www.nationmaster.com/nmx/timeseries/serbia-wine-consumption-per-capita (accessed on 17 October 2021).
  3. Ivanišević, D.; Jakšić, D. Viticulture in Serbia according to statistics and viticulture zoning. In Primena Podataka Popisa Poljoprivrede 2012. i Analiza Stanja Poljoprivrede i u Planiranju Agrarne Politike u Republici Srbiji; Republički Zavod za Statistiku: Subotica, Srbija, 2012; pp. 113–154. ISBN 978-8686-6161-115-5. [Google Scholar]
  4. Lajko, B.; Erdelji, T. The development strategy of the wine industry of Vojvodina in the global economic sphere. Anali Ekonomskog Fak. Subotici 2015, 51, 289–308. Available online: https://scindeks-clanci.ceon.rs/data/pdf/0350-2120/2015/0350-21201534289L.pdf (accessed on 17 October 2021).
  5. Prodanović, R.; Brkić, I.; Škrbić, S.K.; Đurić, K.; Bošković, J. Strengthening the capacity of the wine sector in the service of sustainable rural development of the Republic of Serbia. J. Agron. Technol. Eng. Manag. 2020, 3, 489–498. Available online: http://www.fimek.edu.rs/downloads/casopisi/jatem/issue/v3_5/03-(3)._Prodanovic_et_al_2020_3(5)_489-498.pdf (accessed on 17 October 2021).
  6. Cvijanović, D.; Ignjatijević, S. International Competitiveness of Niche Agricultural Products: Case of Honey Production in Serbia. In Handbook of Research on Globalized Agricultural Trade and New Challenges for Food Security; Erokhin, V., Gao, T., Eds.; IGI Global: Hershey, PA, USA, 2020; pp. 443–464. [Google Scholar] [CrossRef]
  7. Madeira, A.; Correia, A.; Filipe, J.A. Modelling wine tourism experiences. Anatolia 2019, 30, 513–529. [Google Scholar] [CrossRef]
  8. O’Neill, M. Generational Preferences: A Glimpse into the Future Office. In Knoll Workplace Research; Koll Inc.: East Greenville, PA, USA, 2010; Available online: https://www.knoll.com/document/1352940439350/WP_GenerationalDifferences.pdf (accessed on 17 October 2021).
  9. Williams, K.C.; Page, R.A. Marketing to the generations. J. Behav. Stud. Bus. 2011, 3, 37–53. Available online: https://www.researchgate.net/publication/242760064_Marketing_to_the_Generations (accessed on 17 October 2021).
  10. McCrindle, M. The ABC of XYZ: Understanding the Global Generations; McCrindle Research Pty Ltd.: Bella Vista, Australia, 2014; ISBN 978-0-9924839-0-6. [Google Scholar]
  11. Lancaster, L.; Stillman, D. When Generations Collide; Harper Collins Publishing: New York, NY, USA, 2002. [Google Scholar]
  12. Markert, J. Demographics of Age: Generational and Cohort Confusion. J. Curr. Issues Res. Advert. 2004, 26, 11–25. [Google Scholar] [CrossRef]
  13. McCrindle, M. Understanding Generation Y. Princ. Matters 2003, 28–31. Available online: https://www.researchgate.net/publication/242702824_Understanding_Generation_Y (accessed on 17 October 2021).
  14. Pendergast, D. Getting to know the Y generation. Tour. Gener. Y 2010, 1, 1–15. [Google Scholar] [CrossRef]
  15. Morton, L.P. Targeting generation Y. Public Relat. Q. 2002, 47, 46. Available online: https://www.proquest.com/openview/d782887c8c3f1c135c74090fe0f8fb1c/1?pq-origsite=gscholar&cbl=49209 (accessed on 17 October 2021).
  16. Lovern, E. New Kids on the Block. Here Comes the Next Generation of Workers: They Have Gen Xers’ Energy and Skills, with a New Attitude. Mod. Healthc. 2001, 31, 28–32. [Google Scholar]
  17. Paul, P. Getting inside Gen Y. Advertising Age. 2001. Available online: http://adage.com/article/american-demographics/inside-gen-y/43704/ (accessed on 17 October 2021).
  18. Collins, D.E.; Tilson, E.R. A new generation on the horizon. (Teaching Techniques). Radiol. Technol. 2001, 73, 172. Available online: https://link.gale.com/apps/doc/A80803610/HRCA?u=anon~b96cf86f&sid=googleScholar&xid=d40a55b8 (accessed on 17 October 2021).
  19. Gurău, C. A life-stage analysis of consumer loyalty profile: Comparing Generation X and Millennial consumers. J. Consum. Mark. 2012, 29, 103–113. [Google Scholar] [CrossRef]
  20. Lissitsa, S.; Kol, O. Generation X vs. Generation Y–A decade of online shopping. J. Retail. Consum. Serv. 2016, 31, 304–312. [Google Scholar] [CrossRef]
  21. Parment, A. Generation Y in Consumer and Labour Markets; Routledge: London, UK, 2001; Volume 15. [Google Scholar]
  22. Kim, D.J. Generation Gaps in Engineering? Master of Science in Engineering and Management at the Massachusetts Instıtute of Technology: Cambridge, MA, USA, 2008; Available online: http://dspace.mit.edu/handle/1721.1/7582 (accessed on 17 October 2021).
  23. Gursoy, D.; Maier, T.A.; Chi, C.G. Generational differences: An examination of work values and generational gaps in the hospitality workforce. Int. J. Hosp. Manag. 2008, 27, 448–458. [Google Scholar] [CrossRef]
  24. Palfrey, J.; Gasser, U. Born Digital: Understanding the First Generation of Digital Natives; ReadHowYouWant: Sydney, Australia, 2011. [Google Scholar]
  25. Wolburg, J.M.; Pokrywczynski, J. A psychographic analysis of Generation Y college students. J. Advert. Res. 2001, 41, 33–52. [Google Scholar] [CrossRef]
  26. McKinna, D.A. Attitudes, Behaviour, Perceptions and Knowledge with Respect to South Australian Wine: A Report on a Qualitative and Quantitative Research Program; David McKinna et al. Pty. Ltd.: Melbourne, Australia, 1996. [Google Scholar]
  27. Wolf, M.; Carpenter, S.; Qenani-Petrela, E. A comparison of X, Y, and Boomer generation wine consumers in California. J. Food Distrib. Res. 2005, 36, 186–191. [Google Scholar] [CrossRef]
  28. Olsen, J.; Thach, E.; Nowak, L. Wine for my generation: Exploring how US wine consumers are socialized to wine. J. Wine Res. 2007, 18, 1–18. [Google Scholar] [CrossRef]
  29. Ritchie, C. Beyond drinking: The role of wine in the life of the UK consumer. Int. J. Wine Bus. Res. 2007, 21, 194–211. [Google Scholar] [CrossRef] [Green Version]
  30. Barber, N.; Dodd, T.; Ghiselli, R. Capturing the younger wine consumer. J. Wine Res. 2008, 19, 123–141. [Google Scholar] [CrossRef]
  31. Fountain, J.; Fish, N. It’s a Happy Drink’: Australasian Generation Y’s Experiences and Perception of Sparkling Wine. In Proceedings of the 5th International Academy of Wine Business Research Conference, Auckland, New Zealand, 8–10 February 2010; Available online: http://academyofwinebusiness.com/wp-content/uploads/2010/04/FountainFish-Its-a-happy-drink.pdf (accessed on 9 April 2021).
  32. Atkin, T.; Thach, L. Millennial Wine Consumers: Risk Perception and Information Search. Wine Econ. Policy 2012, 1, 54–62. [Google Scholar] [CrossRef] [Green Version]
  33. Parment, A. Generation Y vs. Baby Boomers: Shopping behavior, buyer involvement and implications for retailing. J. Retail. Consum. Serv. 2013, 20, 189–199. [Google Scholar] [CrossRef]
  34. Vlahović, B.; Užar, D. Wine purchase preferences of young consumers. Agroekonomika 2017, 46, 63–74. Available online: https://www.agroekonomika.rs/images/Brojevi/ae75/Agroekonimika_75.pdf (accessed on 17 October 2021).
  35. Radovanović, V.; Petrović, J.; Đorđević, Ž. Wine Marketing: Impact of Demographic Factors of Serbian Consumers on the Choice of Wine. Econ. Themes Sciendo 2017, 55, 199–215. Available online: http://www.economic-themes.com/pdf/et2017en2_04.pdf (accessed on 17 October 2021). [CrossRef] [Green Version]
  36. Vlahović, B.; Potrebić, V.; Jeločnik, M. Preferences of wine consumers on Serbian market. Econ. Agric. 2012, 59, 37–49. Available online: http://repository.iep.bg.ac.rs/142/1/Vlahovi%C4%87%2C%20%20Potrebi%C4%87%2C%20%20Jelo%C4%8Dnik.pdf (accessed on 17 October 2021).
  37. Hanić, H. Marketing; Čugura Print: Beograd, Serbia, 2005. [Google Scholar]
  38. Novaković-Rajačić, B. Ponašanje Potrošača; Evropski Univerzitet: Beograd, Serbia, 2005. [Google Scholar]
  39. Hanić, H.; Vićentić, M.; Đurica, M. Istraživanje Tržišta; Visoka Poslovna Škola Strukovnih Studija: Valjevo, Serbia, 2010. [Google Scholar]
  40. Thompson, G.D. Consumer Demand for Organic Foods: What we know and what we need to know. Am. J. Agric. Econ. 1998, 80, 1113–1118. [Google Scholar] [CrossRef]
  41. Pitta, D.; Eastman, J.K.; Liu, J. The impact of generational cohorts on status consumption: An exploratory look at generational cohort and demographics on status consumption. J. Consum. Mark. 2012, 29, 93–102. [Google Scholar] [CrossRef]
  42. Smola, K.W.; Sutton, C.D. Generational differences: Revisiting generational work values for the new millennium. J. Organ. Behav. 2002, 23, 363–382. [Google Scholar] [CrossRef]
  43. Vapa Tankosić, J.; Ignjatijević, S.; Kiurski, J.; Milenković, J.; Milojević, I. Analysis of consumers’ willingness to pay for organic and local honey in Serbia. Sustainability 2020, 12, 4686. [Google Scholar] [CrossRef]
  44. Brugarolas Molla-Bauza, M.M.; Martinez-Carrasco, L.; Martınez-Poveda, A.; Rico Perez, M. Determination of the surplus that consumers are willing to pay for an organic wine. Span. J. Agric. Res. 2005, 3, 43–51. Available online: https://www.researchgate.net/publication/271189845_Determination_of_the_surplus_that_consumers_are_willing_to_pay_for_an_organic_wine (accessed on 17 October 2021). [CrossRef] [Green Version]
  45. Olsen, J.; Thach, L.; Hemphill, L. The impact of environmental protection and hedonistic values on organic wine purchases in the US. Int. J. Wine Bus. Res. 2012, 24, 47–67. [Google Scholar] [CrossRef]
  46. Zander, K.; Janssen, M. Präferenzen deutscher Öko-Konsumenten für Wein. Schr. Ges. Wirtsch. Soz. Landbaus eV 2012, 48, 177–188. [Google Scholar] [CrossRef]
  47. Szolnoki, G.; Hauck, K. Analysis of German wine consumers’ preferences for organic and non-organic wines. Br. Food J. 2020, 122, 2077–2087. [Google Scholar] [CrossRef]
  48. Cvijanović, D.; Ignjatijević, S.; Vapa Tankosić, J.; Cvijanović, V. Do Local Food Products Contribute to Sustainable Economic Development? Sustainability 2020, 12, 2847. [Google Scholar] [CrossRef] [Green Version]
  49. Lunardo, R.; Rickard, B. How do consumers respond to fun wine labels? Br. Food J. 2019, 122, 2603–2619. [Google Scholar] [CrossRef]
  50. Combris, P.; Lecocq, S.; Visser, M. Estimation of a Hedonic Price Equation for Bordeaux Wine: Does Quality Matter? Econ. J. 1997, 107, 390–402. [Google Scholar] [CrossRef]
  51. Lunardo, R.; Guerinet, R. The influence of label on wine consumption: Its effects on young consumers’ perception of authenticity and purchasing behavior. Int. Mark. Trade Qual. Food Prod. 2007, 5, 279–291. [Google Scholar]
  52. Mueller, S.; Szolnoki, G. The relative influence of packaging, labelling, branding and sensory attributes on liking and purchase intent: Consumers differ in their responsiveness. Food Qual. Prefer. 2010, 21, 774–783. [Google Scholar] [CrossRef]
  53. Casini, L.; Corsi, A.M.; Goodman, S. Consumer preferences of wine in Italy applying best-worst scaling. Int. J. Wine Bus. Res. 2009, 21, 64–78. [Google Scholar] [CrossRef] [Green Version]
  54. Cohen, E. Applying best-worst scaling to wine marketing. Int. J. Wine Bus. Res. 2009, 21, 8–23. [Google Scholar] [CrossRef]
  55. Bloomfield, K.; Grittner, U.; Rasmussen, H.B.; Petersen, H.C. Socio-demographic correlates of alcohol consumption in the Danish general population. Scand. J. Public Health 2008, 36, 580–588. [Google Scholar] [CrossRef]
  56. Greenfield, T.K.; Midanik, L.T.; Rogers, J.D. A 10-year national trend study of alcohol consumption, 1984–1995: Is the period of declining drinking over? Am. J. Public Health 2010, 90, 47–52. [Google Scholar] [CrossRef]
  57. Rodríguez-Donate, M.C.; Romero-Rodríguez, M.E.; Cano-Fernández, V.J.; Guirao-Pérez, G. Sociodemographic determinants of the probability of wine consumption in Tenerife (Canary Islands). Int. J. Wine Bus. Res. 2017, 29, 316–334. [Google Scholar] [CrossRef]
  58. Annunziata, A.; Pomarici, E.; Vecchio, R.; Mariani, A. Health warnings on wine: A consumer perspective. Br. Food J. 2016, 118, 647–659. [Google Scholar] [CrossRef]
  59. D’Alessandro, S.; Pecotich, A. Evaluation of wine by expert and novice consumers in the presence of variations in quality, brand and country of origin cues. Food Qual. Prefer. 2013, 28, 287–303. [Google Scholar] [CrossRef]
  60. Stanco, M.; Lerro, M.; Marotta, G. Consumers’ Preferences for Wine Attributes: A Best-Worst Scaling Analysis. Sustainability 2020, 12, 2819. [Google Scholar] [CrossRef] [Green Version]
  61. Agnoli, L.; Capitello, R.; Begalli, D. Behind intention and behaviour: Factors influencing wine consumption in a novice market. Br. Food J. 2016, 118, 660–678. [Google Scholar] [CrossRef]
  62. St James, M.; Christodoulidou, N. Factors influencing wine consumption in Southern California consumers. Int. J. Wine Bus. Res. 2011, 23, 36–48. [Google Scholar] [CrossRef]
  63. Van Zanten, R. Drink choice: Factors influencing the intention to drink wine. Int. J. Wine Mark. 2005, 17, 49–61. [Google Scholar] [CrossRef] [Green Version]
  64. Samoggia, A. Wine and health: Faraway concepts? Br. Food J. 2016, 118, 946–960. [Google Scholar] [CrossRef]
  65. Chrysochou, P.; Krystallis, A.; Mocanu, A.; Leigh Lewis, R. Generation Y preferences for wine: An exploratory study of the US market applying the best-worst scaling. Br. Food J. 2012, 114, 516–528. [Google Scholar] [CrossRef]
  66. Němcová, J.; Staňková, P. Factors influencing consumer behaviour of generation Y on the Czech wine market. EaM Ekon. Manag. 2019, 22, 145–161. [Google Scholar] [CrossRef]
  67. Mueller, S.; Charters, S. Generation Y and wine. Int. J. Wine Bus. Res. 2011, 23. [Google Scholar] [CrossRef]
  68. Goldgehn, L. Generation Who, What, Y? What You Need to Know about Generation Y. Int. J. Educ. Adv. 2004, 5, 24–34. [Google Scholar] [CrossRef]
  69. Nacka, M.; Popova, K.; Elenov, R. Influence of Extrinsic Factors on Consumers’ Choice at Segmented Wine Events. Econ. Agric. 2019, 66, 1127–1142. [Google Scholar] [CrossRef]
  70. Bressolles, G.; Durrieu, F. A typology of online buyers for French wine web sites based on electronic service quality dimensions. Int. J. Wine Bus. Res. 2010, 22, 335–348. [Google Scholar] [CrossRef]
  71. Bonn, M.A.; Kim, W.G.; Kang, S.; Cho, M. Purchasing wine online: The effects of social influence, perceived usefulness, perceived ease of use, and wine involvement. J. Hosp. Mark. Manag. 2016, 25, 841–869. [Google Scholar] [CrossRef]
  72. Pucci, T.; Casprini, E.; Nosi, C.; Zanni, L. Does social media usage affect online purchasing intention for wine? The moderating role of subjective and objective knowledge. Br. Food J. 2019, 121, 275–288. [Google Scholar] [CrossRef]
  73. Hill, W.W.; Beatty, S.E. A model of adolescents’ online consumer self-efficacy (OCSE). J. Bus. Res. 2011, 64, 1025–1033. [Google Scholar] [CrossRef]
  74. Pate, S.S.; Adams, M. The influence of social networking sites on buying behaviors of millennials. Atl. Mark. J. 2013, 2, 7. Available online: https://digitalcommons.kennesaw.edu/amj/vol2/iss1/7 (accessed on 17 October 2021).
  75. Girard, T.; Korgaonkar, P.; Silverblatt, R. Relationship of type of product, shopping orientations, and demographics with preference for shopping on the Internet. J. Bus. Psychol. 2003, 18, 101–120. [Google Scholar] [CrossRef]
  76. Peralta, E. Generation X: The Small but Financially Powerful Generation. Centro. 2015. Available online: http://www.centro.net/blog/generation-x-the-small-but-mighty-generation/ (accessed on 17 October 2021).
  77. Reisenwitz, T.H.; Iyer, R. Differences in generation X and generation Y: Implications for the organization and marketers. Mark. Manag. J. 2009, 19, 91–103. Available online: https://www.mmaglobal.org/publications/MMJ/MMJ-Issues/2009-Fall/MMJ-2009-Fall-Vol19-Issue2-Complete.pdf#page=112 (accessed on 17 October 2021).
  78. Mueller, S.; Remaud, H.; Chabin, Y. How strong and generalisable is the Generation Y effect? A cross-cultural study for wine. Int. J. Wine Bus. Res. 2011, 23, 125–144. [Google Scholar] [CrossRef]
  79. Bakewell, C.; Mitchell, V.W. Generation Y female consumer decision-making styles. Int. J. Retail. Distrib. Manag. 2003, 31, 95–106. [Google Scholar] [CrossRef]
  80. Lehtonen, T.-K.; Mäenpää, P. Shopping in the East Centre Mall. In Shopping Experience; Campbell, F., Ed.; Sage Publications Inc.: London, UK, 1997; pp. 136–165. Available online: https://researchportal.helsinki.fi/en/publications/shopping-in-the-east-centre-mall (accessed on 17 October 2021).
  81. Phillips, C. Millennials: Clued in or clueless. Advert. Age 2007, 78, 12–13. [Google Scholar]
  82. Lynch, J.G., Jr.; Ariely, D. Wine online: Search costs affect competition on price, quality, and distribution. Mark. Sci. 2000, 19, 83–103. [Google Scholar] [CrossRef] [Green Version]
  83. Stricker, S.; Sumner, D.A.; Mueller, R.A.E. Wine on web in a global market, a comparison of e-commerce readiness and use in Australia, California and Germany. In Proceedings of the EFITA 2003 Conference, Debrecen, Hungary, 5–9 July 2003; Available online: https://www.informatique-agricole.org/download/efita-conference/Congres_EFITA_2003/0309.pdf (accessed on 17 October 2021).
  84. Bruwer, J.; Wood, G. The Australian online wine-buying consumer: Motivational and behavioural perspectives. J. Wine Res. 2005, 16, 193–211. [Google Scholar] [CrossRef]
  85. Cho, M.; Bonn, M.A.; Kang, S. Wine attributes, perceived risk and online wine repurchase intention: The cross-level interaction effects of website quality. Int. J. Hosp. Manag. 2014, 43, 108–120. [Google Scholar] [CrossRef]
  86. Taylor, D.C.; Parboteeah, D.V.; Snipes, M. Winery websites: Effectiveness explored. J. Bus. Adm. Online 2010, 9, 1–11. Available online: https://www.researchgate.net/profile/D_Taylor4/publication/266887322_Winery_Websites_Effectiveness_Explored/links/55548f6108ae6fd2d81fbb83/Winery-Websites-Effectiveness-Explored.pdf (accessed on 17 October 2021).
  87. Bauer, H.H.; Grether, M.; Leach, M. Building customer relations over the Internet. Ind. Mark. Manag. 2002, 31, 155–163. [Google Scholar] [CrossRef]
  88. Zhang, P.; Von Dran, G.M. User expectations and rankings of quality factors in different web site domains. Int. J. Electron. Commer. 2001, 6, 9–33. [Google Scholar] [CrossRef]
  89. Loiacono, E.T.; Watson, R.T.; Goodhue, D.L. Web Qual: An instrument for consumer evaluation of web sites. Int. J. Electron. Commer. 2007, 11, 51–87. [Google Scholar] [CrossRef]
  90. Lim, Y.J.; Osman, A.; Salahuddin, S.N.; Romle, A.R.; Abdullah, S. Factors Influencing Online Shopping Behavior: The Mediating Role of Purchase Intention. Procedia Econ. Financ. 2016, 35, 401–410. [Google Scholar] [CrossRef] [Green Version]
  91. Santos, J.F.; Ribeiro, J.C. The Portuguese online wine buying consumer: Characteristics, motivations and behaviour. EuroMed J. Bus. 2012, 7, 294–311. [Google Scholar] [CrossRef]
  92. Pelet, J.E.; Lecat, B. Smartphones and wine consumers: A study of Gen-Y. Int. J. Wine Bus. Res. 2014, 26, 188–207. [Google Scholar] [CrossRef]
  93. Kent, R. Marketing Research in Action; Cengage Learning EMEA: London, UK, 1993. [Google Scholar]
  94. Henryks, J.; Pearson, D. Attitude Behavior Gaps: Investigating Switching Amongst Organic Consumers. In Proceedings of the Conference Proceedings Part 2: International Food Marketing Research Symposium, Bournemouth, UK, 13–14 June 2018; Stanton, J., Lang, M., Laszlo, V., Eds.; Institute of Food Products Marketing: Bologna, Italy, 2013; Volume 2, pp. 3–19. [Google Scholar]
  95. Palys, T. Purposive sampling. In The Sage Encyclopedia of Qualitative Research Methods; Given, L., Ed.; SAGE Publications, Inc.: Los Angeles, CA, USA, 2008; pp. 697–698. [Google Scholar]
  96. Wilkins, J.R. Construction workers’ perceptions of health and safety training programmes. Constr. Manag. Econ. 2011, 29, 1017–1026. [Google Scholar] [CrossRef]
  97. Venter, K.; Van der Merwe, D.; De Beer, H.; Kempen, E.; Bosman, M. Consumers’ perceptions of food packaging: An exploratory investigation in Potchefstroom, South Africa. Int. J. Consum. Stud. 2011, 35, 273–281. [Google Scholar] [CrossRef]
  98. Mkhize, S.; Ellis, D. Creativity in marketing communication to overcome barriers to organic produce purchases: The case of a developing nation. J. Clean. Prod. 2020, 242, 118415. [Google Scholar] [CrossRef]
  99. Woolson, R.F.; Clarke, W.R. Statistical Methods for the Analysis of Biomedical Data; John Wiley & Sons. Inc: New York, NY, USA, 2002. [Google Scholar]
  100. Burgiel, A.; Sowa, I. New consumer trends adoption by generations X and Y—Comparative analysis. Zesz. Naukowe SGGW Warszawie 2017, 117, 61–74. [Google Scholar] [CrossRef]
  101. Raišienė, A.G.; Rapuano, V.; Varkulevičiūtė, K. Sensitive Men and Hardy Women: How Do Millennials, Xennials and Gen X Manage to Work from Home? J. Open Innov. Technol. Mark. Complex. 2021, 7, 106. [Google Scholar] [CrossRef]
  102. Cwynar, A. Financial literacy, behaviour and well-being of millennials in Poland compared to previous generations: The insights from three large-scale surveys. Rev. Econ. Perspect. 2020, 20, 289–335. [Google Scholar] [CrossRef]
  103. Rosner, B. Fundamentals of Biostatistics; Brooks/Cole: Boston, MA, USA, 2011. [Google Scholar]
  104. Menard, S. Applied Logistic Regression Analysis; SAGE Publications Inc.: Thousand Oaks, CA, USA, 2002. [Google Scholar]
  105. Sarti, D.; Torre, T. Generation X and knowledge work: The impact of ICT. What are the implications for HRM? In Digital Technology and Organizational Change; Springer: Cham, Switzerland, 2018; pp. 227–240. [Google Scholar] [CrossRef]
  106. Hoekstra, I.; Lashley, C.; Cavagnaro, E. Generation Y’s attitude towards organic wine. Res. Hosp. Manag. 2015, 5, 107–113. [Google Scholar] [CrossRef] [Green Version]
  107. Palmieri, N.; Perito, M.A. Consumers’willingness to consume sustainable and local wine in Italy. Ital. J. Food Sci. 2020, 32, 222–233. [Google Scholar] [CrossRef]
  108. Thomas, A. Elements influencing wine purchasing: A New Zealand view. Int. J. Wine Mark. 2000, 12, 47–62. [Google Scholar] [CrossRef]
  109. Anchor, J.R.; Lacinová, T. Czech wine consumers: Maturing with age? EaM Ekon. Manag. 2015, 18, 169–182. [Google Scholar] [CrossRef]
  110. Sohn, S.; Seegebarth, B.; Kissling, M.; Sippel, T. Social Cues and the Online Purchase Intentions of Organic Wine. Foods 2020, 9, 643. [Google Scholar] [CrossRef]
  111. Gardašević, M.; Brkić, I.; Krstić, T. Innovations in Agricultural and Wine Production Sector. J. Agron. Technol. Eng. Manag. 2020, 3, 448–454. [Google Scholar]
  112. Ignjatijević, S.; Aničić, A.; Vapa-Tankosić, J.; Belokapić-Čavkunović, J. Utvrđivanje ekonomskih relacija privrednog rasta i zaštite životne sredine. Oditor-Čas. Menadž. Finans. Pravo 2020, 6, 38–48. [Google Scholar] [CrossRef]
  113. Jokanović, M.; Golubović, D.; Šupić, B.; Koprivica, A. Application of Renewable Energy Sources in Terms of Economic, Environmental and Social Sustainability. Appl. Eng. Lett. 2018, 3, 34–39. [Google Scholar] [CrossRef] [Green Version]
  114. Dihovični, Đ.; Škrbić, S. Fuzzy approach to supply chain management for e-commerce store. Appl. Eng. Lett. 2020, 5, 62–67. [Google Scholar] [CrossRef]
  115. Mihajlović, M.; Nikolić, S.; Tasić, S. Održivost ekonomskog modela savremene privrede. Održiv. Razvoj 2020, 2, 7–13. [Google Scholar] [CrossRef]
Figure 1. Importance of online wine information in online wine purchase.
Agriculture 11 01054 g001
Table 1. Sample characteristics.
Whole Sample (n = 1438)%Older Cohort
(n = 841)
%Generation Y
(n = 597)
%
GenderFemale100669.954965.345776.5
Male43230.129234.714023.5
χ2 (1) = 21.101; p = 0.000
Level of educationHigher school18312.7354.214824.8
BA degree96667.272886.623839.9
Other (MA, PhD)28920.1789.321135.3
χ2 (2) = 348.156; p = 0.000
Total average income (per month) of your household<50,000 RSD/430 EUR644.5121.4528.7
50,000–80,000 RSD/680 EUR23416.320324.2315.2
80,001–120,000 RSD/680–1025 EUR6614633439.732754.8
Over 120,000 RSD/1025 EUR47933.327332.520634.5
χ2 (3) = 273.931; p = 0.000
Table 2. Purchase patterns of wine consumption.
Whole Sample (n = 1438)%Older Cohort
(n = 841)
%Generation Y
(n = 597)
%
How often do you buy wine?Once a week27919.413616.214324
Several times during the week29120.415418.313722.9
Once in 2 weeks19713.710412.49315.6
Once a month49834.630636.419232.2
Once in 3 months322.200325.4
Once in 6 months1419.814016.800
χ2 (5) = 164.205; p = 0.000
What size of wine do you buy?Bottle of 0.7 L110376.755365.855092.1
Bottle of 1 L16411.413115.6335.5
Larger package17111.915718.7142.3
χ2 (2) = 140.806; p = 0.000
What type of wine do you buy?Aromatized dessert wine1218.4748.8477.9
White41428.823728.217729.6
Rose17412.19210.98213.7
Red69348.242250.227145.4
Sparkling wine362.5161.9203.4
χ2 (4) = 7.454; p = 0.114
Where do you buy wine?Directly from the producer—winery26518.415518.411018.4
Specialized beverage stores33022.919723.413322.3
Retail stores66045.93874627345.7
Fairs, events18312.710212.18113.6
χ2 (3) = 0.775; p = 0.865
Do you consume wine throughout the year or do you increase consumption during a specific time of the year (or season?)Seasonally20614.310011.910617.8
All year123285.774188.149182.2
χ2 (1) = 121.868; p = 0.000
How much do you know about wines?I have no knowledge on wine735.1738.700
I have poor knowledge41028.533740.17312.2
I have moderate knowledge81756.836142.945676.4
I have excellent knowledge1389.6708.36811.4
χ2 (3) = 218.986; p = 0.000
What price are you willing to pay for 1 L of wine?500 RSD/4.3 EUR714.9%718.400
700 RSD/6 EUR28720%354.225242.2
1000 RSD/8.6 EUR39127.2%35942.7325.4
1500 RSD/12.8 EUR41128.6%23427.817729.6
More than 1500 RSD/12.8 EUR27819.3%14216.913622.8
χ2 (4) = 489.268; p = 0.000
How much are you willing to pay more for a quality wine with a controlled geographical origin?Nothing more302.1303.600
Up to 10% more39027.121825.917228.8
10–20%56939.631237.125743
20–30%22915.916619.76310.6
More than 30%22015.311513.710517.6
χ2 (4) = 47.489; p = 0.000
How much are you willing to pay more for local wine?Nothing more1329.210011.9325.4
Up to 10% more52736.634641.118130.3
10–20%42429.520824.721636.2
20–30%17612.211313.46310.6
More than 30%17912.4748.810517.6
χ2 (4) = 66.940; p = 0.000
Do you buy wine online?No122685.369782.952988.6
Yes21214.714417.16811.4
χ2 (1) = 9.127; p = 0.003
Table 3. Mann–Whitney test statistics (grouping variable: generation).
Mean RankSum of RanksMann–Whitney UWilcoxon WZAsymp. Sig. (2-Tailed)Effect Size
IncomeOlder Coh689.52579,884.00225,823.000579,884.000−3.5010.0000.09
GenY *761.74454,757.00
EducationOlder Coh861.37724,408.00131,730.000310,233.000−18.5550.0000.49
GenY519.65310,233.00
How often do you buy wine?Older Coh741.41623,522.50232,615.500411,118.500−3.9020.0000.10
GenY688.64411,118.50
What size of wine do you buy?Older Coh800.21672,977.50183,160.500361,663.500−11.8440.0000.31
GenY605.80361,663.50
How much do you know about wines?Older Coh611.69514,432.50160,371.500514,432.500−13.1260.0000.35
GenY *871.37520,208.50
What price are you willing to pay for 1 L of wine?Older Coh685.86576,807.50222,746.500576,807.500−4.5920.0000.12
GenY *766.89457,833.50
How much more are you willing to pay for a quality wine with a controlled geographical origin?Older Coh741.18623,329.50232,808.500411,311.500−2.4620.0140.06
GenY688.96411,311.50
How much more are you willing to pay for local wine?Older Coh743.08624,926.50231,211.500409,714.500−2.6630.0080.07
GenY686.29409,714.50
* Effect size—0.1 (small effect), 0.3 (moderate effect), and 0.5 and above (large effect).
Table 4. Logistic regression for older cohort.
Model 1Model 2Model 3
BExp (B)BExp (B)BExp (B)
Constant0.6992.0122.2229.2261.1013.008
Information on geographical origin0.3131.3670.2261.254−0.6700.512
Current campaigns or promotions highlighted in the media and on social networks−0.0210.9790.0511.0520.0301.031
Information on use of wine in culinary arts−1.354 **0.258−1.247 **0.287−1.133 **0.322
Link that connects producers with consumers in order to get additional information or send remarks, suggestions, and praise0.697 **2.0080.754 **2.1260.9602.613
Link to winemakers’ association website0.273 *1.3140.1411.1511.446 **4.246
Gender (female = 1) 1.301 **3.6721.8186.160
Education −0.21 30.808−0.243 *0.784
Income −0.494 *0.610−0.4140.661
Gender by information on use of wine in culinary arts 0.753 *2.123
Gender by link that connects producers with consumers in order to get additional information or send remarks, suggestions, and praise −0.9890.372
Income by information on use of wine in culinary arts 0.1611.174
Income by link that connects producers with consumers in order to get additional information or send remarks, suggestions, and praise −0.381 *0.683
Chi-square (df) sig81.621 (5); 0.000111.164 (8); 0.000131.521 (12); 0.000
Cox and Snell R-square/Nagelkerke R-square/%0.153; 0.205; 64%0.202; 0.271; 67.9%0.235; 0.314; 69.30%
Significant at * p < 0.05 and ** p < 0.001.
Table 5. Logistic regression for Generation Y.
Model 1Model 2Model 3
BExp (B)BExp (B)BExp (B)
Constant2.50012.1881.2563.511−3.8940.020
Information on geographical origin0.585 **1.7950.433 **1.5421.710 **5.530
Information on use of wine in culinary arts0.1741.1900.1581.1720.0911.096
Video of the vineyards−1.204 **0.300−0.976 **0.377−0.879 **0.415
Current campaigns or promotions highlighted in the media and on social networks0.0181.0180.0021.002−0.0230.977
Link that connects producers with consumers in order to get additional information or send remarks, suggestions, and praise−0.1830.833−0.2180.804−0.2100.811
Gender (female = 1) 2.071 **7.9326.352 **573.465
Income 1.543 **4.6786.648 **770.904
Education −1.519 **0.219−1.3700.254
Gender by information on geographical origin −1.0760.341
Income by information on geographical origin 1.292 *3.640
Gender by video of the vineyards −0.2140.808
Income by video of the vineyards −0.0310.969
Chi-square (df) sig66.254 (5), 0.000118.786 (8); 0.000125.797 (12); 0.000
Cox and Snell R-square/Nagelkerke R-square/%0.126; 0.168; 62,8%0.215; 0.287; 70.7%0.226; 0.302; 72.2%
Significant at * p < 0.05 and ** p < 0.001.
Publisher’s Note: MDPI stays neutral with regard to jurisdictional claims in published maps and institutional affiliations.

