Article

Applying the Response Surface Methodology (RSM) Approach to Predict the Tractive Performance of an Agricultural Tractor during Semi-Deep Tillage

by
Mohammad Askari
1,
Yousef Abbaspour-Gilandeh
2,
Ebrahim Taghinezhad
3,
Ahmed Mohamed El Shal
4,
Rashad Hegazy
5,* and
Mahmoud Okasha
6
1
Department of Biosystem Engineering, Faculty of Agricultural Engineering, Sari Agricultural Sciences and Natural Resources University, Sari 56199-11367, Iran
2
Department of Biosystem Engineering, Faculty of Agriculture and Natural Resources, University of Mohaghegh Ardabili, Ardabil 56199-11367, Iran
3
Department of Agricultural Technology Engineering, Moghan College of Agricultural and Natural Resources, University of Mohaghegh Ardabili, Ardabil 56199-36514, Iran
4
Department of Agricultural Engineering, Zagazig University, Zagazig 44519, Egypt
5
Agricultural Engineering Department, Faculty of Agriculture, Kafrelsheikh University, Kafrelsheikh 33516, Egypt
6
Agricultural Engineering Research Institute (AEnRI), Agricultural Research Center (ARC), Giza 12611, Egypt
*
Author to whom correspondence should be addressed.
Agriculture 2021, 11(11), 1043; https://doi.org/10.3390/agriculture11111043
Submission received: 24 September 2021 / Revised: 17 October 2021 / Accepted: 22 October 2021 / Published: 23 October 2021
(This article belongs to the Section Agricultural Technology)

Abstract

:
This study aimed to evaluate the ability of the response surface methodology (RSM) approach to predict the tractive performance of an agricultural tractor during semi-deep tillage operations. The studied parameters of tractor performance, including slippage (S), drawbar power (DP) and traction efficiency (TE), were affected by two different types of tillage tool (paraplow and subsoiler), three different levels of operating depth (30, 40 and 50 cm), and four different levels of forward speed (1.8, 2.3, 2.9 and 3.5 km h−1). Tractors drove a vertical load at two levels (225 kg and no weight) in four replications, forming a total of 192 datapoints. Field test results showed that all variables except vertical load, and different combinations of this and other variables, were effective for the S, DP and TE. Increments in speed and depth resulted in an increase and decrease in S and TE, respectively. Additionally, the RSM approach displayed changes in slippage, drawbar power and traction efficiency, resulting from alterations in tine type, depth, speed and vertical load at 3D views, with high accuracy due to the graph’s surfaces, with many small pixels. The RSM model predicted the slippage as 6.75%, drawbar power as 2.23 kW and traction efficiency as 82.91% at the optimal state for the paraplow tine, with an operating depth of 30 cm, forward speed of 2.07 km h−1 and a vertical load of 0.01 kg.

1. Introduction

Using subsoiler tines during semi-deep operations up to a depth of 50 cm is common in conservation tillage for row crop-planting. The pulling of these implements, especially multi-tine ones, will be a challenge for agricultural tractors and needs a high-power range and drawbar work. The most important factor in drawbar work is energy waste (from 20% to 55%) during interactions between soil and tractor wheels [1]. This interaction is affected by several factors, which are described in more detail by Battiato and Diserens [2]. Nevertheless, some parameters, for instance, tire inflation pressures using new tires with high lugs and added weight that affects the slippage, are regarded as the most crucial parameters for drive wheels’ performance [3,4,5]. Checking the tire inflation pressure and using new tires are recommended for all farmers, but the addition or removal of weights to different parts of the tractor, with the aim of slippage reduction, is not easily managed, especially in the farm during tillage.
For a better assessment of a tractor during tests, it is essential to measure the parameters related to its tractive performance, especially slippage, drawbar power and traction efficiency, using instrumentation systems [6,7]. The obtained data can be used to model the system’s way of predicting the studied parameters under the same conditions [2]. Prediction methods are divided into three major groups: regression equations, mathematical equations and computer software models [8]. Computer models and simulation programs help researchers to predict different parameters, saving the costs and time associated with field tests. The response surface methodology (RSM) considers a new computer modeling instrument, which is commonly used to achieve optimized conditions in various processes [9]. Furthermore, it can be used to gather sufficient data for mathematical analysis [10]. The RSM would be used in the agriculture sector to investigate the impacts of numerous factors and their interactions on output variables [11]. The influence of different working parameters on the hydraulic performance of a water-powered proportional injector was investigated using response surface methods [12], where three key parameters of inlet and injection flow rate were researched using a one-factor experimental design method. The regression equations used to find the different factors and response variables were established through a response surface method based on a one-factor experiment. Jiang et al. [13] were able to optimize the working performance of a boat-type tractor using a central composite rotatable design and response surface method. However, there are few studies concerning RSM applications for the modeling and optimization of the performance parameters of agricultural tractors. Considering the previous issues, the aim of the current study was to measure the slippage, drawbar power and efficiency of the traction of a Massey Ferguson tractor (MF285) during semi-deep tillage of up to 50 cm, and to predict the same parameter values using regression equations. An RSM approach was used to find the optimal work conditions under the influence of tine, depth, speed and vertical load.

2. Materials and Methods

2.1. Measuring Unit

The measuring unit comprised an agricultural dynamometer (a high-accuracy, adjustable, three-point hitch dynamometer with a draft capacity of 50 kN and two linkage frames mounted between tractor links and the implement. The dynamometer was developed in Urmia University, Iran to measure forces on the tractor and mounted implements using force-sensing elements comprised of a loadcell and installed between the frames), an additional wheel as a 5th wheel and a data-attainment system. The tillage tines’ draft force was measured by a dynamometer. A frame type three-point hitch facility was attached between the implement frame and the tractor, as shown in Figure 1. The facility was similar to one introduced by Kheiralla et al. [14] and built by Abbaspour-Gilandeh and Haghighat-Shishvan [15]. A supplementary wheel was installed on the right side of the tractor frame as a 5th wheel to measure the actual forward speed with a range from 1.8 to 3.5 km h−1, as shown in Figure 1. The full description of the 5th wheel can be found in Askari and Abbaspour-Gilandeh [8]. Furthermore, the tillage depth was adjusted using tractor three-point hitch linkages and different colored lines on the tines’ body.

2.2. Data Attainment System
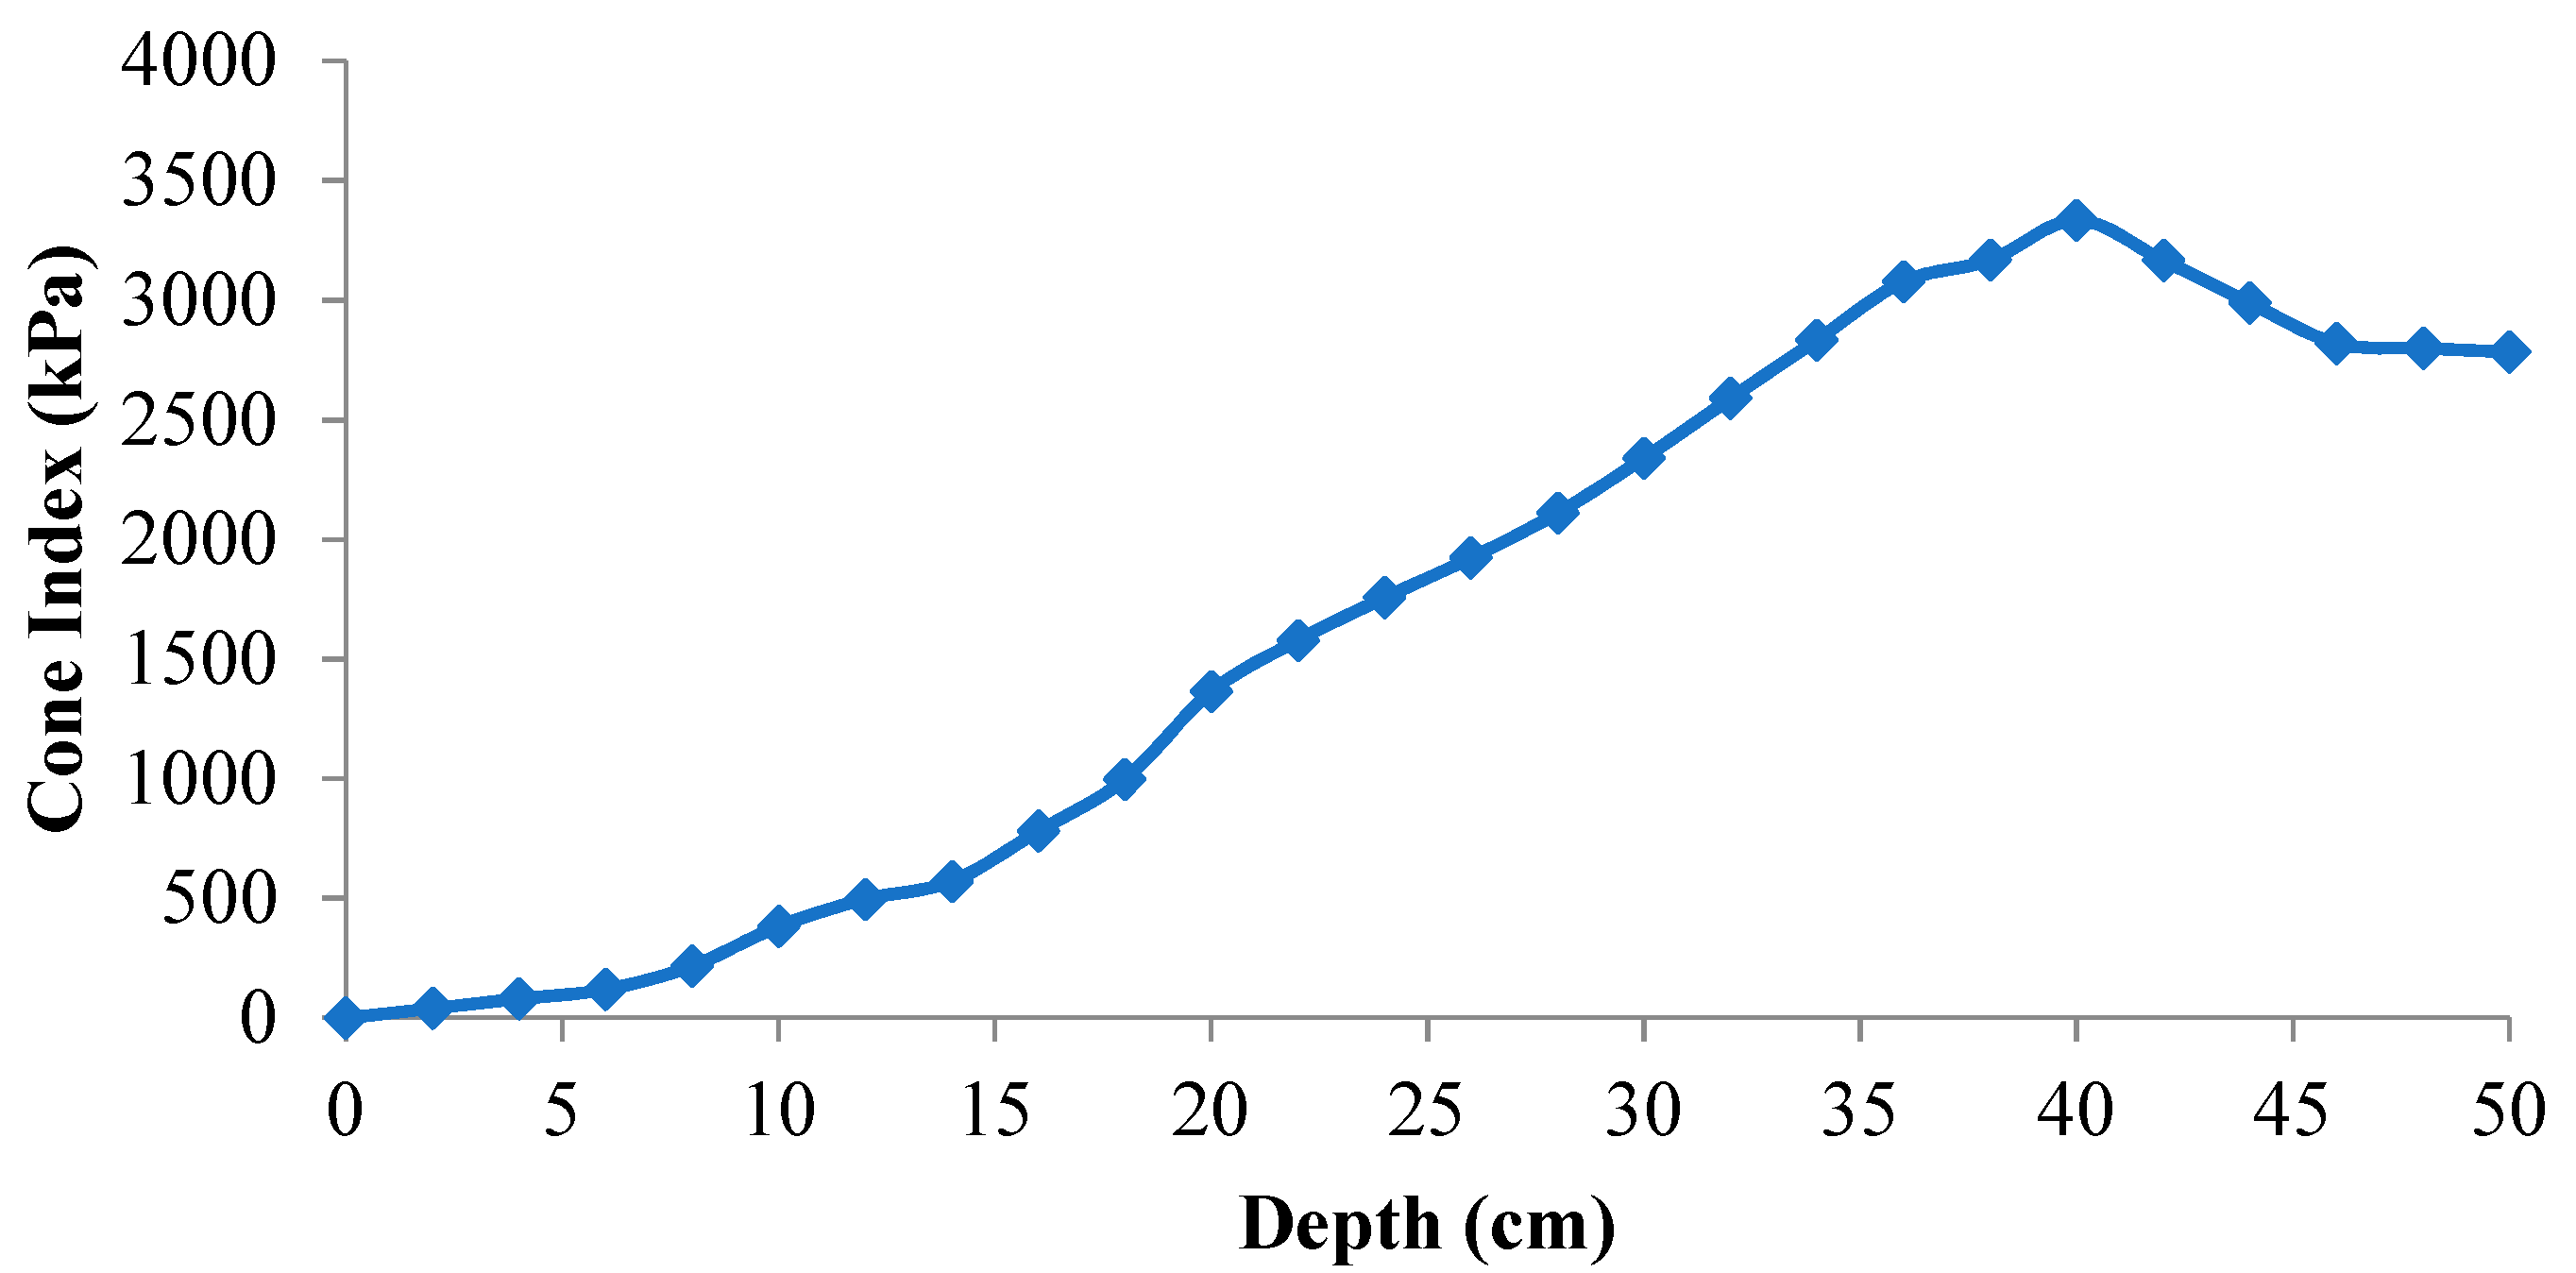
The output signals of the dynamometer were transferred to a programmable DT800 data logger with 12 analog channels and 16 digital channels that works through direct current with a voltage range of 12–24 V. It was adjusted to record the dynamometer signals at a frequency of 5 Hz (DT-800-Data Taker Co, Sydney, NSW, Australia) and then with a laptop. The data logger and the laptop were powered via a supplemental battery with a 12 V direct current and were carried in the cabin of the used tractor.

2.3. Field Trials

The field trials were implemented at the Mohaghegh Ardabili University research farm (48°17′35″ E, longitude; 38°12′40″ N, latitude; and 1410 m height) in northwest Iran. The field had a 4% slope and was not tilled before. The two tine types (subsoiler and paraplow) plus a 56 kW tractor (Massey Fergusson, 2WD connected to an electric generator to stabilize the engine speed) were applied in the field tests. The tractor used in the experiments was a mechanical-hydraulic-based steering system tractor with rotary injector pump and fuel tank capacity of 90 L. The tractor’s lifting capacity ranged up to 2227 kg and engine speed ranged up to 2000 rpm with a liquid-cooled system. Front tire size, rear tire size, front weight and rear weight were 31.5–61 in, 46.7–76 cm, 1420 kg, and 1694 kg, respectively. Tests were arranged at three different depths of 30, 40 and 50 cm, four different forward speeds of 1.8, 2.3, 2.9 and 3.5 km h−1, two vertical loads of 225 kg and no weight, plus four replications for each treatment. Tractor engine rpm was constant at 1600. The experimental area was divided into four main blocks, to execute 192 treatments in a randomized complete block design. Each main block was divided into 48 plots; every plot had a length of 20 m and a width of 2 m. After executing the tests and transferring the data to the laptop, the mean values were calculated from the individual measurements logged during the interval needed to travel a distance of 20 m. Beforehand, the dynamometer was calibrated, and the results revealed a high correlation between the required draft and dynamometer output in kN (R2 = 0.9806). Cone index, soil moisture content, soil structure, bulk density, organic matter, electrical conductivity (EC) and pH are the main soil properties that must be reported during tillage, according to the recommendation of Upadhyaya [16] and Upadhyaya et al. [17]. A RIMIK digital penetrometer (CP20, Waurn Ponds, VIC, Australia) ranging up to 7500 kPa at a resolution of approximately 50 kPa, with a tip cone angle of 30° at standard bar, was utilized to measure the cone index of field soil. According to ASAE Standards S313.2 [18], soil was penetrated with 0.02 m/s constant speed. The soil cone index was measured at 20 points over the 0–50 cm depth range immediately before the tests, and the results are shown in Figure 2. Figure 2 reveals that, at a depth of about 40 cm, there was a hardpan. Soil moisture content was measured in 2 ranges of soil depth (0–25 and 25–50 cm). Soil samples were weighed, oven-dried at 105 °C for 24 h and weighed again. The soil texture of the field was sandy loam, and it was measured based on the particle size analysis and distribution of the soil [19]. The bulk density of the soil was determined using intact core samplers to collect a known volume of soil, and this was calculated as the oven-dry mass of the soil divided by the core volume. Organic matter was determined by measuring the weight lost by an oven-dried (105 °C) soil sample when heated to 400 °C. EC is measured with a conductivity meter, standardized with a salt solution. pH was measured by a GroLine—HI98168 portable soil pH meter with pH range from 2.00 to 20.00 and ±0.1 pH accuracy (Hanna Instruments, Keysborough, VIC 3173, Australia). The data obtained from field soil analysis are presented in Table 1.
Two different parameters, in terms of draft force and forward speed, were directly measured in the field experiments. Three parameters—drawbar power, traction efficiency and slippage—must be calculated based on the ASABE standards [20]. Equations (1)–(3), in order, were used to calculate the drawbar power, traction efficiency and wheel slippage, as follows:
D P = D × V a  
where DP—drawbar power (kW); D—draft (kN); Va—the actual tractor speed during the operation in the field (m s−1)
T E = ( 1 S )   N T G T
where TE—traction efficiency; S—slippage; NT—net traction; GT—gross traction. The net traction (NT) or drawbar pull is the pulling force produced by the gross traction (GT) after taking the motion resistance forces acting on the wheel into account, where the rolling resistance (motion resistance) of a wheel is equal to the difference between GT and NT, as determined in ASABE standards [21].
% S = 100   ( 1 ( V a V o ) )
where S—slippage; Va—the actual speed of the loaded tractor in the field (km h−1); Vo—speed of the tractor without load on the surface of concrete (km h−1)
Changes in vertical load were carried out by adding or removing rear wheel ring weights. The weights were standard ones with 112.5 kg and 225 kg mass. There was no ring weight in 96 treatments and the remaining weights were added. For each tine, a separate regression model was developed to predict the slippage, drawbar power and traction efficiency of the tractor-implement system using the field data and SPSS software version 16 (SPSS Inc., Chicago, IL, USA). The obtained models were compared with the data in the field to assess their accuracy.

2.4. RSM Approach

RSM, as a multivariate statistical tool with graphical representation, offers a new approach to investigate the effect of input factors on output factors. This was used to examine the interactive effects of current study variables and their consequent effects on response. In RSM, the optimization of process variables comprised seven different steps. The steps include: (1) selection of response (slippage, drawbar power and traction efficiency); (2) selection of variables and assigning codes to them; (3) development of experimental design for slippage, drawbar power and traction efficiency; (4) regression analysis; (5) formation of a quadratic polynomial, i.e., response development; (6) developing 3D surface of the observed response surface; (7) analysis of optimal operating conditions. The RSM approach investigates the effect of input factors on output factors. Design-Expert software version of 7.0.0 (2007, Stat-Ease Co., Minneapolis, MN, USA) was used to design and analyze field data. The following quadratic equation, according to Khuri and Cornell [22], with multiple linear regression analysis, was used to appraise the numerical models governing the inputs (including tine, speed, depth and vertical load) and outputs (including slippage, drawbar power and traction efficiency):
Y = C 0 + i = 1 m C i Z i + i = 1 m C i i Z i 2 + i = 1 m   j = i + 1 m 1 C i j Z i Z j   + e
where Y is the predicted response (output factor), C0 is the intercept or regression coefficient, Ci represents the linear coefficient of the parameters, Cii is the second-order interaction coefficient, Cij is the second-order coefficient, and Zi and Zj are the independent encoded variables. In addition, m and e parameters are the input factors’ number and the random error term, respectively.
Regarding the RSM, to assess the relationships between the responses and validate the model, various statistical parameters, i.e., predicted R2, adjusted R2, correlation coefficients of determination (R2) and predicted error sum of squares (PRESS), were used [23]. A suitable model will have a low PRESS and high adjusted and predicted R2. Analysis of variance (ANOVA) was performed for the data. Furthermore, in this model, the significant terms were found by ANOVA and analyzed with a probability level of less than 5% (p < 0.05).

3. Results and Discussion

3.1. Field Data

3.1.1. Influence of Tine, Depth, Speed and Vertical Loads on the Slippage

Table 2 and Figure 3 show the influence of tine type, operating depth, forward speed and ring weights on the tractor slippage. The results showed that tine, speed, depth, ring weights and interaction influence are sufficient for the tractor slippage (p < 0.01). As shown in Figure 3, the maximum slippage percentage was 15.36% and was recorded with a subsoiler tine at the forward speed of 3.5 km h−1, a depth of 50 cm and no ring weights. Further, the minimum slippage percentage was 7.26% and recorded with a paraplow tine at a forward speed of 1.8 km h−1, a depth of 30 cm and in ring-weighted condition. It was obvious that increasing the forward speed increased the slippage [7,24]. The principal reason for the high slippage was a low distance between the front and rear wheels of the MF 285 tractor and low weight. Moreover, drive tires did not have high lugs and were old. These factors led to high slippage, especially at higher speeds. The relationship between the forward speed and slippage at all depths, in all ring-weight conditions and using both tines was linear (R2 > 0.9). The ring weights significantly decreased the slippage of the paraplow tine at a depth of 40 cm, but the decrements in other conditions were not significant.

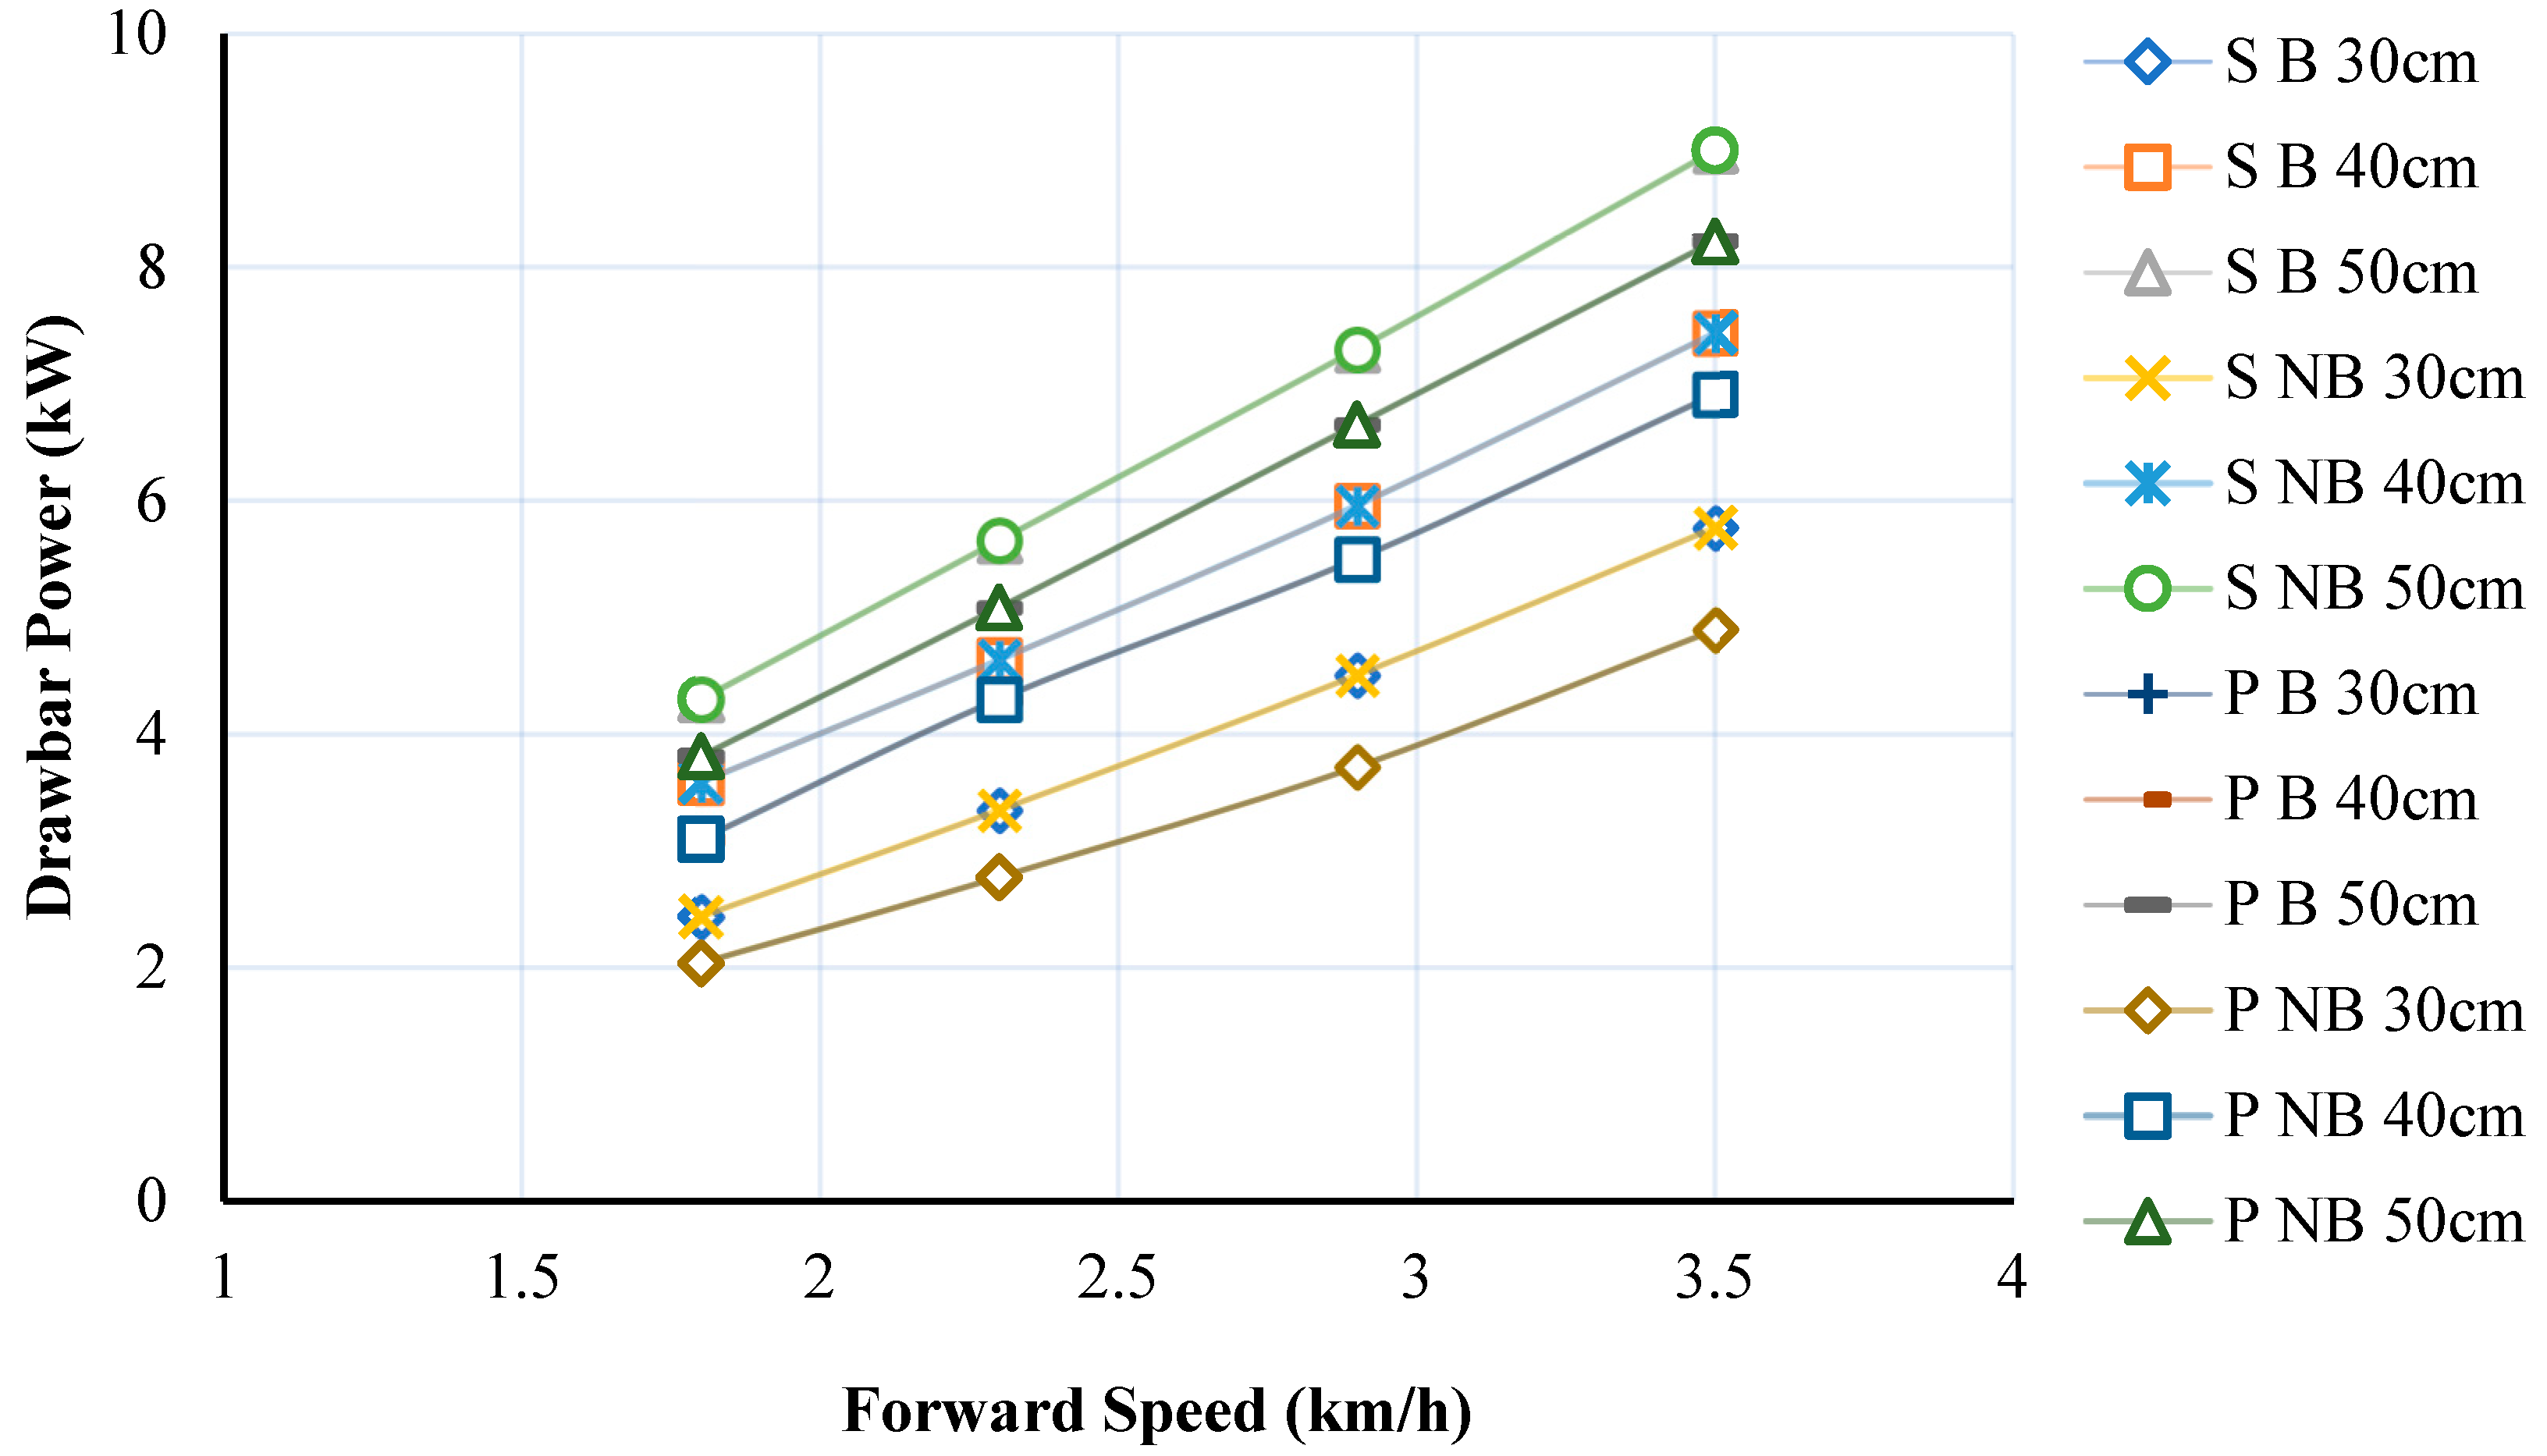
3.1.2. Influence of Tine, Depth, Speed and Ring Weights on the Drawbar Power

The influence of tine type, depth of operation, forward speed and ring weight on the tractor drawbar power is shown in Table 2 and Figure 4. The obtained results revealed that the tine, speed, depth and interaction impact were adequate to test the tractor drawbar power (p < 0.01). Figure 4 indicates that the maximum drawbar power value of 9 kW was recorded with the subsoiler tine at a forward speed of 3.5 km h−1 and a depth of 50 cm, and the minimum drawbar power value of 2 kW was recorded with the paraplow tine at a forward speed of 1.8 km h−1 and depth of 30 cm. There was no difference in drawbar power between ring-weighted and no-ring-weight conditions. Increases in forward speed caused an increment in the drawbar power [7]. The relation between forward speed and drawbar power was linear in all conditions (R2 > 0.99).

3.1.3. Influence of Tine, Depth, Speed and Ring Weights on the Traction Efficiency

Table 2 and Figure 5 show the influence of tine type, depth of operation, forward speed and vertical load on the traction efficiency.
The results showed that tine, speed, depth, and interaction effect were sufficient to test the tractor’s traction efficiency (p < 0.01), but not the vertical load and interaction effect of that with others. The ring weights only had a positive impact on traction efficiency and slippage. Figure 5 reveals a maximum traction efficiency of 85%, recorded with the paraplow tine at a forward speed of 1.8 km h−1 and a depth of 30 cm, and a minimum traction efficiency of 56%, recorded with the subsoiler tine at a forward speed of 3.5 km h−1 and depth of 50 cm. There was no difference in traction efficiency between vertical load and no-load conditions. It was observed that increasing forward speed decreased traction efficiency [7]. The relationship between the forward speed and traction efficiency was linear under all conditions (R2 > 0.95).

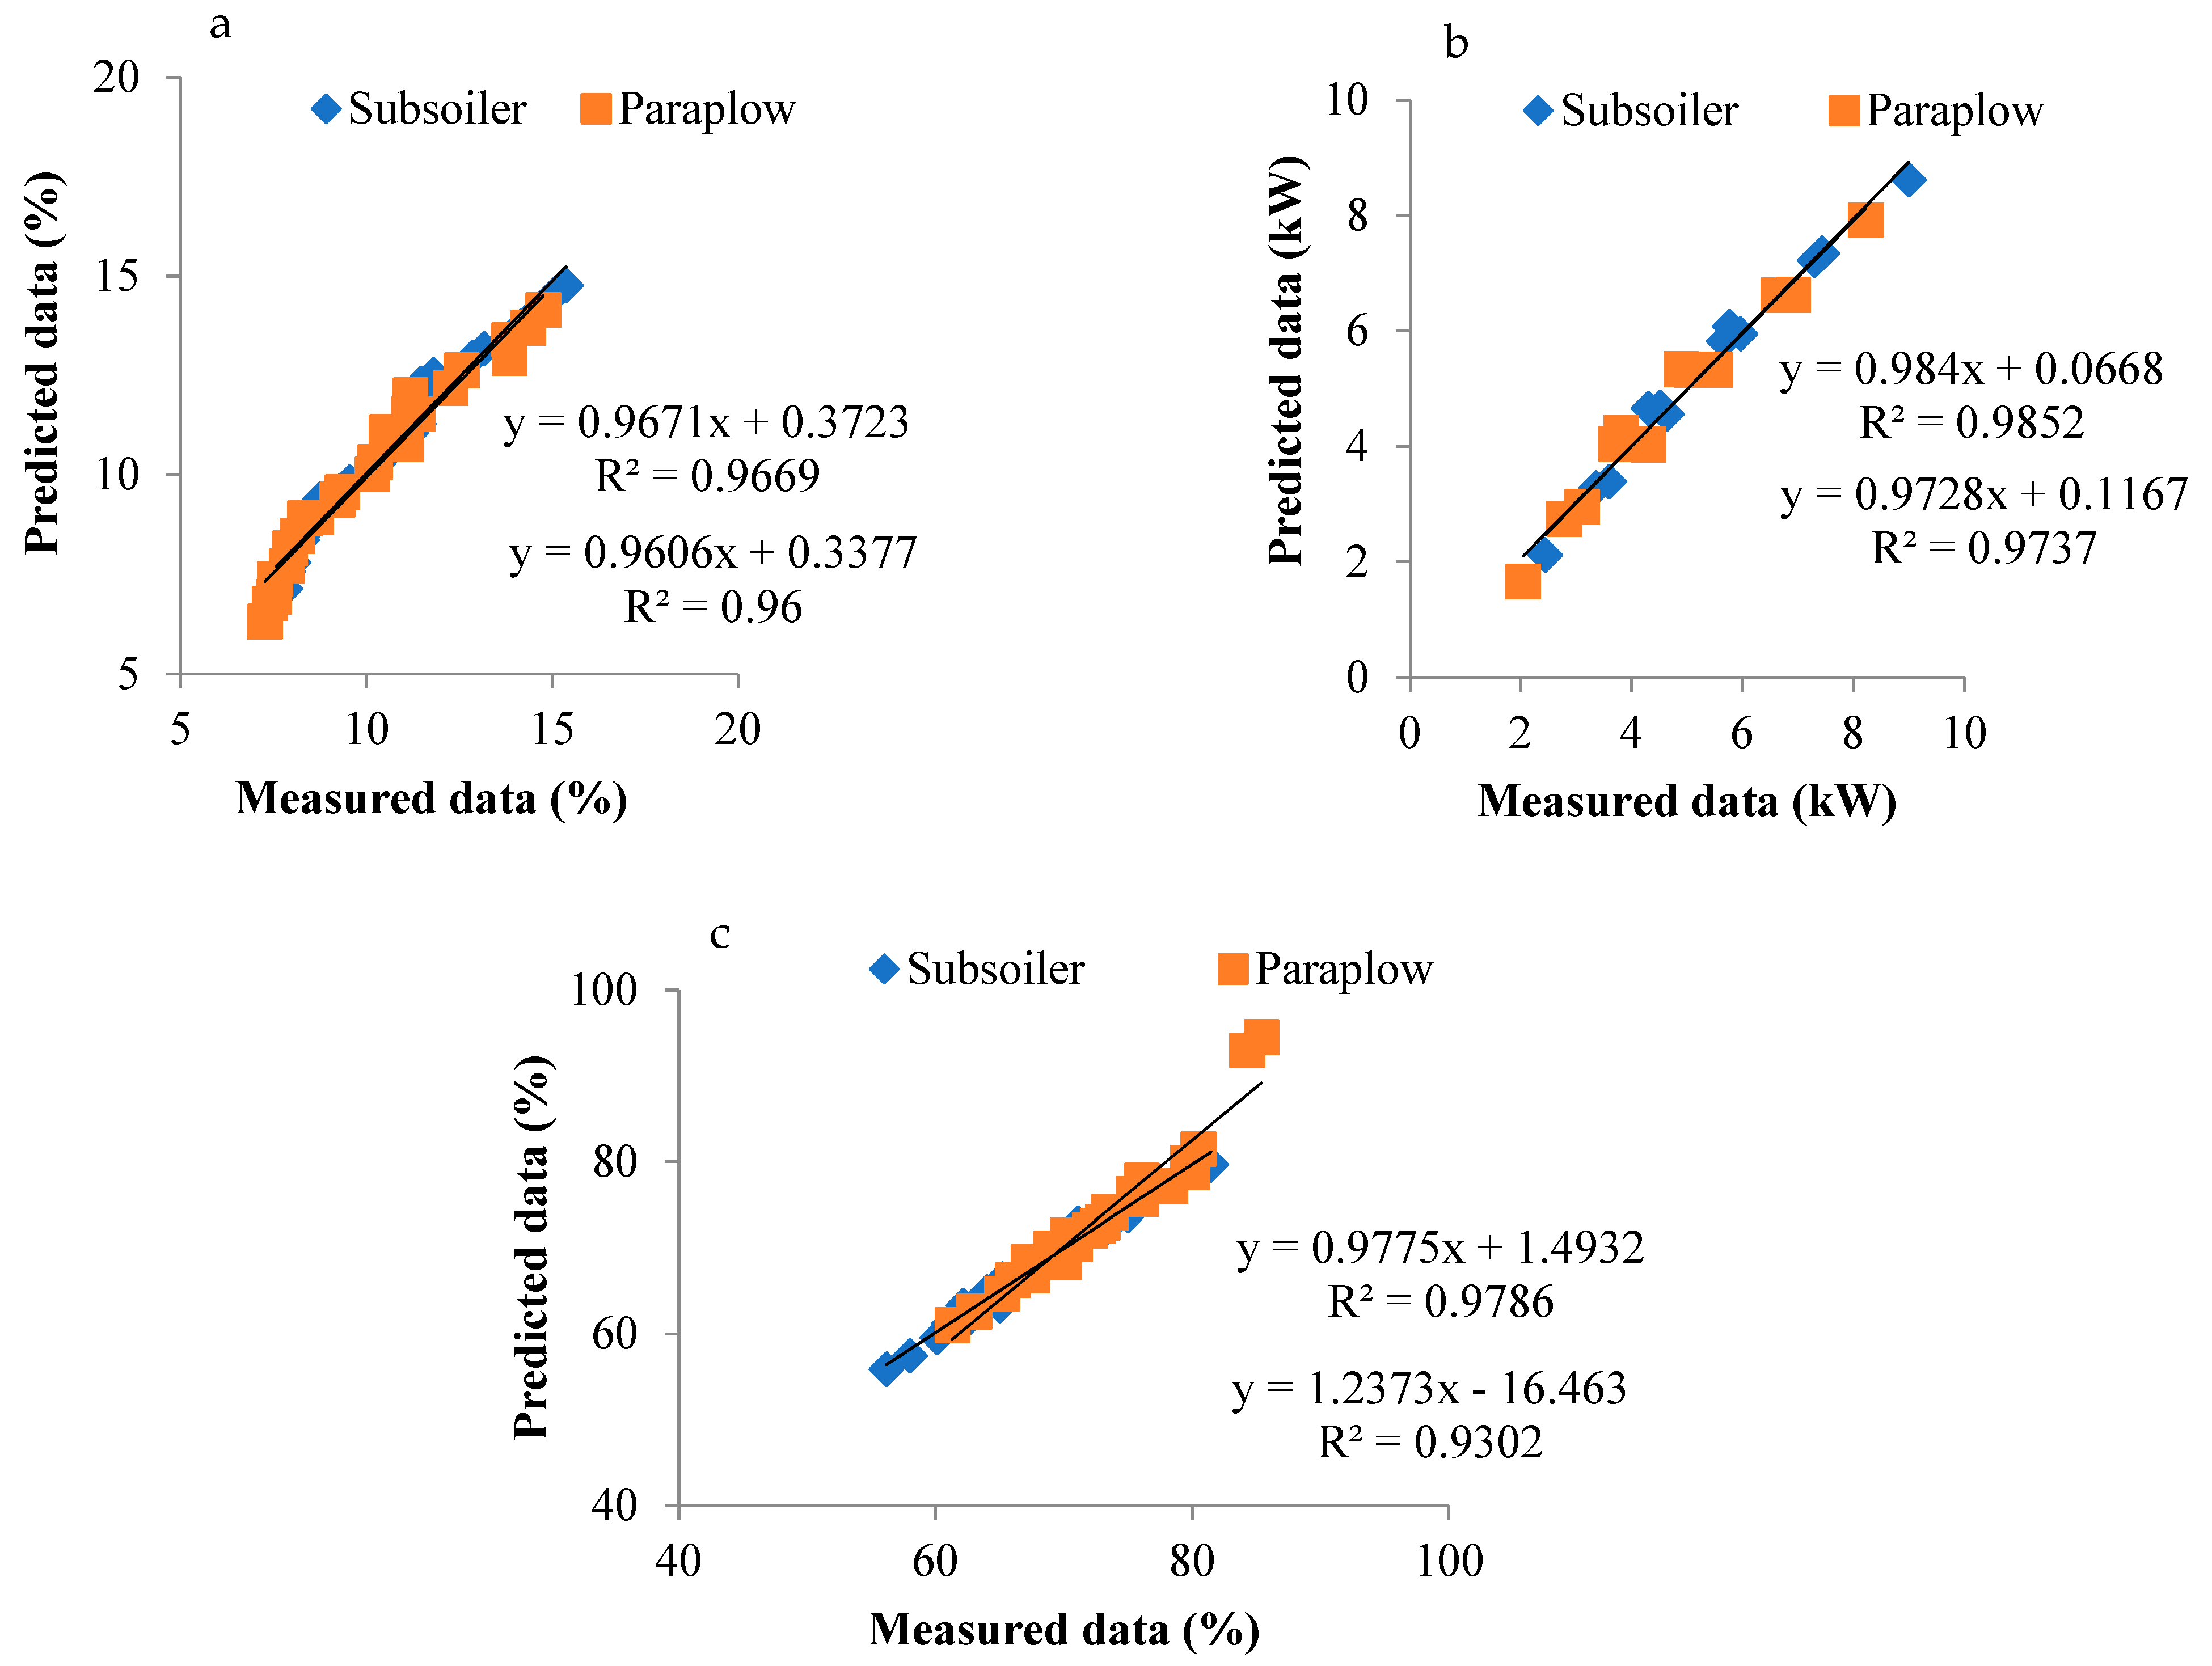
3.2. Regression Models and Accuracy
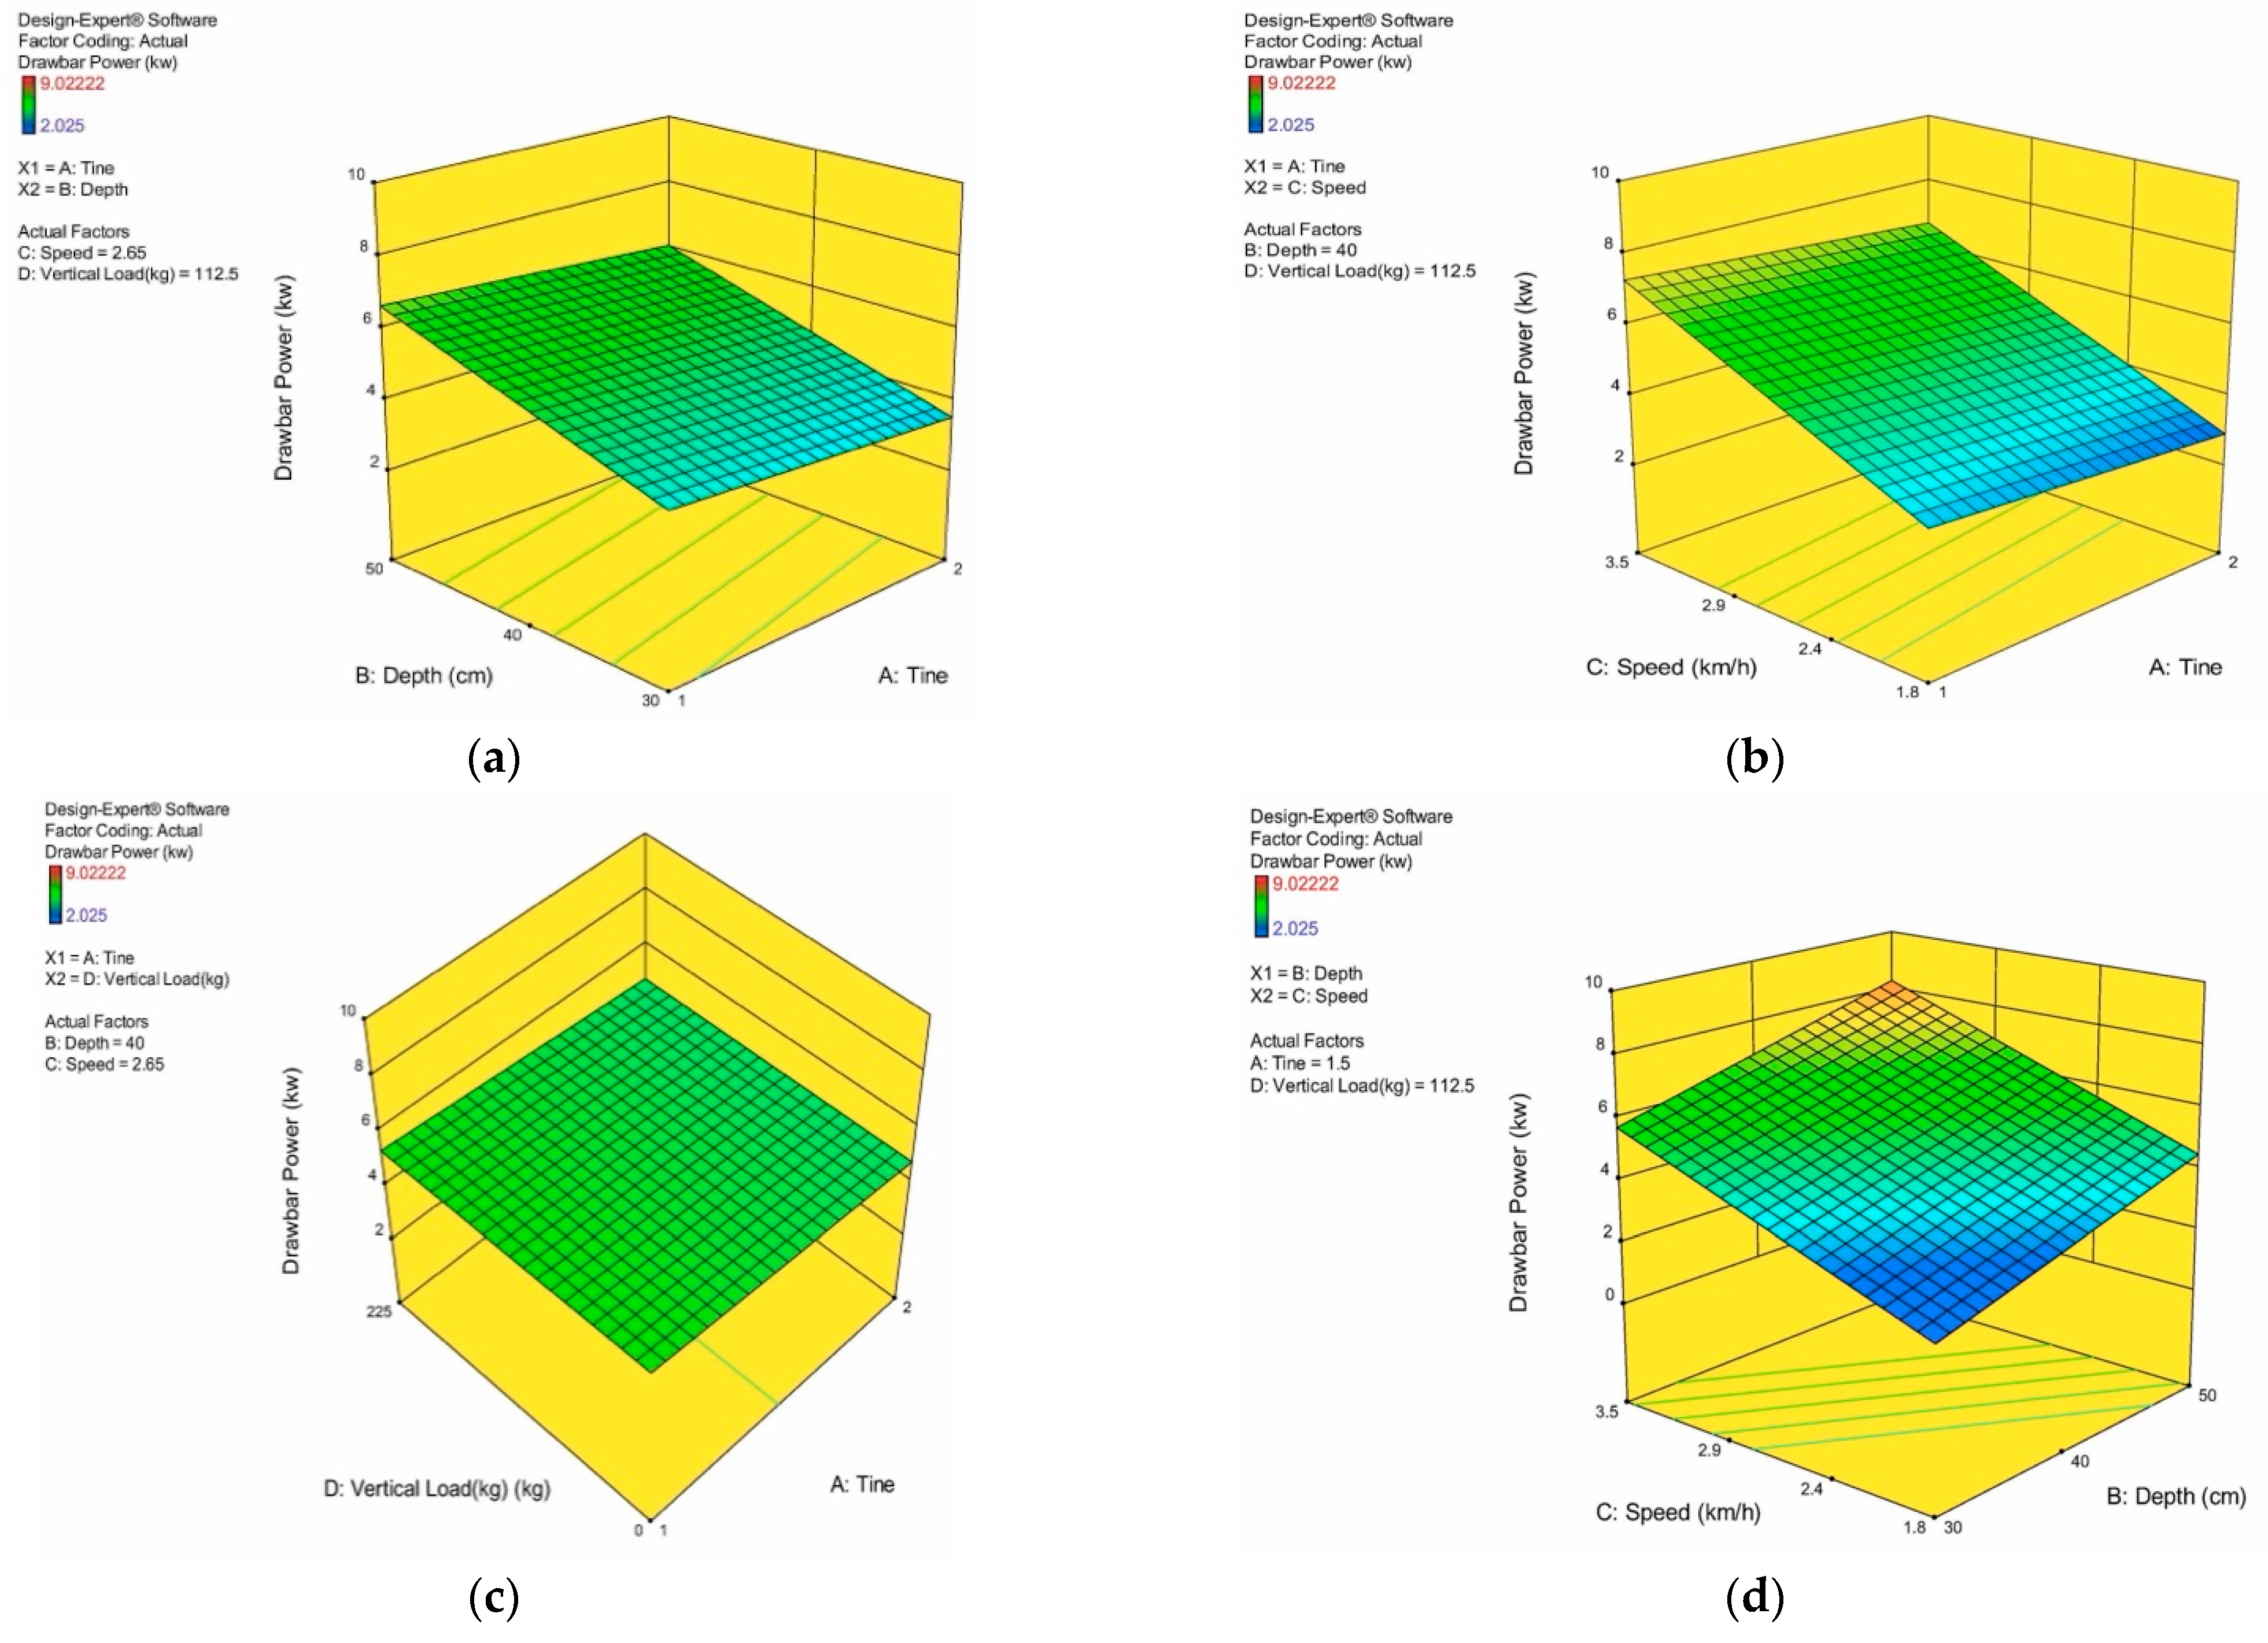
Six multiple-regression models, including the studied parameters (depth, speed and vertical load), were developed to separately predict the studied parameters related to subsoiler and paraplow tines, as shown in Table 3. Most models included speed and depth, but no vertical load. This was due to the low impact of the vertical load on the studied parameters, shown in Table 2. In these models, D represents tillage depth (cm), S represents forward speed (km h−1) and W represents vertical load (0 for no-ring weight condition and 225 kg for ring-weighted condition).
The regression equations were assessed against the obtained data from the field, as shown in Figure 6. This figure shows that the existing models predict the studied parameters, which are dependent on the tested tines with high accuracy (R2 > 0.93).
The highest correlation (R2) was related to the drawbar power prediction model of the subsoiler, at 0.9852, and the lowest correlation was related to the traction efficiency prediction model of the paraplow, at 0.9302 (Figure 6).

3.3. RSM Model

The experiment design was based on the number of treatments entered in the software, and the data that were provided to the software. Then, based on the data in the experiment, the best mathematical model was chosen, 3D surface curves were illustrated and optimized and, finally, the formula was presented. The regression equations for the response variables and R2, predicted R2 and adjusted R2 and values are listed in Table 4. The R2 value must be no less than 0.8 to fit a regression model [25]. The R2 of RSM models regarding slippage, drawbar power and traction efficiency were 0.9638, 0.9792 and 0.9813, respectively. Additionally, the high R2 value illustrated that the regression model suited the data well. Hence, the model could predict the number of studied parameters under the influence of tine type, forward speed, tillage depth and vertical load. Table 4 reveals that the RSM model results in the generation of a nearly flat surface plot, as a linear relationship was suggested and recommended between independent and response variables (slippage, drawbar power and traction efficiency). The models resulting from the backward selection of terms are quadratic even if there is only one quadratic; for this reason, the resulting response surface appears as a single-curvature surface.
The changes in the studied parameters, influenced by tine type, forward speed, depth of operation and vertical load, and obtained with the RSM approach, are depicted in Figure 7, Figure 8 and Figure 9. In these figures, tine 1 and 2 represent subsoiler and paraplow, respectively.
Surveying Figure 7 Figure 8 and Figure 9 shows that RSM graphs had a flat surface. There are small pixels on the surface of the RSM graphs. Accordingly, changes in the input variables and their effects on the slippage, drawbar power and traction efficiency are more locational and visible.

3.4. Optimization Using RSM

Solving the regression equation using the Design-Expert software resulted in the optimized values of the input variables (tine, depth, speed and vertical load) selected for the output variables (slippage, drawbar power and traction efficiency). The optimized state for this step is predicted in Table 5. The RSM model accurately predicted the slippage as 6.75%, drawbar power as 2.23 kW and traction efficiency as 82.91% at the optimum state for the paraplow tine, with a depth of 30 cm, speed of 2.07 km h−1 and vertical load of 0.01 kg. The measured optimal traction efficiency, slippage percentage and drawbar power were 85%, 7.26% and 2 kW, which were comparable to the predicted values with percentage differences of 2.5%, 7.3% and 10.9%, respectively. To verify the model prediction, the optimized state test was performed in triplicate, with no significant differences between the predicted values. Finally, the obtained results revealed that the RSM approach could optimize the tractive performance of an agricultural tractor. The lack of significant effect of vertical load on the studied parameters caused a very low optimized value of 0.010 kg using the RSM approach.

4. Conclusions

Most research on the tractive performance of agricultural tractors has included measuring the traction-related parameters and the development of prediction equations as regression models, and the RSM approach has not been used as a computer model to date. In this study, the response surface methodology (RSM) approach’s ability to predict the tractive performance of an agricultural tractor was assessed during semi-deep tillage. The results revealed that the RSM approach predicted the studied parameters with a similar accuracy to the regression models. The advantage of the RSM approach relative to regression was its output graphs. The RSM approach displayed a change in slippage, drawbar power and traction efficiency, caused by a change in tine, velocity, depth and vertical load at 3D views with high accuracy, due to the graphs’ surface, containing many small pixels. This led to unmeasured inputs (such as depth of 35 cm, velocity of 3.2 km/h and ring weight of 100 kg) and relative output being located. The field data revealed that tine type, depth and velocity were very effective for the studied parameters but vertical load was not. The vertical load, as the ring weight, had a positive effect on the slippage and traction efficiency. This factor negligibly decreased and increased these, respectively. Increases in velocity and depth resulted in increases in slippage and drawbar power but decreases in traction efficiency. This study showed that the RSM model accurately predicted the slippage as 6.75%, drawbar power as 2.23 kW and traction efficiency as 82.91% under optimal conditions using a paraplow tine with a depth of 30 cm, forward velocity of 2.07 km/h and vertical load of 0.01 kg. To optimize the performance of the studied tractor, it is recommended to use a paraplow, heavier ring weights (vertical load), high-lugged new driven tires and middle forward velocity and depth, such as 2.9 km/h and 40 cm, respectively, to increase the drawbar power and traction efficiency and decrease slippage. The RSM approach could be a suitable way of studying the optimal conditions for a multi-variable system. Optimization of the tractive performance of an agricultural tractor during semi-deep tillage operation is essential to increase the drawbar power and traction efficiency, while decreasing slippage. This reduces the energy consumption and leads to less tool wear. Only a specific tractor and one tire type were used to validate the model in this study. In future research, different tractors and tires could be used to further validate the model. On the other hand, investigations of different types and parameters in other field conditions are important to build a widely used model.

Author Contributions

Conceptual idea, A.M.E.S. and M.A.; methodology design, M.O. and Y.A.-G.; data collection, M.A. and Y.A.-G.; data validation, E.T. and M.O.; data analysis and interpretation, A.M.E.S. and R.H.; visualizing software, E.T. and R.H.; original draft preparation, Y.A.-G.; review and editing, M.O. and E.T.; supervision and administration, R.H. and M.O. All authors have read and agreed to the published version of the manuscript.

Funding

Field trails in this work was supported by University of Mohaghegh Ardabili under postdoctoral research project number 1675.

Institutional Review Board Statement

Not applicable.

Informed Consent Statement

Not applicable.

Data Availability Statement

The datasets used and/or analyzed during the current study are available from the corresponding author on reasonable request.

Conflicts of Interest

The authors declare no conflict of interest.

References

  1. Šmerda, T.; Čupera, J. Tire inflation and its influence on drawbar characteristics and performance-energetic indicators of a tractor set. J. Terramech. 2010, 47, 395–400. [Google Scholar] [CrossRef]
  2. Battiato, A.; Diserens, E. Influence of tyre inflation pressure and wheel load on the traction performance of a 65 kW MFWD tractor on a cohesive soil. J. Agric. Sci. 2013, 5, 197–215. [Google Scholar] [CrossRef]
  3. Lee, J.H.; Gard, K. Vehicle-soil interaction: Testing, modeling, calibration and validation. J. Terramech. 2014, 52, 9–21. [Google Scholar] [CrossRef]
  4. Taghavifar, H.; Mardani, A. On the modeling of energy efficiency indices of agricultural tractor driving wheels applying adaptive neuro-fuzzy inference system. J. Terramech. 2014, 56, 37–47. [Google Scholar] [CrossRef]
  5. Janulevicius, A.; Damanauskas, V. How to select air pressures in the tires of MFWD (mechanical front-wheel drive) tractor to minimize fuel consumption for the case of reasonable wheel slip. Energy 2015, 90, 691–700. [Google Scholar] [CrossRef]
  6. Zoz, F.M.; Grisso, R.D. Traction and Tractor Performance; ASAE Distinguished Lecture Series No. 27; ASAE: St Joseph, MI, USA, 2003. [Google Scholar]
  7. Ranjbarian, S.; Askari, M.; Jannatkhah, J. Performance of tractor and tillage implements in clay soil. J. Saudi Soc. Agric. Sci. 2017, 16, 154–162. [Google Scholar] [CrossRef] [Green Version]
  8. Askari, M.; Abbaspour-Gilandeh, Y. Assessment of adaptive neuro-fuzzy inference system and response surface methodology approaches in draft force prediction of subsoiling tines. Soil Tillage Res. 2019, 194, 104338. [Google Scholar] [CrossRef]
  9. Karuppaiya, M.; Sasikumar, E.; Viruthagiri, T.; Vijayagopal, V. Optimization of process variables using response surface methodology (RSM) for ethanol production from cashew apple juice by Saccharomycescerevisiae. Asian J. Food Agro-Ind. 2010, 3, 462–473. [Google Scholar]
  10. Betiku, E.; Adesina, O.A. Optimization of sweet potato starch hydrolyzate production and its potential utilization as substrate for citric acid production. Br. Biotechnol. J. 2013, 3, 169–182. [Google Scholar] [CrossRef]
  11. Managamuri, U.; Vijayalakshm, V.; Poda, S.; Gandur, V.S.; Babu, R.S. Optimization of culture conditions by response surface methodology and unstructured kinetic modeling for bioactive metabolite production by Nocardiopsis litoralisVSM-8. 3 Biotech 2016, 6, 219–231. [Google Scholar] [CrossRef] [PubMed] [Green Version]
  12. Tang, P.; Chen, C.; Li, H. Investigation of Hydraulic Performance Based on Response Surface Methodology for an Agricultural Chemigation Proportional Injector. Water 2020, 12, 3155. [Google Scholar] [CrossRef]
  13. Jiang, Q.; He, Z.; Wang, Y.; Wang, J. Optimizing the working performance of a boat-type tractor using central composite rotatable design and response surface method. Comput. Electron. Agric. 2021, 181, 105944. [Google Scholar] [CrossRef]
  14. Kheiralla, A.F. Modeling of power and energy forces for tillage implements operating in Serdang sandy clay loam, Malaysia. Soil Tillage Res. 2003, 78, 21–34. [Google Scholar] [CrossRef]
  15. Abbaspour-Gilandeh, Y.; Haghighat-Shishvan, S. Extended octagonal ring transducers for measurement of tractor-implement force. Instrum. Exp. Tech. 2011, 54, 137–141. [Google Scholar] [CrossRef]
  16. Upadhyaya, S.K.; Collins, N.E.; Kemble, L.J.; Williams, T.H. Energy requirement for chiseling in coastal plain soils. Trans. ASAE 1984, 27, 1643–11649. [Google Scholar] [CrossRef]
  17. Upadhyaya, S.K.; Ma, T.X.; Chancellor, W.J.; Zhao, Y.M. Dynamics of soil-tool interaction. Soil Tillage Res. 1987, 9, 187–206. [Google Scholar] [CrossRef]
  18. ASABE Standard. Soil Cone Penetrometer; ASABE Standard No. S313.3 (R2013); American Society of Agricultural and Biological Engineers: St. Joseph, MI, USA, 1999. [Google Scholar]
  19. McKenzie, N.J.; Jacquier, D.; Isbell, R.F.; Brown, K. Australian Soils and Landscapes: An Illustrated Compendium; CSIRO Publishing, CSIRO, Research Way: Clayton, VIC, Australia, 2004. [Google Scholar] [CrossRef]
  20. ASABE Standard. Agricultural Machinery Management Data Standard; ASABE Standard No. D497.7 (R2020); American Society of Agricultural and Biological Engineers: St. Joseph, MI, USA, 2011. [Google Scholar]
  21. ASABE Standard. General Terminology for Traction of Agricultural Traction and Transport Devices and Vehicles; ASABE Standard No. S296.5 (R2018); American Society of Agricultural and Biological Engineers: St. Joseph, MI, USA, 2003. [Google Scholar]
  22. Khuri, A.I.; Cornell, J.A. Response Surfaces: Designs and Analyses; CRC Press: New York, NY, USA, 1987. [Google Scholar]
  23. Xie, Y.; Chen, L.; Liu, R. Oxidation of AOX and organic compounds in pharmaceutical wastewater in RSM-optimized-Fenton system. Chemosphere 2016, 155, 217–224. [Google Scholar] [CrossRef] [PubMed]
  24. Askari, M.; Shahgholi, G.; Abbaspour-Gilandeh, Y.; Tash-Shamsabadi, H. The effect of new wings on subsoiler performance. Appl. Eng. Agric. 2016, 32, 1–10. [Google Scholar] [CrossRef]
  25. Danbaba, N.; Nkama, I.; Badau, M.H.; Ukwungwu, M.N.; Maji, A.T.; Abo, M.E.; Hauwawu, H.; Fati, K.I.; Oko, A.O. Optimization of rice parboiling process for optimum head rice yield: A response surface methodology (RSM) approach. Int. J. Agric. For. 2014, 4, 154–165. [Google Scholar]
Figure 1. The instrumentation used in the tests.
Agriculture 11 01043 g001
Figure 2. Results of soil cone index.
Agriculture 11 01043 g002
Figure 3. The relationship between speed, depth, ring weights and slippage using the studied tines (S-Subsoiler, P—Paraplow, B—225 kg vertical load, NB—No load).
Agriculture 11 01043 g003
Figure 4. The relationship between speed, depth, vertical load and drawbar power at studied tines (S—Subsoiler; P—Paraplow; B—225 kg vertical load; NB—No load).
Agriculture 11 01043 g004
Figure 5. The relationship between speed, depth, vertical load and traction efficiency using studied tines (S—Subsoiler, P—Paraplow, B—225 kg vertical load, NB—No load).
Agriculture 11 01043 g005
Figure 6. Predicted data regarding the measured data in the field trials as follows: (a)—slippage, (b)—drawbar power, (c)—traction efficiency.
Agriculture 11 01043 g006
Figure 7. 3D surface curves of slippage as influenced by interactions between input parameters using the RSM approach; (a) tine and depth, (b) tine and speed, (c) tine and vertical load, (d) depth and speed, (e) depth and vertical load, and (f) speed and vertical load.
Agriculture 11 01043 g007aAgriculture 11 01043 g007b
Figure 8. 3D surface curves of drawbar power as influenced by interactions between input parameters using the RSM approach; (a) tine and depth, (b) tine and speed, (c) tine and vertical load, (d) depth and speed, (e) depth and vertical load, (f) speed and vertical load.
Agriculture 11 01043 g008aAgriculture 11 01043 g008b
Figure 9. 3D surface curves of traction efficiency as influenced by interactions between input parameters using the RSM approach; (a) tine and depth, (b) tine and speed, (c) tine and vertical load, (d) depth and speed, (e) speed and vertical load.
Agriculture 11 01043 g009aAgriculture 11 01043 g009b
Table 1. Data obtained from field soil analysis.
PropertyValue
Organic matter0.5%
pH7.1
Electrical conductivity (EC)0.41 dS m−1
Dry bulk density1230 kg m−3
Soil moisture content (db) (0–25 cm)9.3%
Soil moisture content (db) (25–50 cm)10.8%
Table 2. Analysis of variance (ANOVA) of tine, depth, speed and vertical load (ring weight) on the parameters of this study (drawbar power, traction efficiency and slippage).
Source of VariationDegree of FreedomMean Square
ABC
T113.031 **16.016 **1190.52 **
D2452.78 **106.41 **2172.47 **
S344.47 **131.28 **1002.63 **
W14.29 **29.30 ns121.19 **
T × D20.156 **0.19 **0.098 ns
T × S30.043 **0.18 **0.062 ns
T × W10.133 **0.02 ns0.263 *
D × S65.184 **1.64 **8.01 **
D × W20.544 **0.036 ns3.645 **
S × W30.035 **0.097 ns3.16 **
T × D × S60.015 **0.044 **0.062 ns
T × D × W20.507 **0.033 ns0.131 ns
T × S × W30.036 **0.041 ns0.152 ns
D × S × W60.015 **0.033 ns0.925 **
T × D × S × W60.017 **0.30 ns0.148 *
Error1440.0010.0000.064
Total191
Note: T is tine type, D is depth, S is forward speed, W is vertical load, A is slippage, B is drawbar power, C is traction efficiency. ** indicates high significance (p ≤ 0.01), * indicates significance (p < 0.05), ns indicates not significant.
Table 3. Regression prediction models for studied parameters of tines.
ParameterTineModel
Slippage (%)Subsoiler
Paraplow
–3.309 + 0.269 D + 1.323 S − 0.001 W
–3.364 + 0.262 D + 1.263 S − 0.002 W
Drawbar Power (kW)–5.877 + 0.127 D + 2.327 S
–6.096 + 0.129 D + 2.162 S
Traction Efficiency (%)106.758 − 0.584 D − 6.194 S + 0.007 W
111.303 − 0.577 D − 6.117 S + 0.007 W
Note: D is depth (cm), S is speed (km h−1); W is vertical load (kg).
Table 4. Regression equations of response variables.
Response VariableEquationR2 ValueAdj R2Pred. R2C.V. (%)
Slippage (%)−2.85456 − 0.52104 × Tine + 1.293 × Speed + 1.33 ×10³ × vertical load0.96380.96300.96154.36
Drawbar Power (kW)−5.12 − 0.57763 × Tine + 0.12838 × Depth + 2.24469 × Speed0.97920.97890.97825.25
Traction Efficiency (%)103.14873 + 4.98021 × Tine − 0.58042 × Depth − 6.15519 × Speed0.98130.98100.98031.33
Table 5. Regression equations of response variables.
TineSpeed (km h1)Depth (cm)VL (kg)S (%)DP (kW)TE (%)Desirability
Paraplow2.07730.000.0106.7582.23882.9120.843
Publisher’s Note: MDPI stays neutral with regard to jurisdictional claims in published maps and institutional affiliations.

