Article

Influence of Baltic Agro-Environmental Conditions on Yield and Quality of Fava Bean Crops in Conventional Systems

1
Institute of Horticulture, Graudu iela 1, Ceriņi, Krimūnu pagasts, LV-3701 Dobeles novads, Latvia
2
Norwegian Institute of Bioeconomy Research (NIBIO), P.O. Box 115, N-1431 Ås, Norway
3
NPO Veggies Cultivation, Kesa 60, 50115 Tartu, Estonia
4
Centre for the Research and Technology of Agro-Environmental and Biological Sciences, University of Trás-os-Montes and Alto (UTAD-CITAB), Quinta de Prados, 5000-801 Vila Real, Portugal
5
Laboratory of Phytochemistry and Healthy Foods (LabFAS), Spanish Council for Scientific Research (CEBAS-CSIC), University Campus of Espinardo, nº 25, 30100 Murcia, Spain
*
Author to whom correspondence should be addressed.
Agriculture 2021, 11(11), 1042; https://doi.org/10.3390/agriculture11111042
Submission received: 24 September 2021 / Revised: 16 October 2021 / Accepted: 19 October 2021 / Published: 23 October 2021
(This article belongs to the Section Ecosystem, Environment and Climate Change in Agriculture)

Abstract

:
Fava bean (Vicia faba L.) yields are featured by high variability, influenced by the agro-environmental conditions during the growing seasons. These legume crops are sensitive to hydric and heat stresses. The adaptation depends on the efficiency of specific cultivars to use the available resources to produce biomass. This capacity is determined by the genotype and agronomical management practices. The present work aimed to uncover the influence of Baltic agro-environmental conditions (fava bean cultivar, plant density, climate, and soil features) on yield and protein content. For this, field trials were set under Baltic agro-climatic conditions, in Latvia and Estonia with five commercially available fava bean cultivars, representing broad genetic variation (‘Gloria’, ‘Julia’, ‘Jogeva’, ‘Lielplatones’, and ‘Bauska’). The results evidenced ‘Bauska’, ‘Julia’, and ‘Lielplatones’, as the most productive cultivars in terms of seed yield (4.5, 3.7, and 4.6 t ha−1, respectively) and protein yield (1.39, 1.22, and 1.36 t ha−1, respectively) under Estonian and Latvian agro-climatic conditions. Sowing these specific cultivars at densities of 30–40 seeds m−2 constitutes sustainable management for fava bean production in conventional cropping systems in the Baltic region.

1. Introduction

Increased consumption of legumes in Europe is highly desirable, as a means to improve the sustainability of the agro-food system. Legume crops provide several benefits for soil, the environment, and the overall sustainability of the cropping systems in a crops rotation scheme due to their significant value in improving soil fertility through fixing nitrogen in symbiosis with Rhizobium bacteria [1,2]. Legumes are also featured by high nutritional value and health benefits due to their content of protein of high biological value that, in combination with slowly digested carbohydrates, make them very valuable foods, supplying essential nutrients to humans [2,3].
Besides the dietary benefits associated with legumes, from an agronomical point of view, and specifically concerning fava bean (Vicia faba L.), this has been suggested as a crop with the potential for replacing soybean under the European agro-climatic conditions [1], which nowadays is one of the most challenging issues in Europe [4]. Achieving of this objective would contribute to enhance the competitiveness of the agro-food sector in Europe.
In Europe, fava bean seed and biomass yields are featured by high variability, being influenced by the current changes of the environmental conditions, especially affecting crops during the growing season, closely dependent on the specific characteristics of the diverse cultivars. However, to the present date, the most appropriate growing conditions for fava beans are not fully ascertained, in the diversity of agro-climatic environments, in Europe [2,5]. Thus, the major constraint for fava bean yield identified so far is genotype × environment interaction (G × E), which strongly affects the expression of crucial quantitative and qualitative traits in this legume species [6,7,8]. Another important feature affected by nitrogen and carbon availability is the protein accumulation in seeds [9], which would explain, to some extent, the association of the legume’s quality with environmental conditions. Fava bean is not a sufficiently drought and heat tolerant plant, as it is susceptible to moisture and high-temperature stresses [7]. Taking this into account, fava bean is considered more suitable to be grown under temperate climates [10]. In consequence, the adaptation of fava bean to adverse growing conditions or particular environments depends on the capacity of the species to efficiently use available resources to produce biomass, which is determined by interactions between the genotype and the environmental conditions [6,11].
In Europe, the fava bean of indeterminate type is the grain legume most commonly grown. It displays intensive vegetative growth during the reproductive and pod formation stages, which limits pods/seeds production under unfavorable growing conditions. This fact influences yield variability in diverse environments, especially in drought, since fava bean is considered to be more sensitive to water deficits than some other grain legumes. In this frame, to enhance the current knowledge on the optimal genotypes and environmental conditions for fava bean, additional field trials addressed to assess fava bean cultivars featured by diverse genetic backgrounds and drought tolerance remain essential from the perspective of matching appropriate sowing dates and plants densities, as well as the genotype. This research would help overcome the unfavorable environmental influence on yield and nutritional quality [10,11,12].
Among the diverse factors influencing legume crops’ yield, the sowing rate is critical. The recommended seeding rates span from 36 to 100 germinating seeds per m2, depending on the geographical region and the genotypes used. Interestingly, in the last decade, it has been noticed that plant density has a direct effect on the environmental factors influencing plant growth and yield, especially regarding fava bean [13,14]. This information has allowed retrieving sound evidence on the direct relationship existing between plant density and the crude protein content in the fava bean seeds [15,16]. Sowing rates recommended from research performed in Australia show a broad range of variation—from 70 to 270 kg ha−1, where the optimum number of germinating seeds is determined in the range from 31 to 63 seeds per m2, with an average of 45 germinating seeds per m2 [6]. In trials performed in Jordan seeding rates between 50 and 100 germinating seeds per m2 were tested. The optimum density for the highest yield (1.04 t ha−1) was reported at 100 seeds per m2 [17]. Findings of McVetty et al. in Canada evidenced that no significant difference was found in the yield (2.7 t ha−1) among three seeding rates—75%, 100%, and 125% from the recommended 46 germinating seeds per m2 [18]. Nevertheless, there is a lack of information on local varieties (e.g., of Baltic origin) in comparison to commercial genotypes that merits special attention to contribute to enhancing the sustainability of the agro-food system in Europe.
Accordingly, the present work is aimed at uncovering the best fava bean cultivars and clarifying the influence of plant density on the yield and protein content of five genotypes (‘Gloria’, ‘Julia’, ‘Jogeva’, ‘Lielplatones’, and ‘Bauska’) selected on the base of their genetic diversity. To achieve this objective, field trials were established, under conventional conditions, in two consecutive growing seasons (2015 and 2016), in two locations of northern Europe (Latvia and Estonia).

2. Materials and Methods

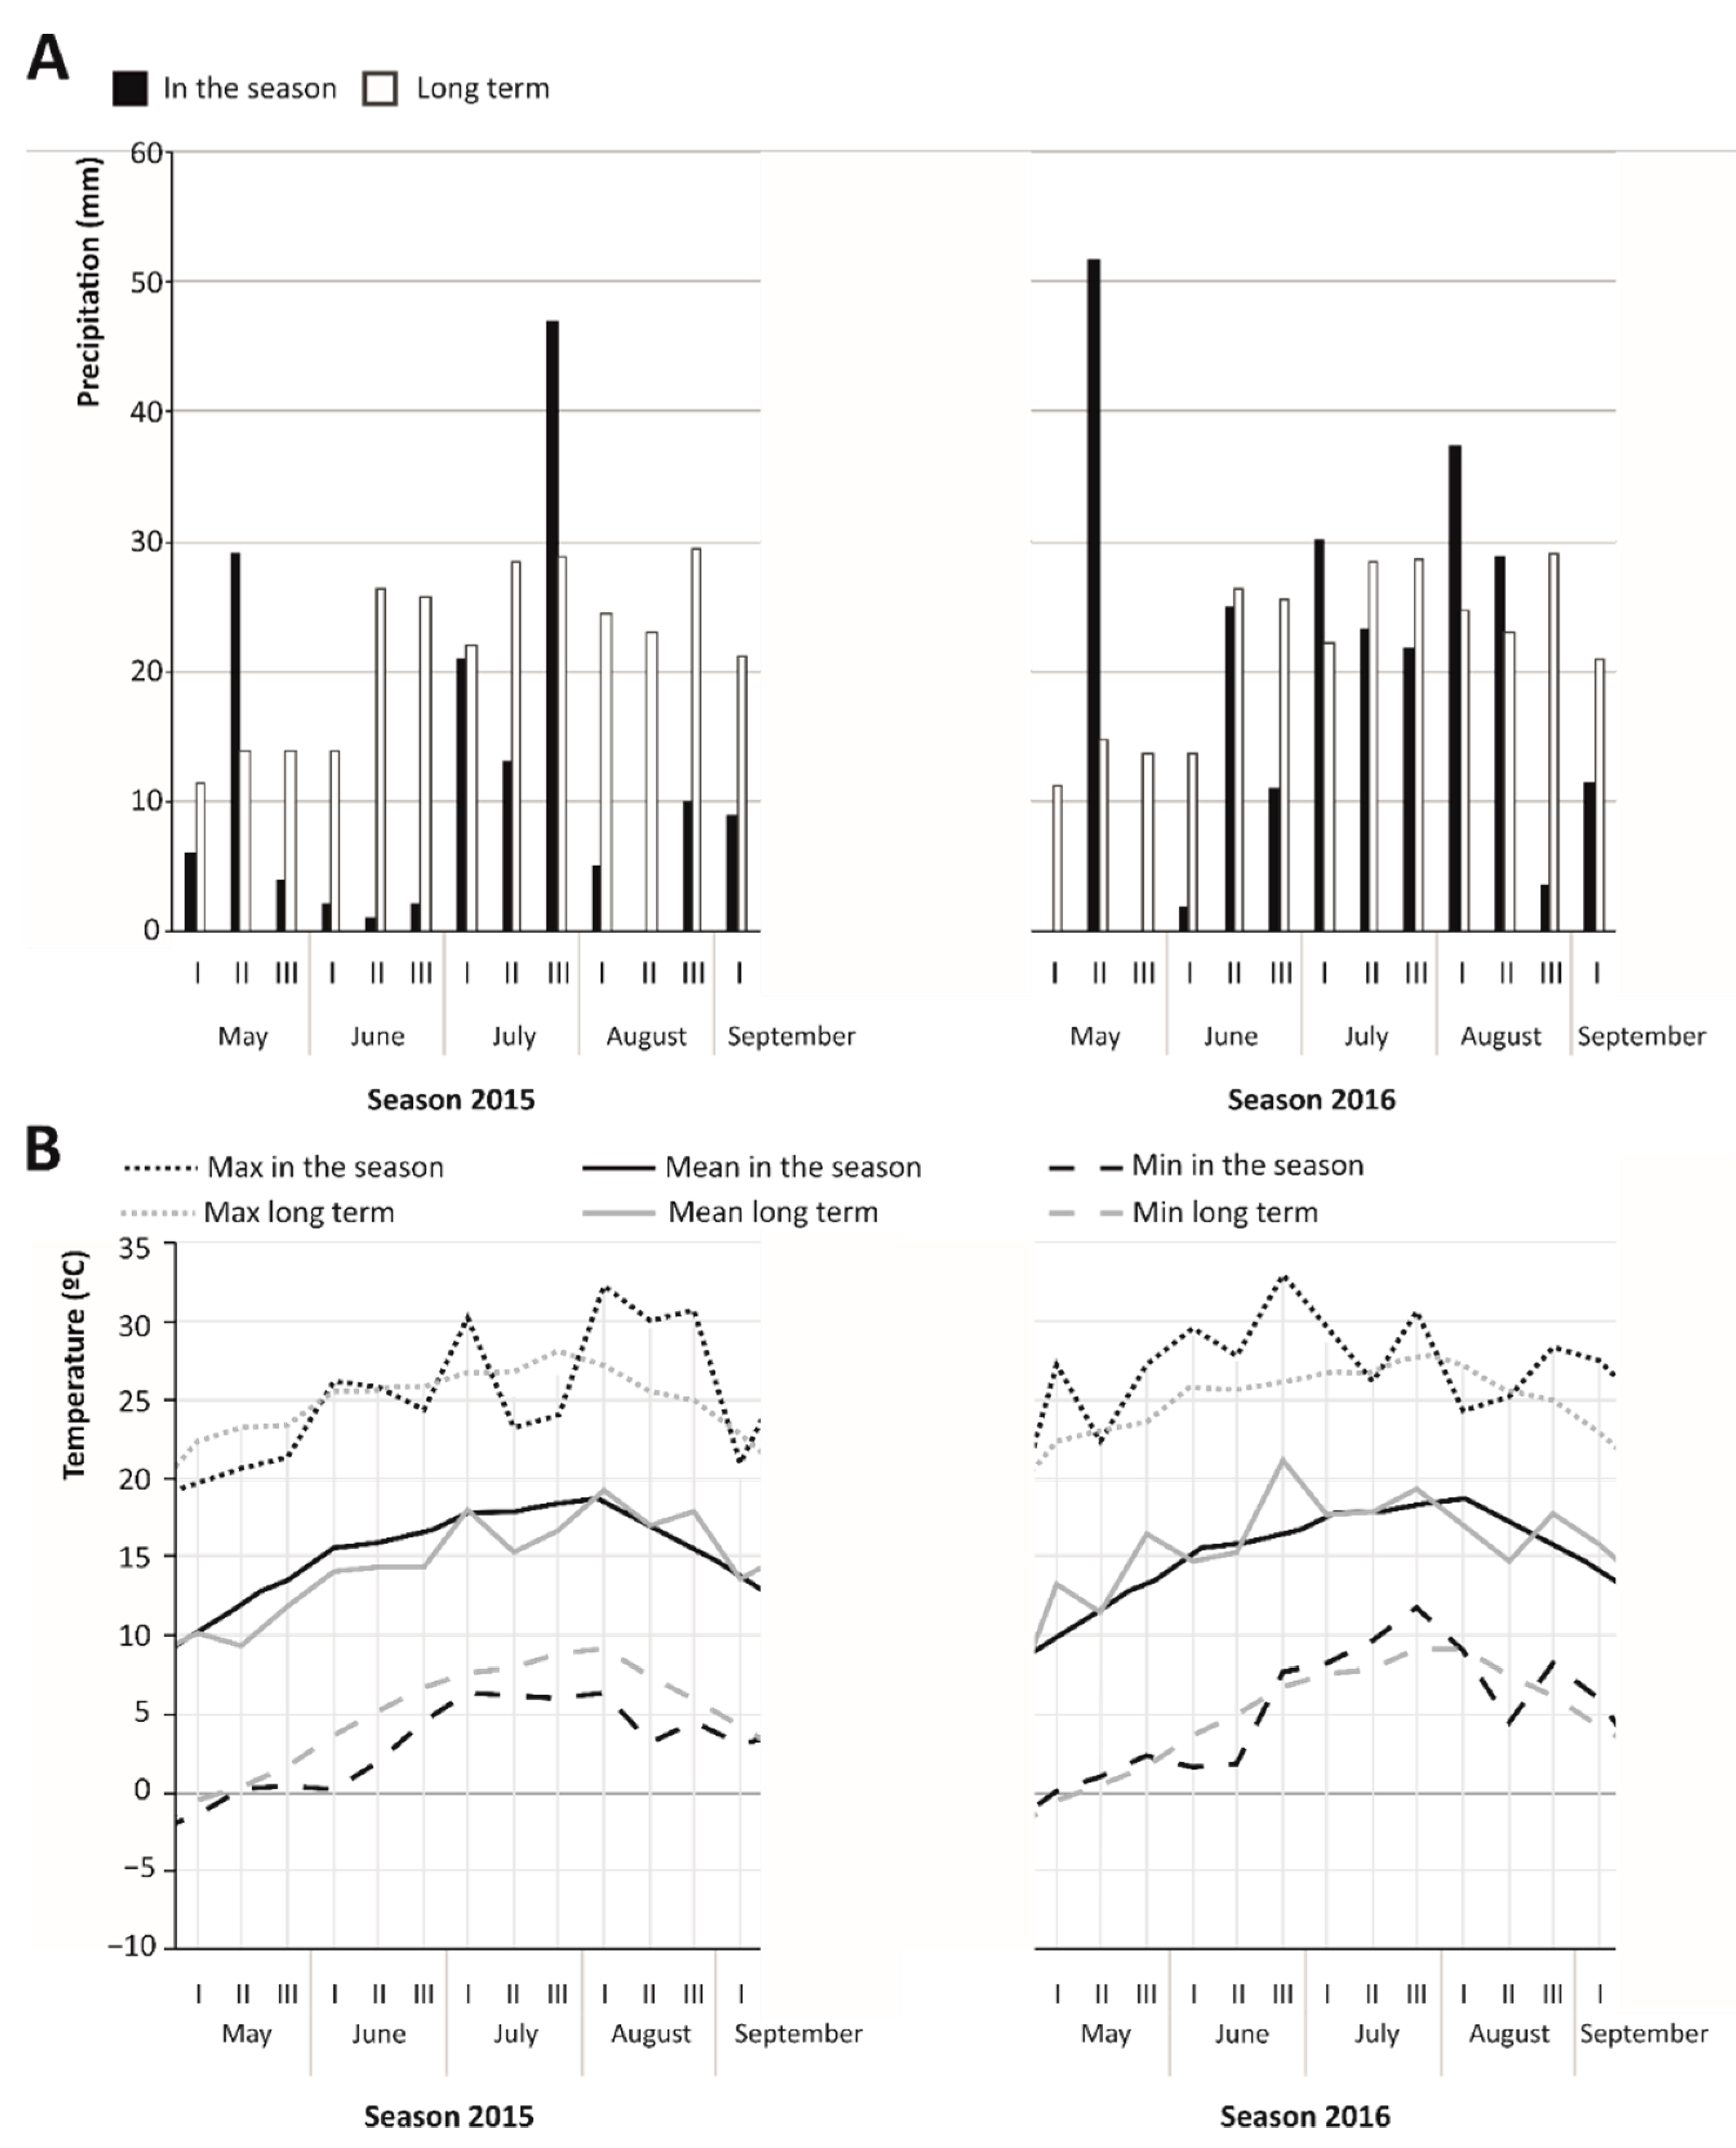
2.1. Climatic Conditions

Meteorological conditions during the period of investigations were close to the long-term (30 years period) average observations regarding temperature, but with rather many critical periods of drought. Draught quantification by the Standardized Precipitation Index (SPI) was performed to clarify the severity of drought (Table 1) [19].
The data obtained in SPI calculation support our observation of rather severe drought conditions during both vegetation seasons in both locations. Particularly in Pūre Horticultural Research Centre (PHRC) in Latvia, the 2015 season was characterized by extremely dry conditions with a total of 207.9 mm of precipitation during the growing period, and exceptionally dry June (5 mm precipitation) and the first part of August (5 mm precipitation) (Figure 1). The drought periods overlapped with intensive flowering and seed maturation periods, which influenced negatively the fava bean crops’ yield in 2015. The 2016 season was featured by moderate drought, with 248 mm of precipitation during the growing season, which fluctuated between 0 mm in the beginning and end of May and 51.7 mm in the mid of May. Extreme drought in the seed formation period in August and September also reduced the crops’ yield.
The average air temperature was quite similar in the course of the research, ranging between 13.1 and 14.2 °C, which is considered relatively close to the long-term observations for 30 years period. Periods of drought and hot weather were observed in August (plants at growth stage BBCH 69–89 [20]) of both years of investigation.
In the experimental field of the Estonian Crop Research Institute (ECRI) in Estonia, precipitation in the season 2015 was 266.7 mm (from 3.9 mm in the second decade (10-day period) of August to 48.0 mm in the first decade of September) and 436.3 mm, on average. The SPI also indicated extreme drought in the 2nd and 3rd decades of August, when the seed swelling phase occurs. In the season 2016, the precipitation fitted more closely the needs of fava bean plants according to the yield expectations—exception made of May and the second half of July, when severe drought periods were observed according to the SPI calculations. Physically 0 mm of precipitation was registered in the first decade of May and the second decade of September, while excessive precipitation (123.0 mm) was registered in the second decade of June (Figure 2).
The average air temperature in the season 2015 was 14.0 °C (with a maximum of 17.4 °C in the first decade of August and a minimum of 9.4 °C in the first decade of May). In the vegetation season of 2016, the average air temperature was 15.0 °C (with a maximum of 19.3 °C in the third decade of July and a minimum of 11.4 °C in the second decade of September).
The ranges of temperatures recorded mean that the season 2015, compared to long-term averages, was colder in May and June and warmer in July and August. During the season 2016, temperatures were higher in May, June, and July, while in August was nearly the long-term average. Precipitation in 2015 was lower than the long-term average in May, June, and August, while in July it was nearly the long-term average. Precipitation in 2016 was lower in May and August, while in June it was more and in July almost similar to the long-term average.

2.2. Crop Management, Site Characteristic, and Experimental Design

Five fava bean genotypes of different origin and commercialization level ‘Gloria’ and ‘Julia’ (commercial cultivars of German origin), ‘Jogeva’ (a local cultivar of Estonian origin), ‘Lielplatones’ (an old cultivar of Latvian origin), and ‘Bauska’ (landrace of Latvian origin) were used in both trials at PHRC (Latvia) and ECRI (Estonia). The cultivars selected for the trials represented a broad range of genetic diversity that, to some extent, would allow generalizing results to different types of fava bean—from commercial, intensive cultivars to extensive, local landraces.
Both experimental fields are characterized by a cool-temparate-moist climate. At PHRC, field trials were performed in the geographic location 57°02′ N; 22°55′ E, 57 m altitude during both growing seasons (2015–2016) and at ECRI in the geographical location 58°46′ N; 26°24′ E, 28 m altitude both years.
Soil characteristics and crop management in both trial locations are detailed in Table 2.
Sowing densities in the present work were chosen based on the scientific literature studies on fava bean sowing density [11,15,16], as well as on observations obtained in preliminary research developed in Latvia and Estonia. Accordingly, the plants’ density ranged between 30 and 50 germinating seeds per m2. The trials were arranged with different plants’ densities in each location—40 and 50 plants m−2 in PHRC and 30 and 36 plants m−2 in ECRI adjusted to the agronomic practices used in each country. The trial layout in both locations and both seasons (years) was organized as a randomized complete block design with four blocks. The 10 combinations of the five varieties and the two actual plant densities were randomized to 10 plots within each block, each plot with a size of 10 m2.

2.3. Measurements of Yield and Protein Content

Plant productivity was estimated by dry, mature grain yield, expressed as t ha−1. Fava beans were harvested in the 1st decade of September for both years in both locations. Dry seeds were harvested from all plants in each plot at the stage BBCH 89–93 and weighed. The yield was calculated in t ha−1. Fava bean samples of 10 g weight were analyzed for dry mass and protein content in the four replicates (sample per plot) using the procedure described by the Association of Official Analytical Chemists [21], and by near-infrared spectroscopy (NIR) by using XDS Rapid Analyzer (FOSS, Hillerød, Denmark), where samples were analyzed according to the procedure described in the bibliography [22,23].

2.4. Statistical Analysis

Data from both locations were analyzed separately. For both locations, the response variables yield and protein were modelled separately using a mixed linear model (proc glimmix, SAS 9.4, SAS Institute Inc., Cary, NC, USA). The model included cultivar, plant density, and their interaction as fixed factors, while season, block within a season, and the ordinary error term was included as random factors. The random effects were assumed to be normally and independently distributed random variables with zero expectation. Residual plots were used to check the assumptions of normality and homogeneous variance. These plots were almost perfect and no transformations of the response variables were needed. Satterthwaite approximation was used for the denominator degrees of freedom in the F tests. Tukey’s multiple comparison method, with a significance level of 0.05, was used to compare the least-squares means.

3. Results and Discussion

3.1. Meteorological Conditions and Plant Development

Meteorological conditions shown in Figure 1 and Figure 2 had a very significant influence on the yield parameters monitored in the frame of the field trials performed in both locations, during the seasons 2015 and 2016. In Latvia, the weather conditions during the 2015 and 2016 seasons were extremely dry (208 mm in 2015 and 291 mm in 2016 total precipitation) and hot (average maximal temperature 23.9 °C in 2015 and 25.07 °C in 2016). In ECRI, the total precipitation during the two seasons was 266 mm in 2015 and 444 mm in 2016 and the average maximal air temperature was 23.2 and 24.6 °C, respectively. These precipitation and temperature conditions influenced the fava bean yield, which is in good agreement with previous descriptions available in the literature. Hence, as referred from field trials established in Poland, variability of seed yield due to weather conditions may range from 20 to 40% [24]. The results retrieved from the field trials described in the present work demonstrate the significant influence of insufficient precipitation on the yield, especially in Latvia, where both seasons were characterized by extremely low precipitation in comparison to the long-term record (Figure 1) and the optimal level identified based on previous research (400 mm) [25,26]. There was no significant variation between years for either yield or protein (Table 3). The negative influence of drought on yield formation has also been referred to by the Food and Agriculture Organization and the Organisation for Economic Co-operation and Development (FAO and OECD, respectively). These international organizations have pointed at the reduction in yield potential caused by early summer drought, which cannot be offset by higher precipitation later in the growing season [27].

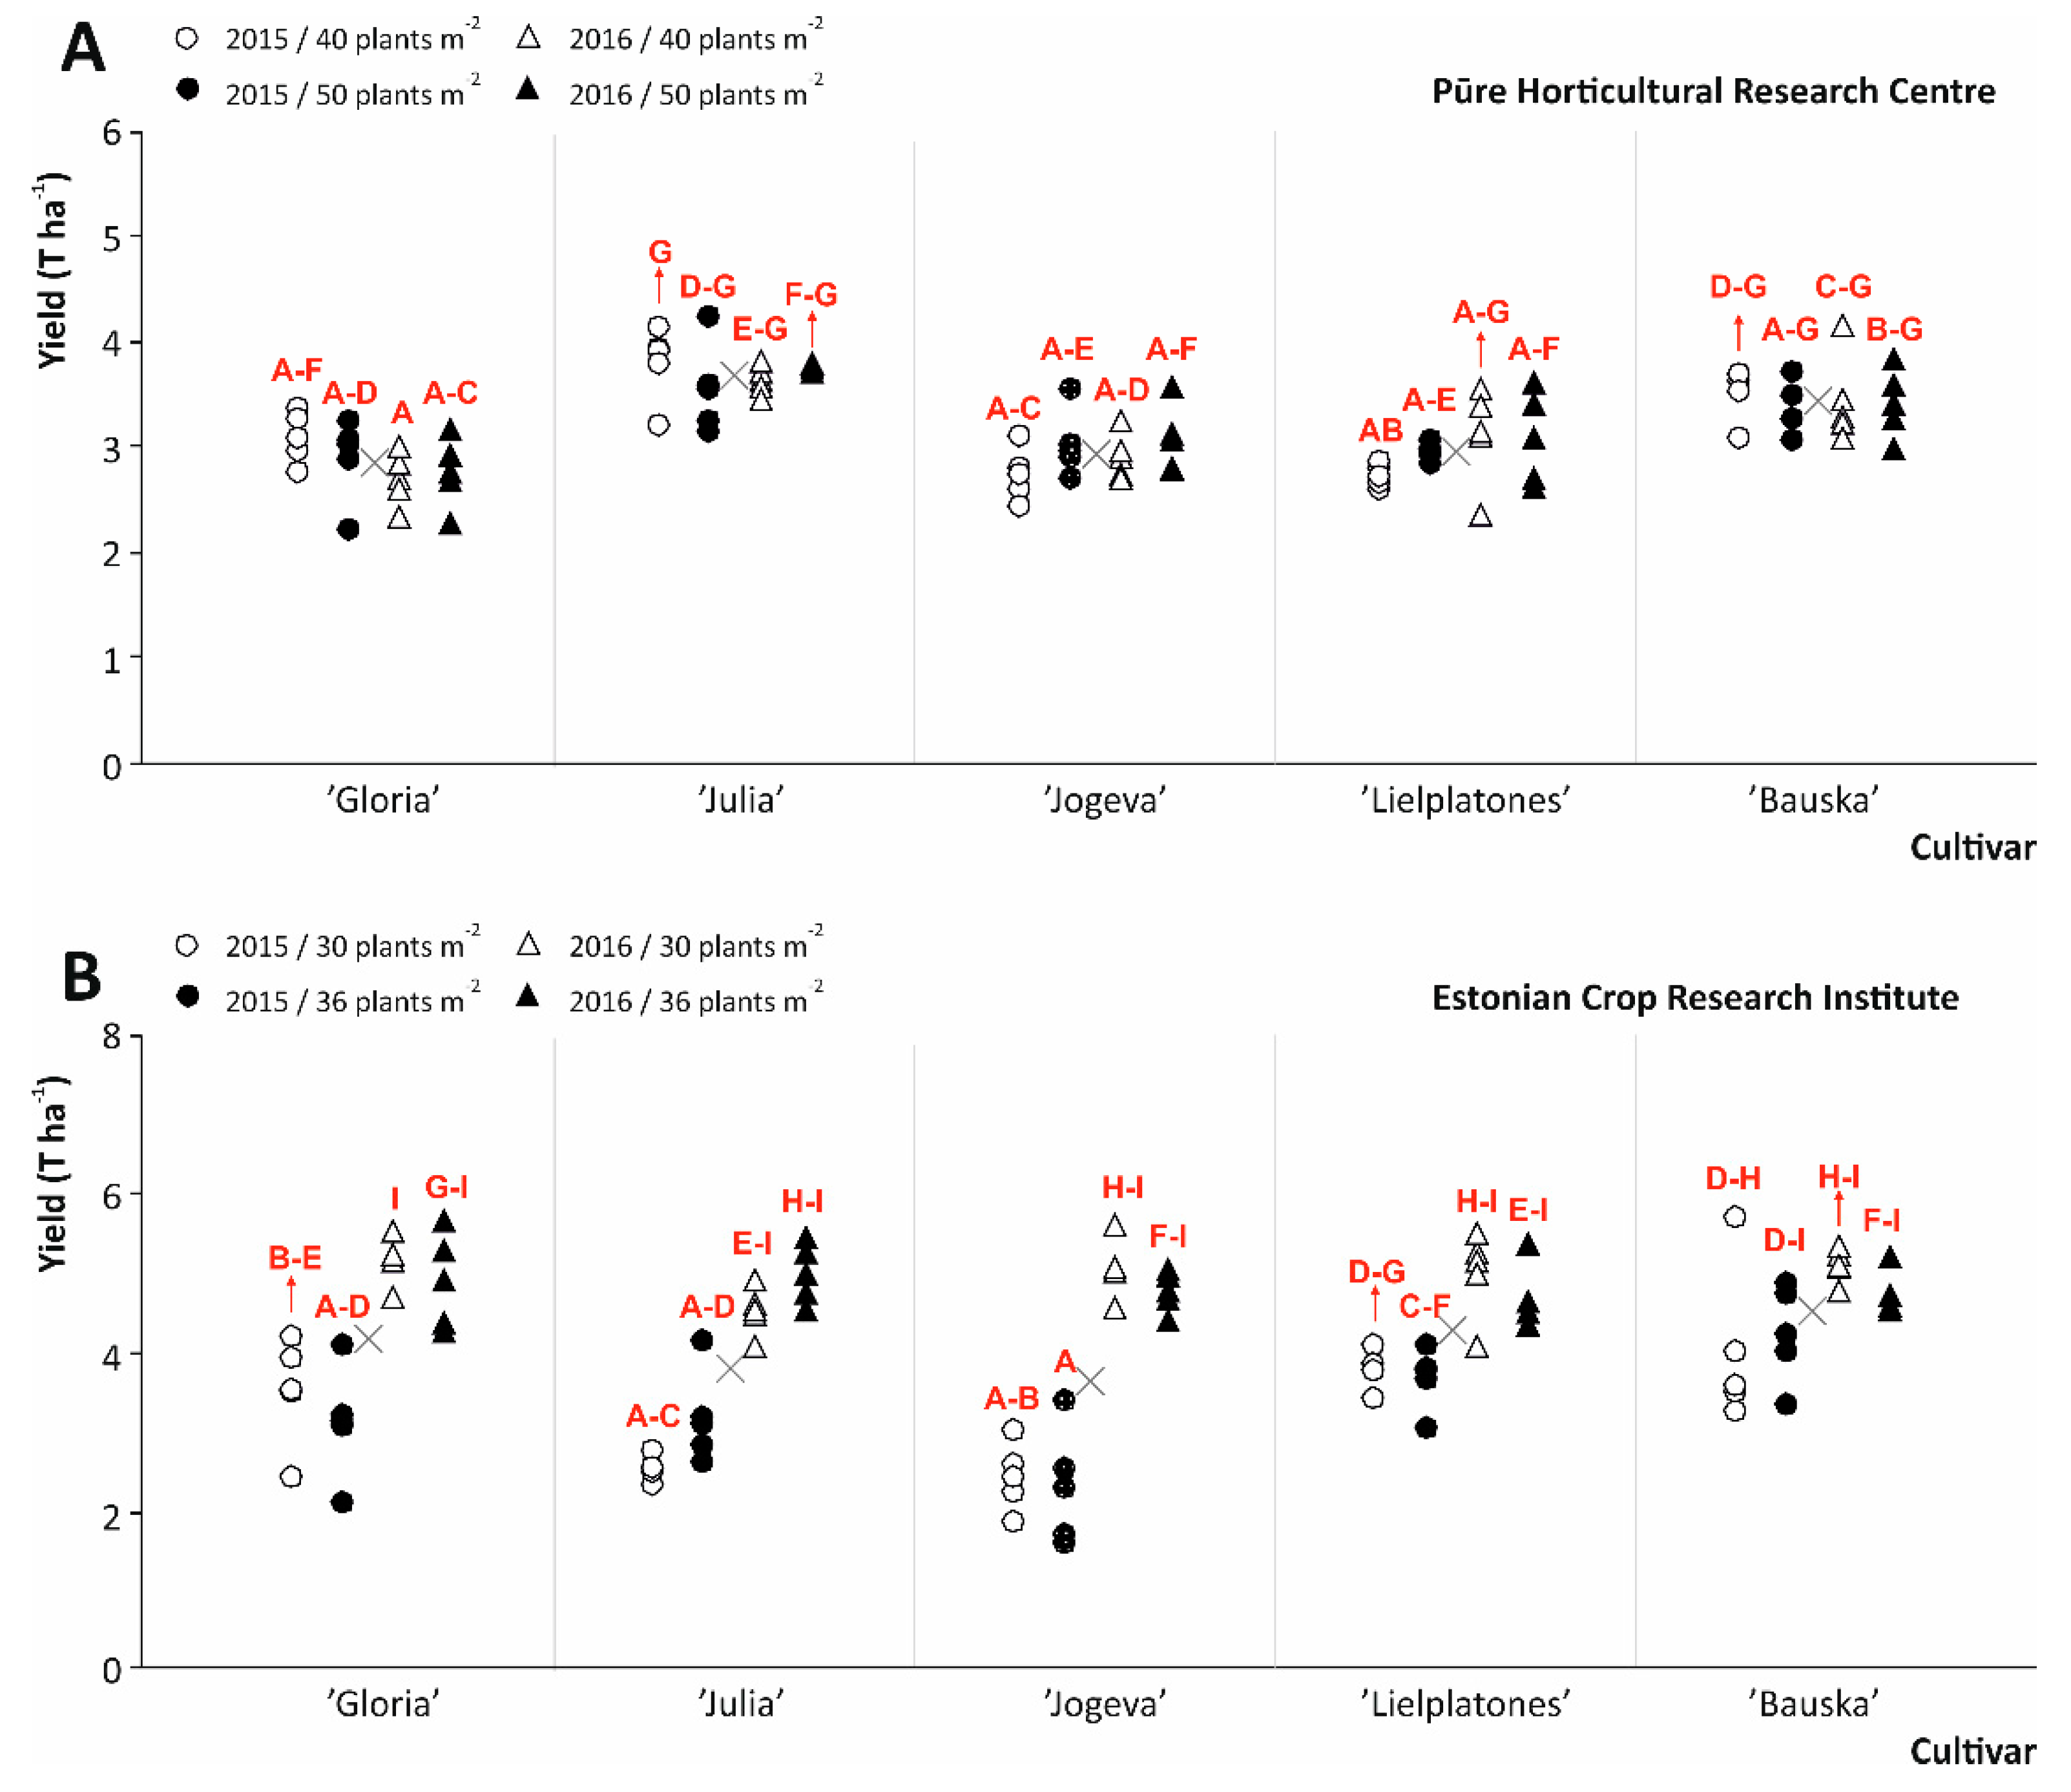
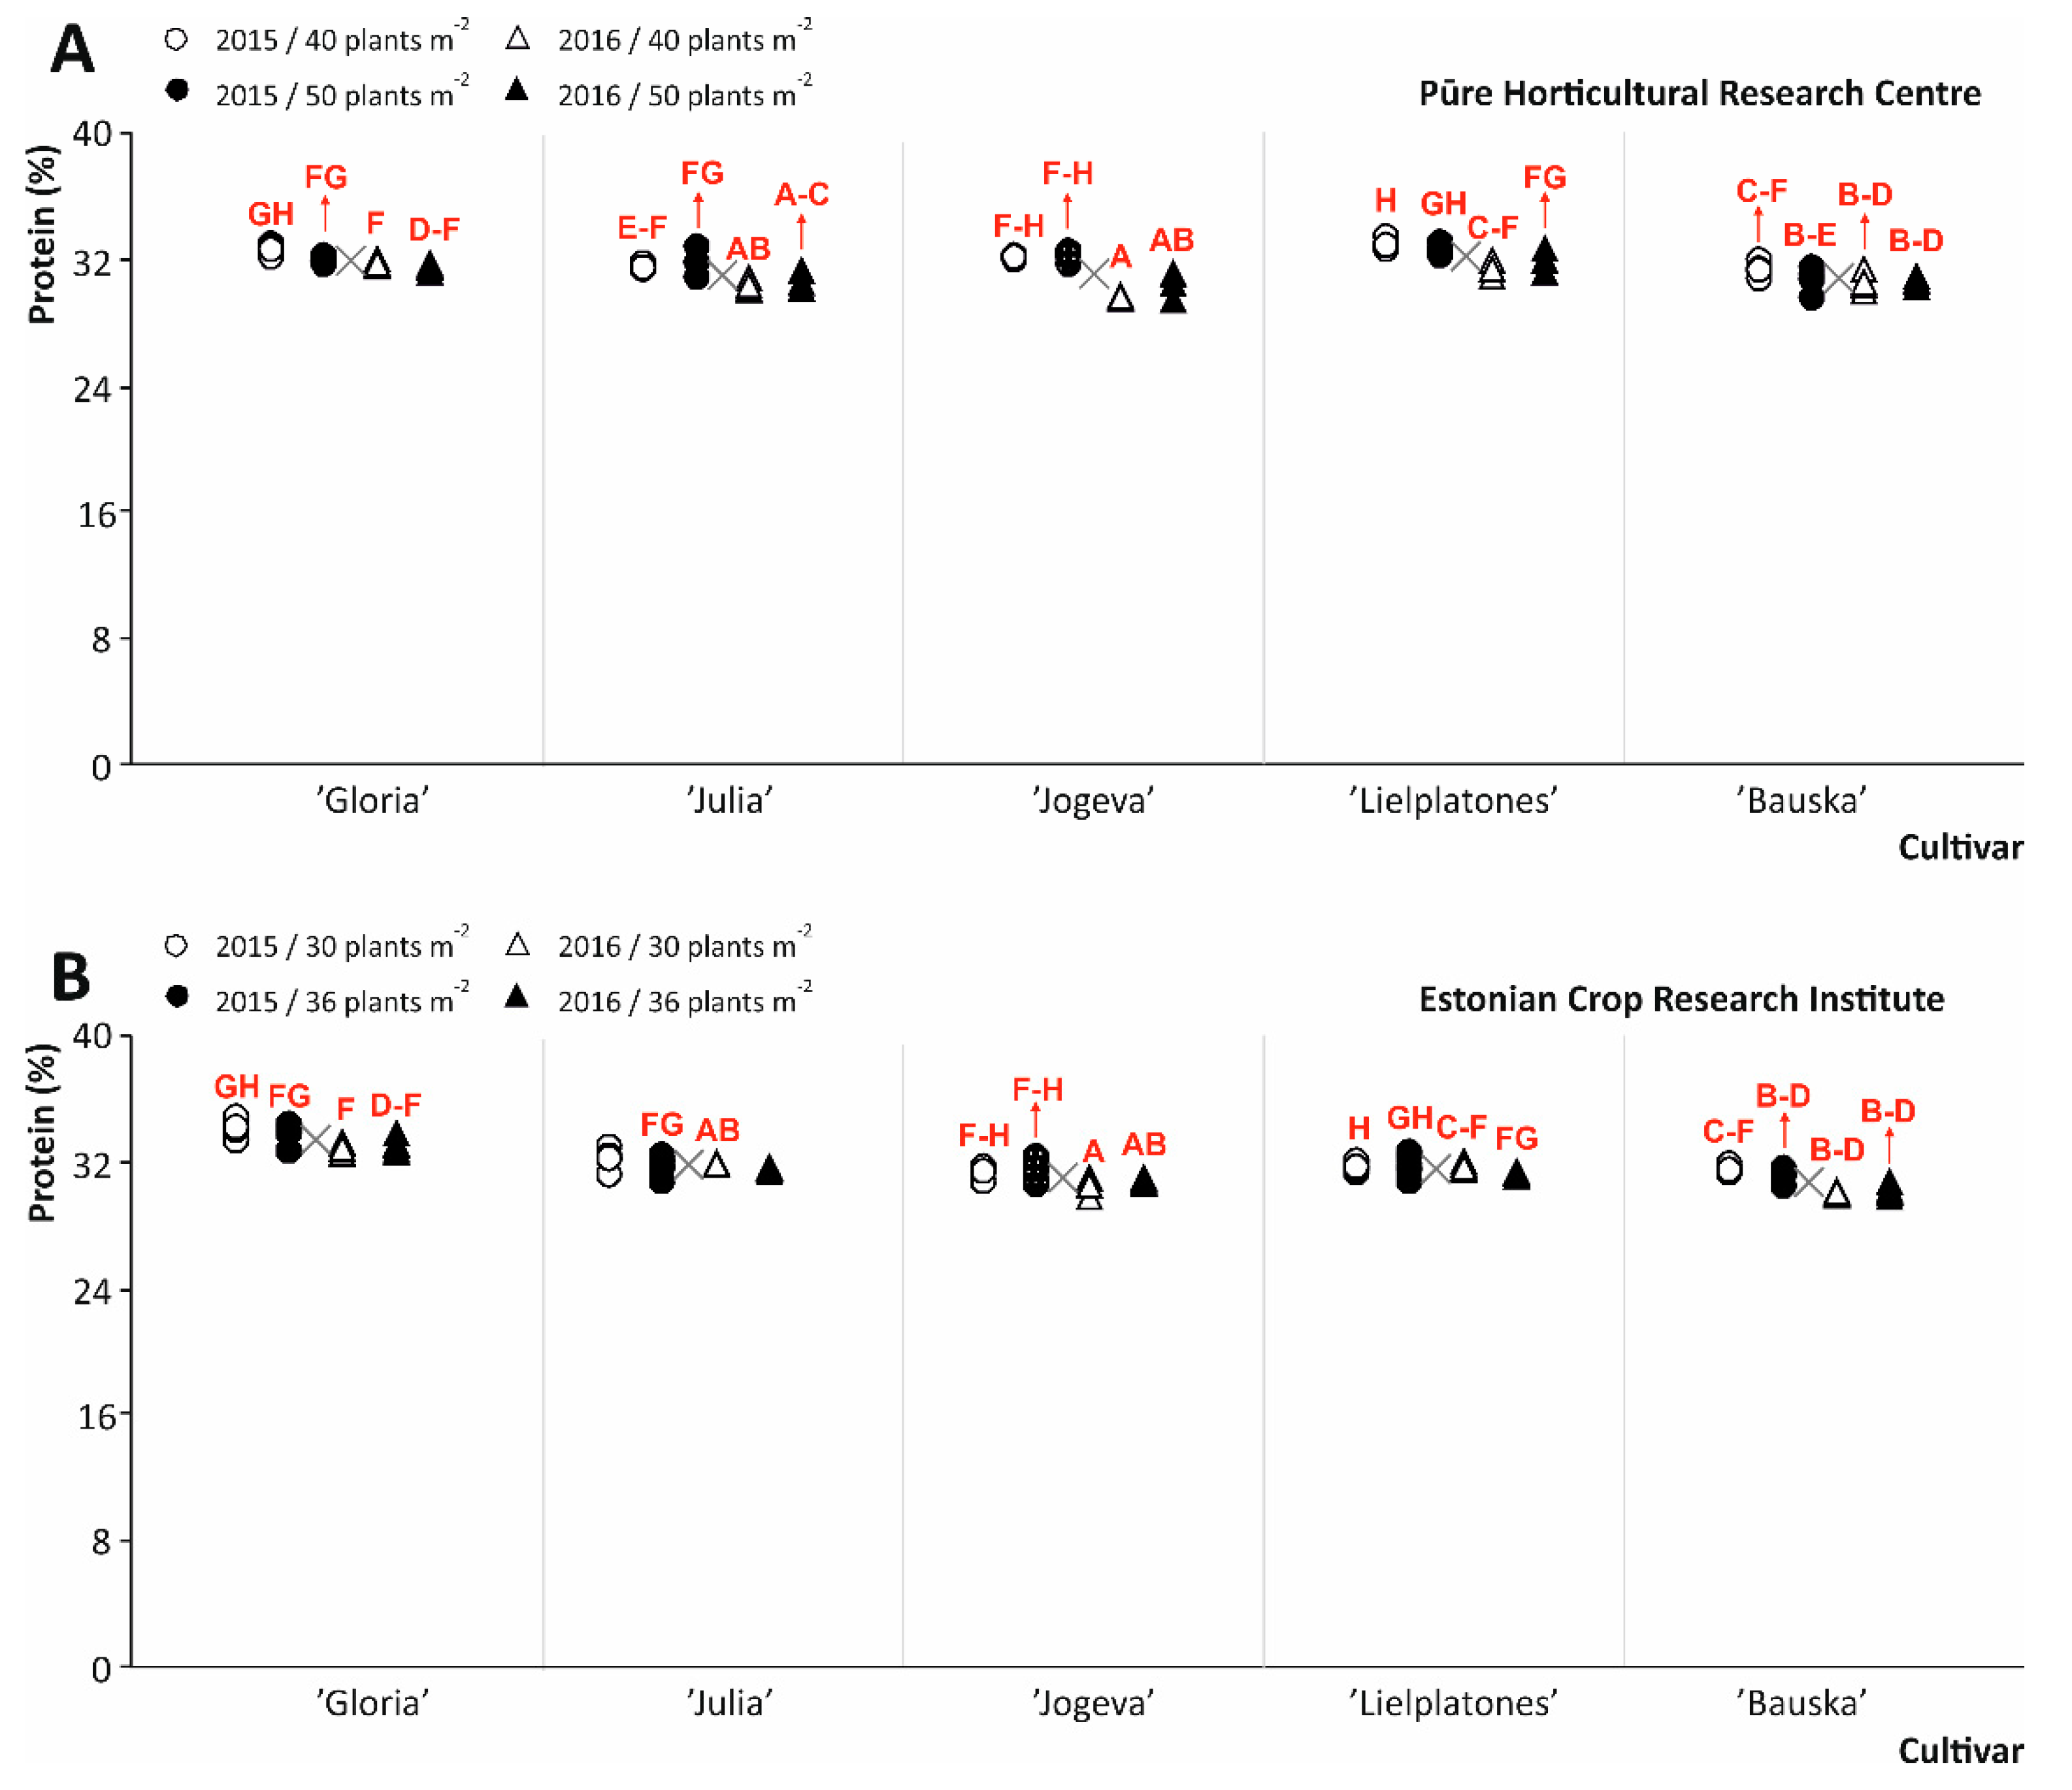
3.2. Plant Density Influence on Cultivar Yield and Quality Parameters

Despite the effect of the weather conditions during the field trials and their deleterious effect on the crop parameters monitored, the yield results for the five fava bean varieties (Figure 3) are in agreement with the range of fava bean yield indicators for the local area (northern Europe) and worldwide [24,28,29]. Concerning the effect of plant density and genotypes on fava bean yield (Table 4), the results from the field trial suggest a pre- ponderant influence of genotype on both seed production and protein content relative to plant density (Figure 3 and Figure 4). However, it should be noted that regarding yield, an influence of the meteorological conditions was also observed.
However, the statistical analysis of the average yield results, in Latvia and Estonia, for the five studied cultivars (2.86, 3.70, 2.94, 2.97, and 3.45 t ha−1 in Latvia, and 4.20, 3.82, 3.65, 4.29, and 4.54 t ha−1 in Estonia, for the cultivars ‘Gloria’, ‘Julia’, ‘Jogeva’, ‘Lielplatones’, and ‘Bauska’, respectively) indicated an absence of significant interactions between cultivar and plant density. There were also no significant effects of plant density on the yield. Nonetheless, the significant differences found when comparing the yield for the individual cultivars highlighted ‘Bauska’ as the most productive, while the remaining cultivars provided similar lower yields (Figure 3 and Figure 4, and Table 4).
On average for both seasons (2015 and 2016), the highest yield was obtained under Estonian agro-climatic conditions (4.57 t ha−1) for the cultivar ‘Bauska’, whereas in Latvia ‘Julia’ and ‘Bauska’ (3.40 and 3.75 t ha−1, respectively) gave the best yield results. The differences found could be attributed to the significantly different precipitation in Latvia during both vegetation periods (208 and 248 mm in 2015 and 2016, respectively (Figure 1)) in comparison with the Estonian conditions (266.7 and 444 mm in 2015 and 2016, respectively (Figure 2)).
Similarly, analysis of the protein content in fava bean seeds from the trials in Latvia and Estonia provided the average values 31.9, 31.0, 31.1, 32.1, and 30.8% in Latvia, and 33.6, 31.9, 31.2, 31.7, and 30.8% in Estonia, for the cultivars ‘Gloria’, ‘Julia’, ‘Jogeva’, ‘Lielplatones’, and ‘Bauska’, correspondingly. These results, again, indicated a lack of interactions between cultivar and plant density and effects of plant density on the protein content (Figure 3 and Figure 4, and Table 2). The concentrations of protein recorded were equal or higher than the values reported in the literature (31.0% for the local area and 29.0% in the world) [16,28,30,31]. These results did not demonstrate significant differences in protein concentrations between locations. In this regard, the highest protein content in Estonia was obtained from the cultivar ‘Gloria’ (33.6%), followed by ‘Julia’ (32.1%) and ‘Lielplatones’ (31.8%), while in Latvia the best values were obtained from ‘Lielplatones’ (32.1%), followed by ‘Gloria’ (31.9%). The statistical analysis of these results does not demonstrate the influence of sowing density on the protein concentration in fava bean grains (Table 2).
When calculating the protein yield per hectare, the foremost cultivars in Estonia were ‘Gloria’ (1.46 t ha−1), followed by ‘Bauska’ and ‘Lielplatones’ (1.40 t ha−1, on average), at a sowing density of 30 plants m−2. On the other hand, in Latvia, the highest protein yield per ha was obtained for ‘Julia’ (1.15 t ha−1) and ‘Bauska’ (1.07 t ha−1) at the plant density of 40 plants m−2 (Figure 5).
When comparing the results obtained in two locations (featured by specific climatic conditions) the different protein yields recorded suggest that Estonian conditions favored this trait in comparison to Latvian conditions expressed as tons per ha.
According to these results, in summary, the landrace ‘Bauska’ appeared as the most productive cultivar, which provided the highest yields in both locations, and when grown under the range of diverse agro-climatic conditions represented by the different sowing densities and climatic conditions in both years (2015 and 2016). This would indicate high plasticity and stability in the landrace ‘Bauska’, which could be grown under a wide range of climatic conditions without significant variations of the productivity parameters. In this regard, for instance, the precipitation recorded during the vegetation period seems not to influence the yield for this cultivar critically. Accordingly, these results strongly encourage using local cultivars and landraces for the production of fava bean for commercial purposes, since this would contribute to enhancing the sustainability of the agro-food system in northern Europe.

3.3. Plant Density Influence on Yield per Area and Plant Productivity

The results of the two-year trial in two locations indicated that the plant densities applied in these trials (40 and 50 plants m−2 in Latvia and 30 and 36 plants m−2 in Estonia) did not significantly influence yield per ha (Table 3 and Figure 3). However, yield per plant differed significantly between sowing densities for most cultivars—denser plant canopy exhibited lower yield in comparison with plants grown sparser.
These results are in agreement with previous reports, which demonstrated that under lower density conditions, more resources (light, water, and nutrients) are available per plant that, in turn, gives rise to higher yields [28]. Despite this, based on the results obtained in the present work it is not evident that the higher productivity per plant obtained at lower plant density compensates the yield that could be obtained from the lacking plants per area, and thus, no higher yield per area is retrieved.
The results are in agreement also with Matthews et al., who refers that in low-yielding environments there tends to be less response of crops to plant density [32]. As the tested sowing densities were in the range of most often recommended seeding density for fava bean (from 25 to 50 depending on information source and cultivars [6,11,16,18]), the result obtained further approves the validity of this recommendation. Next, this raises the question, which plant density should be used to obtain economically profitable yields?

3.4. Economic Implications of Seeding Rate

Seeding rate is a production parameter closely dependent on the seed size and plants density [25,33,34]. As a result, it is assumed that low sowing density and the use of smaller seeds for fava bean crops are more efficient management alternatives from an economic perspective since less seeding material is then needed per area, while the yield is roughly the same (depending on cultivar and growing conditions). In the field trial described in the present article, the lowest seeding rate was applied for ‘Lielplatones’ in the Estonian research field (150 kg ha−1), whereas for the less productive cultivar, ‘Jogeva’, 322 and 295 kg ha−1 seeds at a plant density of 50 and 36 plants m−2, respectively, in Latvia and Estonia, were used (not shown). This is in good agreement with Graf and Rowland, who defined 38 plants m−2 as the optimal plants’ density that allows obtaining a higher relative yield at the optimal cost/price ratio stated [34]. These conditions should be considered when calculating the economic returns of fava bean crops. Accordingly, and based on the main results obtained from this field trial, 30 and 40 seeds m−2 (Estonia and Latvia, respectively) can be suggested as the most economically feasible to use in fava bean production, in the conventional cropping system, under Baltic agro-climatic conditions.

3.5. Influence of Limited Precipitation on the Fava Bean Yield

Fava bean is recognized as a water shortage-sensitive crop [1] because of its shallow root system which may reach 0.8 m depth, while the majority of the root system (34.2%) is located at 0 to 25 cm depth [35]. The stable differences between yields under Latvian and Estonian agro-climatic conditions (both in the Baltic area) support this statement and points out that extreme drought during the seed formation and the whole vegetation period has a critical influence on yield, as suggested according to the major outcomes from the Latvian field trial. As an exception, the cultivar ‘Bauska’ was less influenced by the critical agro-climatic conditions.
Based on previous reports, the optimum precipitation for the fava bean crops is considered to be 400 mm [25,26]. However, this precipitation level, in Latvia, was not reached during the field trial, as just half of this amount was recorded in 2015 and 3/4 in 2016. Despite this limitation, satisfactory grain yield was obtained from both densities in this location (3.18 t ha−1, on average). On the other hand, also in Estonia, a shortage of precipitation occurred in 2015 when the lowest yield was obtained (2.3 t ha−1 from the cultivar ‘Jogeva’, sowed at 36 plants m−2 density), while the average yield from all cultivars was 3.29 t ha−1. This can be considered as an acceptable yield since it is reported that average fava bean yield under similar agro-ecological conditions ranges between 3 and 4.9 t ha−1 [24,30].

4. Conclusions

This study concluded that plant density has no significant influence on the yield and protein content of fava bean under Baltic agro-climatic conditions, with limited moisture availability during the vegetation period, especially the seed filling stage (BBCH 69–89). A practical formulation of this conclusion is that since it is possible to get the same yield with low plant densities compared to high, production costs can be reduced by choosing lower seeding rates. It can be suggested that sowing density 30 (Estonia)—40 (Latvia) seeds m−2 is economically feasible to use in commercial fava bean production in conventional cropping systems in Baltic agro-climatic conditions. It should be taken into account that the most significant influence on the fava bean yield and protein content is determined by cultivar.

Author Contributions

Conceptualization, L.L., E.R. and R.D.-P.; methodology, L.L. and I.M.V.; software, T.T.; validation, E.R., R.D.-P. and I.M.V.; formal analysis, T.T.; investigation, L.L., S.Z. and M.O.; resources, L.L., M.O. and E.R.; data curation, L.L., M.O. and T.T.; writing—original draft preparation, L.L.; writing—review and editing, E.R. and R.D.-P.; visualization, R.D.-P.; supervision, E.R.; project administration, L.L. and E.R.; funding acquisition, E.R. All authors have read and agreed to the published version of the manuscript.

Funding

This research was funded by European Commission Seventh Framework Programme within the project EUROLEGUME-Enhancing of legumes growing in Europe through sustainable cropping for protein supply for food and feed (FP7 Research Project No 613781) and national funds from FCT—Portuguese Foundation for Science and Technology (projects UID/AGR/04033/2013, POCI-01-0145-FEDER-006958 and UIDB/04033/2020).

Institutional Review Board Statement

Not applicable.

Informed Consent Statement

Not applicable.

Conflicts of Interest

The authors declare no conflict of interest.

References

  1. Köpke, U.; Nemecek, T. Ecological services of faba bean. Field Crops Res. 2010, 115, 217–233. [Google Scholar] [CrossRef]
  2. Karkanis, A.; Ntatsi, G.; Lepse, L.; Fernández, J.A.; Vågen, I.M.; Rewald, B.; Alsiņa, I.; Kronberga, A.; Balliu, A.; Olle, M.; et al. Faba Bean Cultivation—Revealing Novel Managing Practices for More Sustainable and Competitive European Cropping Systems. Front. Plant Sci. 2018, 9, 1115. [Google Scholar] [CrossRef] [PubMed]
  3. Rodiño, A.P.; Santalla, M.; de Ron, A.M.; Drevon, J.J. Variability in symbiotic nitrogen fixation among white landracesof common bean from the Iberian peninsula. Symbiosis 2005, 40, 69–78. [Google Scholar]
  4. Duc, G.; Aleksić, J.M.; Marget, P.; Mikić, A.; Paull, J.; Redden, R.J.; Sass, O.; Stoddard, F.L.; Vandenberg, A.; Vishnyakova, M.; et al. Faba bean. In Grain Legumes; de Ron, A.M., Ed.; Springer Science+Business Media: New York, NY, USA, 2015; pp. 141–178. [Google Scholar]
  5. Jeuffroy, M.H.; Ney, B. Crop physiology and productivity. Field Crop Res. 1997, 53, 3–16. [Google Scholar] [CrossRef]
  6. Loss, S.P.; Siddique, K.H.M.; Jettner, R.; Martin, L.D. Responses of faba bean (Vicia faba L.) to sowing rate in south-western Australia I. Seed yield and economic optimum plant density. Aust. J. Agric. Res. 1997, 49, 989–997. [Google Scholar]
  7. Siddiqui, M.H.; Al-Khaishany, M.Y.; Al-Qutami, M.A.; Al-Whaibi, M.H.; Grover, A.; Ali, H.M.; Al-Wahibi, M.S.; Bukhari, N.A. Response of Different Genotypes of Faba Bean Plant to Drought Stress. Int. J. Mol. Sci. 2015, 16, 10214–10227. [Google Scholar] [CrossRef] [Green Version]
  8. Kumar, J.; Choudhary, A.K.; Solanki, R.K.; Pratap, A. Towards marker-assisted selection in pulses: A review. Plant Breed. 2011, 130, 297–313. [Google Scholar] [CrossRef]
  9. Weigelt, K.; Küster, H.; Radchuk, R.; Müller, M.; Weichert, H.; Fait, A.; Fernie, A.R.; Saalbach, I.; Weber, H. Increasing amino acid supply in pea embryos reveals specific interactions of N and C metabolism, and highlights the importance of mitochondrial metabolism. Plant J. 2008, 55, 909–926. [Google Scholar] [CrossRef]
  10. Confalone, A.; Lizaso, J.I.; Ruíz-Nogueira, B.; López-Cedrón, F.-X.; Sau, F. Growth, PAR use efficiency, and yield components of field-grown Vicia faba L. under different temperature and photoperiod regimes. Field Crops Res. 2010, 115, 140–148. [Google Scholar] [CrossRef]
  11. Lŏpez-Bellido, F.J.; Lŏpez-Bellido, L.; Lŏpez-Bellido, R.J. Competition, growth and yield of faba bean (Vicia faba L.). Eur. J. Agron. 2005, 23, 359–378. [Google Scholar] [CrossRef]
  12. Khan, J.; Paull, G.; Siddique, K.H.M.; Stoddard, F.L. Faba bean breeding for drought-affected environments: A physiological and agronomic perspective. Field Crops Res. 2010, 115, 279–286. [Google Scholar] [CrossRef]
  13. Matthews, P.; McCaffery, D.; Jenkins, L. Winter Crop Variety Sowing Guide 2015, Australia Region NSW DPI Management Guide; Grain Research & Development Corporation: Barton, Australia, 1997. [Google Scholar]
  14. Gezahegn, A.M.; Tesfaye, K.; Sharma, J.J.; Belel, M.D. Determination of optimum plant density for faba bean (Vicia faba L.) on vertisols at Haramaya, Eastern Ethiopia. Cogent Food Agric. 2016, 2, 1–10. [Google Scholar] [CrossRef]
  15. Bakry, B.A.; Elewa, T.A.; El-Karamany, M.F.; Zeidan, M.S.; Tawfik, M.M. Effect of row spacing on yield and its components of some faba bean varieties under newly reclaimed sandy soil condition. World J. Agric.Sc. 2010, 7, 68–72. [Google Scholar]
  16. Plūduma-Pauniņa, I.; Gaile, Z.; Bankina, B.; Balodis, R. Field Bean (Vicia faba L.) Yield and quality depending on some agrotechnical aspects. Agron. Res. 2018, 16, 212–220. [Google Scholar] [CrossRef]
  17. Turk, M.A.; Tawaha, A.R.M. Impact of seeding rate, seeding date, rate and method of phosphorus application in faba bean (Vicia faba L. minor) in the absence of moisture stress. Biotechnol. Agron. Soc. Environ. 2002, 6, 171–178. [Google Scholar]
  18. McVetty, P.B.E.; Evans, L.E.; Nugent-Rigby, J. Response of faba beans (Vicia faba L.) to seeding date and seeding rate. Can. J. Plant Sci. 1985, 66, 39–44. [Google Scholar] [CrossRef]
  19. McKee, T.B.; Doesken, N.J.; Kleist, J. The relationship of drought frequency and duration to time scales. In Proceedings of the 8th Conference on Applied Climatology, Boston, MA, USA, 17–22 January 1993; Volume 17, pp. 179–183. [Google Scholar]
  20. Meier, U. Growth Stages of Mono-and Dicotyledonous Plants; Blackwell Wissenschafts-Verlag: Oxford, UK, 1997. [Google Scholar]
  21. AOAC. Official Methods of Analysis, 16th ed.; Association of Official Analytical Chemists: Washington, DC, USA, 1995. [Google Scholar]
  22. Weyer, L.G. Near-Infrared Spectroscopy of Organic Substances. Appl. Spectrosc. Rev. 1985, 21, 1–43. [Google Scholar] [CrossRef]
  23. Machado, N.; Oppolzer, D.; Ramos, A.; Ferreira, L.; Rosa, E.A.; Rodrigues, M.; Barros, A.I. Evaluating the freezing impact on the proximate composition of immature cowpea (Vigna unguiculata L.) pods: Classical versus spectroscopic approaches. J. Sci. Food Agric. 2017, 97, 4295–4305. [Google Scholar] [CrossRef]
  24. Kulig, B.; Kolodziej, J.; Oleksy, A.; Kolodziejczyk, M.; Sajdak, A. Influence of the weather conditions on faba bean yielding. Ecol. Chem. Eng. 2011, 18, 1071–1078. [Google Scholar]
  25. Agriculture Victoria. Growing Faba Bean. 1994. Available online: http://agriculture.vic.gov.au/agriculture/grains-and-other-crops/crop-production/growing-faba-bean/ (accessed on 18 April 2021).
  26. Zabawi, A.G.; Dannetti, M.D.D. Responses of faba bean (Vicia faba) to different levels of plant available water: I. Phenology, growth and biomass partitioning. J. Trop. Agric. Food Sci. 2010, 38, 11–19. [Google Scholar]
  27. OECD-FAO. Agricultural Outlook, 2013–2022: Highlights © OECD/FAO. 2013. Available online: https://www.oecd.org/berlin/OECD-FAO%20Highlights_FINAL_with_Covers%20(3).pdf (accessed on 18 October 2021).
  28. Duc, G. Faba bean (Vicia faba L.). Field Crops Res. 1997, 53, 99–109. [Google Scholar] [CrossRef]
  29. Bodner, G.; Kronberga, A.; Lepse, L.; Olle, M.; Vågen, I.M.; Rabante, L.; Fernández, J.A.; Ntatsi, G.; Balliu, A.; Rewald, B. Trait identification of faba bean ideotypes for Northern European environments. Eur. J. Agron. 2018, 96, 1–12. [Google Scholar] [CrossRef]
  30. Lizarazo, C.I.; Lampi, A.M.; Liu, J.; Sontag-Strohm, T.; Piironenb, V.; Stoddard, F.L. Nutritive quality and protein production from grain legumes in a boreal climate. J. Sci. Food Agric. 2015, 95, 2053–2064. [Google Scholar] [CrossRef] [Green Version]
  31. Metayer, N. Vicia Faba Breeding for Sustainable Agriculture in Europe; Feverole, G., Ed.; Eufaba; University of Cordoba: Córdoba, Spain, 2004; pp. 1–17. [Google Scholar]
  32. Matthews, P.W.; Armstrong, E.L.; Lisle, C.J.; Menz, I.D.; Shephard, P.L.; Armstrong, B.C. The effect of faba bean plant population on yield, seed quality and plant architecture under irrigation in southern NSW. Aust. Crop. Agron. J. 2008, 23, 40–43. [Google Scholar]
  33. Fleury, D. Optimal Seeding Rates for Fababean Seed Size. TopCrop Manager. 2018. Available online: https://www.topcropmanager.com/optimal-seeding-rates-for-fababean-seed-size-21068/ (accessed on 18 October 2021).
  34. Graf, R.J.; Rowland, G.G. Effect of plant density on yield and components of yield of faba bean. Can. J. Plant Sci. 1987, 67, 1–10. [Google Scholar] [CrossRef]
  35. Ruggiero, C.; de Pascale, S.; Fagnano, M. Plant and soil resistance to water flow in faba bean (Vicia faba L. major Harz.). Plant Soil 1999, 210, 219–231. [Google Scholar] [CrossRef]
Figure 1. Meteorological conditions during the growing seasons 2015 and 2016 (per 10 days periods—decades) (precipitation (A) and temperature (B)) in Pūre Horticultural Research Centre—PHRC in comparison with long term records of precipitation and temperature.
Agriculture 11 01042 g001
Figure 2. Meteorological conditions during the growing seasons 2015 and 2016 (per 10 days periods—decades) (precipitation (A) and temperature (B)) in Estonian Crop Research Institute—ECRI in comparison with long-term records of precipitation and temperature.
Agriculture 11 01042 g002
Figure 3. Dry grain yield (t ha−1) of the five fava bean cultivars (‘Gloria’, ‘Julia’, ‘Jogeva’, ‘Lielplatones’, and Bauska’) grown in two locations in Latvia (Pūre Horticultural Research Centre—PHRC) (A) and Estonia (Estonian Crop Research Institute—ECRI) (B), applying two densities (40 and 50 plants m−2 in PHRC and 30 and 36 plants m−2 in ECRI) during the 2015 and 2016 growing seasons. Dot plots representing combinations of plant density, season, and cultivar with different capital letter were significantly different at p < 0.05 according to the analysis of variance (ANOVA) and HSD (honestly significant difference) multiple range test of Tukey.
Agriculture 11 01042 g003
Figure 4. Protein concentration (% of dry matter) of the five fava bean cultivars (‘Gloria’, ‘Julia’, ‘Jogeva’, ‘Lielplatones’, and Bauska’) grown in two locations in Latvia (Pūre Horticultural Research Centre—PHRC) (A) and Estonia (Estonian Crop Research Institute—ECRI) (B), applying two densities (40 and 50 plants m−2 in PHRC and 30 and 36 plants m−2 in ECRI) during the 2015 and 2016 growing seasons. Dot plots representing combinations of plant density, season, and cultivar with different capital letters were significantly different at p < 0.05 according to the analysis of variance (ANOVA) and HSD (honestly significant difference) multiple range test of Tukey.
Agriculture 11 01042 g004
Figure 5. Protein yield (t ha−1) of the five fava bean cultivars (‘Gloria’, ‘Julia’, ‘Jogeva’, ‘Lielplatones’, and Bauska’) grown in two locations, in Latvia (Pūre Horticultural Research Centre—PHRC) (A,B) and Estonia (Estonian Crop Research Institute—ECRI) (C,D), applying two plant densities (40 and 50 plants m−2 in PHRC and 30 and 36 plants m−2 in ECRI) during the 2015 and 2016 growing seasons. Boxes with different capital letters were significantly different at p < 0.05 according to the analysis of the variace (ANOVA) and HSD (honestly significant difference) multiple range test of Tukey.
Agriculture 11 01042 g005
Table 1. Standardized Precipitation Index (SPI) for two vegetation seasons in Pūre Horticultural Research Centre (PHRC) and Estonian Crop Research Institute ECRI (per 10 days periods—decades).
MonthDecadePHRCECRI
2015201620152016
MayI−0.77−1.622.24−1.72
II2.155.36−1.75−2.34
III−1.42−1.97−1.35−2.52
JuneI−1.72−1.72−1.70−0.86
II−3.64−0.19−2.6713.24
III−3.41−2.090.33−0.10
JulyI−0.161.14−0.134.61
II−2.22−0.751.35−1.85
III2.61−0.99−1.01−2.43
AugustI−2.811.81−3.325.14
II−3.300.83−3.336.61
III−2.79−3.70−2.151.14
SeptemberI−1.73−1.384.06−1.13
Table 2. Soil characteristics and crop management systems for field trials established in Estonian Crop Research Institute (ECRI, Estonia) and Pūre Horticultural Research Centre (PHRC, Latvia) in 2015 and 2016.
ParameterSeason
20152016
ECRIPHRCECRIPHRC
Soil (plot) preparation before sowingPloughing autumn 2015.
Cultivation 2 times before sowing.
Ploughing autumn 2015.
Cultivation 2 times.
Ploughing autumn 2016.
Cultivation 2 times before sowing.
Ploughing autumn 2016.
Cultivation 2 times before sowing.
Sowing date5 May 20168 May 20155 May 20169 May 2016
Sowing depth (cm)4444
Humus content (g kg−1)30.731.034.634.6
Soil typeCalcaric cambisoilSoddy-calcarous podzolic
Soil textureSandy loamSandy loam
Plant available P in soil (mg kg−1)67.7127.659.6127.6
Plant available K in soil (mg kg−1)98.7105.9107.4105.9
pHKCl6.326.276.316.20
Preceding cropBarleyPerennial grassesOatPerennial grasses
FertilizationTypeN:P:K
(5:10:25)
N:P:K
(10:10:20)
N:P:K
(7:12:25)
N:P:K
(10:10:20)
Amount (kg ha−1)300300300300
Pest management-Decis Mega (deltametrin 50 g L−1) 150 Ml ha−1 (twice)-Decis Mega (deltametrin 50 g L−1) 150 mL ha−1.
Actara (tiametoksam 250 g kg−1) 0.08 kg ha−1.
Weds managementStomp (455 g L−1 pendimathalin) 1.5 L ha−1; Basagran (bentazon 480 g L−1) 1.5 L ha−1.
Hand weeding
Hand weedingActivus 330 (pendimethalin 330 g L−1) EC 3 L ha−1 + Basagran 480 (bentazon 480 g L−1) 1.5 L ha−1Hand weeding
Table 3. Estimates of the variance components in the Estonian Crop Research Institute (ECRI, Estonia) and Pūre Horticultural Research Centre (PHRC, Latvia) in 2015 and 2016.
LocationECRIPHRC
ParameterEstimates of the Variance ComponentsZ ValuePr > ZEstimates of the Variance ComponentsZ ValuePr > Z
Yield
Year1.26370.69000.24660.0000--- Z---
Block (year)0.13041.40000.08080.0000------
Residual0.30665.6100<0.00010.11885.9200<0.0001
Protein content
Year0.25600.62000.26820.65950.70000.2423
Block (year)0.12811.52000.06420.0000------
Residual0.17705.6100<0.00010.30515.8700<0.0001
Z—The estimation of the variance was zero.
Table 4. Main statistical parameters in trials with five cultivars of fava bean at two locations in the Estonian Crop Research Institute (ECRI, Estonia) and Pūre Horticultural Research Centre (PHRC, Latvia) in 2015 and 2016.
Factor ZDegrees of FreedomYieldProtein Concentration
ECRIPHRCECRIPHRC
Effect YF Valuep-ValueEffectF Valuep-ValueEffectF Valuep-ValueEffectF Valuep-Value
C4***6.740.0001***18.19<0.0001***102.65<0.0001***19.53<0.0001
D1N.s.0.290.5894N.s.0.080.7845N.s.1.650.2035N.s.0.000.9759
C × D4N.s.1.680.1646N.s.0.630.6445N.s.0.860.4943N.s.2.000.1049
Z C, cultivar; D, density; C × D, cultivar × density. Y N.s., not significant; *** significant at p < 0.001 according to the analysis of variance and multiple range test of Tukey. The denominator degrees of freedom varied between 63 and 70.
Publisher’s Note: MDPI stays neutral with regard to jurisdictional claims in published maps and institutional affiliations.

