Communication

Phone App to Perform Quality Control of Pesticide Spray Applications in Field Crops

by
Christian Nansen
1,*,
Gabriel Del Villar
2,
Alexander Recalde
2,
Elvis Alvarado
2 and
Krishna Chennapragada
2
1
Department of Entomology and Nematology, University of California, Davis, CA 95616, USA
2
Department of Computer Science, University of California, Davis, CA 95616, USA
*
Author to whom correspondence should be addressed.
Agriculture 2021, 11(10), 916; https://doi.org/10.3390/agriculture11100916
Submission received: 17 August 2021 / Revised: 21 September 2021 / Accepted: 22 September 2021 / Published: 24 September 2021
(This article belongs to the Section Crop Protection, Diseases, Pests and Weeds)

Abstract

:
It has been recognized for decades that low and inconsistent spray coverages of pesticide applications represent a major challenge to successful and sustainable crop protection. Deployment of water-sensitive spray cards combined with image analysis can provide valuable and quantitative insight into spray coverage. Herein we provide description of a novel and freely available smartphone app, “Smart Spray”, for both iOS and Android smart devices (iOS and Google app stores). More specifically, we provide a theoretical description of spray coverage, and we describe how Smart Spray and similar image-processing software packages can be used as decision support tools and quality control for pesticide spray applications. Performance assessment of the underlying pixel classification algorithm is presented, and we detail practical recommendations on how to use Smart Spray to maximize accuracy and consistency of spray coverage predictions. Smart Spray was developed as part of ongoing efforts to: (1) maximize the performance of pesticide sprays, (2) minimize pest-induced yield loss and to potentially reduce the amount of pesticide used, (2) reduce the risk of target pests developing pesticide resistance, (3) reduce the risk of spray drift, and (4) optimize spray application costs by introducing a quality control.

1. Introduction

Conventional (synthetic) and organic pesticides are applied to manage pests (insects, weeds, nematodes, diseases, etc.) in virtually all agricultural field cropping systems. Most commonly, pesticides are applied as liquid formulations with either tractor-mounted ground rigs or manned airplanes around time of planting, or to canopies of an established crop, such as strawberry plants (Figure 1a). In recent years, pesticide spray applications with unmanned actuating drone systems have also become commercially available, and are used in a wide range of cropping systems, especially in East Asia [1,2,3]. Drone-based pesticide spray applications typically involve considerably lower spray volumes than tractor-mounted spray applications [2]. Spray volume and average spray droplet size are generally correlated, and it is widely accepted that small spray droplets are less likely to penetrate deeply into crop canopies compared to larger spray droplets. Thus, with all else equal, the use of small spray volumes (and therefore also small droplets of spray) may increase the risk of low and inconsistent spray coverage.
As part of assessing the performance of pesticide applications, water-sensitive spray cards may be deployed prior to application, and image analyses of spray cards provide quantitative data on spray coverage (Figure 1b). Several image processing software packages are available (including: Snap Card, Droplet Scan®, Swath Kit®, Deposit Scan, Image J, and Drop Vision®-Ag) and have been compared [4]. The combination of deploying water-sensitive spray cards and image analysis of spray cards can provide valuable and quantitative insight into spray coverage and can therefore be used as quality control of spray applications. However, few of these image processing software packages are freely available, and few can be operated via built-in cameras in smartphones and tablets (most require external scanning devices). This article describes how quantitative data on spray coverage can be easily acquired with “Smart Spray”—a novel and freely available app for iOS and Android tablets and smart phones. Smart Spray represents a further development of an existing and freely available phone app (both iOS and Android versions), Snap Card, which has been described in a separate article [5]. By September 2021, Snap Card had been downloaded more than 10,000 times [6]. Tutorial videos on how to use Smart Spray are available online [7]. Smart Spray was developed and is being promoted as part of ongoing efforts to: (1) maximize the performance of pesticide sprays, to minimize pest-induced yield loss and to potentially reduce the amount of pesticide used, (2) reduce the risk of target pests developing pesticide resistance, (3) reduce the risk of spray drift, and (4) optimize spray application costs by introducing a quality control.

2. Spray Coverage

“Spray deposition” or “spray coverage” of a liquid pesticide application refers to the ground area or leaf surface to which pesticide formulations are applied. In field crops in the US, a standard pesticide application with tractor-mounted ground rigs is 20 gallons per acre, which equals 193.5 L per ha or about 20 mL per m2. Pesticide applications with drones involve considerably lower spray volumes [2]. Pesticide formulations are typically applied with nozzles delivering average droplet diameters ranging from 50–600 µm. It was considered beyond the scope of this article to describe important aspects affecting spray coverage, such as: flow rate, nozzle type, spray volume, and tank pressure nozzles. However, to briefly interpret effects of spray volumes and droplet sizes, we present some simple calculations of what we refer to as “potential spray coverage”. These simple calculations are based on two important assumptions: (1) that there is zero evaporation and drift, so the entire volume being delivered during spray applications is deposited onto the ground and crop surface, and (2) that distribution of droplets is perfectly uniform with zero overlap of droplets as they are deposited. Thus, calculations of potential spray coverage represent the highest possible spray coverage to achieve based on spray volume and droplet size.
“Droplet volume (µm3)” denotes the volume of a single droplet when measured in µm3. “Droplet volume (mL)” denotes the volume of a single droplet when measured in mL. “Droplets in 20 mL” denotes the total number of droplets in 20 mL (which is the amount of spray formulation commonly applied to 1 m2 during insecticide applications to field crops). “One droplet area (m2)” denotes the circle area of a single droplet when measured in m2. “Total droplet area (m2)” denotes “One droplet area” multiplied by the “Droplets in 20 mL” and is therefore a measurement of the circular area of all droplets. “Spray coverage (%)” denotes the “Total droplet area (m2)” as percentage of 1 m2, and it is an estimate of the potential spray coverage.
For average droplet sizes of 200 µm or larger applied to bare ground, potential spray coverage is about 16% (Table 1). However, the crop canopy adds to the surface area per m2 of a crop field and therefore reduces potential spray coverage. As an example, a crop canopy may consist of six plants per m2 with an average of 20 leaves. Individual leaves may have an average surface area of 50 cm2. If so (remembering that leaves have two sides, adaxial and abaxial), canopy surface area amounts to 1.2 m2, so the total surface equals 2.2 m2 (ground and canopy surface) and the potential spray coverage equals 7.3% (16%/2.2 m2). Although virtually impossible to quantify under real-world spray applications, it is inconceivable that a given spray application is performed with zero evaporation and spray drift, and that droplets do not merge while airborne or immediately after being deposited. Thus, spray applications of 193.5 L per ha (20 gallons per acre) with nozzles delivering average droplet sizes near 200 µm or larger into an average size crop canopy (around 1.2 m2 leaf surface area per m2) should not be expected to produce average spray coverages exceeding 5%. Portions of crop canopies closest to and facing spray nozzles will likely receive much higher spray coverage, while other portions of crop canopies (i.e., underside of leaves when applications are sprayed from above) have little or no spray coverage. Individual growers and their stakeholder organizations recognize the importance and challenges associated with obtaining high and consistent pesticide spray coverages. Obviously, issues and challenges associated with maximization of spray coverage increase with the size of crops and the density of their respective canopies. Achieving high and consistent pesticide spray coverage against spider mites (Tetranychus spp.) in the bottom canopy portions of tasseling maize plants (>1.5 m in height) or in mature walnut or almond orchards (>4 m in height and each tree with canopies >4 m in diameter) presents examples of such challenges. A 30-year-old quote summarizes the challenge well [8]: “Considering only a small fraction of pesticidal sprays reaches the target, more attention needs to be placed on developing techniques which increase crop canopy penetration. Quantification of where pesticides are going is clearly going to be emphasized by EPA [Environmental Protection Agency] as a mandatory process for all future registrants”. Unfortunately, most research into pesticide spray applications focuses mainly on what to apply, and less on how to apply pesticides with the highest likelihood of successful pest management. Furthermore, pesticide spray applications are performed under varying weather conditions, applied by different spray applicators, and conducted with different types of spraying equipment. Thus, inconsistency of pesticide spray applications should be recognized as a major challenge regarding effective and sustainable field crop protection.

3. Possible Consequences of Low and Inconsistent Pesticide Spray Coverages

Low and inconsistent spray coverages cause concerns about the immediate performance of pesticide applications, and poor results are referred to as “spray failures”, which may trigger a need for repetition of spray applications. Such repetitions represent additional costs to growers and are also sometimes hampered by legal constraints, as many pesticides may only be applied a certain number of times each growing season and/or have restrictions on minimum time between repeated spray applications. In addition, it must be recognized that, in the case of arthropod pests, low and inconsistent spray coverages imply that pest individuals are essentially offered a choice between foliage with and without insecticide. In large and dense crop canopies there may be considerable range, with some portions of the canopy having very high spray coverage, while other portions are virtually insecticide-free. Thus, under the assumption that arthropod pest individuals can associate tactile and/or olfactory cues with a given insecticide (and therefore with the risk of being killed), they may avoid portions of crop canopies in which they would become exposed to lethal dosages of insecticides. Such “behavioral resistance” (avoidance of insecticide) has been documented in multiple, and very different, insecticide-pest systems [9,10,11,12,13,14,15], and it is formally defined as: “Resistant insects may detector recognize a danger and avoid the toxin. Insects may simply stop feeding if they come across certain insecticides, or leave the area where spraying occurred (for instance, they may move to the underside of a sprayed leaf, move deeper in the crop canopy or fly away from the target area).” [16]. Finally, there are reasons to be concerned about possible links between low and inconsistent insecticide spray coverage and the long-term risk of physiological resistance evolution in target pest populations of insects, weeds, and other pests [17,18,19,20]. Inconsistent and low spray coverage is of particular concern when contact insecticides are applied, but it may also be of relevance to the long-term performance of systemic and translaminar insecticides [21].

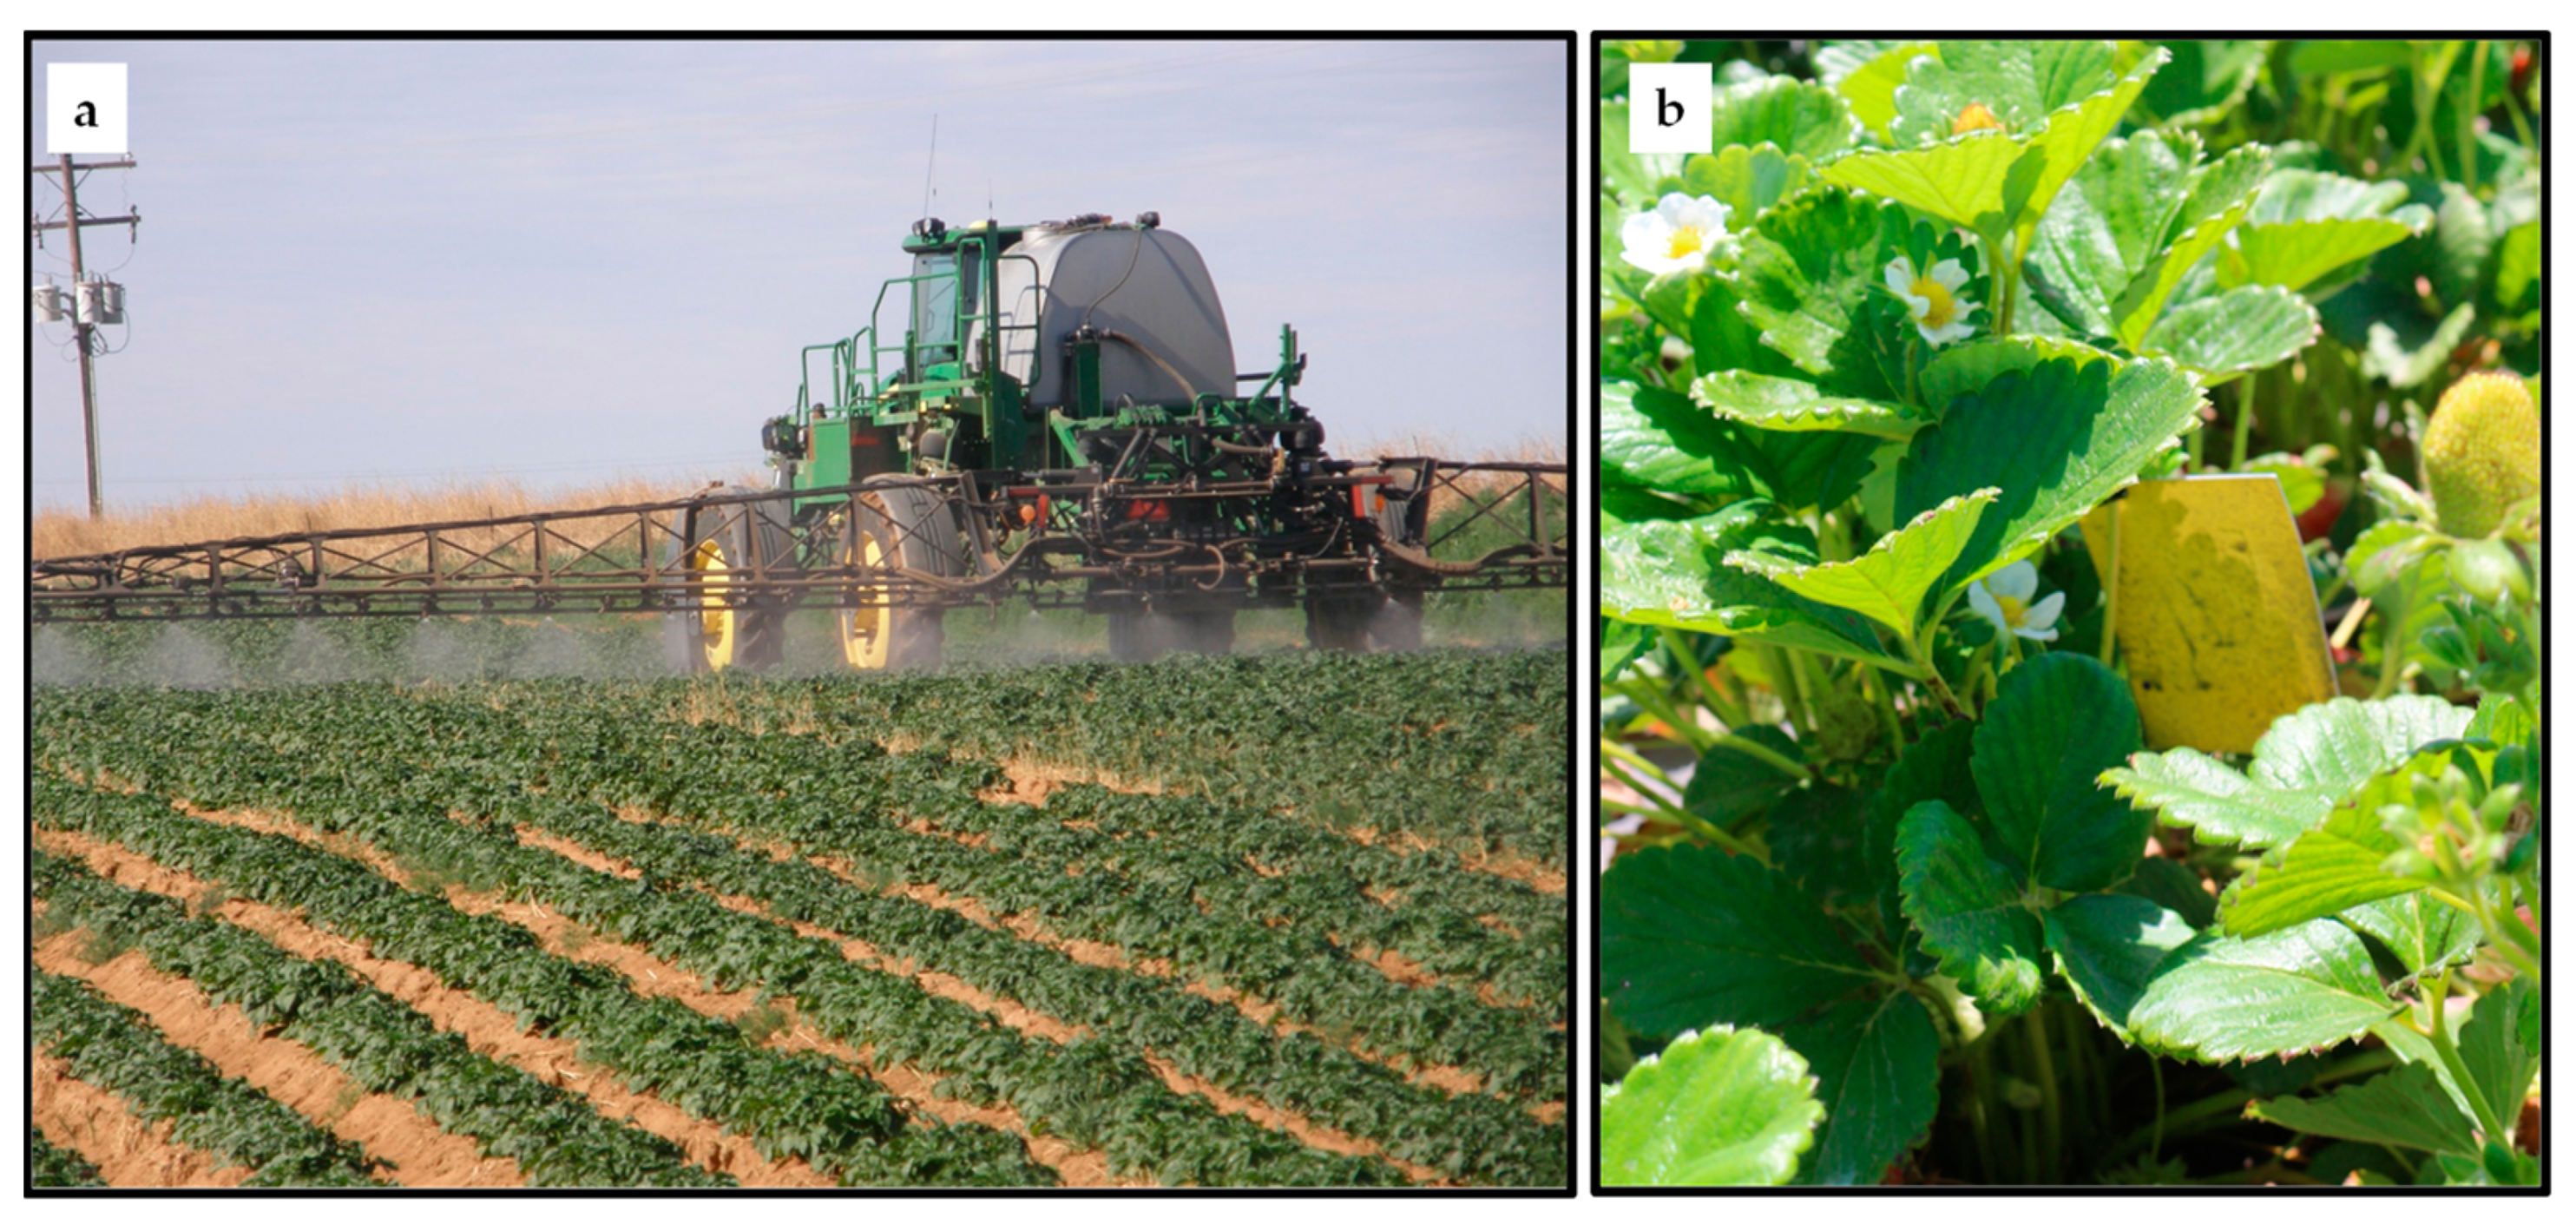
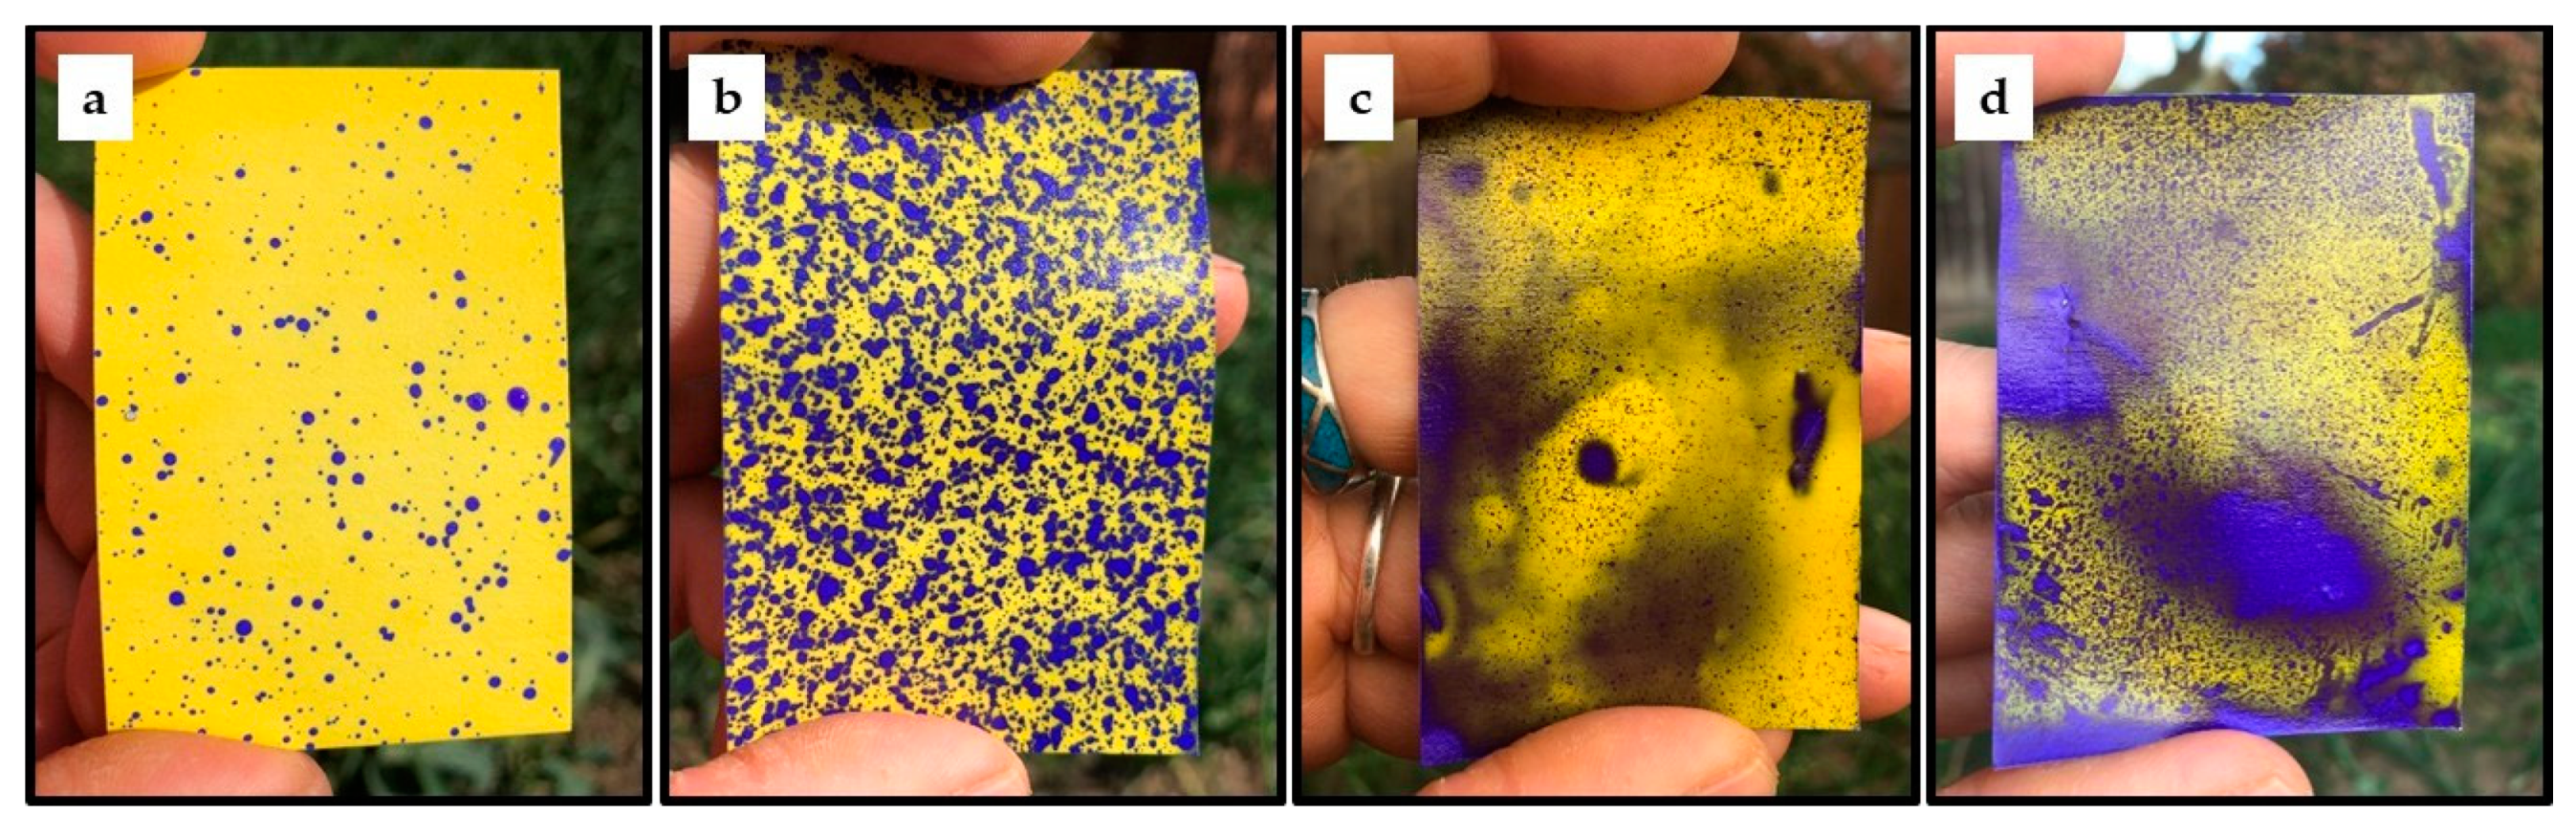
4. Water-Sensitive Spray Cards to Quantify Spray Coverage

Water-sensitive spray cards are coated with bromoethyl blue [22,23,24], and in reaction with water they turn brown/blue/purple depending on the size of the water droplets (Figure 1b and Figure 2). Under experimental conditions, water-sensitive spray cards provide highly accurate predictions of volumetric flow rate and mass of water applied during spray applications [25,26,27]. Furthermore, several studies describe methods based on image analysis of data from water-sensitive spray cards to quantify spray coverages [4,28,29,30,31,32,33,34,35,36]. Water-sensitive spray cards have been used to obtain quantitative data on spray coverage/deposition in field crop studies of pesticide applications with manned airplanes [22,37,38,39], unmanned drones [2,40], and tractor-mounted ground rigs [37,39,40]. A recent study confirmed that water-sensitive spray cards can be used to obtain spray coverage data in the strawberry canopy, and also identified nozzle height above the canopy, spray volume, and pressure as important factors that affect spray coverage [41]. In addition, there are numerous studies in which water-sensitive spray cards have been used to describe spray coverages in orchard crops [2,42,43,44,45].
Under favorable spray application conditions, i.e., high temperature, low wind, and low ambient relative humidity, spray coverage patterns on water-sensitive spray cards typically show a clear distinction between blue/purple spray droplets and the background (yellow spray card) (Figure 2a,b). Due to a clear contrast between the water-sensitive spray card and spray droplets, calculations of spray coverage are highly repeatable. However, Figure 2c,d show how water-sensitive spray cards sometimes turn blue-gray with less distinct spray droplets. It is our practical field experience that such blue-gray hazing of water-sensitive spray cards is not uncommon. At least two scenarios may cause this phenomenon: (1) Spray applications were performed with nozzles delivering very fine droplets (similar to mist). If so, a grayish color response should be considered a direct effect of spray application and should therefore be included in calculations of spray coverage. (2) Spray applications were performed under high-humidity environmental conditions, so grayish color responses may be considered an artefact and therefore to be excluded from estimates of spray coverage. Another important challenge associated with the interpretation of spray coverage based on water-sensitive spray cards is spray card saturation; this leads to pixels turning dark blue or purple (Figure 2d). Such intensely colored pixels may be actual spray droplets, or they may be the result of run-off from a leaf or from a clip used to mount water-sensitive spray cards within crop canopies. In these and similar situations, estimates of spray coverages may require that certain portions of spray cards are excluded. In Smart Spray, this is accomplished through the cropping of images of water-sensitive spray cards, so that background and unwanted portions of spray cards do not contribute to calculations of spray coverage.

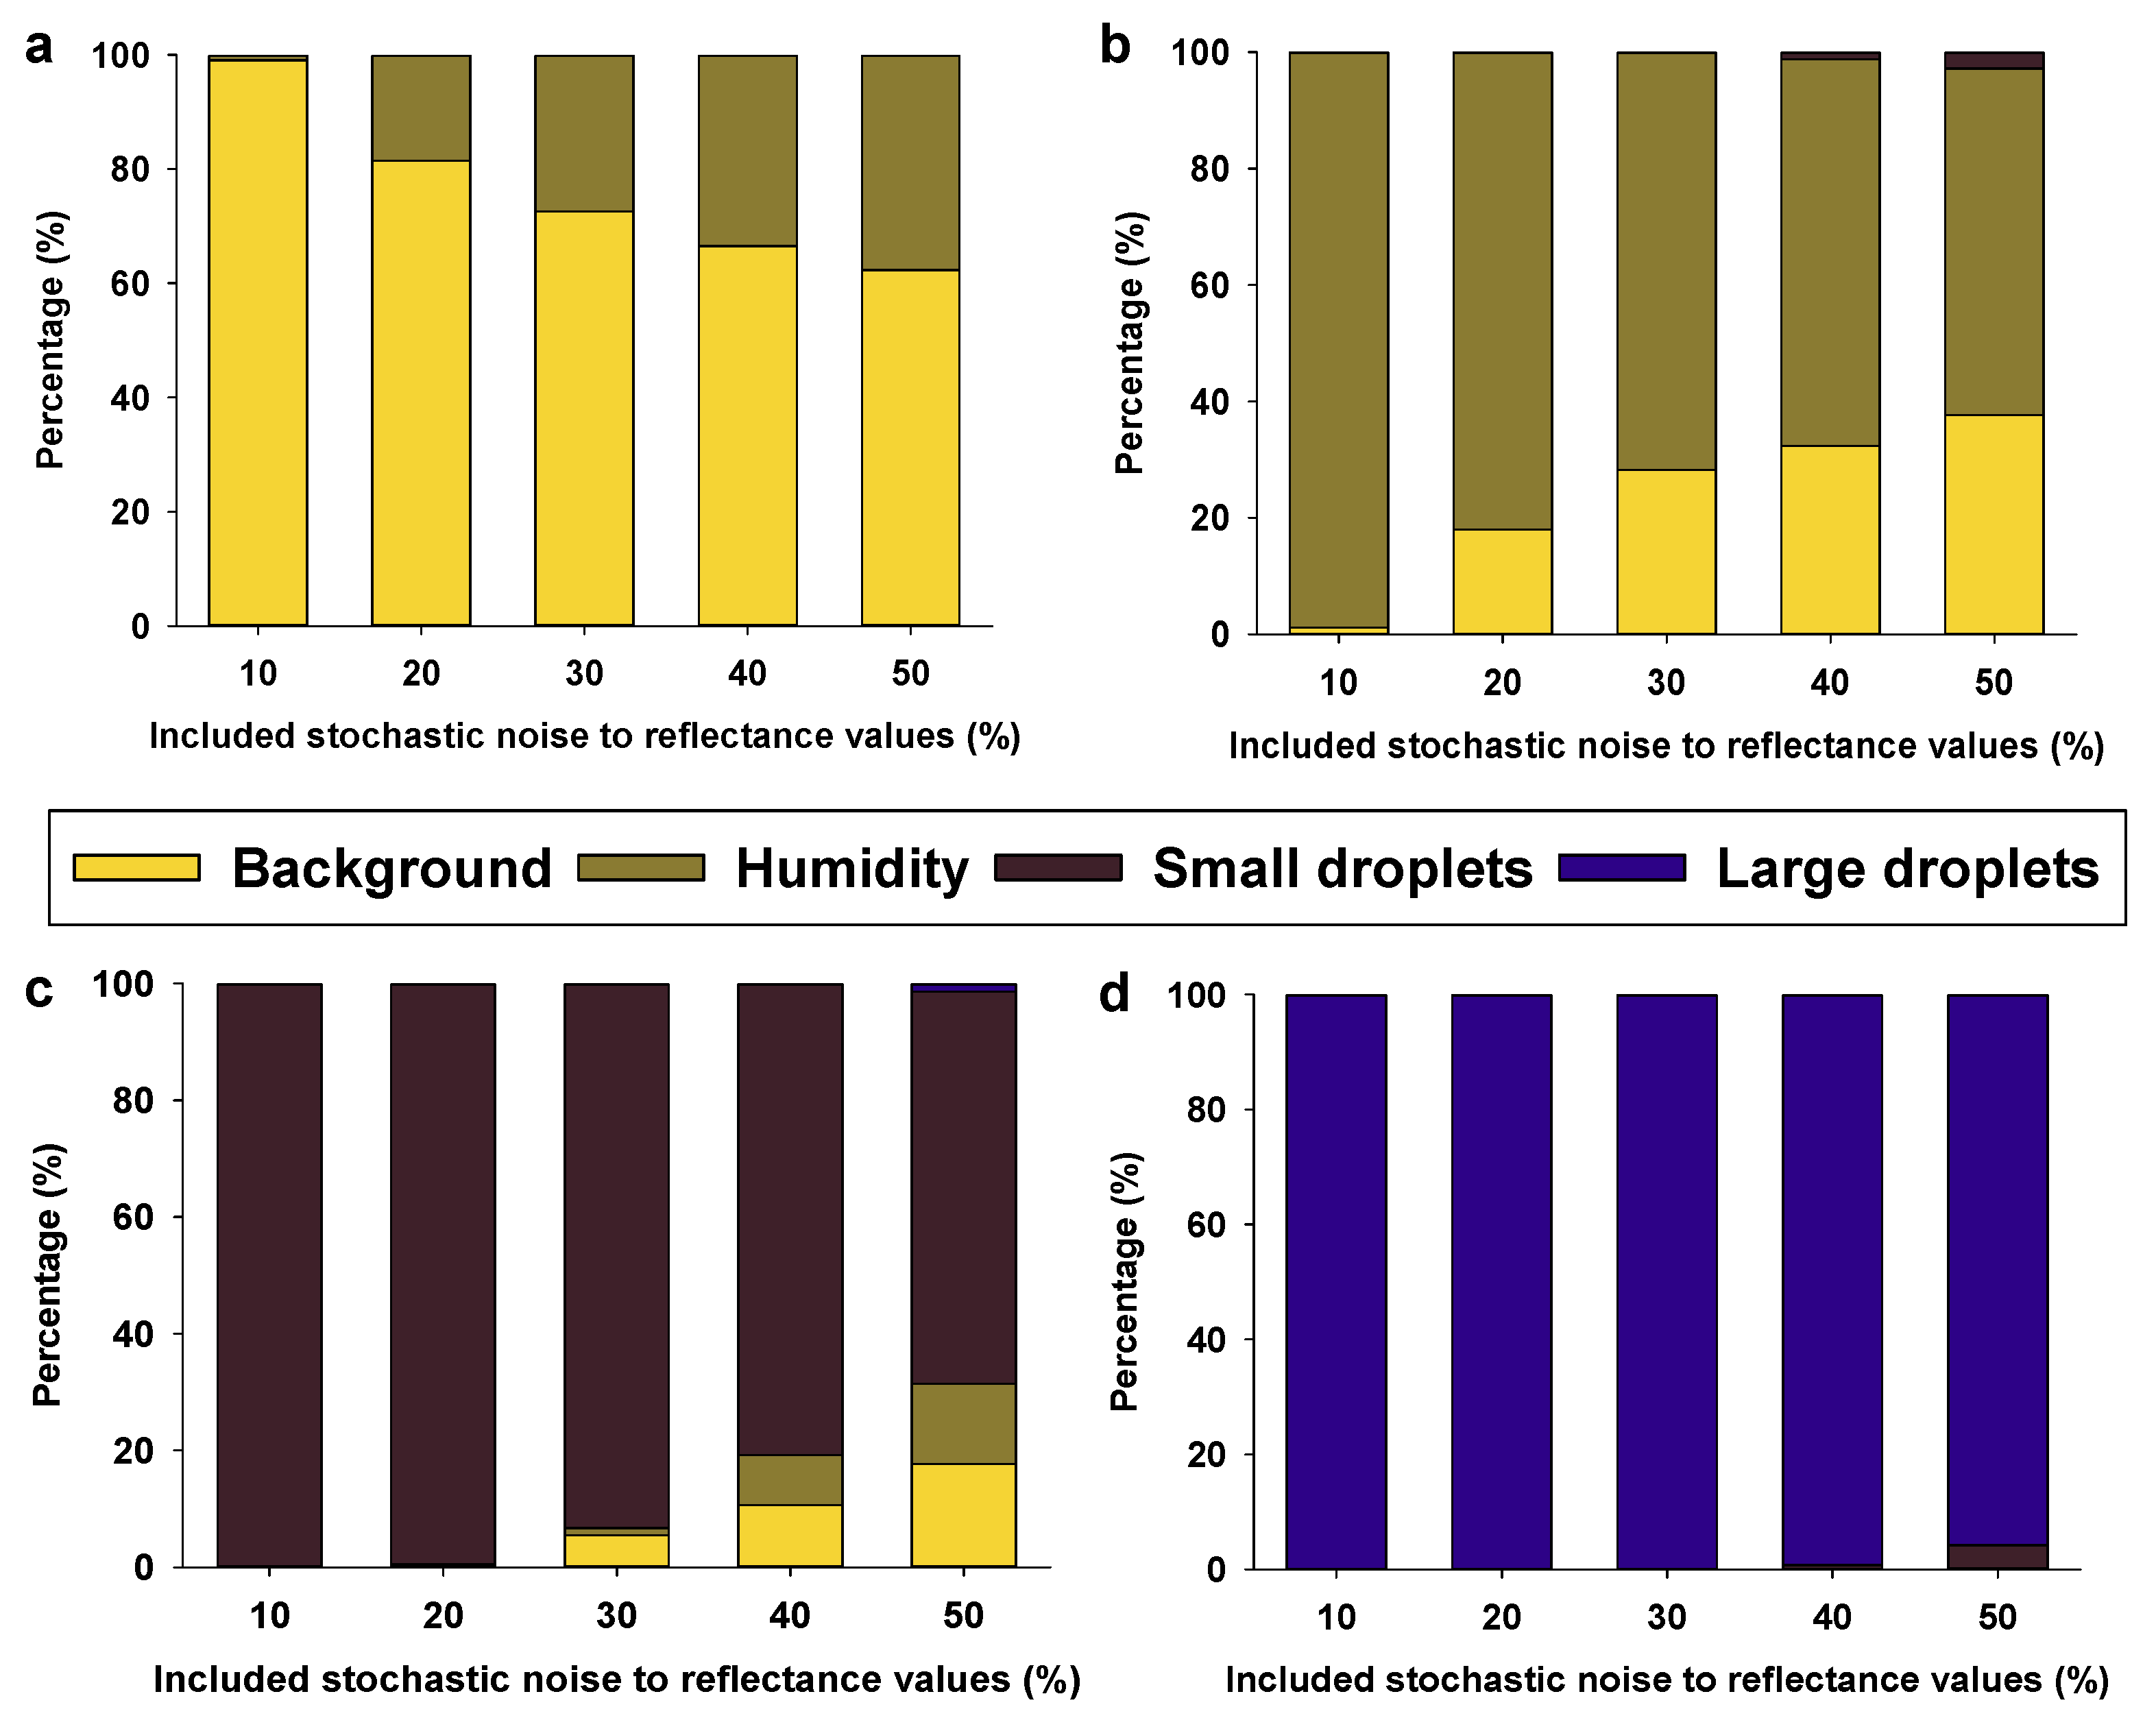
5. Pixel Classification to Quantify Pesticide Spray Coverages

Spray coverage may be assessed qualitatively based on visual inspection of water-sensitive spray cards (i.e., available Teejet® [46]). However, to maximize consistency and to obtain quantitative estimates of spray coverage, image processing software packages are needed, and several are available [4]. More recently, “Smart Spray” has been developed and is freely available in iOS and Google app stores. When smartphone apps are used to quantify spray coverage, color values of individual pixels are interpreted as level of spray coverage, and pixels are classified based on established color values in each of the three color channels (red, green, and blue). In Smart Spray, pixels are classified into four main classes: (1) B = Background (water-sensitive spray card), (2) S = Small droplets, (3) L = Large droplets, and (4) H = Humidity [blue-gray haze with no clear droplets, which most commonly does not represent spray application (see Figure 2c,d)].
Equation (1): Spray coverage
(%) = (S + L + H (include/exclude)) × 100/(B + S + L + H)
Thus, in Smart Spray, the user is given the option to include/exclude pixels in the “humidity” main class as representing either actual spray or background. Humidity-induced coloring of water-sensitive spray cards is of particular concern when spray applications are performed under humid ambient conditions (i.e., at night and/or in tropical regions). The risk and degree of humidity-induced coloring of water-sensitive spray cards are determined by a combination of ambient humidity and exposure time. It was considered beyond the scope of this article to provide specific details on relative effects of different ambient humidity conditions. However, users of Smart Spray concerned about humidity-induced coloring are advised to deploy additional spray cards outside the crop being sprayed, as such spray cards can be used as reference cards (to quantify the effect of ambient humidity).
To take into account slight variations in the coloring of water-sensitive spray cards due to different manufacturers, age (and storage conditions) of the spray cards, projection angle of images of the spray cards, distance between smart-device and spray card, and light conditions during imaging of the spray cards—we subdivided each of the four main classes of pixels (Table 2).
Average color values in each of the eight subclasses were based on averaging pixel data from approximately 2000 pixels from these eight subclasses, and this data set was used as training data. The training data represented water-sensitive spray cards deployed under a range of environmental conditions and obtained from field studies with a wide range of commercial spray rigs. In R v3.6.1 (The R Foundation for Statistical Computing, Vienna, Austria), we used the packages “MASS” and “caret”, to classify training data pixels based on linear discriminant analysis, (LDA) [48]. In the LDA, we used reflectance values in the three color channels (red, green, and blue), the total sum of the three color channels (red + green + blue), and four color channel ratios:
  • Blue channel/sum of three color channels
  • Green channel/sum of three color channels
  • Red channel/sum of three color channels
  • Red channel/green channel
Thus, in total, LDA classification of pixels was based on eight explanatory variables.

6. Classification Performance of Spray Coverage

Based on 10-fold cross-validation, the LDA classification of pixels was associated with an overall accuracy of 97%. More specifically, both background and humidity classes were classified with 100% accuracy, while 7.5% of small droplet pixels were misclassified as humidity, and 0.7% of pixels from small droplets were misclassified as large droplets. As a sensitivity analysis of the LDA classification, we examined the effects of adding 10–50% experimental stochastic noise to average values in the three color channels (Figure 3).
For instance, and as seen in Table 2, the color value in the blue channel for the first “Background” subclass = 44. Including ±10% stochastic noise in that color value meant the new color value would be between 39.6 and 48.8 (44 ± 4.4). Using average color values for all eight subclasses, we generated 1000 simulations for each of the five levels of stochastic noise, and determined accuracies of LDA classifications of the approximate pixels. Thus, this sensitivity analysis allowed us to quantify the robustness of the LDA classification by characterizing the association between added noise and classification accuracy.
Regarding the main class of background (Figure 3a), it can be seen that 5–10% of pixels were misclassified (mainly as humidity), when 40% or 50% noise was added. Regarding the main class of humidity (Figure 3b), addition of stochastic noise mainly led to pixels being misclassified as background, and misclassifications exceeded 30% when the level of added stochastic noise exceeded 40%. Regarding the main class of small droplets (Figure 3c), addition of stochastic noise exceeding 30% led to pixels being misclassified as humidity or background. Regarding the main class of large droplets (Figure 3d), addition of up to 50% stochastic noise caused only minor misclassification of pixels (misclassified as small droplets), which indicated that this main class was very robust. Overall, the sensitivity analysis showed that all four main classes were associated with a low percentage of misclassified pixels, as long as stochastic noise levels were below 30%. However, we demonstrated that the main classes, background and humidity, were somewhat sensitive to reciprocal misclassification. We also showed that the main class of small droplets was the most sensitive of the four main classes and somewhat sensitive to misclassification as either background or humidity. The main class of large droplets was found to be very robust, and misclassification was mainly of pixels being considered to represent small droplets and therefore not a major concern.

7. Effect of Light Conditions on Spray Coverage Estimates

Cameras in tablets and smart phones vary in terms of spatial resolution and have different automated and proprietary algorithms to process data into color representations of pixels. Consequently, an object imaged with two different smart devices but under the exact same conditions may yield slightly different results (pixel values). Another complication with automated and device-specific image processing and analyses is that light conditions may profoundly affect image quality and pixel values. In other words, imaging of the same water-sensitive spray card under different light conditions (but with constant projection angle and distance between smart device and spray card) may yield different predictions of spray coverage.
Figure 4 shows how the main classes, background and humidity, were especially sensitive to light conditions, while the sum of small and large droplet percentages remained fairly consistent across light conditions. In order to quantify the effects of light conditions, Smart Spray was tested by generating spray coverage estimates of the same 20 water-sensitive spray cards on a white background (as shown in Figure 4a) and with images taken of each water-sensitive spray card under four different light conditions: (1) inside without direct sun light and no artificial light, (2) inside with direct sun light and no artificial light, (3) inside an open garage (no direct sunlight and simulating shade), and (4) outside with direct sunlight. With 20 water-sensitive spray cards, four lighting scenarios, and two Smart Spray versions (iOS and Android), a total of 160 spray coverage estimates were generated. During imaging of water-sensitive spray cards, we avoided shadows and glare. We used the rcorr function in the Hmisc package in R to produce correlation matrices and examine the significance of pairwise Spearman correlations for all four main classes of pixels (background, humidity, and small and large droplets) (Table 3).
All correlations were highly significant (p-value < 0.001), therefore suggesting a considerable robustness of pixel classifications to light conditions and user-specific factors (Table 3). All correlations with the Android version exceeded 0.88, while two correlations with the iOS version (highlighted in bold in Table 3) were below 0.80. Both of these lowest correlations involved data acquired outside under shade, and they were associated with the main class of humidity.

8. Use and Practical Recommendations Regarding Smart Spray

Tutorial videos on how to use Smart Spray are available online [7]. It is important to highlight that water-sensitive spray cards react to humidity, which means that they have limited use under highly humid environmental conditions. Smart Spray includes a “humidity filter” to partially correct for this issue, but it is unlikely to yield meaningful results under high ambient humidity conditions. During spray applications, 2–3 “control” or “reference” spray cards may be placed outside the crop being sprayed to estimate humidity-induced gray-coloration of water-sensitive spray cards, and thereby used to “calibrate” spray coverage estimates. Water-sensitive spray cards should be imaged while on top of a white background to minimize the influence of light conditions and device-specific color correction features. Users should attempt to standardize distance and projection angle of the water-sensitive spray cards being imaged. A minimum of 10 water-sensitive spray cards should be deployed within a crop field, so that it is possible to identify representative trends in spray coverage estimates. It is important to standardize the placement of spray cards in crop canopies. This is particularly important in large and dense crops, such as orchard trees, fully grown corn, or sugar cane. Standardization of spray card placement includes ensuring both a vertical position in the canopy and a consistent depth within the crop canopy (near the center or periphery of individual plants). It also concerns whether to place water-sensitive spray cards so that they all face upwards or downwards. Finally, it may include standardization of whether water-sensitive spray cards face towards or away from the moving tractor, airplane, or drone. Alternatively, water-sensitive spray cards may be placed in pairs, one in horizontal position (yellow side facing upwards) and one in vertical position. Essentially, the placement of water-sensitive spray cards should be standardized as much as possible, as spray card placement in crop canopies greatly influences estimates of spray coverage.
For consistent use of Smart Spray across smart-device versions and light conditions, the recommendation is to acquire spray card data after placing water-sensitive spray cards on top of a white background, and to acquire card data inside (i.e., inside a vehicle) or outside under direct sunlight. If water-sensitive spray cards are analyzed in locations with limited direct sunlight (i.e., cloudy weather), we recommend data acquisitions from water-sensitive spray cards inside without direct sunlight. If a user needs to specifically estimate humidity coverage and uses the iOS version, we recommend acquiring data from water-sensitive spray cards either outside under sunlight or inside without direct sunlight.

9. Final Comments

For decades, concerns about spray coverage have been highlighted as a major challenge and an impediment to the implementation of effective and sustainable pest management. Deployment of water-sensitive spray cards, combined with quantitative assessments of spray coverage, may provide partial insight into ways to optimize the likelihood of higher and more consistent pesticide spray applications. For several years a number of image processing software packages have been available and used to quantify spray coverage based on water-sensitive spray cards. However, most of them require external scanners and are therefore less practical under field conditions. We recognize that data acquired from water-sensitive spray cards have limitations, but, in combination with image-based classification from in-built cameras, we argue that their usefulness far exceeds their shortcomings. Furthermore, challenges associated with meaningful interpretation of data from water-sensitive spray cards underscore the need for consistent and automated decision support tools. The fact that water-sensitive spray cards are readily available and easy to use (especially when spray coverage can be estimated in real-time with apps, such as Smart Spray), and can be purchased at a fraction of the cost of pesticide spray applications, these spray cards can be used in combination with other sources of quantitative data in important ways: (1) to maximize the performance of pesticide sprays, (2) to minimize pest-induced yield loss and potentially reduce the amount of pesticide used, (3) to reduce the risk of target pests developing pesticide resistance, (4) to reduce the risk of spray drift, and (5) to optimize spray application costs by introducing a quality control.
In future studies, we plan to develop additional features of Smart Spray, so that the app can be used to predict spray coverages based on spray settings, canopy characteristics, and weather conditions. We envision Smart Spray being used by researchers to compare spray coverages when pesticide spray applications are performed in different commercial cropping systems, and/or when different spray nozzles or other types of spray equipment are tested experimentally. If decision support tools such as Smart Spray become more widely adopted by growers, it may be possible to influence pesticide companies to provide more specific and quantitative information and recommendations on pesticide labels. As a representative example, the Syngenta Chess® label states the following under 5.3 General Directions, b) Equipment [49]: “Use suitable atomising equipment (hydraulic nozzles or rotary atomisers) that will produce the desired droplet size and coverage but which will ensure the minimum loss of product either through endodrift (within target field) or exodrift (outside target field).”. Such language is found on virtually all pesticide labels. Obvious and important questions related to this statement on the label are: What is meant by “suitable atomising equipment”, and how to ensure “minimum loss of product”? Under the assumption of quantitative spray coverage data being readily available, the Syngenta Chess® label could state that applications of this insecticide should be performed in such a way that spray coverage exceeds a certain threshold, such as 5% or 10%, based on an average of data acquired from 10–15 water-sensitive spray cards. Moreover, we argue that Smart Spray and similar decision support tools may lead to significant improvements to experimental studies of pesticide spray applications. In addition, these decision support tools may enable agricultural extension services and pesticide manufacturers to provide more precise and quantitative recommendations about quality control and the appropriate spraying of pesticides.

Author Contributions

Conceptualization, C.N.; methodology, C.N.; software, G.D.V., A.R., E.A. and K.C.; validation, G.D.V., A.R., E.A. and K.C.; formal analysis, C.N.; investigation, all.; resources, all; data curation, C.N.; writing—original draft preparation, C.N.; writing—review and editing, all; visualization, all; supervision, C.N.; project administration, C.N.; funding acquisition, C.N. All authors have read and agreed to the published version of the manuscript.

Funding

This study was partially sponsored through a combination of funding from the California Strawberry Commission and from USDA/ARS Floriculture, Nursery Research Initiative.

Institutional Review Board Statement

Not applicable.

Informed Consent Statement

Not applicable.

Data Availability Statement

Not applicable.

Conflicts of Interest

The authors declare no conflict of interest.

References

  1. Yu, S.-H.; Kim, Y.-K.; Jun, H.-J.; Choi, I.S.; Woo, J.-K.; Kim, Y.-H.; Yun, Y.-T.; Choi, Y.; Alidoost, R.; Lee, J. Evaluation of spray characteristics of pesticide injection system in agricultural drones. J. Biosyst. Eng. 2020, 45, 272–280. [Google Scholar] [CrossRef]
  2. Li, X.; Giles, D.K.; Niederholzer, F.J.; Andaloro, J.T.; Lang, E.B.; Watson, L.J. Evaluation of an unmanned aerial vehicle as a new method of pesticide application for almond crop protection. Pest Manag. Sci. 2021, 77, 527–537. [Google Scholar] [CrossRef]
  3. He, X. Rapid development of unmanned aerial vehicles (UAV) for plant protection and application technology in China. Outlooks Pest Manag. 2018, 29, 162–167. [Google Scholar] [CrossRef]
  4. Ferguson, J.C.; Chechetto, R.G.; O’Donnell, C.C.; Fritz, B.K.; Hoffmann, W.C.; Coleman, C.E.; Chauhan, B.S.; Adkins, S.W.; Kruger, G.R.; Hewitt, A.J. Assessing a novel smartphone application—SnapCard, compared to five imaging systems to quantify droplet deposition on artificial collectors. Comput. Electron. Agric. 2016, 128, 193–198. [Google Scholar] [CrossRef] [Green Version]
  5. Nansen, C.; Ferguson, J.C.; Moore, J.; Groves, L.; Emery, R.; Garel, N.; Hewitt, A. Optimizing pesticide spray coverage using a novel web and smartphone tool, SnapCard. Agron. Sustain. Dev. 2015, 35, 1075–1085. [Google Scholar] [CrossRef]
  6. Google App Store. Available online: https://play.google.com/store/apps/details?id=com.dafwa.snapcard&hl=en_US (accessed on 23 September 2021).
  7. Smart Spray. Available online: http://chrnansen.wixsite.com/nansen2/smartspray (accessed on 23 September 2021).
  8. Hall, F.; Reed, J.P.; Reichard, D.L.; Riedel, R.M.; Lehtinen, J. Pesticide Delivery Systems: Spray Distribution and Partitioning in Plant Canopies Pesticide Formulations and Application Systems; Bode, L., Hazen, J., Chasin, D., Eds.; ASTM International: West Conshohocken, PA, USA, 1990; Volume 10, pp. 184–203. [Google Scholar]
  9. Hostetler, M.E.; Brenner, R.J. Behavioral and physiological resistance to insecticides in the German cockroach (Dictyoptera: Blattellidae): An experimental reevaluation. J. Econ. Entomol. 1994, 87, 885–893. [Google Scholar] [CrossRef]
  10. Lockwood, J.A.; Byford, R.L.; Story, R.N.; Sparks, T.C.; Quisenberry, S.S. Behavioral resistance to the pyrethroids in the Horn Fly, Haematobia irritans (Diptera: Muscidae). Environ. Entomol. 1985, 14, 873–880. [Google Scholar] [CrossRef]
  11. Nansen, C.; Baissac, O.; Nansen, M.; Powis, K.; Baker, G. Behavioral avoidance—Will physiological insecticide resistance level of insect strains affect their oviposition and movement responses? PLoS ONE 2016, 11, e0149994. [Google Scholar] [CrossRef] [PubMed] [Green Version]
  12. Wang, C.L.; Scharf, M.E.; Bennett, G.W. Behavioral and physiological resistance of the German cockroach to gel baits (Blattodea: Blattellidae). J. Econ. Entomol. 2004, 97, 2067–2072. [Google Scholar] [CrossRef]
  13. Sarfraz, M.; Dosdall, L.M.; Keddie, B.A. Resistance of some cultivated Brassicaceae to infestations by Plutella xylostella (L.) (Lepidoptera: Plutellidae). J. Econ. Entomol. 2007, 100, 215–224. [Google Scholar] [CrossRef]
  14. Sarfraz, M.; Dosdall, L.M.; Keddie, B.A. Evidence for behavioural resistance by the diamondback moth, Plutella xylostella (L.). J. Appl. Entomol. 2005, 129, 340–341. [Google Scholar] [CrossRef]
  15. Jallow, M.F.A.; Hoy, C.W. Indirect selection for increased susceptibility to permethrin in diamondback moth (Lepidoptera: Plutellidae). J. Econ. Entomol. 2007, 100, 526–533. [Google Scholar] [CrossRef] [PubMed]
  16. Anonymous. Mechanisms. Available online: http://www.irac-online.org/about/resistance/mechanisms/ (accessed on 12 June 2021).
  17. Renton, M.; Busi, R.; Neve, P.; Thornby, D.; Vila-Aiub, M. Herbicide resistance modelling: Past, present and future. Pest Manag. Sci. 2014, 70, 1394–1404. [Google Scholar] [CrossRef]
  18. Renton, M.; Diggle, A.; Sudheesh, M.; Powles, S. Does cutting herbicide rates threaten the sustainability of weed management in cropping systems? J. Theor. Biol. 2011, 283, 14–27. [Google Scholar] [CrossRef] [PubMed]
  19. Powles, S.B.; Yu, Q. Evolution in action: Plants resistant to herbicides. Annu. Rev. Plant Biol. 2010, 61, 317–347. [Google Scholar] [CrossRef] [Green Version]
  20. Mortensen, D.A.; Egan, J.F.; Maxwell, B.D.; Ryan, M.R.; Smith, R.G. Navigating a critical juncture for sustainable weed management. BioScience 2012, 62, 75–84. [Google Scholar] [CrossRef] [Green Version]
  21. Khodaverdi, H.; Fowles, T.; Bick, E.; Nansen, C. Does drought increase the risk of insects developing behavioral resistance to systemic insecticides? J. Econ. Entomol. 2016, 109, 2027–2031. [Google Scholar] [CrossRef] [Green Version]
  22. Hill, B.D.; Inaba, D.J. Use of water-sensitive paper to monitor the deposition of aerially applied insecticides. J. Econ. Entomol. 1989, 82, 974–980. [Google Scholar] [CrossRef]
  23. Turner, C.R.; Huntington, K.A. The use of a water sensitive dye for the detection and assessment of small spray droplets. J. Agric. Eng. Res. 1970, 15, 385–387. [Google Scholar] [CrossRef]
  24. Syngenta. Water-Sensitive Paper for Monitoring Spray Distributions; Syngenta Crop Protection: Basel, Switzerland, 2002. [Google Scholar]
  25. Sama, M.P.; Evans, J.T.; Turner, A.P.; Dasika, S.S. As-applied estimation of volumetric flow rate from a single sprayer nozzle series using water-sensitive spray cards. Trans. ASABE 2016, 59, 861–869. [Google Scholar] [CrossRef]
  26. Sama, M.P.; Weiss, A.M.; Benedict, E.K. Validating spray coverage rate using liquid mass on a spray card. Trans. ASABE 2018, 61, 887–895. [Google Scholar] [CrossRef]
  27. Fox, R.D.; Salyani, M.; Cooper, J.A.; Brazee, R.D. Spot size comparisons on oil- and water-sensitive paper. Appl. Eng. Agric. 2001, 17, 131. [Google Scholar]
  28. Cunha, J.P.A.R.; Farnese, A.C.; Olivet, J.J. Computer programs for analysis of droplets sprayed on water sensitive papers. Planta Daninha 2013, 31, 715–720. [Google Scholar] [CrossRef] [Green Version]
  29. Marçal, A.R.S.; Cunha, M. Image processing of artificial targets for automatic evaluation of spray quality. Trans. ASABE 2008, 51, 811–821. [Google Scholar] [CrossRef] [Green Version]
  30. Zhu, H.; Salyani, M.; Fox, R.D. A portable scanning system for evaluation of spray deposit distribution. Comput. Electron. Agric. 2011, 76, 38–43. [Google Scholar] [CrossRef]
  31. Cunha, M.; Carvalho, C.; Marcal, A.R.S. Assessing the ability of image processing software to analyse spray quality on water-sensitive papers used as artificial targets. Biosyst. Eng. 2012, 111, 11–23. [Google Scholar] [CrossRef] [Green Version]
  32. Degre, A.; Mostade, O.; Huyghebaert, B.; Tissot, S.; Debouche, C. Comparison by image processing of target supports of spray droplets. Trans. ASAE 2001, 44, 217–222. [Google Scholar] [CrossRef]
  33. Garcia, L.C.; Ramos, H.H.; Justino, A. Evaluation of software for analysis of spraying parameters carried over water-sensitive papers (Availação de softwares para análise de parâmetros da pulverização realizada sobre papéis hidrossensíveis). Rev. Bras. Da Agrocomputação 2004, 2, 19–28. [Google Scholar]
  34. Özlüoymak, Ö.B.; Bolat, A. Development and assessment of a novel imaging software for optimizing the spray parameters on water-sensitive papers. Comput. Electron. Agric. 2020, 168, 105104. [Google Scholar] [CrossRef]
  35. Hoffman, W.C.; Hewitt, A.J. Comparison of three imaging systems for water-sensitive papers. Appl. Eng. Agric. 2005, 21, 961–964. [Google Scholar] [CrossRef]
  36. Wolf, R.E. Assessing the ability of DropletScan to analyze spray droplets from a ground operated sprayer. Appl. Eng. Agric. 2003, 19, 525–530. [Google Scholar]
  37. Latheef, M.A.; Carlton, J.B.; Kirk, I.W.; Hoffmann, W.C. Aerial electrostatic-charged sprays for deposition and efficacy against sweet potato whitefly (Bemisia tabaci) on cotton. Pest Manag. Sci. 2008, 65, 744–752. [Google Scholar] [CrossRef] [PubMed]
  38. Latheef, M.A.; Kirk, I.W.; Bouse, L.F.; Carlton, J.B.; Hoffmann, W.C. Evaluation of aerial delivery systems for spray deposition and efficacy against sweet potato whitefly on cotton. Appl. Eng. Agric. 2008, 24, 415–422. [Google Scholar] [CrossRef]
  39. Nansen, C.; Vaughn, K.; Xue, Y.; Rush, C.; Workneh, F.; Goolsby, J.; Troxclair, N.; Anciso, J.; Gregory, A.; Holman, D.; et al. A decision-support tool to predict spray deposition of insecticides in commercial potato fields and its implications for their performance. J. Econ. Entomol. 2011, 104, 1138–1145. [Google Scholar] [CrossRef]
  40. Hunter, J.E.; Gannon, T.W.; Richardson, R.J.; Yelverton, F.H.; Leon, R.G. Coverage and drift potential associated with nozzle and speed selection for herbicide applications using an unmanned aerial sprayer. Weed Technol. 2020, 34, 235–240. [Google Scholar] [CrossRef]
  41. Fink, C.; Banuelos, J.; Rossi, L.; Barker, M.; Edsall, M.; Olivier, D.; Lin, J. An evaluation of spray rig designs for California strawberries using water-sensitive paper. Int. J. Fruit Sci. 2020, 20, 997–1004. [Google Scholar] [CrossRef]
  42. Bock, C.H.; Hotchkiss, M.W.; Cottrell, T.E.; Wood, B.W. The effect of sample height on spray coverage in mature pecan trees. Plant Dis. 2015, 99, 916–925. [Google Scholar] [CrossRef]
  43. Bock, C.; Hotchkiss, M.W. A comparison of ground-based air-blast sprayer and aircraft application of fungicides to manage scab in tall pecan trees. Plant Dis. 2020, 104, 1675–1684. [Google Scholar] [CrossRef]
  44. Siegel, J.P.; Strmiska, M.M.; Niederholzer, F.J.A.; Giles, D.K.; Walse, S.S. Evaluating insecticide coverage in almond and pistachio for control of navel orangeworm (Amyelois transitella) (Lepidoptera: Pyralidae). Pest Manag. Sci. 2019, 75, 1435–1442. [Google Scholar] [CrossRef]
  45. Abbott, C.P.; Beckerman, J.L. Incorporating adjuvants with captan to manage common apple diseases. Plant Dis. 2018, 102, 231–236. [Google Scholar] [CrossRef] [Green Version]
  46. Teejet. Available online: www.teejet.com (accessed on 23 September 2021).
  47. Rapid Tables. Available online: https://www.rapidtables.com/web/color/RGB_Color.html (accessed on 23 September 2021).
  48. Fisher, R.A. The use of multiple measurements in taxonomic problems. Ann. Eugen. 1936, 7, 179–188. [Google Scholar] [CrossRef]
  49. Syngenta Chess Label. Available online: https://www.syngenta.co.za/product/crop-protection/chess (accessed on 23 September 2021).
Figure 1. Typical ground rig pesticide application to strawberry crop (a). Water-sensitive spray card placed in vertical position in strawberry canopy (b). Small blue dots represent spray droplets and can be used to estimate pesticide spray coverage.
Agriculture 11 00916 g001
Figure 2. Water-sensitive spray cards with distinct blue spray droplets (a,b). Distinct droplets scattered in a range of diameters typically result from pesticide spray applications performed with large-droplet nozzles and/or under low relative humidity conditions. Less discrete spray droplets, which may appear as blue-gray shading (c,d). Such blue-gray haze may result from pesticide spray applications with very small-droplet nozzles, but most commonly it is due to high relative humidity conditions (in which case blue-gray haze should be excluded from spray coverage estimate).
Agriculture 11 00916 g002
Figure 3. Sensitivity analysis of pixel classifications of the main classes Background (a), Humidity (b), Small droplets (c), and Large droplets (d). We added the following levels of stochastic noise: ±10%, ±20%, ±30%, ±40%, and ±50% to color values, and quantified to what extent the addition of noise reduced classification accuracy.
Agriculture 11 00916 g003
Figure 4. Effects of light conditions on spray coverage estimates. A water-sensitive spray card (a) was analyzed (iOS version of Smart Spray) under four different light regimes: inside without direct sun light and no artificial light (b), inside with direct sun light and no artificial light (c), inside an open garage (no direct sunlight and simulating shade) (d), and outside with direct sunlight (e).
Agriculture 11 00916 g004
Table 1. Potential spray coverage based on average droplet diameter.
Average Droplet Diameter (µm)
50100200300400500600
Volume of single droplet (µm3)6.55 × 1045.24 × 1054.19 × 1061.40 × 1073.35 × 1076.54 × 1071.13 × 108
Volume of single droplet (mL)6.55 × 10−85.24 × 10−74.19 × 10−61.40 × 10−53.35 × 10−56.54 × 10−51.13 × 10⁻⁴
Droplets in 20 mL3.06 × 1083.82 × 1074.77 × 1061.43 × 1065.97 × 1053.06 × 1051.77 × 105
Area of single droplet (m2)1.96 × 10−97.85 × 10−93.14 × 10−87.07 × 10−81.26 × 10−71.96 × 10−72.83 × 10⁻⁷
Total droplet area (m2)0.5990.3000.1500.1010.0750.0600.050
Spray coverage (%)59.930.015.010.17.56.05.0
Table 2. Average values in color channels for main classes of pixels on water-sensitive spray cards.
Color Channel
Main ClassRedGreenBlueCode
Background22919644E5C42C
Background24322597F3E161
Small droplet52332934211D
Small droplet644261402A3D
Large droplet37889250859
Large droplet4641722E04AC
Humidity10994356D5E23
Humidity158151829E9752
Average color values for each channel (red, green, and blue) are based on 8-bit data (0–255) from a training data set of approximately 2000 pixels. Actual average color of each of the eight subclasses is visualized in the far-right column with the accompanying internationally recognized code for each color [47].
Table 3. Experimental testing of effects of light conditions.
DeviceCondition 1Condition 2BackgroundSmallLargeHumidityAverage
AndroidIn_shadeIn_light0.9870.9840.9550.8970.975
AndroidIn_shadeOut_shade0.9740.9950.9860.8800.985
AndroidIn_lightOut_shade0.9920.9930.9590.9680.981
AndroidIn_shadeOut_light0.9900.9880.9850.9090.988
AndroidIn_lightOut_light0.9910.9960.9700.9700.986
AndroidOut_shadeOut_light0.9820.9940.9860.9620.987
iOSIn_shadeIn_light0.9900.9620.9900.9860.981
iOSIn_shadeOut_shade0.9390.9640.9950.8020.966
iOSIn_lightOut_shade0.9620.9850.9980.7820.982
iOSIn_shadeOut_light0.9910.9860.9870.9690.988
iOSIn_lightOut_light0.9860.9820.9990.9850.989
iOSOut_shadeOut_light0.9270.9720.9960.7290.965
Android 0.9860.9920.9740.9310.984
iOS 0.9660.9750.9940.8760.978
Total 0.9760.9830.9840.9030.981
Publisher’s Note: MDPI stays neutral with regard to jurisdictional claims in published maps and institutional affiliations.

