
Antioxidant, Antifungal and Phytochemical Investigations of Capparis spinosa L.


Abstract
:1. Introduction
2. Materials and Methods
2.1. Crude Material
2.2. Extraction
2.3. Liquid-Liquid Partition
2.4. Phytochemical Screening
2.4.1. Determination of the Total Phenolics Compounds
2.4.2. Total Flavonoid
2.4.3. Total Condensed Tannin
2.4.4. Py-GC-MS
2.4.5. Infrared Analysis
2.5. Antioxidant Activities
2.5.1. DPPH Assay
2.5.2. FRAP Assay (Ferric Reducing-Antioxidant Power)
2.6. Antifungal Activity
2.7. Data Analysis
3. Results
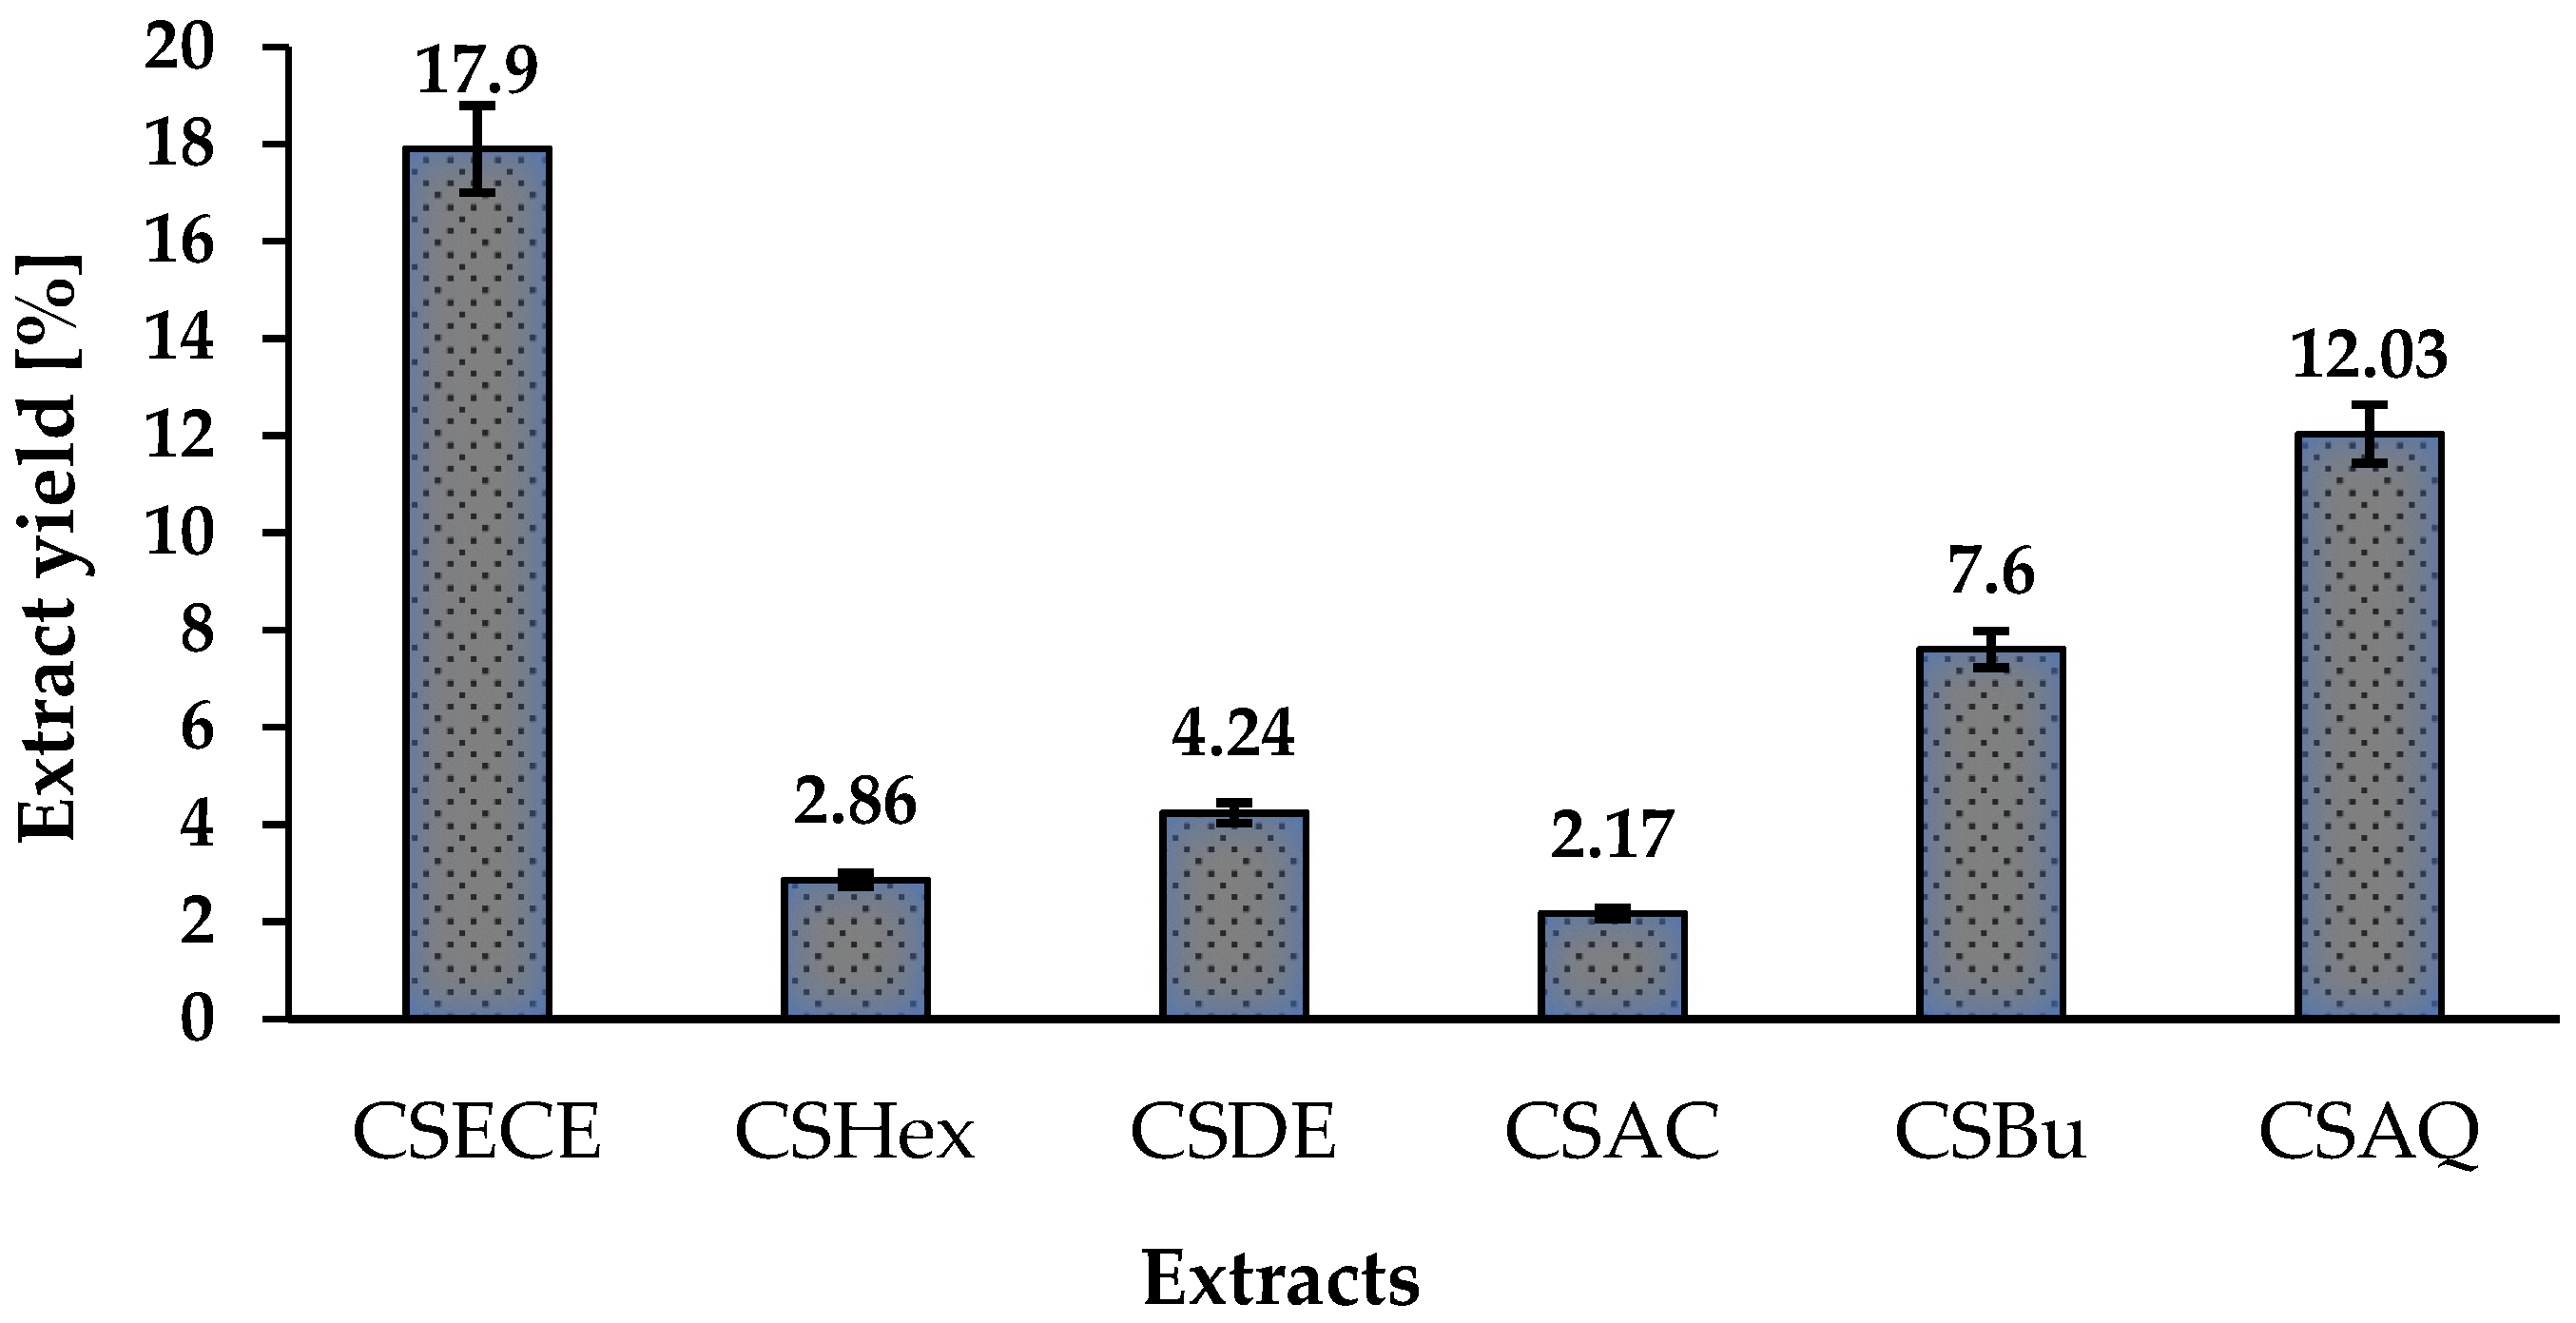
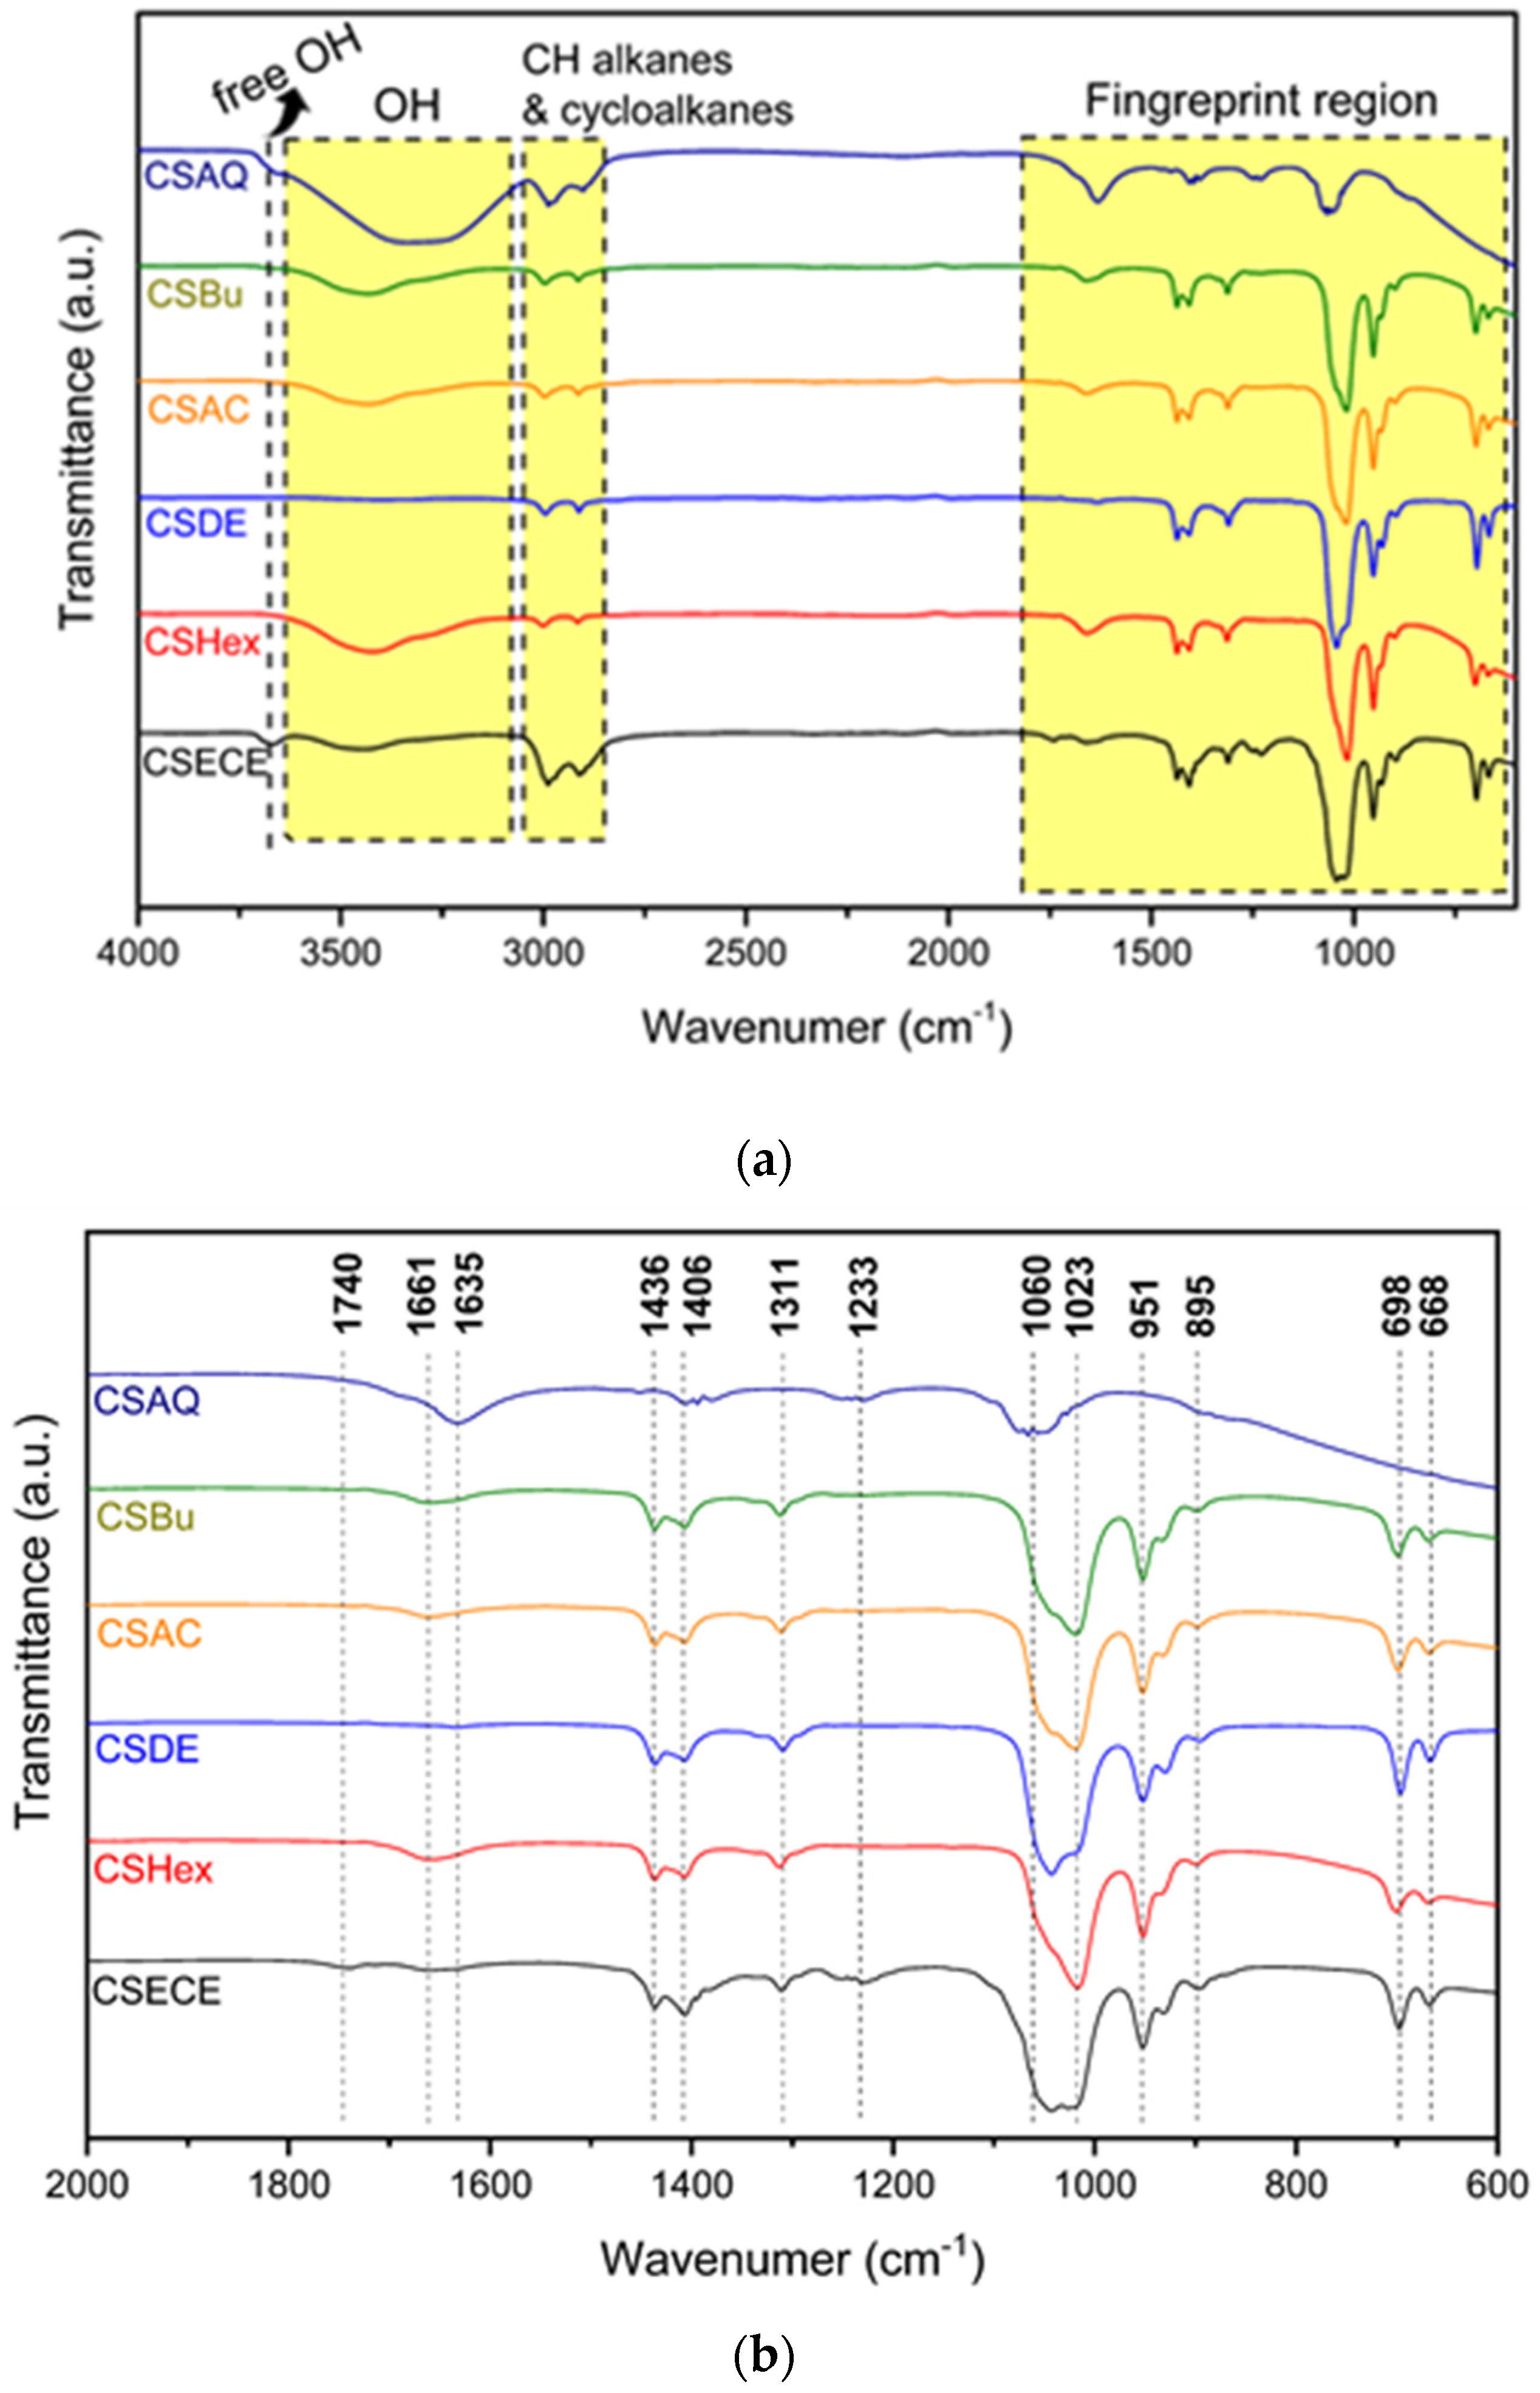
3.1. Phytochemical Screening
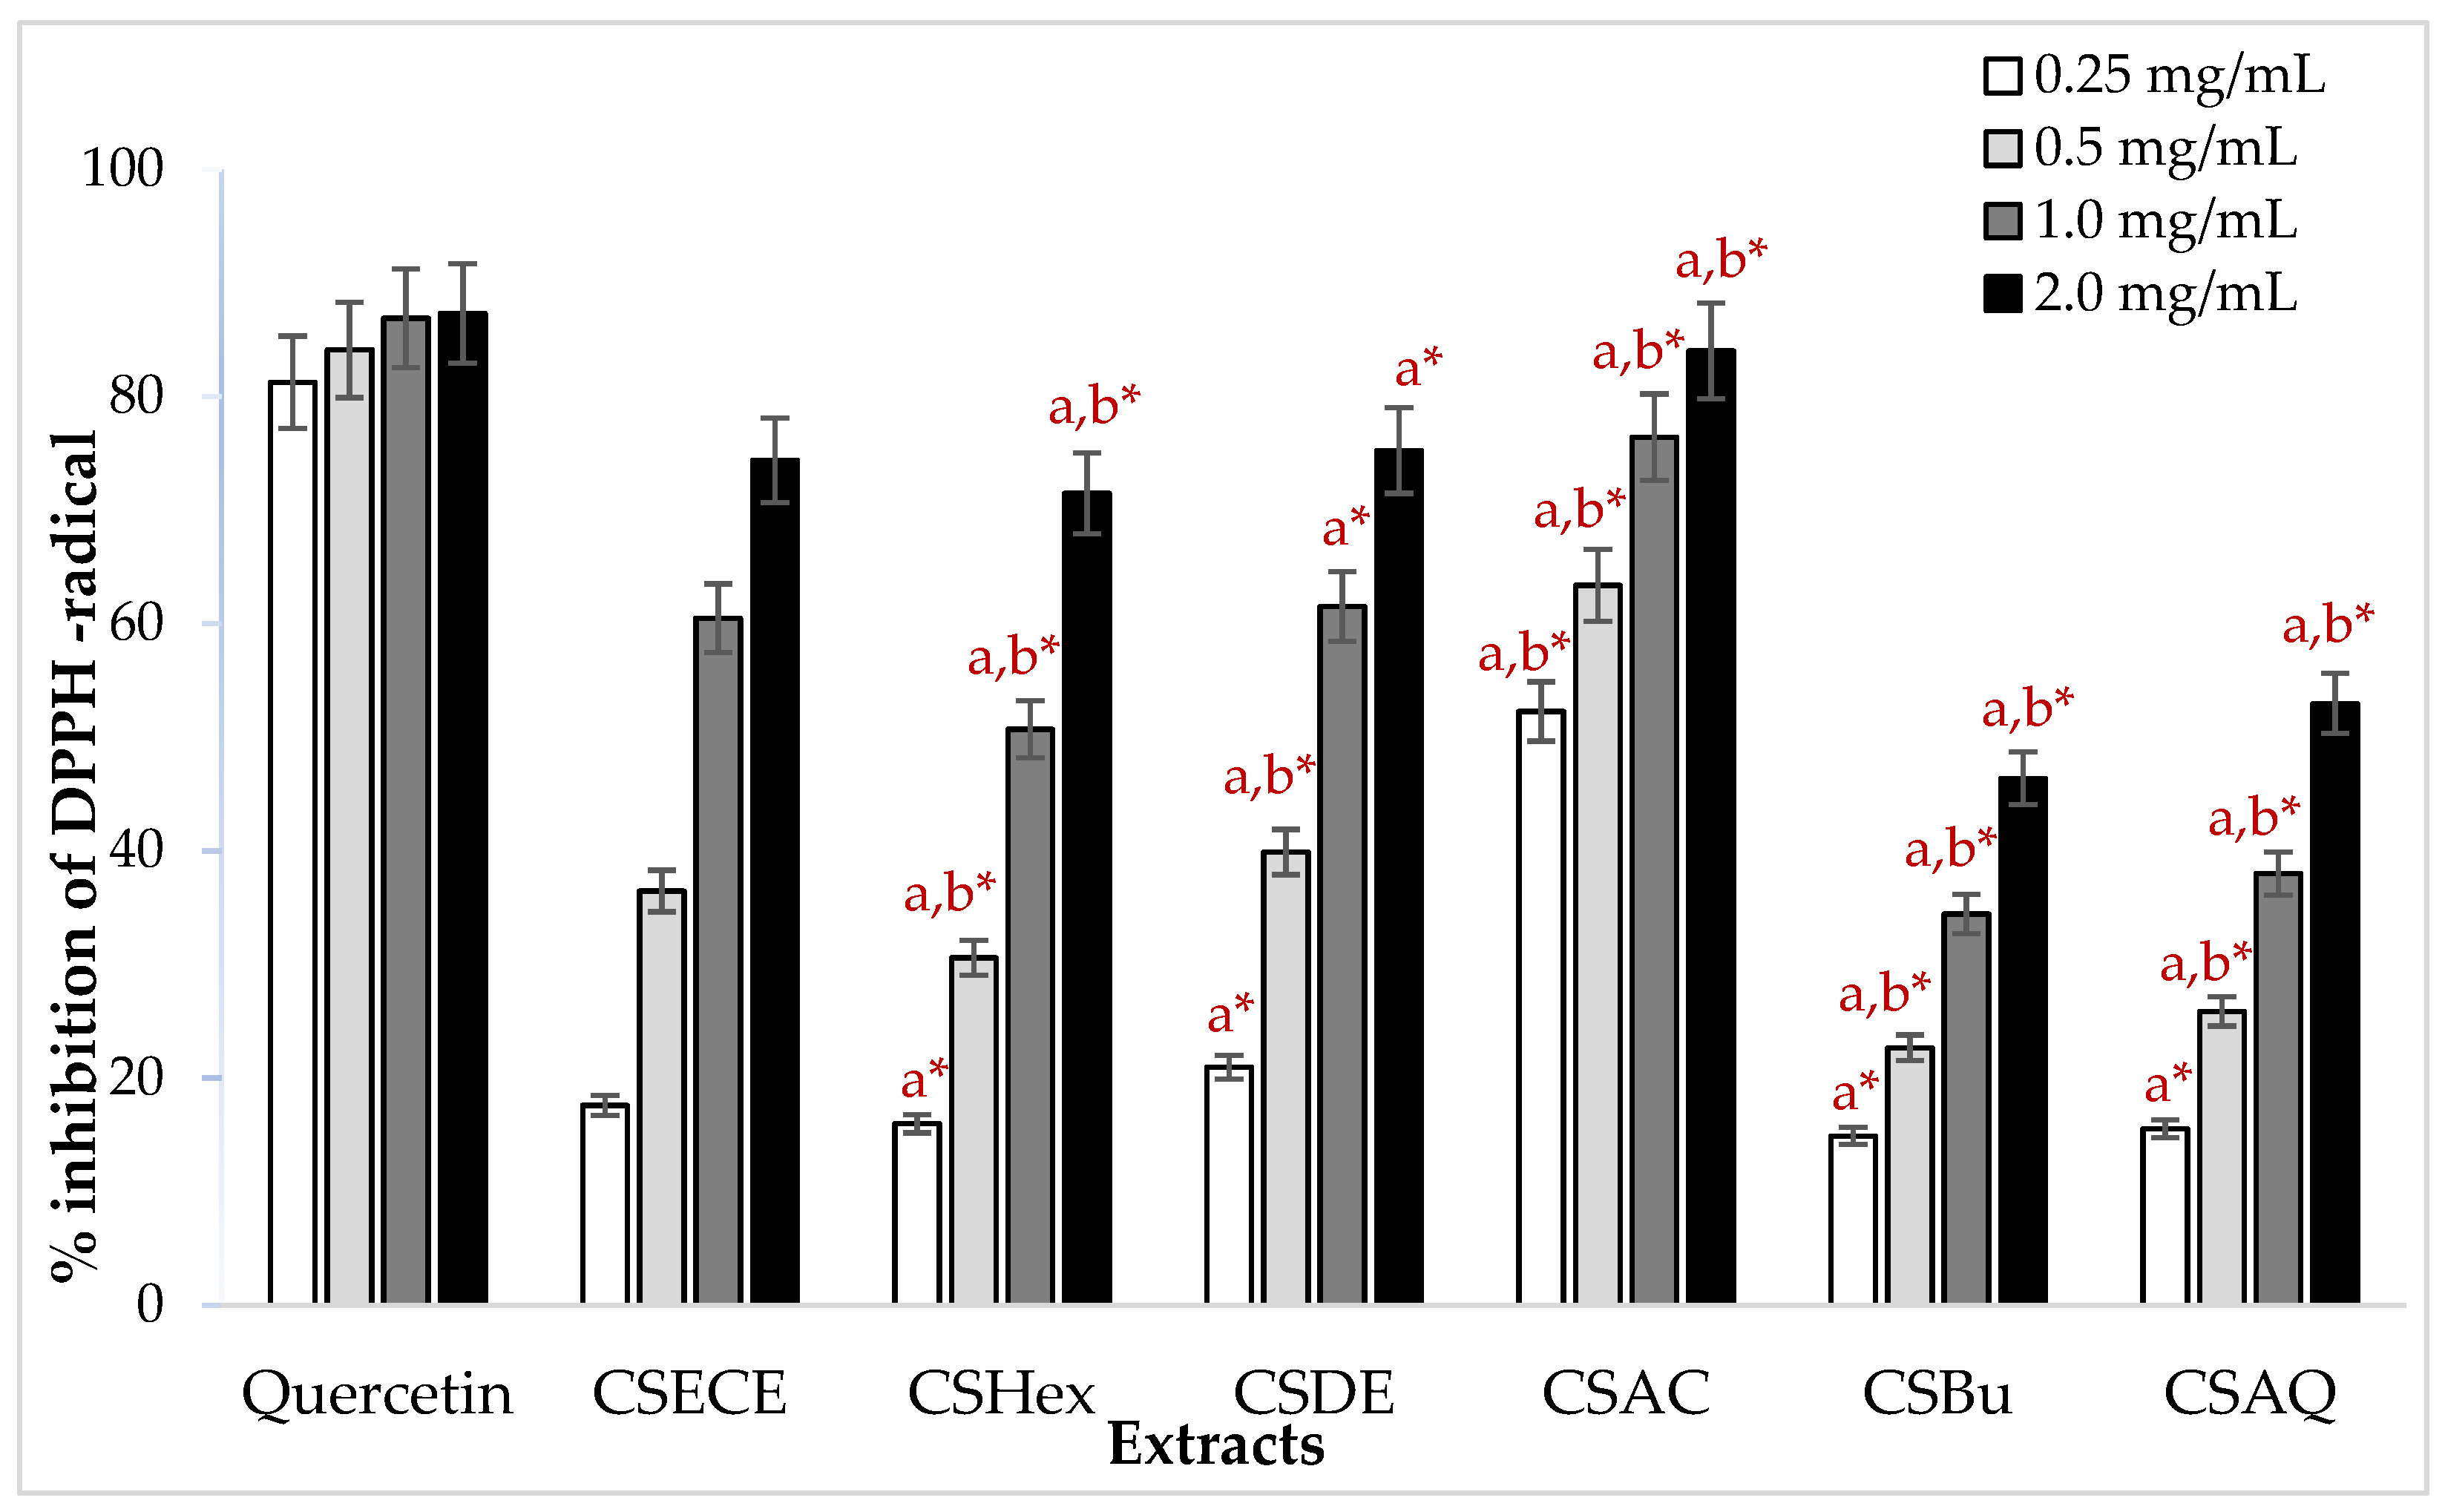
3.2. Antioxidant Activity
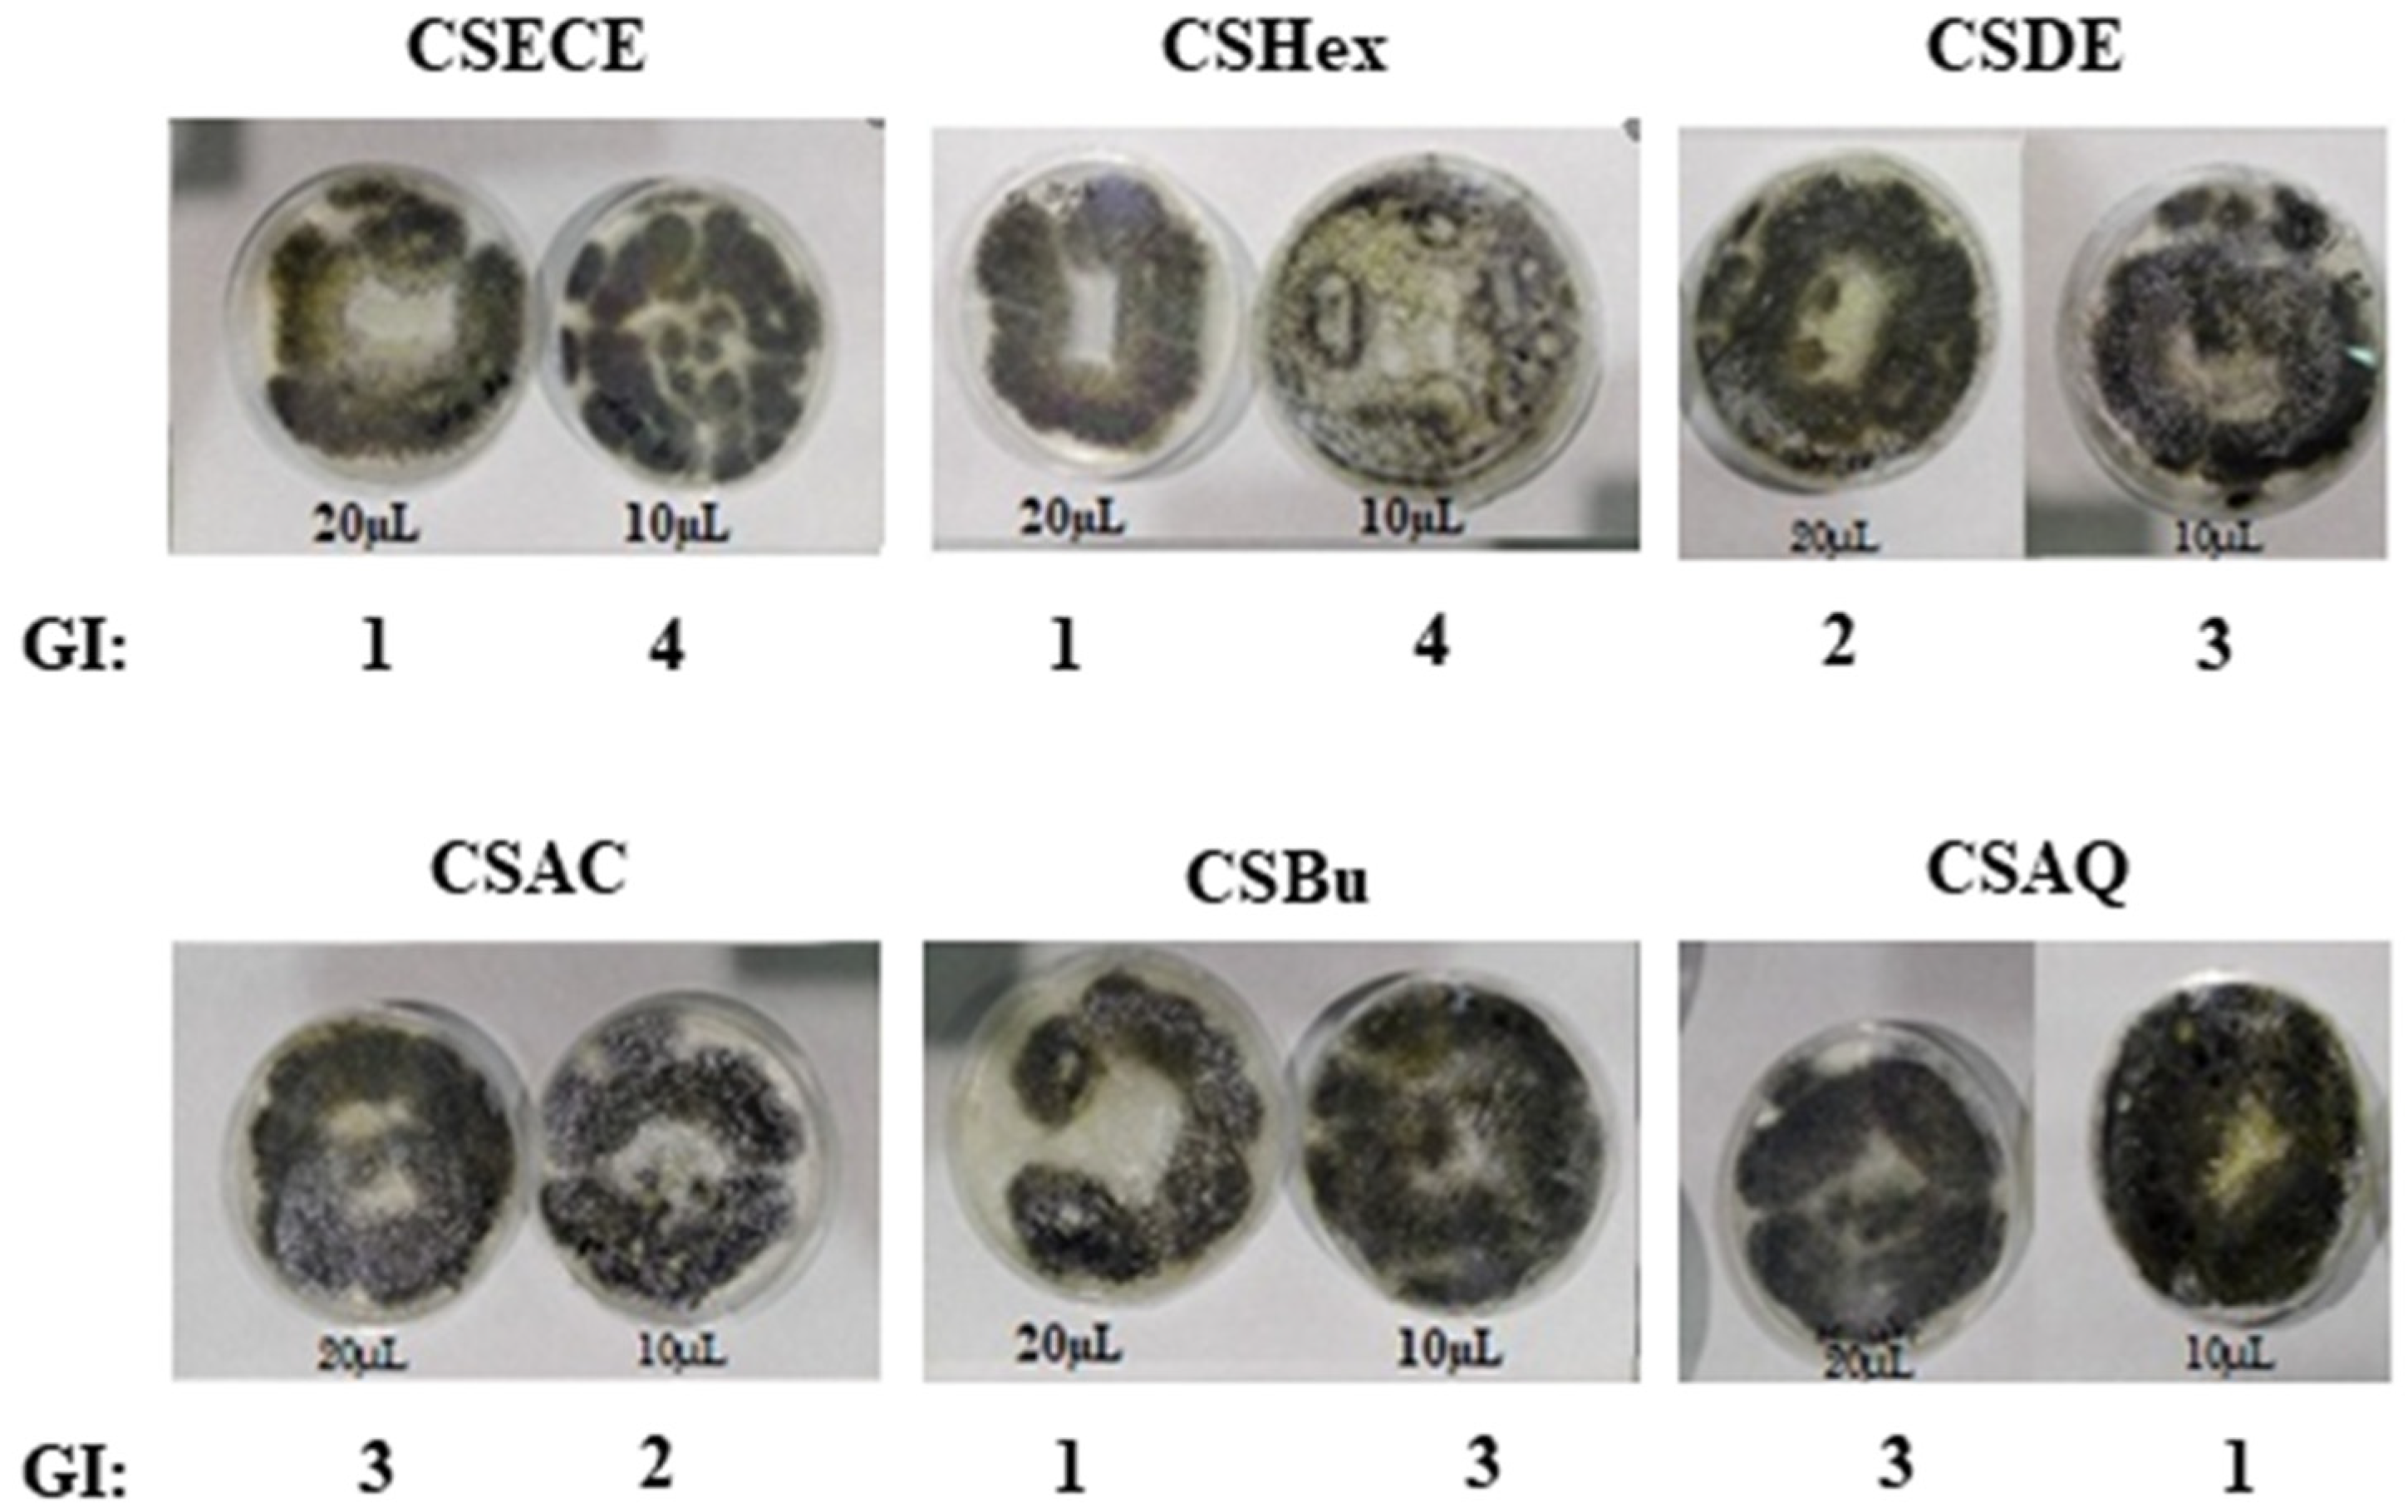
3.3. Antifungal Activity
4. Conclusions
Author Contributions
Funding
Institutional Review Board Statement
Informed Consent Statement
Data Availability Statement
Conflicts of Interest
References
- Brewer, M.S. Natural Antioxidants: Sources, Compounds, Mechanisms of Action, and Potential Applications. Compr. Rev. Food Sci. Food Saf. 2011, 10, 221–247. [Google Scholar] [CrossRef]
- Karakaya, S.; Koca, M.; Sytar, O.; Duman, H. The natural phenolic compounds and their antioxidant and anticholinesterase potential of herb Leiotulus dasyanthus (K. Koch) Pimenov & Ostr. Nat. Prod. Res. 2020, 34, 1303–1305. [Google Scholar]
- Pan, Y.; Wang, K.; Huang, S.; Wang, H.; Mu, X.; He, C.; Ji, X.; Zhang, J.; Huang, F. Antioxidant activity of microwave-assisted extract of longan (Dimocarpus Longan Lour.) peel. Food Chem. 2008, 106, 1264–1270. [Google Scholar] [CrossRef]
- Atmani, D.; Chaher, N.; Berboucha, M.; Ayouni, K.; Lounis, H.; Boudaoud, H.; Debbache, N.; Atmani, D. Antioxidant capacity and phenol content of selected Algerian medicinal plants. Food Chem. 2009, 112, 303–309. [Google Scholar] [CrossRef]
- Michel, T.; Destandau, E.; Le Floch, G.; Lucchesi, M.E.; Elfakir, C. Antimicrobial, antioxidant and phytochemical investigations of sea buckthorn (Hippophaë rhamnoides L.) leaf, stem, root and seed. Food Chem. 2012, 131, 754–760. [Google Scholar] [CrossRef]
- Lafka, T.-I.; Lazou, A.; Sinanoglou, V.; Lazos, E. Phenolic Extracts from Wild Olive Leaves and Their Potential as Edible Oils Antioxidants. Foods 2013, 2, 18–31. [Google Scholar] [CrossRef]
- Stefanucci, A.; Zengin, G.; Locatelli, M.; Macedonio, G.; Wang, C.K.; Novellino, E.; Mahomoodally, M.F.; Mollica, A. Impact of different geographical locations on varying profile of bioactives and associated functionalities of caper (Capparis spinosa L.). Food Chem. Toxicol. 2018, 118, 181–190. [Google Scholar] [CrossRef]
- Panico, A.M.; Cardile, V.; Garufi, F.; Puglia, C.; Bonina, F.; Ronsisvalle, G. Protective effect of Capparis spinosa on chondrocytes. Life Sci. 2005, 77, 2479–2488. [Google Scholar] [CrossRef]
- Kalantari, H.; Foruozandeh, H.; Khodayar, M.J.; Siahpoosh, A.; Saki, N.; Kheradmand, P. Antioxidant and hepatoprotective effects of Capparis spinosa L. fractions and Quercetin on tert-butyl hydroperoxide-induced acute liver damage in mice. J. Tradit. Complement. Med. 2018, 8, 120–127. [Google Scholar] [CrossRef]
- Zhou, H.; Jian, R.; Kang, J.; Huang, X.; Li, Y.; Zhuang, C.; Yang, F.; Zhang, L.; Fan, X.; Wu, T.; et al. Anti-inflammatory effects of caper (Capparis spinosa L.) fruit aqueous extract and the isolation of main phytochemicals. J. Agric. Food Chem. 2010, 58, 12717–12721. [Google Scholar] [CrossRef]
- Tlili, N.; Khaldi, A.; Triki, S.; Munné-Bosch, S. Phenolic Compounds and Vitamin Antioxidants of Caper (Capparis spinosa). Plant. Foods Hum. Nutr. 2010, 65, 260–265. [Google Scholar] [CrossRef] [PubMed]
- Mazarei, F.; Jooyandeh, H.; Noshad, M.; Hojjati, M. Polysaccharide of caper (Capparis spinosa L.) Leaf: Extraction optimization, antioxidant potential and antimicrobial activity. Int. J. Biol. Macromol. 2017, 95, 224–231. [Google Scholar] [CrossRef] [PubMed]
- Achat, S.; Rakotomanomana, N.; Madani, K.; Dangles, O. Antioxidant activity of olive phenols and other dietary phenols in model gastric conditions: Scavenging of the free radical DPPH and inhibition of the haem-induced peroxidation of linoleic acid. Food Chem. 2016, 213, 135–142. [Google Scholar] [CrossRef] [PubMed]
- Du, T.L.; Van Der Westhuizen, F.H.; Botes, L. Aloe ferox leaf gel phytochemical content, antioxidant capacity, and possible health benefits. J. Agric. Food Chem. 2007, 55, 6891–6896. [Google Scholar]
- El Kar, C.; Ferchichi, A.; Attia, F.; Bouajila, J. Pomegranate (Punica granatum) juices: Chemical composition, micronutrient cations, and antioxidant capacity. J. Food Sci. 2011, 76, 795–800. [Google Scholar] [CrossRef]
- Kehui, C.; Xiaobing, C.; Dengyu, C.; Jianbin Zhou, F.; Chen, M.L. Leaching of alkali and alkaline earth metallic species (AAEMs) with phenolic substances in bio-oil and its effect on pyrolysis characteristics of moso bamboo. Fuel Process. Technol. 2020, 200, 106332. [Google Scholar]
- Sepperer, T.; Hernandez-Ramos, F.; Labidi, J.; Oostingh, G.J.; Bogner, B.; Petutschnigg, A.; Tondi, G. Purification of industrial tannin extract through simple solid-liquid extractions. Ind. Crops. Prod. 2019, 139, 111502. [Google Scholar] [CrossRef]
- Herrera, R.; Erdocia, X.; Llano-Ponte, R.; Labidi, J. Characterization of hydrothermally treated wood in relation to changes on its chemical composition and physical properties. J. Anal. Appl. Pyrolysis. 2014, 107, 256–266. [Google Scholar] [CrossRef]
- Touhami, A.; Chefrour, A.; Khellaf, N.; Bukhari, A.; Fadel, I. Phytochemical Characterization of the Essential Oils Obtained from Mediterranean Thymus spp. (Lamiacea) Harvested at Different Stages of Growth. J. Pharm. Pharmacol. 2017, 5, 37–45. [Google Scholar]
- Sánchez-Moreno, C. Methods Used to Evaluate the Free Radical Scavenging Activity in Foods and Biological Systems. Food Sci. Technol. Int. 2002, 8, 121–137. [Google Scholar] [CrossRef]
- Yahyaoui, M.; Ghazouani, N.; Sifaoui, I.; Abderrabba, M. Comparison of the Effect of Various Extraction Methods on the Phytochemical Composition and Antioxidant Activity of Thymelaea hirsuta L. aerial parts in Tunisia. Biosci. Biotechnol. Res. Asia 2017, 14, 997–1007. [Google Scholar] [CrossRef]
- Da Silva, D.T.; Herrera, R.; Heinzmann, B.M.; Calvo, J.; Labidi, J. Nectandra grandiflora By-Products Obtained by Phytochemicals with Antioxidant and Antifungal Properties. Molecules 2018, 23, 372. [Google Scholar] [CrossRef] [Green Version]
- Robles, E.; Salaberria, A.M.; Herrera, R.; Fernandes, S.C.M.; Labidi, J. Self-bonded composite films based on cellulose nanofibers and chitin nanocrystals as antifungal materials. Carbohydr. Polym. 2016, 144, 41–49. [Google Scholar] [CrossRef]
- Gull, T.; Anwar, F.; Sultana, B.; Alcayde, M.A.C.; Nouman, W. Capparis species: A potential source of bioactives and high-value components: A review. Ind. Crop. Prod. 2015, 67, 81–96. [Google Scholar] [CrossRef]
- Dhingra, N.; Kar, A.; Sharma, R.; Bhasin, S. In-vitro antioxidative potential of different fractions from Prunus dulcis seeds: Vis a vis antiproliferative and antibacterial activities of active compounds. S. Afr. J. Bot. 2017, 108, 184–192. [Google Scholar] [CrossRef]
- Franco Ruiz, D.J.; Sineiro, J.; Rubilar, M.; Sánchez, M.; Jerez, M.; Pinelo, M.; Costoya, N.; José Núñez, M. Polyphenols from plant materials: Extraction and antioxidant power. Electron. J. Environ. Agric. Food Chem. 2008, 7, 3210–3216. [Google Scholar]
- Khojasteh Rad, M.; Ghani, A.; Ghani, E. In vitro effects of Capparis spinosa L. extract on human sperm function, DNA fragmentation, and oxidative stress. J. Ethnopharmacol. 2021, 269, 113702. [Google Scholar] [CrossRef] [PubMed]
- Hyun, T.K.; Kim, H.C.; Kim, J.S. Antioxidant and antidiabetic activity of Thymus quinquecostatus Celak. Ind. Crops. Prod. 2014, 52, 611–616. [Google Scholar] [CrossRef]
- Yadav, P.; Malpathak, N. Estimation of antioxidant activity and total phenol, flavonoid content among natural populations of caper (Capparis moonii, Wight) from Western Ghats region. Indian J. Pharm. Educ. Res. 2016, 50, 495–501. [Google Scholar] [CrossRef] [Green Version]
- Safarzaei, A.; Sarhadi, H.; Haddad Khodaparast, M.H.; Shahdadi, F.; Dashipour, A.R. Optimization of Aqueous and Alcoholic Extraction of Phenolic and Antioxidant Compounds From Caper (Capparis spinosa L.) Roots Assisted by Ultrasound Waves. Zahedan J. Res. Med. Sci. 2020, 22, e100747. [Google Scholar] [CrossRef]
- Nunes, C.A.; Lima, C.F.; Barbosa, L.C.A.; Colodette, J.L.; Gouveia, A.F.G.; Silvério, F.O. Determination of Eucalyptus spp. lignin S/G ratio: A comparison between methods. Bioresour. Technol. 2010, 101, 4056–4061. [Google Scholar] [CrossRef]
- Sharma, D.K.; Dhawan, H.; Morgan, T.; Crocker, M. Py-GCMS studies of Indian coals and their solvent extracted products. Fuel 2019, 256, 115981. [Google Scholar] [CrossRef]
- Fernández-Rodríguez, J.; Gordobil, O.; Robles, E.; González-Alriols, M.; Labidi, J. Lignin valorization from side-streams produced during agricultural waste pulping and total chlorine free bleaching. J. Clean Prod. 2017, 142, 2609–2617. [Google Scholar] [CrossRef]
- Mollica, A.; Stefanucci, A.; Macedonio, G.; Locatelli, M.; Luisi, G.; Novellino, E.; Zengin, G. Chemical composition and biological activity of Capparis spinosa L. from Lipari Island. S. Afr. J. Bot. 2019, 120, 135–140. [Google Scholar] [CrossRef]
- Yang, T.; Wang, C.H.; Chou, G.X.; Wu, T.; Cheng, X.M.; Wang, Z.T. New alkaloids from Capparis spinosa: Structure and X-ray crystallographic analysis. Food Chem. 2010, 123, 705–710. [Google Scholar] [CrossRef]
- Lam, S.K.; Ng, T.B. A protein with antiproliferative, antifungal and HIV-1 reverse transcriptase inhibitory activities from caper (Capparis spinosa) seeds. Phytomedicine 2009, 16, 444–450. [Google Scholar] [CrossRef]
- Ajuong, E.; Redington, M. Fourier transform infrared analyses of bog and modern oak wood (Quercus petraea) extractives. Wood Sci. Technol. 2004, 38, 181–190. [Google Scholar] [CrossRef]
- Grasel, F.D.S.; Ferrão, M.F.; Wolf, C.R. Development ofmethodology for identificationthenatureof the polyphenolic extracts by FTIR associated with multivariate analysis. Spectrochim. Acta. Part A Mol. Biomol. Spectrosc. 2016, 153, 94–101. [Google Scholar] [CrossRef] [PubMed]
- Ping, L.; Pizzi, A.; Guo, Z.D.; Brosse, N. Condensed tannins from grape pomace: Characterization by FTIR and MALDI TOF and production of environment friendly wood adhesive. Ind. Crop. Prod. 2012, 40, 13–20. [Google Scholar] [CrossRef]
- Rodríguez-Solana, R.; Daferera, D.J.; Mitsi, C.; Trigas, P.; Polissiou, M.; Tarantilis, P.A. Comparative chemotype determination of lamiaceae plants by means of GC-MS, FT-IR, and dispersive-Raman spectroscopic techniques and GC-FID quantification. Ind. Crops. Prod. 2014, 62, 22–33. [Google Scholar] [CrossRef]
- Bouyahya, A.; Abrini, J.; Bakri, Y.; Dakka, N. Screening phytochimique et évaluation de l’activité antioxydante et antibactérienne des extraits d’Origanum compactum. Pharmacognosie 2017, 15, 379–383. [Google Scholar] [CrossRef]
- Karuppusamy, S.; Muthuraja, G. Radical scavenging activities of heracleum aquilegifolium wight (apiaceae) fruit oils in vitro. Z. Naturforsch. C. J. Biosci. 2010, 65, 653–659. [Google Scholar] [CrossRef]
- Wenli, Y.; Yaping, Z.; Bo, S. The radical scavenging activities of radix puerariae isoflavonoids: A chemiluminescence study. Food Chem. 2004, 86, 25–29. [Google Scholar] [CrossRef]
- Nithiya, T.; Udayakumar, R. In Vitro Antioxidant Properties of Phloretin—An Important Phytocompound. J. Biosci. Med. 2016, 4, 85–94. [Google Scholar]
- Hayouni, E.A.; Abedrabba, M.; Bouix, M.; Hamdi, M. The effects of solvents and extraction method on the phenolic contents and biological activities in vitro of Tunisian Quercus coccifera L. and Juniperus phoenicea L. fruit extracts. Food Chem. 2007, 105, 126–134. [Google Scholar] [CrossRef]
- Koleva, I.I.; Van Beek, T.A.; Linssen, J.P.H.; De Groot, A.; Evstatieva, L.N. Screening of plant extracts for antioxidant activity: A comparative study on three testing methods. Phytochem. Anal. 2002, 13, 8–17. [Google Scholar] [CrossRef] [PubMed]
- Mohebali, N.; Abolhassan, S.; Fazeli, S.; Ghafoori, H.; Farahmand, Z.; Khani, E.M.; Vakhshiteh, F.; Ghamarian, A.; Farhangniya, M.; Hossein Sanati, M. Effect of flavonoids rich extract of Capparis spinosa on inflammatory involved genes in amyloid-beta peptide injected rat model of Alzheimer’s disease. Nutr. Neurosci. 2016, 21, 143–150. [Google Scholar] [CrossRef]
- Allaith, A.A.A. Assessment of the antioxidant properties of the caper fruit (Capparis spinosa L.) from Bahrain. J. Assoc. Arab. Univ. Basic Appl. Sci. 2014, 19, 1–7. [Google Scholar] [CrossRef] [Green Version]
- Siddhuraju, P.; Becker, K. The antioxidant and free radical scavenging activities of processed cowpea (Vigna unguiculata (L.) Walp.) seed extracts. Food Chem. 2007, 101, 10–19. [Google Scholar] [CrossRef]
- Kumaran, A.; Joel Karunakaran, R. In vitro antioxidant activities of methanol extracts of five Phyllanthus species from India. LWT-Food Sci. Technol. 2007, 40, 344–352. [Google Scholar] [CrossRef]
- El amri, N.; Errachidi, F.; Bour, A.; Chabir, R. Characterization of Moroccan raw and processed caper berries. Mater. Today Proc. 2019, 1, 841–849. [Google Scholar] [CrossRef]
- Ramos, M.; Burgos, N.; Barnard, A.; Evans, G.; Preece, J.; Graz, M.; Ruthes, A.C.; Jiménez-Quero, A.; Martínez-Abad, A.; Vilaplana, F.; et al. Agaricus bisporus and its by-products as a source of valuable extracts and bioactive compounds. Food Chem. 2019, 292, 176–187. [Google Scholar] [CrossRef] [PubMed] [Green Version]
- Loi, M.; Paciolla, C.; Logrieco, A.F.; Mulè, G. Plant Bioactive Compounds in Pre- and Postharvest Management for Aflatoxins Reduction. Front. Microbiol. 2020, 11, 243. [Google Scholar] [CrossRef] [PubMed]


| Growth Intensity (GI) | Evaluation |
|---|---|
| 0 | No apparent growth under microscope |
| 1 | No growth to the naked eye, but visible to the microscope |
| 2 | Visible growth, covering up to 25% to the test area |
| 3 | Visible growth, covering up to 50% |
| 4 | Visible growth, covering up to 75% |
| 5 | Significant growth, covering more than 75% |
| Samples | TPC 1 | TFC 2 | Tannins 3 |
|---|---|---|---|
| CSECE | 82.031 ± 2.113 a | 48.446 ± 2.209 a | 17.929 ± 0.152 a |
| CSHex | 61.919 ± 0.731 b | 31.458 ± 1.547 b | 10.024 ± 0.051 b |
| CSDE | 78.889 ± 1.707 a | 35.729 ± 2.210 b | 11.357 ± 0.253 c |
| CSAC | 259.31 ± 6.177 c | 107.291 ± 8.650 c | 16.786 ± 0.101 a |
| CSBu | 62.72 ± 1.138 b | 22.1881 ± 0.085 d | 8.036 ± 0.253 d |
| CSAQ | 54.253 ± 0.406 b | 13,546 ± 1.547 d | 10.645 ± 0.556 b |
| Functional Groups | CSHex | CSDE | CSAC | CSBu |
|---|---|---|---|---|
| Phenolic (%) | 8.43 | 11.76 | 36.50 | 5.82 |
| Proteins (%) | 38.95 | 60.09 | 4.86 | 62.68 |
| Polysaccharides (%) | 1.33 | 0.55 | 2.66 | - |
| Fatty acid (%) | 6.70 | 0.70 | 4.52 | 9.59 |
| Fatty acid ester (%) | 11.65 | 5.58 | 4.29 | 0.94 |
| Furanes (%) | 1.37 | 4.47 | 10.19 | 2.91 |
| Terpene (%) | 1.86 | - | 1.75 | 0.23 |
| Halogenated compounds (%) | 5.74 | - | - | - |
| Hydrocarbons (%) | 4.52 | 4.89 | 1.86 | 4.92 |
| Alcohol (%) | - | - | 14.25 | - |
| Steroid (%) | 2.43 | - | 0.90 | 1.69 |
| Others (%) | 17.02 | 11.96 | 18.22 | 11.22 |
| CSHex | CSDE | CSAC | CSBu | ||
|---|---|---|---|---|---|
| Peak Number | Compound | RT (min) | |||
| 1 | Pyrrolidine, 1-methyl | 3.214 | 3.237 | - | 3.214 |
| 2 | 3-Penten-1-yne, 3-methyl-, (Z) | 3.820 | 3.820 | - | - |
| 3 | Isopropyl alcohol | - | - | 4.253 | - |
| 4 | Furfural | - | - | 5.044 | |
| 4 | Pyrrole, 4-ethyl-2-methyl | - | 6.673 | - | 6.673 |
| 5 | 5-Methylfurfural | - | 7.205 | 7.245 | 7.205 |
| 6 | Phenol | 7.528 | 7.580 | 7.534 | 7.765 |
| 7 | Benzyl alcohol | - | - | 8.469 | - |
| 8 | Proline, N-methyl-, butyl ester | 8.527 | 8.539 | 8.585 | 8.568 |
| 9 | Guaiacol | 9.330 | 9.324 | 9.365 | 9.330 |
| 10 | Methyl benzoate | 9.428 | 9.428 | - | 9.434 |
| 11 | Phenylethyl alcohol | - | 9.757 | 9.815 | 9.763 |
| 12 | Benzoic acid | - | - | 11.629 | - |
| 13 | 1H-Pyrrole, 2,3-dimethyl | 11.779 | 11.773 | - | - |
| 14 | Benzoic acid, 2hydroxy-, hydrazide | - | - | 11.865 | - |
| 15 | Coumaran | 11.946 | 11.946 | 12.044 | 11.992 |
| 16 | 1-Methoxycyclohexane | - | 13.003 | - | - |
| 17 | 2-Methylpiperidine | - | - | - | 13.009 |
| 18 | Isonaline 70 | - | - | 14.014 | - |
| 19 | Indole | 14.430 | 14.424 | 14.493 | - |
| 20 | Proline, N-methyl-, butyl ester | - | - | - | 14.597 |
| 21 | 2-Methoxy-4vinylphenol | 15.024 | 15.013 | 15.094 | 15.030 |
| 22 | Phenol, 2,6-dimethoxy | 16.041 | 16.041 | 16.122 | 16.047 |
| 23 | 5-Methoxy-1H-indole-3-carbaldehyde | 17.837 | 17.831 | - | 17.837 |
| 24 | Phenol, 2-methoxy-4-(1-propenyl) | 18.247 | 18.241 | 18.270 | - |
| 25 | 1,6-Anhydro-beta-d-glucopyranose | 18.894 | - | - | - |
| 26 | ButylatedHydroxytoluene | - | - | 19.402 | - |
| 27 | Diethyl phthalate | 20.684 | 20.684 | 20.696 | 20.690 |
| 28 | cis-Pinane | 23.676 | 23.670 | 23.682 | - |
| 29 | 3,7,11,15-Tetramethyl-2-hexadecen1-ol | - | - | 24.149 | - |
| 30 | Hexadecanoic acid, methyl ester | 24.600 | 24.594 | 24.606 | 24.594 |
| 31 | n-Hexadecanoic acid | 25.016 | 24.987 | 25.016 | 25.062 |
| 32 | alfa-Methyl linolenate | 26.367 | 26.361 | 26.356 | 26.356 |
| 33 | Phytol | 26.465 | - | 26.459 | 26.465 |
| 34 | Nonacosane | - | 33.511 | - | 403.318 |
| 35 | Hexadecane, 1-iodo | 33.517 | - | - | - |
| 36 | Octadecane, 1-iodo | 36.670 | - | - | - |
| 37 | Hentriacontane | - | 36.647 | 36.659 | - |
| 38 | Docosane | - | - | - | 36.670 |
| 39 | Eicosane | 40.326 | 40.314 | 40.326 | 38.686 |
| 40 | Tetratriacontane | - | - | - | 40.332 |
| 41 | Beta-Sitosterol | 40.961 | - | 40,456 | 40.967 |
| Samples | FRAP (mmol Fe2+/g Dry Sample) |
|---|---|
| CSECE | 1.354 ± 0.043 a |
| CSHex | 1.110 ± 0.060 a |
| CSDE | 1.380 ± 0.024 a |
| CSAC | 4.275 ± 0.011 b |
| CSBu | 0.898 ± 0.047 c |
| CSAQ | 0.744 ± 0.045 c |
| Sample | FGI (1) [%] | Viability (2) [%] |
|---|---|---|
| Control | - | 78.31 |
| CSMCE | 46.56 | 62.55 |
| CSHex | 57.09 | 73.00 |
| CSDE | 58.78 | 55.45 |
| CSAC | 12.71 | 56.06 |
| CSBu | 52.18 | 60.21 |
| CSAQ | 58.01 | 60.21 |
Publisher’s Note: MDPI stays neutral with regard to jurisdictional claims in published maps and institutional affiliations. |
© 2021 by the authors. Licensee MDPI, Basel, Switzerland. This article is an open access article distributed under the terms and conditions of the Creative Commons Attribution (CC BY) license (https://creativecommons.org/licenses/by/4.0/).
Share and Cite
Rajhi, I.; Hernandez-Ramos, F.; Abderrabba, M.; Ben Dhia, M.T.; Ayadi, S.; Labidi, J. Antioxidant, Antifungal and Phytochemical Investigations of Capparis spinosa L. Agriculture 2021, 11, 1025. https://doi.org/10.3390/agriculture11101025
Rajhi I, Hernandez-Ramos F, Abderrabba M, Ben Dhia MT, Ayadi S, Labidi J. Antioxidant, Antifungal and Phytochemical Investigations of Capparis spinosa L. Agriculture. 2021; 11(10):1025. https://doi.org/10.3390/agriculture11101025
Chicago/Turabian StyleRajhi, Ilhem, Fabio Hernandez-Ramos, Manef Abderrabba, Med Taieb Ben Dhia, Sameh Ayadi, and Jalel Labidi. 2021. "Antioxidant, Antifungal and Phytochemical Investigations of Capparis spinosa L." Agriculture 11, no. 10: 1025. https://doi.org/10.3390/agriculture11101025
APA StyleRajhi, I., Hernandez-Ramos, F., Abderrabba, M., Ben Dhia, M. T., Ayadi, S., & Labidi, J. (2021). Antioxidant, Antifungal and Phytochemical Investigations of Capparis spinosa L. Agriculture, 11(10), 1025. https://doi.org/10.3390/agriculture11101025