Operationalization of Interorganizational Fairness in Food Systems: From a Social Construct to Quantitative Indicators

 , , , and
Abstract
1. Introduction
2. Theoretical Background
2.1. Fairness Theory
2.2. Measurement Theory
3. Materials and Methods
3.1. Conceptualization
3.2. Operationalization
4. Results
4.1. Conceptualizing IOF
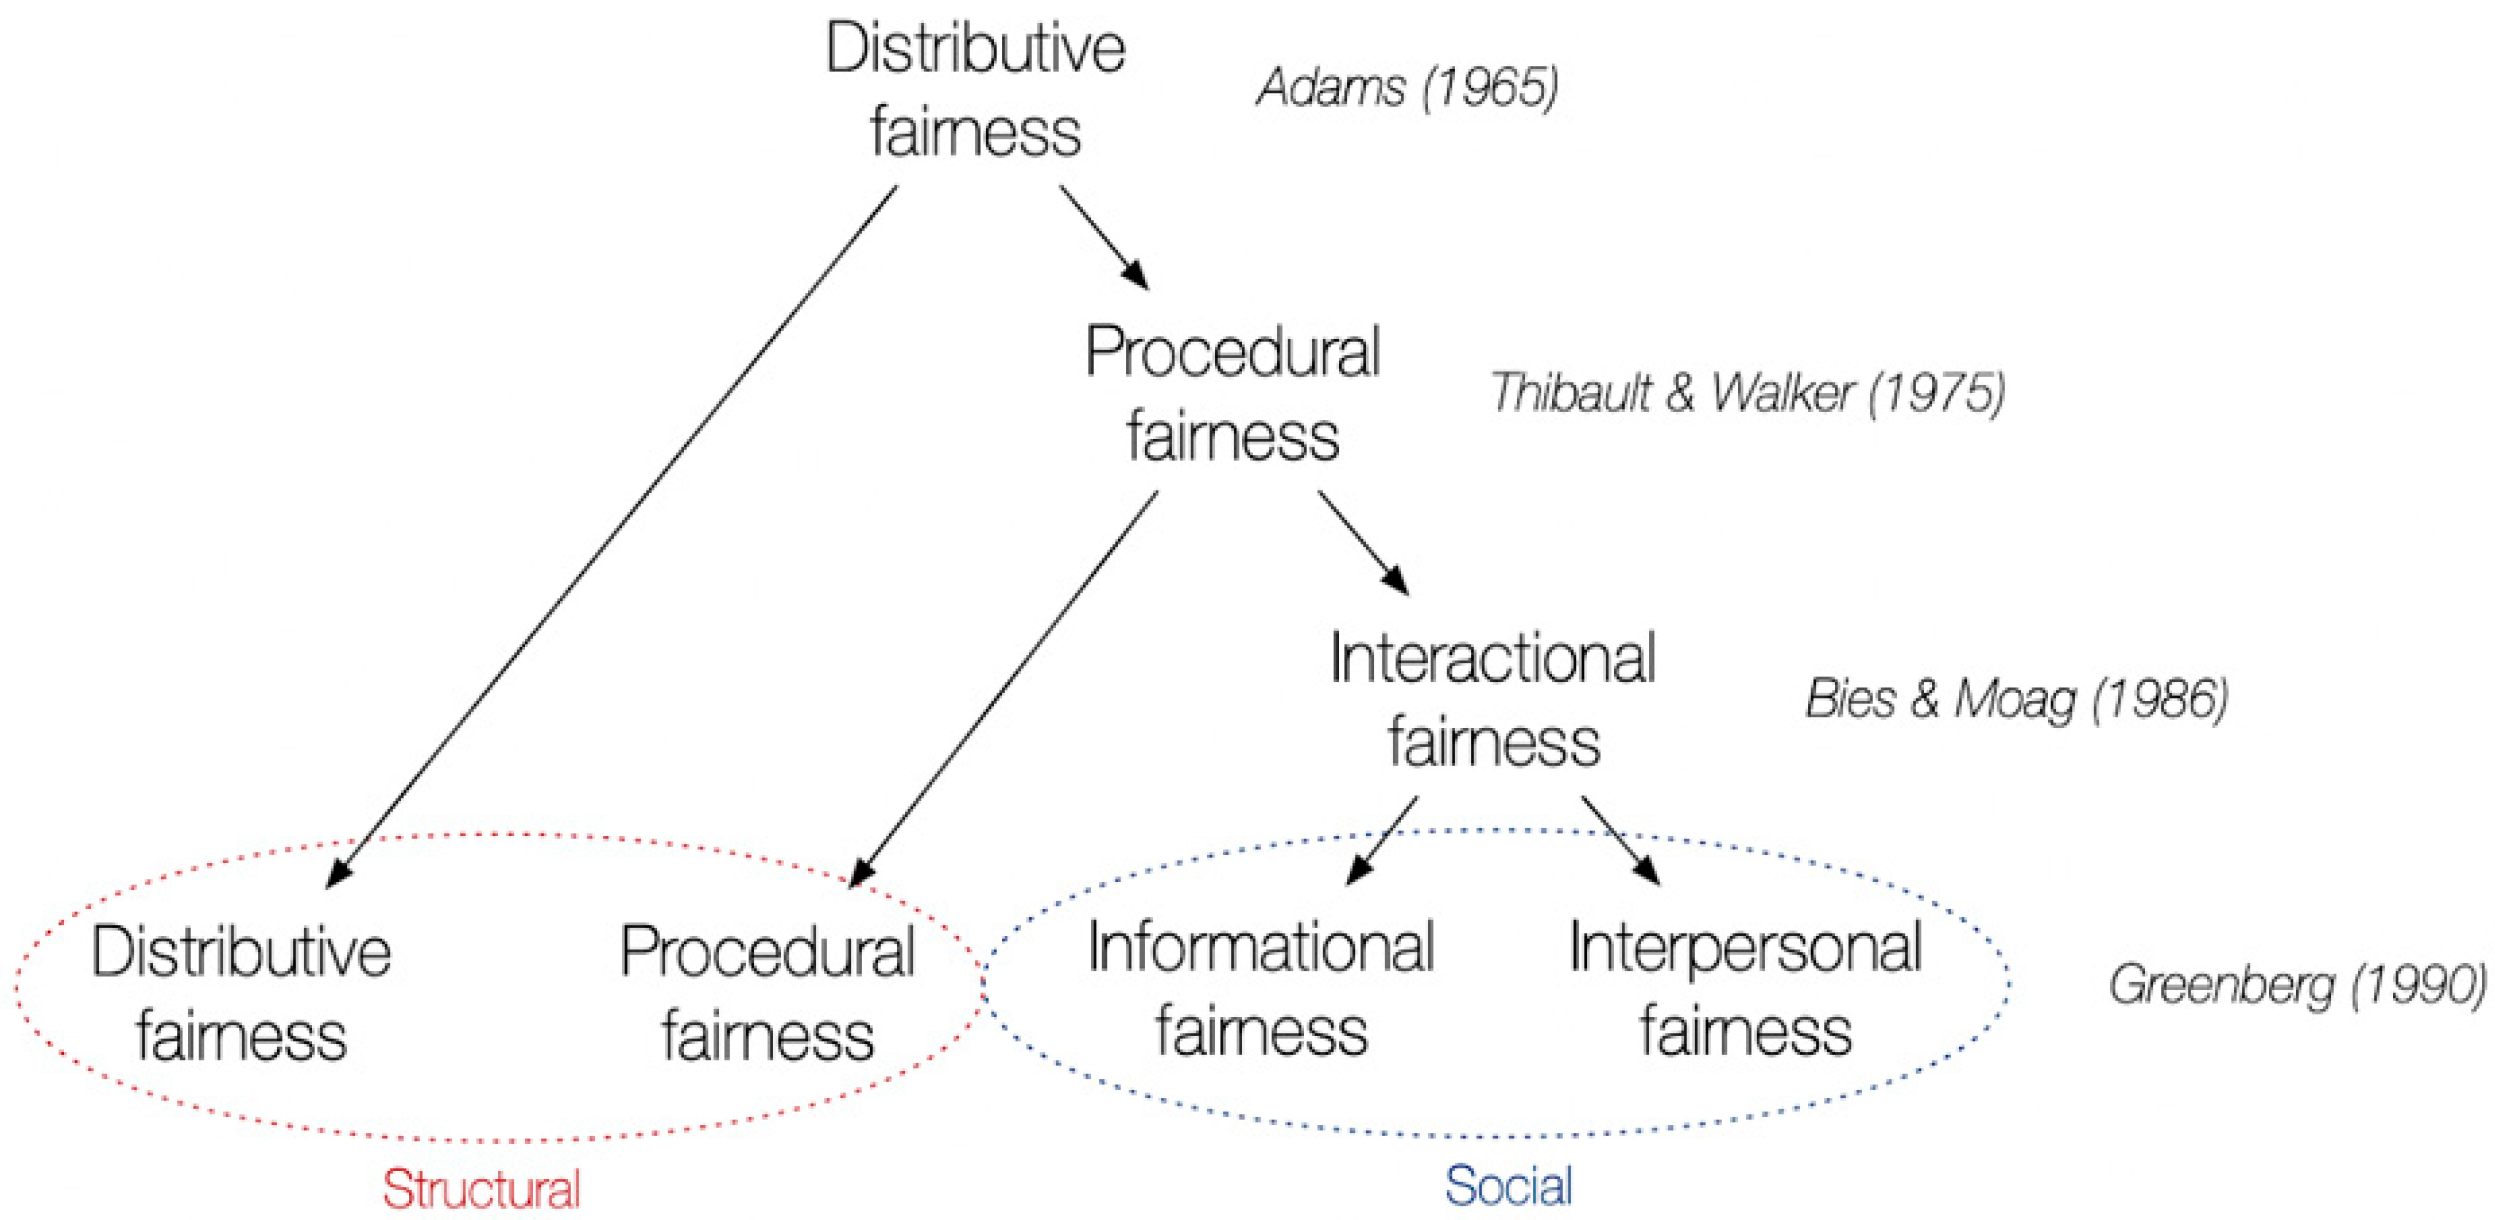
4.1.1. Dimensions of IOF
4.1.2. The Antecedents and Consequences of IOF
4.2. Operationalizing IOF
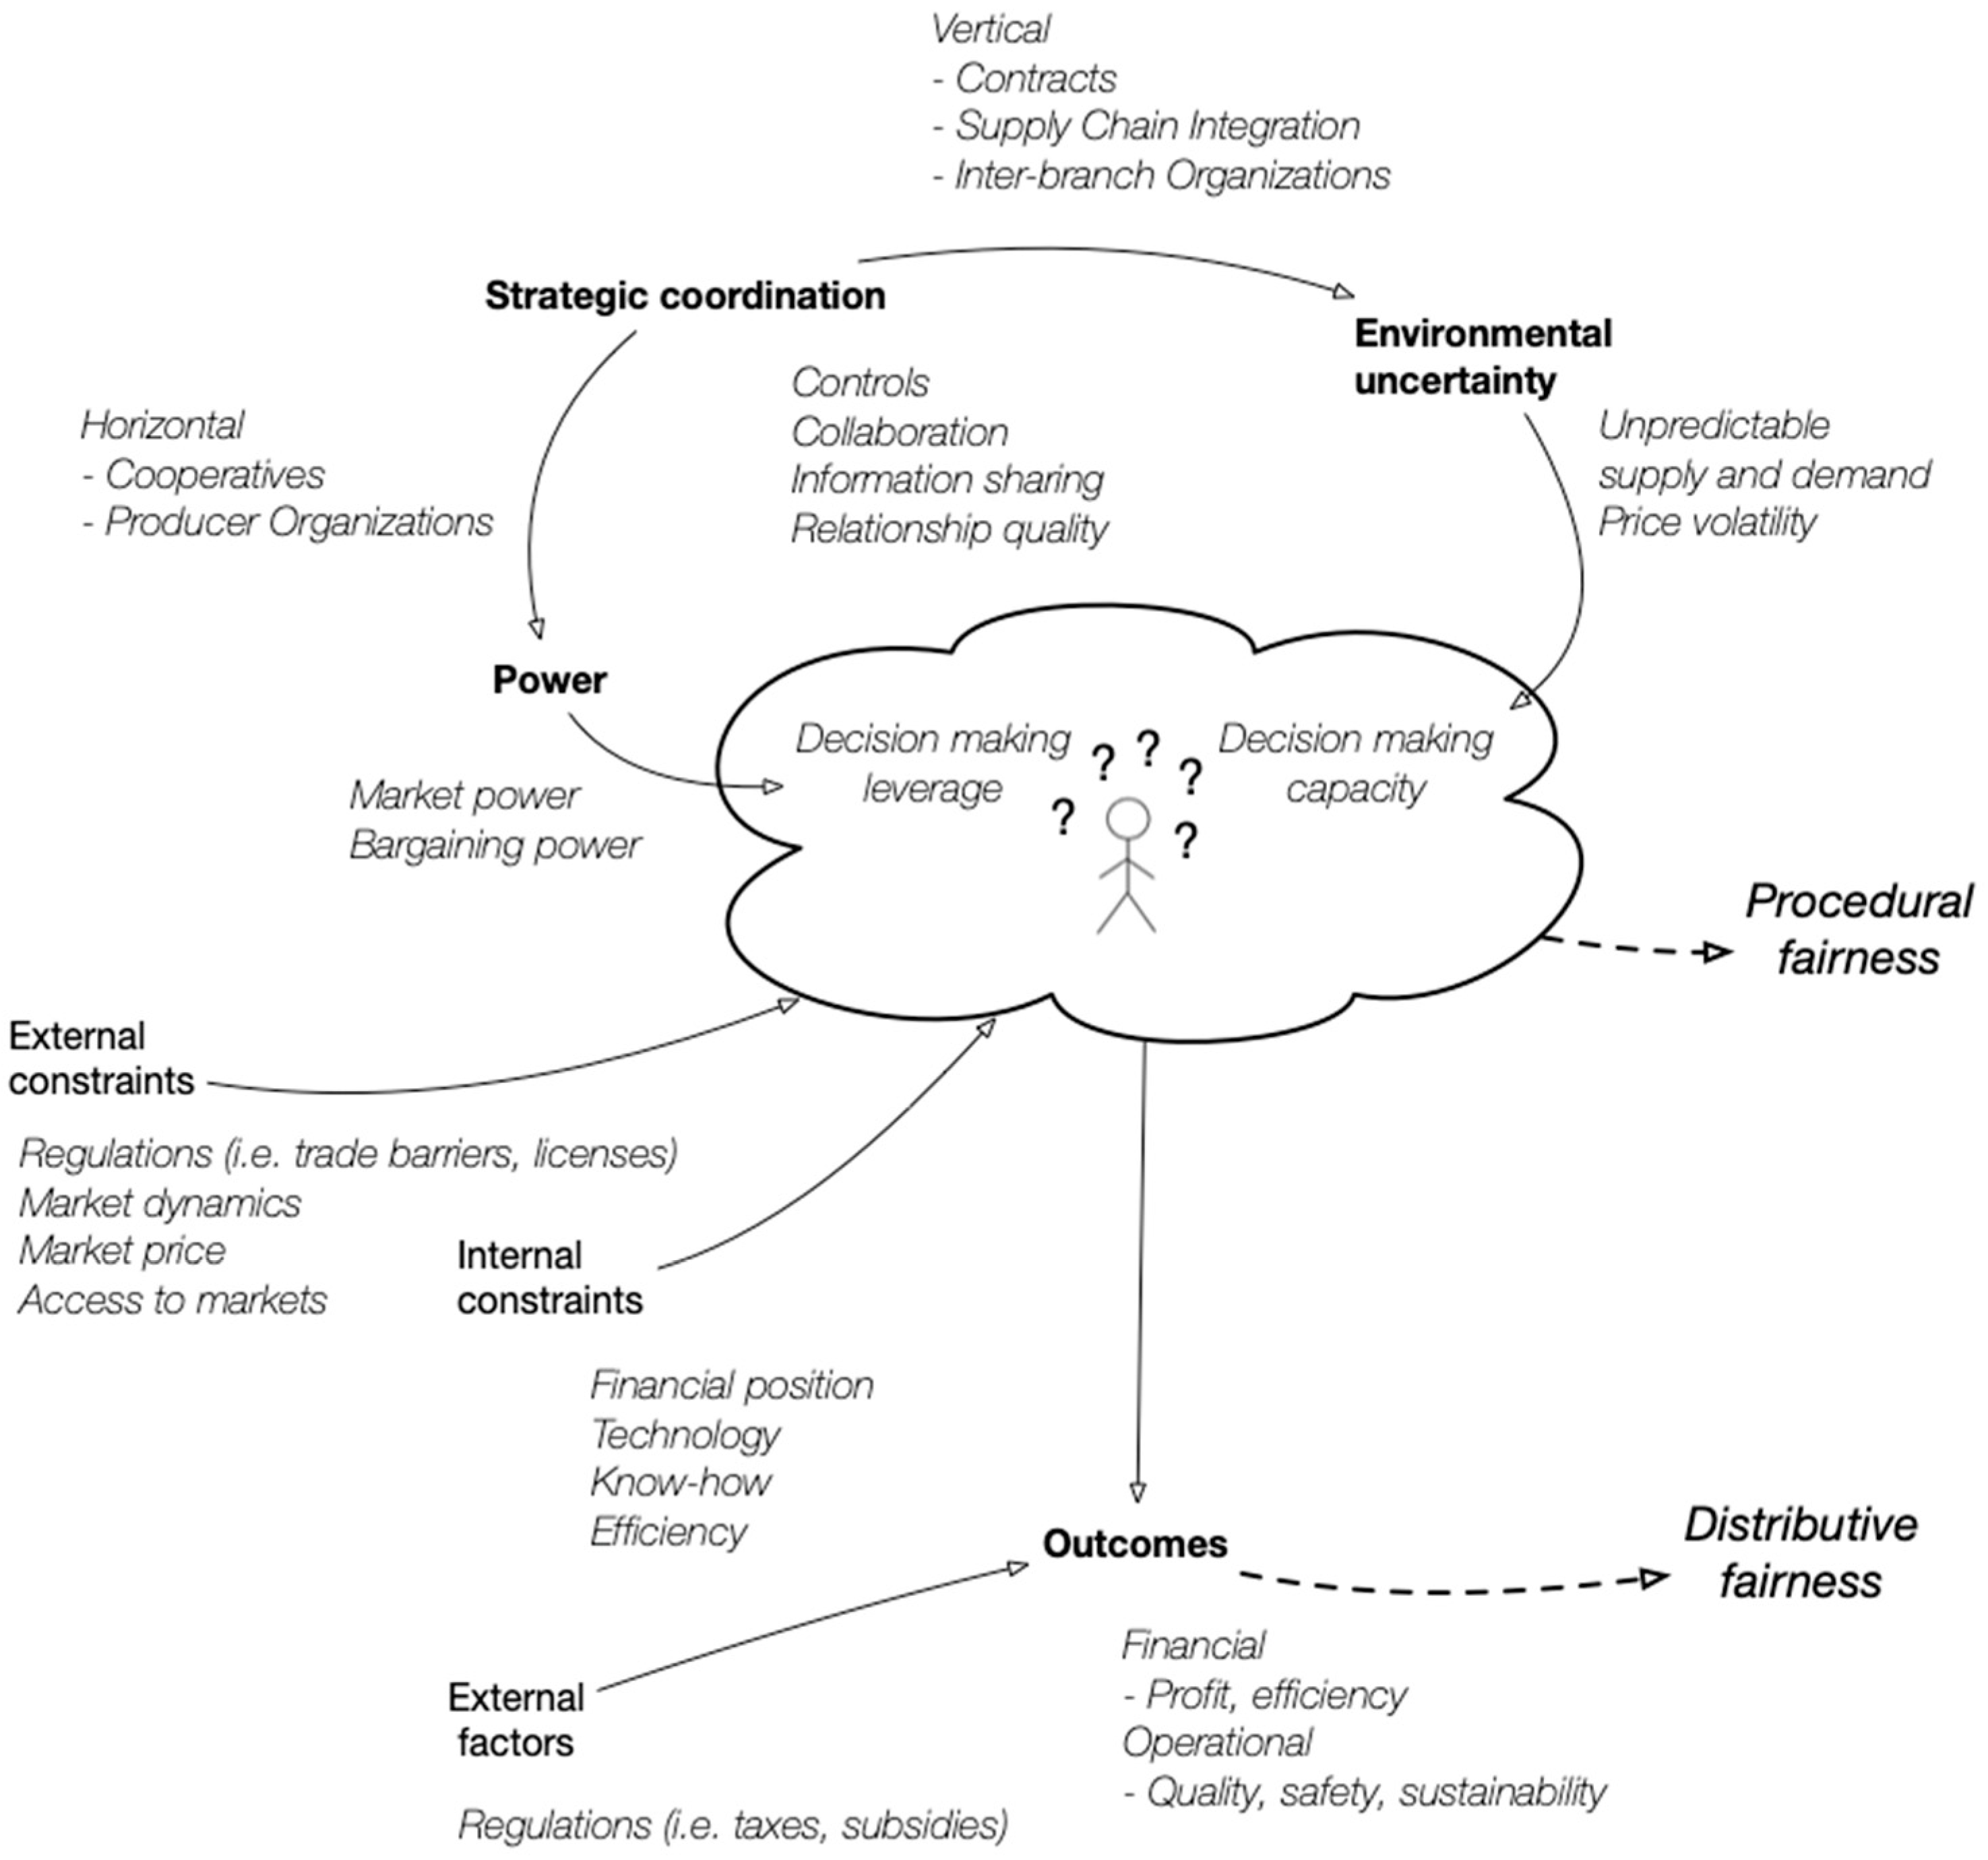
4.2.1. Challenges: Power Asymmetries and Environmental Uncertainty
4.2.2. Coordination Strategies: Controls, Relationship Quality, Collaboration, and Information Sharing
4.2.3. Outcomes: Operational and Financial
4.3. Suggested Simulation Model Indicators of IOF
5. Discussion and Conclusions
Author Contributions
Funding
Institutional Review Board Statement
Informed Consent Statement
Data Availability Statement
Conflicts of Interest
References
- Falkowski, J.; Menard, C.; Sexton, R.J.; Swinnen, J.; Vandevelde, S. Unfair Trading Practices in the Food Supply Chain: A Literature Review on Methodologies, Impacts and Regulatory Aspects; JRC Working Paper; KU Leuven, Faculty of Economics and Business (FEB), LICOS-Centre for Institutions and Economic Performance: Leuven, Belgium, 2017. [Google Scholar]
- Russo, C.; Barathova, K.; Cacchiarelli, L.; Di Fonzo, A.; Lai, M.; Lee, H.; Menapace, L.; Pokrivcak, J.; Rahbauer, S.; Rajcaniova, M.; et al. Pass-Through of Unfair Trading Practices in EU Food Supply Chains: Methodology and Empirical Application; Russo, C., Ed.; Publications Office of the European Union: Luxembourg, 2020. [Google Scholar] [CrossRef]
- Wijnands, J.H.; Van der Meulen, B.M.; Poppe, K.J. Competitiveness of the European Food Industry: An Economic and Legal Assessment 2007; Office for Official Publications of the European Communities: Luxemburg, 2007. [Google Scholar]
- Falkowski, J. Resilience of farmer-processor relationships to adverse shocks: The case of dairy sector in Poland. Br. Food J. 2015, 117, 2465–2483. [Google Scholar] [CrossRef]
- Duffy, R.; Fearne, A.; Hornibrook, S. Measuring distributive and procedural justice: An exploratory investigation of the fairness of retailer-supplier relationships in the UK food industry. Br. Food J. 2003, 105, 682–694. [Google Scholar] [CrossRef]
- European Union. Directive (EU) 2019/633 of the European Parliament and of the Council of 17 April 2019 on unfair trading parctices in business-to-business relationships in the agricultural and food supply chain. Off. J. Eur. Union 2019, L 111, 59–72. [Google Scholar]
- Surana, A.; Kumara, S.; Greaves, M.; Raghavan, U.N. Supply-chain networks: A complex adaptive systems perspective. Int. J. Prod. Res. 2005, 43, 4235–4265. [Google Scholar] [CrossRef]
- Law, A.M.; Kelton, W.D.; Kelton, W.D. Simulation Modeling and Analysis; McGraw-Hill: New York, NY, USA, 2000; Volume 3. [Google Scholar] [CrossRef]
- Davidsson, P. Agent based social simulation: A computer science view. J. Artif. Soc. Soc. Simul. 2002, 5. [Google Scholar] [CrossRef]
- Fitkov-Norris, E.; Yeghiazarian, A. Use of measurement theory for operationalization and quantification of psychological constructs in systems dynamics modelling. J. Phys. Conf. Ser. 2016. [Google Scholar] [CrossRef]
- Jacobsen, C.; Bronson, R. Defining sociological concepts as variables for system dynamics modeling. Syst. Dyn. Rev. 1987, 3, 1–7. [Google Scholar] [CrossRef]
- Adams, J.S. Inequity in social exchange. In Advances in Experimental Social Psychology; Elsevier: Amsterdam, The Netherlands, 1965; pp. 267–299. [Google Scholar] [CrossRef]
- Thibaut, J.; Walker, L. Procedural Justice: A Psychological Analysis; Erlbaum: Hillsdale, NJ, USA, 1975. [Google Scholar]
- Bies, R.J.; Moag, J.F. Interactional justice: Communication criteria of fairness. In Research on Negotiations in Organizations, Lewicki, R.J., Sheppard, B.H., Bazerman, M.H., Eds.; Lewicki, R.J., Sheppard, B.H., Bazerman, M.H., Eds.; JAI Press: Greenwich, CT, USA, 1986; pp. 43–55. [Google Scholar]
- Greenberg, J. Organizational justice: Yesterday, today, and tomorrow. J. Manag. 1990, 16, 399–432. [Google Scholar] [CrossRef]
- Colquitt, J.A.; Conlon, D.E.; Wesson, M.J.; Porter, C.O.; Ng, K.Y. Justice at the millennium: A meta-analytic review of 25 years of organizational justice research. J. Appl. Psychol. 2001, 86, 425. [Google Scholar] [CrossRef]
- Cropanzano, R.; Ambrose, M.L.; Greenberg, J.; Cropanzano, R. Procedural and distributive justice are more similar than you think: A monistic perspective and a research agenda. Adv. Organ. Justice 2001, 119, 151. [Google Scholar]
- Colquitt, J.A. On the dimensionality of organizational justice: A construct validation of a measure. J. Appl. Psychol. 2001, 86, 386. [Google Scholar] [CrossRef] [PubMed]
- Kaplan, A. The Conduct of Inquiry: Methodology for Behavioral Science; Chandler Pub. Co.: San Francisco, CA, USA, 1964. [Google Scholar]
- Stevens, S.S. On the theory of scales of measurement. Science 1946, 103, 677–680. [Google Scholar] [CrossRef] [PubMed]
- Nuthmann, C. Using human judgment in system dynamics models of social systems. Syst. Dyn. Rev. 1994, 10, 1–27. [Google Scholar] [CrossRef]
- Darity, W.A. International Encyclopedia of the Social Sciences; Macmillan Reference USA: Detroit, MI, USA, 2008. [Google Scholar]
- Kumar, N.; Scheer, L.K.; Jan-Benedict, E.M.S. The Effects of Supplier Fairness on Vulnerable Resellers. J. Mark. Res. 1995, 32, 54–65. [Google Scholar] [CrossRef]
- Busch, G.; Spiller, A. Farmer share and fair distribution in food chains from a consumer’s perspective. J. Econ. Psychol. 2016, 55, 149–158. [Google Scholar] [CrossRef]
- Kumar, N. The power of trust in manufacturer-retailer relationships. Harv. Bus. Rev. 1996, 74, 92. [Google Scholar]
- Leventhal, G.; Karuza, J.; Fry, W.R. Beyond Fairness: A Theory of Allocation Preferences. Justice Soc. Interact. 1980, 3, 167–218. [Google Scholar]
- Chiu, S.-P.; Chou, H.-W.; Chiu, C.-M. The antecedents of buyers’ perceived justice in online markets. Cyberpsychology Behav. Soc. Netw. 2013, 16, 536–542. [Google Scholar] [CrossRef]
- Sun, Y.; Liu, Z.; Yang, H. How Does Suppliers’ Fairness Affect the Relationship Quality of Agricultural Product Supply Chains? J. Food Qual. 2018, 2018, 15. [Google Scholar] [CrossRef]
- Zaefarian, G.; Najafi-Tavani, Z.; Henneberg, S.C.; Naudé, P. Do supplier perceptions of buyer fairness lead to supplier sales growth? Ind. Mark. Manag. 2016, 53, 160–171. [Google Scholar] [CrossRef]
- Ziaullah, M.; Feng, Y.; Shumaila, N.S.; Saleem, A. An investigation of justice in supply chain trust and relationship commitment-An empirical study of Pakistan. J. Compet. 2015, 7. [Google Scholar] [CrossRef]
- Luo, Y. Procedural fairness and interfirm cooperation in strategic alliances. Strateg. Manag. J. 2008, 29, 27–46. [Google Scholar] [CrossRef]
- Hofer, A.R.; Knemeyer, A.M.; Murphy, P.R. The roles of procedural and distributive justice in logistics outsourcing relationships. J. Bus. Logist. 2012, 33, 196–209. [Google Scholar] [CrossRef]
- Liu, Y.; Huang, Y.; Luo, Y.; Zhao, Y. How does justice matter in achieving buyer–supplier relationship performance? J. Oper. Manag. 2012, 30, 355–367. [Google Scholar] [CrossRef]
- Luo, Y. From gain-sharing to gain-generation: The quest for distributive justice in international joint ventures. J. Int. Manag. 2009, 15, 343–356. [Google Scholar] [CrossRef]
- Choi, C.-B. Overseas exporter fairness and Korean importer’s commitment. J. Korea Trade 2016, 20, 186–198. [Google Scholar] [CrossRef]
- Qiu, T. Dependence concentration and fairness perceptions in asymmetric supplier–buyer relationships. J. Mark. Manag. 2018, 34, 395–419. [Google Scholar] [CrossRef]
- Wölfel, J.; Grosse-Ruyken, P.T. Fairness of the NPD partnership’s financial distribution pie. J. Bus. Ind. Mark. 2019, 34, 1016–1029. [Google Scholar] [CrossRef]
- Huo, B.; Wang, Z.; Tian, Y. The impact of justice on collaborative and opportunistic behaviors in supply chain relationships. Int. J. Prod. Econ. 2016, 177, 12–23. [Google Scholar] [CrossRef]
- Kang, B.; Jindal, R.P. Opportunism in buyer–seller relationships: Some unexplored antecedents. J. Bus. Res. 2015, 68, 735–742. [Google Scholar] [CrossRef]
- Brown, J.R.; Cobb, A.T.; Lusch, R.F. The roles played by interorganizational contracts and justice in marketing channel relationships. J. Bus. Res. 2006, 59, 166–175. [Google Scholar] [CrossRef]
- Srinivasan, R.; Narayanan, S.; Narasimhan, R. An investigation of justice, conflict, and moderating effects of supplier autonomy and cultural distance in buyer–supplier relationships. IEEE Trans. Eng. Manag. 2017, 65, 6–20. [Google Scholar] [CrossRef]
- Griffith, D.A.; Harvey, M.G.; Lusch, R.F. Social exchange in supply chain relationships: The resulting benefits of procedural and distributive justice. J. Oper. Manag. 2006, 24, 85–98. [Google Scholar] [CrossRef]
- Kaynak, R.; Sert, T.; Sert, G.; Akyuz, B. Supply chain unethical behaviors and continuity of relationship: Using the PLS approach for testing moderation effects of inter-organizational justice. Int. J. Prod. Econ. 2015, 162, 83–91. [Google Scholar] [CrossRef]
- Carnovale, S.; Henke, J.W., Jr.; DuHadway, S.; Yeniyurt, S. Unintended consequences: How suppliers compensate for price concessions and the role of organizational justice in buyer-supplier relations. J. Bus. Logist. 2019, 40, 187–203. [Google Scholar] [CrossRef]
- Grace, A.; Frazer, L.; Weaven, S.; Perkins, H.; Shao, W.; Nyadzayo, M. Franchisee advisory councils and justice: Franchisees finding their voice. J. Strateg. Mark. 2020, 1–20. [Google Scholar] [CrossRef]
- Hoppner, J.J.; Griffith, D.A.; Yeo, C. The intertwined relationships of power, justice and dependence. Eur. J. Mark. 2014, 48, 1690–1708. [Google Scholar] [CrossRef]
- Luo, Y. The independent and interactive roles of procedural, distributive, and interactional justice in strategic alliances. Acad. Manag. J. 2007, 50, 644–664. [Google Scholar] [CrossRef]
- Wang, A.; Dyball, M.C. Management controls and their links with fairness and performance in inter-organisational relationships. Account. Financ. 2019, 59, 1835–1868. [Google Scholar] [CrossRef]
- Zhou, M.; Govindan, K.; Xie, X. How fairness perceptions, embeddedness, and knowledge sharing drive green innovation in sustainable supply chains: An equity theory and network perspective to achieve sustainable development goals. J. Clean. Prod. 2020, 260, 120950. [Google Scholar] [CrossRef]
- Wu, L.; Chiu, M.-L. Examining supply chain collaboration with determinants and performance impact: Social capital, justice, and technology use perspectives. Int. J. Inf. Manag. 2018, 39, 5–19. [Google Scholar] [CrossRef]
- Sorrentino, A.; Russo, C.; Cacchiarelli, L. Market Power and Bargaining Power in the EU Food Supply Chain. The Role of Producer Organizations. New Medit 2018, 17. [Google Scholar] [CrossRef]
- Bonanno, A.; Russo, C.; Menapace, L. Market power and bargaining in agrifood markets: A review of emerging topics and tools. Agribusiness 2018, 34, 6–23. [Google Scholar] [CrossRef]
- Kirkwood, J.B. Buyer power and exlusionary conduct: Should brooke group set the standards for buyer-induced price discrimination and predatory bidding. Antitrust LJ 2004, 72, 625. [Google Scholar]
- Cox, A.; Ireland, P.; Lonsdale, C.; Sanderson, J.; Watson, G. Supply Chains, Markets and Power: Managing Buyer and Supplier Power Regimes; Routledge: New York, NY, USA, 2002. [Google Scholar]
- Gorton, M.; Angell, R.; Dries, L.; Urutyan, V.; Jackson, E.; White, J. Power, buyer trustworthiness and supplier performance: Evidence from the Armenian dairy sector. Ind. Mark. Manag. 2015, 50, 69–77. [Google Scholar] [CrossRef]
- Davis, T. Effective supply chain management. Sloan Manag. Rev. 1993, 34, 35. [Google Scholar]
- Fynes, B.; De Búrca, S.; Marshall, D. Environmental uncertainty, supply chain relationship quality and performance. J. Purch. Supply Manag. 2004, 10, 179–190. [Google Scholar] [CrossRef]
- Gilbert, C.L.; Morgan, C.W. Food price volatility. Philos. Trans. R. Soc. B Biol. Sci. 2010, 365, 3023–3034. [Google Scholar] [CrossRef]
- Fischer, C.; Hartmann, M.; Reynolds, N.; Leat, P.; Revoredo-Giha, C.; Henchion, M.; Albisu, L.M.; Gracia, A. Factors influencing contractual choice and sustainable relationships in European agri-food supply chains. Eur. Rev. Agric. Econ. 2009, 36, 541–569. [Google Scholar] [CrossRef]
- Hendrikse, G. Governance of chains and networks: A research agenda. J. Chain Netw. Sci. 2003, 3, 1–6. [Google Scholar] [CrossRef]
- Gereffi, G.; Lee, J. Economic and social upgrading in global value chains and industrial clusters: Why governance matters. J. Bus. Ethics 2016, 133, 25–38. [Google Scholar] [CrossRef]
- Sporleder, T.L. Managerial economics of vertically coordinated agricultural firms. Am. J. Agric. Econ. 1992, 74, 1226–1231. [Google Scholar] [CrossRef]
- Peterson, H.C.; Wysocki, A.; Harsh, S.B. Strategic choice along the vertical coordination continuum. Int. Food Agribus. Manag. Rev. 2001, 4, 149–166. [Google Scholar] [CrossRef]
- Bijman, J.; Hanisch, M. Support for Farmers’ Cooperatives; Developing a Typology of Cooperatives and Producer Organisations in the EU; Wageningen UR: Wageningen, The Netherlands, 2012. [Google Scholar]
- Henson, S.; Reardon, T. Private agri-food standards: Implications for food policy and the agri-food system. Food Policy 2005, 30, 241–253. [Google Scholar] [CrossRef]
- Kister, J. Fair trade in Germany left the niche market. Power shifts observed in global fair trade value chains. Econ. Agro-Aliment. 2013. [Google Scholar] [CrossRef]
- Lehmann, R.J.; Reiche, R.; Schiefer, G. Future internet and the agri-food sector: State-of-the-art in literature and research. Comput. Electron. Agric. 2012, 89, 158–174. [Google Scholar] [CrossRef]
- Saurabh, S.; Dey, K. Blockchain technology adoption, architecture, and sustainable agri-food supply chains. J. Clean. Prod. 2020. [Google Scholar] [CrossRef]
- Papa, S.F. Use of blockchain technology in agribusiness: Transparency and monitoring in agricultural trade. In Proceedings of the 2017 International Conference on Management Science and Management Innovation (MSMI 2017), Suzhou, China, 23–25 June 2017. [Google Scholar] [CrossRef]
- Bertazzoli, A.; Ghelfi, R.; Rivaroli, S.; Samoggia, A. Value sharing and food system dynamics for milk, tomato, and cereals food chains. Int. J. Food Syst. Dyn. 2010, 1, 330–341. [Google Scholar] [CrossRef]
- Canning, P.; Weersink, A.; Kelly, J. Farm share of the food dollar: An IO approach for the United States and Canada. Agric. Econ. 2016, 47, 505–512. [Google Scholar] [CrossRef]
- Barling, D.; Gresham, J. Governance in European Food Value Chains; VALUMICS “Understanding Food Value Chains and Network Dynamics”, funded by European Union’s Horizon 2020 research and innovation programme GA No 727243. Deliverable: D5.1; University of Hertfordshire: Hartfield, UK, 2019; p. 237. [Google Scholar]
- Seják, J.; Zaviral, J. Growing inequalities in added-value distribution in the Czech agri-food chains. Zemed. Ekon. Praha 2007, 53, 235. [Google Scholar] [CrossRef]
- Canning, P. A Revised and Expanded Food Dollar Series: A Better Understanding of Our Food Costs; Economic Research Report 262243; United States Department of Agriculture, Economic Research Service: Washington, DC, USA, 2011. [Google Scholar] [CrossRef]
- Cucagna, M.E.; Goldsmith, P.D. Value adding in the agri-food value chain. Int. Food Agribus. Manag. Rev. 2018, 21, 293–316. [Google Scholar] [CrossRef]
- Phillips, J.M. Antecedents and consequences of procedural justice perceptions in hierarchical decision-making teams. Small Group Res. 2002, 33, 32–64. [Google Scholar] [CrossRef]
- Lerner, A.P. The Concept of Monopoly and the Measurement of Monopoly Power. Rev. Econ. Stud. 1934, 1, 157–175. [Google Scholar] [CrossRef]
- Čechura, L.; Jamali Jaghdani, T.; Samoggia, A. Imperfections in Italian Tomato Food Chain. In Proceedings of the 60th Annual Conference of the German Association of Agricultural Economists (GEWISOLA), Halle/Saale, Germany, 23–25 September 2020. [Google Scholar] [CrossRef]
- Hippel, P.V. Skewness. In International Encyclopedia of Statistical Science; Lovric, M., Ed.; Springer: Berlin/Heidelberg, Germany, 2011; pp. 1340–1342. [Google Scholar] [CrossRef]
- Swinnen, J.F.; Vandeplas, A. Market power and rents in global supply chains. Agric. Econ. 2010, 41, 109–120. [Google Scholar] [CrossRef]
- Kuosmanen, T.; Niemi, J. What explains the widening gap between the retail and producer prices of food? Agric. Food Sci. 2009, 18. [Google Scholar] [CrossRef]


| Factor Group | Factor | Reference | Definition |
|---|---|---|---|
| Financial outcomes | Financial outcomes | Luo (2008) [31] | “alliance performance in financial return (i.e., profitability)” |
| Price satisfaction | Sun et al. (2018) [28] | na | |
| Relationship induced financial performance | Wölfel and Grosse-Ruyken (2019) [37] | na | |
| Strategic alliance performance | Luo (2007) [47] | “cooperation payoffs” | |
| Perceived performance | Grace et al. (2020) [45] | “financial goals of running the business” | |
| Production cost optimization | Wölfel and Grosse-Ruyken (2019) [37] | na | |
| Economic satisfaction | Brown et al. (2006) [40] | na | |
| Relationship performance | Hoppner et al. (2014) [46] | “the multidimensional outcomes, including financial, strategic and satisfaction elements, resulting from the activities performed by firms on behalf of the relationship” | |
| Operational outcomes | Operational outcomes | Luo (2008) [31] | “operational consequence (i.e., competitive strength in labor productivity, quality control, technology development, customer service, and managerial efficiency)” |
| Delivery performance | Chiu et al. (2013) [27] | “the time taken to receive the item purchased from a seller” | |
| Contact channel | Chiu et al. (2013) [27] | “the availability of assistance” | |
| Responsiveness | Chiu et al. (2013) [27] | “the willingness to help customers and provide prompt service” | |
| R&D expenditures | Carnovale et al. (2019) | na | |
| Service | Carnovale et al. (2019) | na | |
| Product quality | Wölfel and Grosse-Ruyken (2019) [37] | na | |
| Product innovation | Wölfel and Grosse-Ruyken (2019) [37] | na | |
| Information sharing | Information sharing | Sun et al. (2018) [28] | “effectively using acquired information and rationally sharing information with partners” |
| Knowledge sharing | Liu et al. (2012) [33] | “two firms simultaneously and equally exchange relevant knowledge and information thorough dynamic processes, including both explicit information (e.g., electronic data interchange) and tacit technology know-how” | |
| Information quality | Chiu et al. (2013) [27] | “the quality of information provided by sellers, including relevance, understandability, reliability, adequacy, scope, and perceived usefulness” | |
| Communication | Huo et al. (2016) | “the exchange of information associated with business transactions and related issues with a supply chain partner” | |
| Power | Coercive power | Hoppner et al. (2014) [46] | “based on their partner’s perception that the party has the ability to mediate punishments” |
| Reward power | Hoppner et al. (2014) [46] | “based on their partner’s perception that the party has the ability to mediate rewards” | |
| Controls | Formal controls | Wang and Dyball (2019) [48] | “an architecture that ‘institutionalizes‘ how partners cooperate, interact and learn from each other“,”contracts, planning and budgeting formal authority relationship standardized procedures and rules, supervision performance evaluation, structural grouping and departmentalization and management reports“ |
| Social controls | Wang and Dyball (2019) [48] | “focus on informal cultures and systems, communication, socialization and self-regulation”,”include meetings and organized personal contact, networking and other socialization processes, teams and taskforces, transfer of managers/lateral movements, rituals, traditions and ceremonies rotation of personnel, ad hoc committees, face-to-face communication and participatory decision-making” | |
| Environmental stability | Environmental stability | Sun et al. (2018) [28] | “the ability of an enterprise to forecast the future markets, policies and other factors accurately, according to the current external environment” |
| Relationship quality | Relationship quality | Kumar et al. (1995) [23] | “encompassing conflict, trust, commitment, and two constructs that represent the converse of disengagement—willingness to invest in the relationship and expectation of continuity” |
| Commitment | Sun et al. (2018) [28] | “an ongoing relationship with another and is important enough to warrant a great deal of effort to maintain it” | |
| Liu et al. (2012) [33] | “both parties actively maintain and strengthen the exchange relationship” | ||
| Qui (2018) [36] | “a high level of affective attachment to the relationship and a strong expectation of relationship continuity” | ||
| Zaefarian et al. (2016) [29] | “the willingness of the exchange partners to make short-term sacrifices to develop and maintain long-lasting, stable, and profitable relationships” | ||
| Choi et al. (2016) [35] | na | ||
| Luo (2009) [34] | na | ||
| Trust | Sun et al. (2018) [28] | na | |
| Chiu et al. (2013) [27] | na | ||
| Zaefarian et al. (2016) [29] | “the willingness of the firm to rely on its partner in whom it has confidence” | ||
| Luo (2008) [31] | “the willingness to take a risk in the partnership that is expected to create a higher payoff than pursuing it alone” | ||
| Ziaullah et al. (2015) [30] | “a willingness to rely on the exchange partner” | ||
| Long-term orientation | Griffith et al. (2006) [42] | “when an exchange partner believes that the on-going relationship with another is so important as to warrant maximum effort in maintaining the relationship” | |
| Continuity of relationship | Kaynak et al. (2015) [43] | na | |
| Relationship investment | Liu et al. (2012) [33] | “both parties make idiosyncratic investments in the relationship”,“creates a lock-in situation in which two parties are interdependent and are motivated to maintain the relationship” | |
| Relational behaviours | Griffith et al. (2006) [42] | “desired behaviours on the part of one or more partners in the exchange such as flexibility, sharing of information and solidarity” | |
| Relationship effectiveness | Qui (2018) [36] | “focuses on the extent to which relationship partners find the relational interactions satisfying, productive and worthwhile” | |
| Embeddedness | Zhou et al. (2020) [49] | “represents a kind of reciprocal relationship between partners; it is a type of investment that brings about mutual benefits by way of cooperation, trust, and learning from one another” | |
| Behavioural tension | Wölfel and Grosse-Ruyken (2019) [37] | “characterized by the co-existence of two, contradicting forces with dichotomous goals between partners, which induces conflicts and risks to break up the social exchange” | |
| Conflict | Brown et al. (2006) [40] | na | |
| Task conflict | Srinivasan et al. (2018) [41] | “the awareness that there are differing viewpoints and opinions on task execution among transacting partners” | |
| Opportunism | Wölfel and Grosse-Ruyken (2019) [37] | na | |
| Huo et al. (2016) [38] | “self-interest seeking with guile” | ||
| Dependency | Wölfel and Grosse-Ruyken (2019) [37] | na | |
| Specific investment | Huo et al. (2016) [38] | “tangible and intangible investments in a particular buyer-supplier relationship that are difficult to redeploy to other relationships” | |
| Supply chain collaboration | Wu and Chiu (2018) [50] | “a mechanism to managing interdependencies for operations, product/process designs, marketing effort and sale planning/forecasting, as well as establishing strategic decision among SC members” |
| Factor Groups | Food Supply Chain Manifestation | |
|---|---|---|
| Challenges | Power |
|
| Environmental uncertainty |
| |
| Strategic coordination | Controls, Collaboration, Relationship quality, Information sharing |
|
| Outcomes | Financial outcomes |
|
| Operational outcomes |
|
| Proxy | Measure | Computation | Result Interpretation | |
|---|---|---|---|---|
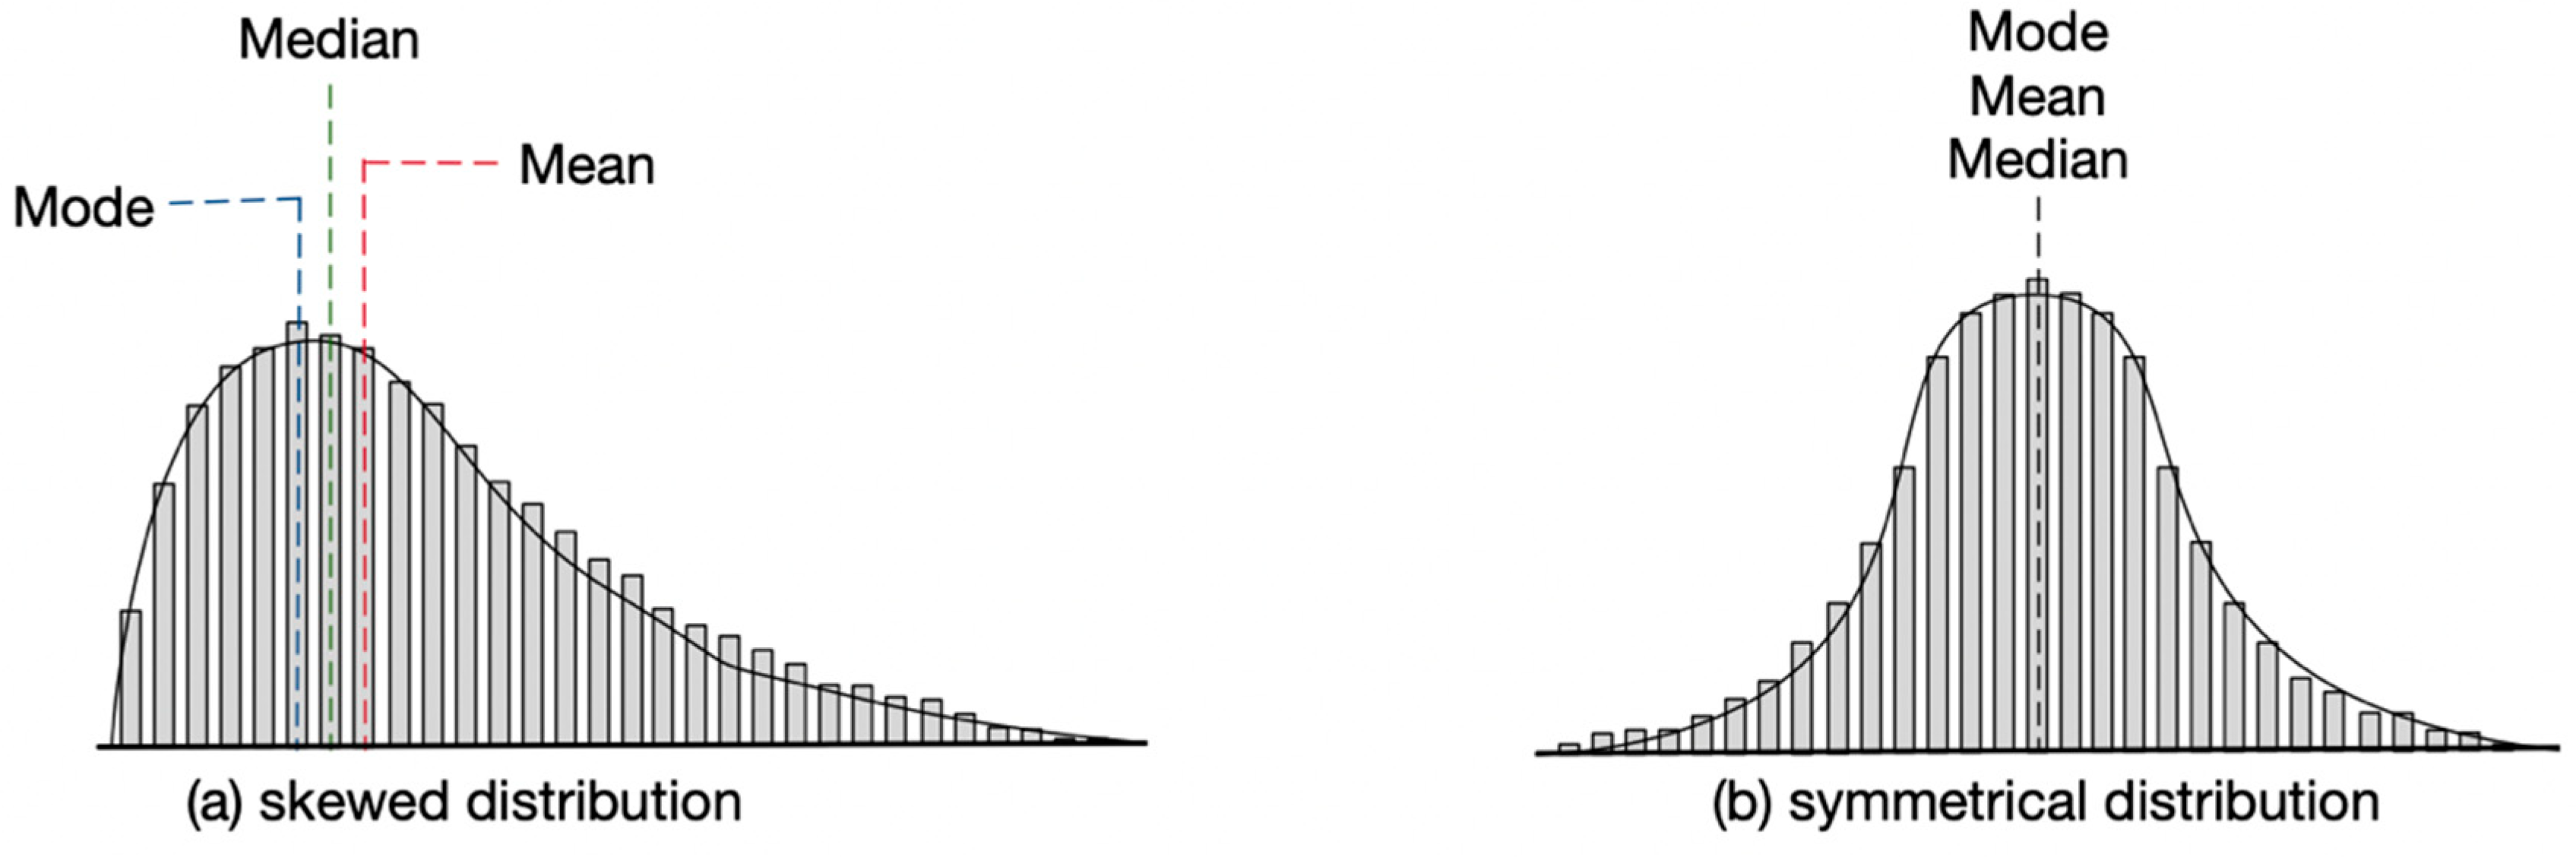
| Distributive fairness | Financial outcomes | Profit margins | Revenues less expenses divided by revenues. | More skewness and spread of the distribution of profit margins (e.g., more difference between the distribution mean and median/mode and more variability) means less overall distributive IOF. |
| Procedural fairness | Bargaining power | No. of available suppliers/buyers | The number of suppliers (buyers) the individual buyer (supplier) can do business with. | More skewness and spread of the distribution of available suppliers/buyers (e.g., more difference between the distribution mean and median/mode and more variability) means less overall procedural IOF. |
| Procedural fairness | Bargaining power | Company size | The total sales/assets of an individual actor. | More skewness and spread of the distribution of total sales/assets (e.g., more difference between the distribution mean and median/mode and more variability) means less overall procedural IOF. |
| Procedural fairness | Seller market power | Lerner index | The difference between the output price of a firm and its marginal cost divided by the output price. | More skewness and spread of the distribution of price mark-up (e.g., more difference between the distribution mean and median/mode and more variability) means less overall procedural IOF. |
| Procedural fairness | Buyer market power | Mark-down index | The difference between the input price of a firm and its marginal cost divided by the input price. | More skewness and spread of the distribution of price mark-down (e.g., more difference between the distribution mean and median/mode and more variability) means less overall procedural IOF. |
Publisher’s Note: MDPI stays neutral with regard to jurisdictional claims in published maps and institutional affiliations. |
© 2021 by the authors. Licensee MDPI, Basel, Switzerland. This article is an open access article distributed under the terms and conditions of the Creative Commons Attribution (CC BY) license (http://creativecommons.org/licenses/by/4.0/).
Share and Cite
Gudbrandsdottir, I.Y.; Olafsdottir, G.; Oddsson, G.V.; Stefansson, H.; Bogason, S.G. Operationalization of Interorganizational Fairness in Food Systems: From a Social Construct to Quantitative Indicators. Agriculture 2021, 11, 36. https://doi.org/10.3390/agriculture11010036
Gudbrandsdottir IY, Olafsdottir G, Oddsson GV, Stefansson H, Bogason SG. Operationalization of Interorganizational Fairness in Food Systems: From a Social Construct to Quantitative Indicators. Agriculture. 2021; 11(1):36. https://doi.org/10.3390/agriculture11010036
Chicago/Turabian StyleGudbrandsdottir, Ingunn Y., Gudrun Olafsdottir, Gudmundur Valur Oddsson, Hlynur Stefansson, and Sigurdur G. Bogason. 2021. "Operationalization of Interorganizational Fairness in Food Systems: From a Social Construct to Quantitative Indicators" Agriculture 11, no. 1: 36. https://doi.org/10.3390/agriculture11010036
APA StyleGudbrandsdottir, I. Y., Olafsdottir, G., Oddsson, G. V., Stefansson, H., & Bogason, S. G. (2021). Operationalization of Interorganizational Fairness in Food Systems: From a Social Construct to Quantitative Indicators. Agriculture, 11(1), 36. https://doi.org/10.3390/agriculture11010036