Abstract
The liveweight of New Zealand beef cows has increased in recent decades due to selection for higher growth rates. Published data suggest that the efficiency of beef cow production decreases with increasing cow liveweight. Changes in beef herd size, feed demand, production, and cash operating surplus (COS) were simulated with average mature cow liveweight varied to 450, 500, 550, and 600 kg. With total annual beef feed demand fixed at the same level, in all scenarios cow numbers and numbers of weaned calves decreased with increasing cow liveweight. When the model was run with consistent efficiency of calf production across the mature cow liveweights (scenario A), heavier cows were more profitable. However, using published efficiency data (scenarios B and C), herds of heavier cows were less profitable. The likely most realistic scenario for New Zealand hill country farms (scenario B) had COS decrease from New Zealand Dollars (NZD) 456/ha with a herd of 450 kg cows to NZD 424/ha with 600 kg cows. Reductions in COS were relatively small, which may not deter farmers from breeding heavier cows for higher calf growth rates. However, the results of this analysis combined with indirect potential economic impacts suggest that the heaviest cows may not be optimal for New Zealand hill country conditions.
Keywords:
herd dynamics; herd size; profit; bio-economic; system dynamics; New Zealand; feed demand; efficiency; weaning weight ratio; WWR 1. Introduction
The mature liveweight of beef cows in New Zealand breeding herds has increased in recent decades due to selection for increased growth rates [1]. Mature cow liveweights of 410 to 530 kg were reported in experimental data from the 1970s and 1980s [2,3,4] and liveweights of 520 to 576 kg were reported between 2008 and 2015 [5,6]. A North Island hill country research station reported that their mature Angus cow liveweights were 430 kg in the 1970s but had increased to 600 kg in 2018 [1]. Cow liveweight is the major parameter influencing their energy demand for maintenance [7,8] and maintenance accounts for the majority (i.e., 70% to 75%) of their total annual feed demand [9]. Therefore, it is likely that the proportion of feed demand accounted for by breeding cow maintenance has increased in New Zealand beef herds due to their increasing mature liveweight.
The ratio of calf weaning weight to cow (dam) liveweight (WWR) has been utilised as a measure of beef cow efficiency [3,10,11,12,13,14,15], with a higher WWR being considered more efficient. Optimum beef cow liveweight has also been explored [16,17,18]. Smeaton et al. [16] identified a liveweight of 440 kg to be optimal for New Zealand Hereford × Friesian beef cattle. Stewart and Martin [17] found cow liveweights of 465 to 493 kg to be optimum for American Angus cows depending on the performance criteria assessed, while Arango and Van Vleck [18] suggested optimal beef cow liveweight to differ according to production system, management, breed, and environmental conditions.
Published data show that, although heavier cows usually give birth to and wean a heavier calf, WWR decreases with increasing cow liveweight (Figure 1) [4,5,10,11,13,14,15,16,17,19,20,21,22,23,24,25]. Figure 1 indicates that a 450 kg cow on average produces a calf weighing 8% (36 kg) of cow liveweight at birth and 46% (207 kg) of cow liveweight at weaning, while a 600 kg cow on average rears a calf weighing 7% of cow liveweight at birth and 39% of cow liveweight at weaning. Therefore, while heavier cows will likely produce a heavier calf, their greater feed demand and relatively lower WWR may result in heavier cows using a lower proportion of feed directly for production and thus being less efficient.
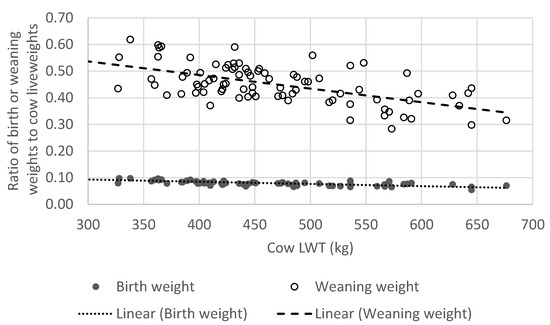
Figure 1.
Ratio of calf birth and weaning weight to cow liveweight (LWT) [4,5,10,11,13,14,15,16,17,19,20,21,22,23,24,25]. Linear regressions were: weaning weight = 0.683 − 0.000466 × cow LWT and birth weight = 0.124 − 0.000097 × cow LWT.
The increasing liveweight of beef cows in New Zealand herds may have reduced the proportion of feed used directly for production and limit total herd size with a fixed total annual cattle feed demand. However, there is a lack of economic analysis of the effect of farming heavier beef cows and quantification of impacts would be useful for the New Zealand beef production industry. Bio-economic modelling can simulate changes in the bio-physical aspects of the farm and their interactions with the economic component [26], such as changes in production and profit due to changes in the mature liveweight of beef cows. The objectives of this study were to utilise a bio-economic system-dynamics model of a beef cow herd on a New Zealand sheep and beef cattle farm to quantify changes in beef herd size, calf production, feed demand, and profit with changes in mature cow liveweight.
2. Materials and Methods
The farm system under consideration was a New Zealand East Coast North Island hill country sheep and beef cattle farm. Farm and beef herd characteristics were based on average values from industry survey data for East Coast North Island hill country farms in the 2017/2018 production year [27]. This farm system has both beef and sheep production enterprises, where beef cattle account for an average of 40% of total feed consumed and the remainder is consumed by sheep [27]. A beef enterprise with a herd of breeding cows producing calves for replacements and meat production (also called suckler beef systems) was the focus of this analysis. The farm was 530 ha in area, with a self-replacing herd of beef cows calving annually in spring and extensively grazing pasture year round, typically without diet supplementation [27]. Cattle were assumed to be sold either at weaning in autumn (weaner calves and cull cows) or prior to breeding in spring (steers and one-year-old heifers not required for breeding). Assumptions of numbers of cows sold at the various timings were informed by industry survey data and are covered in Section 2.4 [27]. The proportion of feed consumed by the beef herd, 40%, was used to estimate operating expenses and farm area applicable to the beef enterprise. Total annual feed demand for beef cattle was maintained at 40% of total farm feed consumed for all scenarios, and therefore it was assumed that the on-farm sheep enterprise was not affected by the modelled changes in mature cow liveweight.
The bio-economic system-dynamics model used in this study was constructed using STELLA version 1.9.3 [28]. The model was previously used by [26,29] to investigate profitability scenarios for New Zealand sheep farming enterprises with various system changes. The model was extended to include component modules of herd dynamics for the self-replacing beef herd (including calf production), annual beef feed demand, and beef enterprise economics. Detail on beef model workings and changes between differing scenarios are given in the following subsections.
2.1. Beef Herd
Figure 2 shows a simplified diagram of the beef herd dynamics. Cows in each age (i) class (Yi) each year were the sum of cows in the previous age class (Yi−1) less cows leaving the herd due to deaths (Di−1) and culling (Ci−1) (Equation (1)). The cattle herd (H) was therefore the sum of cows in 10 age classes (Equation (2)), as beef cows in New Zealand are not recommended to be culled for age until 10 years of age [30]. Herd replacement requirements (R) were the sum of all cows leaving the herd due to death and culling in order to maintain the size of the self-replacing herd (Equation (3)). A death rate of 2.2% for Y2 to 10 cows was assumed [27], which included missing cows. A cull rate of 16% was assumed for Y2 to 10 cows based on the assumed calf weaning rate (CR) of 84%, this resulted in a herd replacement rate of 22%, with cull cows assumed to be those not pregnant and/or not having reared a calf to weaning [3,27,31]. All cows in Y10 were culled after weaning, and therefore they would wean 8 calves in total during their lifetime. A death rate of 1.1% was assumed for Y1 heifer cows and steers [27].
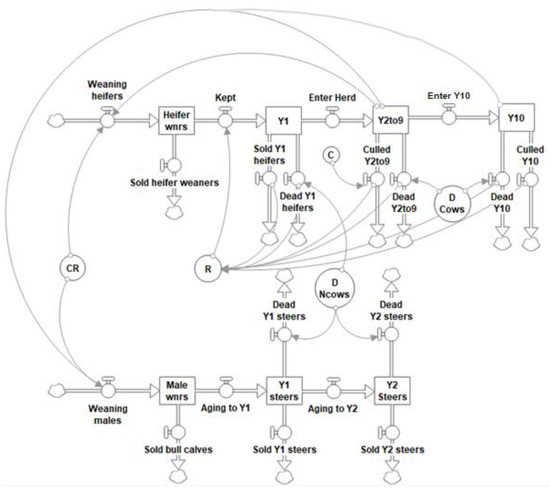
Figure 2.
Simplified diagram of the beef dynamics module with cattle in various stock classes and their entering and leaving the herd. The number of weaned calves (heifer and male wnrs) was the product of calving rate (CR) and cows (Y1 to 10). Required replacement heifer calves (R) were the sum of all dead, sold, and culled one to ten-year-old heifers and cows. Numbers of dead cows (Y2 to 10) were determined by their death rate (D cows) and numbers of dead heifers and steers were determined by their death rate (D Ncows). Numbers of culled Y2 to 9 cows were determined by their culling rate (C) and all Y10 cows were culled after weaning a calf.
Numbers of calves weaned (CW) were estimated from Equation (4) as a function of cows presented for breeding (Y2 to 10) and CR (weaning rate as calves weaned per cow presented for breeding), with Y2 cows calving as they entered Y2 at 24 months of age after being bred in Y1 at 15 months of age. Heifers in New Zealand beef herds are not always bred to calve at 24 months of age [32]. However, in this analysis, it was assumed that Y2 cows were bred and their weaning rate was consistent with older cows [31,32].
Numbers of weaned male calves were estimated to be half of calves from Equation (4). Numbers of steers in Y1 and Y2 were then determined according to numbers sold and dead from the previous age class as in Equation (1).
2.2. Cattle Liveweights
Mature Y3 to 10 cow liveweights were varied to 450, 500, 550, and 600 kg weights at weaning to reflect the range of cow liveweights in New Zealand beef herds during recent decades [1,2,3,4,5,6,13], and these liveweights were used in maintenance feed demand predictions. As well as mature cow liveweights, liveweights of non-mature cattle varied in the different scenarios (Table 1, Table 2 and Table 3), these differences were used in predictions of sale weights and feed demand. Ratios of calf birth and weaning weights to mature cow liveweight at weaning from Figure 1 informed the differences in non-mature cattle liveweights between scenarios A, B, and C. The variations in cattle liveweights between scenarios A, B, and C represented different efficiency scenarios of calf production.

Table 1.
Liveweights for cattle for scenario A with varying mature cow liveweight. Calf birth, weaning, heifer entering Y1, and heifer entering Y2 weights were consistently 7%, 43%, 55%, and 80% of mature cow liveweight, respectively. Heifers were 12 months of age when entering Y1 and 24 months of age when entering Y2.
Table 2.
Liveweights for cattle for scenario B with varying mature cow liveweight. Calf birth and weaning weights were decreasing ratios of mature cow liveweights as cow liveweight increased. Heifers were 12 months of age when entering Y1 and 24 months of age when entering Y2.
Table 3.
Liveweights for cattle for scenario C with varying mature cow liveweight. Calf birth weights were decreasing ratios of mature cow liveweight as cow liveweight increased and all calves were assumed to grow at 1.00 kg/day until weaning. Heifers were 12 months of age when entering Y1 and 24 months of age when entering Y2.
For scenario A (Table 1), the average birth and weaning weight ratios from Figure 1 of 7% and 43%, respectively, were applied across all mature cow liveweights. Therefore, it was assumed that cows of all modelled liveweights were equally efficient. Scenario A assumed heifer and steer liveweights to be 55% of mature cow liveweight when entering Y1 (to achieve 60% of mature liveweight for breeding at 15 months of age for heifers [33]) and 80% of mature liveweight when entering Y2 [34].
The trend of increasing beef cow liveweight in New Zealand has been driven by selection for faster growth rates [1], as larger cows generally produce calves with higher post-weaning growth rates [11]. Post-weaning growth rates of New Zealand beef heifers to Y1 (i.e., from six to 12 months of age) of 0.39 to 0.45 kg/day and from Y1 to Y2 (i.e., from 12 to 24 months of age) of 0.37 to 0.34 kg/day have previously been reported in experimental data [35,36]. Heifer growth rates over winter, when heifers and cows are a low priority stock class on farm, of 0.2 to 0.3 kg/day have been considered satisfactory by industry standards [34]. Therefore, post-weaning growth rates to Y1 and Y2 of 0.30 to 0.41 kg/day and higher with heavier mature cow liveweight assumed in the current analysis were likely similar to those in commercial New Zealand beef herds.
For scenario B (Table 2), average ratios of birth and weaning weights for each mature cow liveweight from Figure 1 were used to estimate birth and weaning weights. Birth weights were 8.0%, 7.5%, 7.0%, and 6.5% and weaning weights were 46%, 44%, 41%, and 39% for calves from cows weighing 450, 500, 550, and 600 kg, respectively. Therefore, the previously published data which indicated heavier beef cows to be less efficient were included in this scenario. The differences in weaning weights of calves from cows of each liveweight between scenarios A and B were used to adjust non-mature cattle liveweights. For example, with a mature cow liveweight of 450 kg, calf weaning weight was 15 kg lighter in scenario B than scenario A. Cattle were then 15 kg lighter in scenario B when sold and when entering the next age class until they reached their mature liveweight.
For scenario C (Table 3), birth weights were predicted according to ratios for each mature cow liveweight from Figure 1 just as was done in scenario B, then weaning weights were based on pre-weaning growth rates of 1.00 kg/day for all calves. This scenario modelled the efficiency of calf production if all cows achieved the pre-weaning growth rate identified by Beef + Lamb New Zealand as an industry target [30,34,37]. Differences in weaning weights between scenarios A and C were then used to adjust non-mature cattle liveweights in scenario C in the same way they were adjusted for scenario B.
2.3. Feed Demand
Total annual cattle feed demand was maintained at 40% of total farm feed supply for all scenarios modelled, achieved though adjusting numbers of cows in age classes Y1 to 10. Cattle feed demand was estimated in megajoules of metabolisable energy (MJ ME) for each stock class and for daily maintenance energy (MEm) was predicted according to Equation (5) [7].
where LW = liveweight (kg) shown in Table 1, Table 2 and Table 3, i = the age class of the animal in years, and Q = pasture quality measured as MJ ME/kg DM, assumed to be 10 MJ ME/kg DM, which is considered a medium-quality pasture on New Zealand sheep and beef farms [38]. Mature cows gained 6% of their liveweight during lactation which was then lost between weaning and calving, typical of beef cows in New Zealand hill country systems due to seasonal changes in the prioritisation of their feed demand relative to other stock classes on farm [24]. Feed demand for the liveweight change of mature cows was 50 MJ ME required for each kg of gain and 30 MJ ME converted from each kg of liveweight loss. Feed demand for liveweight gain of younger cattle was 35 MJ ME required for each kg [8] and, for a given mature cow liveweight, heifers with lower weaning weights were required to gain more weight before entering Y3. Liveweight values used to predict maintenance demand for cattle younger than Y3 were averages for that class of animal while on farm. For example, in scenario A, the feed demand for maintenance of Y1 heifers assumed a liveweight of 68% of mature cow liveweight (an average of their weights when entering Y1 and Y2). Bulls were assumed to be on farm at a ratio of one bull per 35 cows in Y2 to 10 age classes [31] and to have a mature liveweight of 140% of mature cow liveweight, while steers were assumed to have a mature liveweight of 120% of mature cow liveweight [7].
Cows were assumed to begin calving in spring on 1 September [34,39] (the shortest day in New Zealand occurs on 21 June). Feed demand for gestation (MEG) was predicted on a per calf foetus basis for the entire gestation from Equation (6) [8]. An assumed combined foetus and calf loss rate (from pregnancy diagnosis to weaning) of 10% [3,27,31] was combined with the weaning rate to estimate numbers of foetuses for gestation feed demand estimations. Therefore, when calving rate was 84%, estimated feed demand for gestation from Equation (6) was for 0.93 foetuses per cow. Feed demand for lactation (MEL) was predicted per calf for the entire lactation according to Equation (7) [8].
where b is calf birthweight (kg), WW = calf liveweight at weaning (kg), and α = calf age at weaning in weeks. Calves were assumed to be weaned at 26 weeks of age [5,13,17,24], with birth and weaning weights shown in Table 1, Table 2 and Table 3. Calf weaning age was 26 weeks regardless of differences in weaning weight, assuming weaning date was determined by labour availability and a pre-determined sale date [30]. The calving pattern was assumed to be 40%, 31%, 23%, and 6% of calves born in the first, second, third, and fourth fortnight, respectively, based on an approximately 63 day breeding period with very few calves assumed to have been born after day 56 of calving [24,31].
2.4. Cattle Sale Policies
Cull Y2 to 10 cows were all sold in early March within a fortnight of weaning and pregnancy diagnosis, assumed to be those identified as not pregnant or not to have weaned a calf. Weaner calves were sold within a fortnight of weaning, having post-weaning growth rates of 0.65 kg/day during the week between their weaning and sale [34]. Sold weaner calves were 29% of male calves and the number of heifer calves sold was determined by those not required for herd replacement as estimated from Equation (3). Sold Y1 steers (33% of Y1 steers) and sold heifers (20% of Y1 heifers) were assumed to be sold mid-November prior to breeding [27]. It was assumed that all Y2 steers were also sold mid-November. Male cattle were assumed to have a mean carcass dressing out percentage of 52% and female cattle were assumed to have a mean carcass dressing out percentage of 50% [6,40,41,42].
2.5. Economics
Annual beef enterprise cash operating surplus (COS) was used as an indicator of changes in profit and was estimated from gross cash income from beef cattle sales less beef enterprise related operating expenses. As total annual cattle feed demand was fixed at 40% of farm feed, sheep enterprise COS was assumed not to change between modelled scenarios. Prices for sold cattle were 2017/2018 industry values on a per kg basis [27], shown in Table 4. Prices were combined with liveweights according to Table 1, Table 2 and Table 3 along with numbers of beef sold in the herd dynamics module to estimate total annual income from cattle sales.
Table 4.
Prices for sold cattle [27,43].
Beef operating expenses were assumed to be NZD 52.80 per beef cattle stock unit [27]. Operating expenses were comprised of beef production related variable expenses and the enterprise share of fixed expenses (including expenses for animal health, repairs and maintenance, vehicles, administration, Accident Compensation Corporation levy, and insurance) while excluding drawings, tax, interest, depreciation, and rent [44]. Beef cattle stock units were based on the standard New Zealand stock unit value of one 55 kg ewe weaning one 28 kg lamb, equal to an annual feed consumption of 550 kg DM (DM = dry matter) [45]. Therefore, beef cattle stock units were estimated from their estimated total feed demand, for example, with a total annual cattle feed demand of 12 million MJ ME (megajoules of metabolisable energy), expenses were based on 2182 stock units. This assumed an average pasture quality of 10 MJ ME/kg DM [38], and therefore an average sheep stock unit of 5500 MJ ME.
3. Results and Discussion
Modelled changes in cow numbers, numbers of calves weaned, feed demand, numbers of cattle sold, cattle enterprise income, expenses, and COS are shown and discussed in the following subsections. Total annual cattle feed demand was fixed at 12 million MJ ME for all scenarios, achieved through adjustments in herd size.
3.1. Cattle Numbers
With a death rate of 2.2% for Y2 to 10 cows and cull rate of 16% for Y2 to 9 cows (with all Y10 cows culled for age after weaning), the average replacement rate was 22 Y2 heifers per 100 Y2 to 10 cows. With increasing mature cow liveweight, their feed demand was greater for maintenance on a per cow basis and for the growth and maintenance of non-mature cattle. This necessitated a reduction in cow numbers in order to maintain the same total annual cattle feed demand (Figure 3). For scenario A, numbers of Y2 to 10 cows were reduced from 263 to 209 cows as mature cow liveweights increased from 450 to 600 kg. As Y2 to 10 cows were bred with a constant calf weaning rate of 84%, total numbers of calves weaned also decreased from 221 to 176. Similar reductions in cattle numbers occurred for scenarios B and C. Therefore, previous suggestions that farming heavier cows with a fixed feed supply requires a smaller herd size weaning fewer calves [11,14] were supported in the current analysis. Proportions of Y1 heifers, Y1 steers, and Y2 steers sold were maintained at constant rates relative to mature cow numbers, such as 20% of Y1 heifers sold, and therefore total numbers of cattle in these stock classes decreased with decreasing herd size.
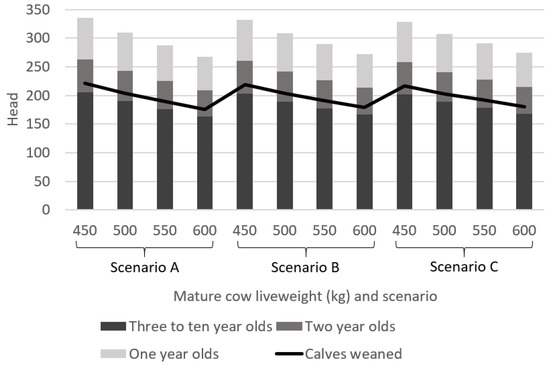
Figure 3.
Numbers of cows of differing ages in the herd and numbers of calves weaned, with varying mature cow liveweight for scenarios with (A) a constant ratio of birth and weaning weights to mature cow liveweight; (B) decreasing ratios of birth and weaning weights to mature cow liveweight as mature cow liveweight increased; and (C) decreasing ratio of birth weight to mature cow liveweight as mature cow liveweight increased and constant pre-weaning growth rates of 1.00 kg/day.
At a constant mature cow liveweight, total cattle numbers changed between scenarios A, B, and C, though with smaller changes than occurred within scenarios due to changes in mature cow liveweight (Figure 3). With a mature cow liveweight of 450 kg, numbers of cows in Y2 to 10 were 263, 260, and 258 for scenarios A, B, and C, respectively, with proportionate changes in the numbers of cattle in other stock classes. Similar changes occurred with a mature cow liveweight of 500 kg, though with smaller changes observed. Calf weaning weights were higher in scenarios B and C than in scenario A for those from 450 and 500 kg cows, increasing total feed demand per cow through increased demand for lactation and growing cattle (Table 1, Table 2 and Table 3). Cow numbers were therefore lower in scenarios B and C in order to maintain total annual cattle feed demand at 12 million MJ ME. Conversely, with mature cow liveweights of 550 and 600 kg, there were smaller reductions in cattle numbers when moving from scenario A to B and then scenario B to C (Figure 3). For example, with a mature cow liveweight of 550 kg, the numbers of cows in Y2 to 10 were 225, 227, and 228 in scenarios A, B, and C, respectively. With mature cow liveweights of 550 and 600 kg, calf weaning weights were lower in scenarios B and C than in scenario A (Table 1, Table 2 and Table 3). Therefore, feed demand per animal for lactation and growing cattle was lower in scenarios B and C with mature cow liveweights of 550 and 600 kg, thus cattle numbers were higher.
3.2. Feed Demand
Daily feed demand per cow for maintenance was 52, 56, 61, or 65 MJ ME with liveweights of 450, 500, 550, or 600 kg, respectively. With WWRs of 43% for all cows (scenario A), the proportion of total annual cattle feed demand accounted for by cow maintenance (replacements and Y2 to 10 cows) decreased from 60% to 59% (7.16 to 7.08 million MJ ME) when mature cow liveweight increased from 450 to 600 kg (Table 5). In the same scenario, the proportion of feed demand accounted for by reproduction and sold non-mature cattle increased from 21% to 22% (2.55 to 2.64 million MJ ME) with increasing mature cow liveweight from 450 to 600 kg. Heavier birth and weaning weights increased feed demand for gestation and lactation, respectively. Cattle sale timings were constant for all scenarios and cow liveweights, and therefore sold cattle from herds with heavier cows had greater feed demand for maintenance and growth until leaving the farm. This relatively small increase in the use of feed directly for production of heavier cows would occur if heavier cows were achieving the same WWRs as their lighter counterparts.
Table 5.
Total annual feed demand (millions of megajoules of metabolisable energy) for cows (aged two to ten years), replacements (until two years of age), reproduction (gestation and lactation), sold youngstock, and bulls, with varying mature cow liveweight for scenarios with (A) a constant ratio of birth and weaning weights to mature cow liveweight, (B) decreasing ratios of birth and weaning weights to mature cow liveweight as mature cow liveweight increased, and (C) the ratio of birth weight to mature cow liveweight decreased with mature cow liveweight and constant pre-weaning growth rates of 1.00 kg/day.
Data from both New Zealand and international beef cow studies indicate WWRs of heavier cows to be lower than WWRs of lighter cows (Figure 1). When heavier cows were modelled with lower WWRs than lighter cows (scenarios B and C), the proportion of total annual cattle feed demand accounted for by cow maintenance increased with increased mature cow liveweight. For scenario B, the proportion of total annual beef feed demand accounted for by cow maintenance increased from 59% to 61% (7.03 to 7.26 million MJ ME) as mature cow liveweight increased from 450 to 600 kg (Table 5). The proportion of total annual cattle feed demand accounted for by production (sold non-mature cattle and reproduction) decreased from 22% (2.67 million MJ ME) with a mature cow liveweight of 450 kg, to 20% (2.43 million MJ ME) with a mature cow liveweight of 600 kg (Table 5). Proportions of feed demand accounted for by cow maintenance had similar increases with heavier cow liveweights in scenario C. The increased proportion of feed demand accounted for by cow maintenance with heavier mature cow liveweights was expected [1,9], occurring when WWRs were lower for heavier cows, which has previously been used as a measure of efficiency [3,10,11,12,14,15].
3.3. Cattle Sales
Numbers of cattle sold from the various stock classes, such as weaner heifers or Y1 steers, had proportionate changes to changes in herd size (Table 6). The number of cattle sold was determined by numbers in that stock class combined with culling and sale rates. Culling and sale rates were constant across all mature cow liveweights and scenarios, such as 20% of Y1 heifers and 16% of Y2 to 9 cows sold. Herd size decreased with increasing mature cow liveweight (Figure 3), and therefore the number of cattle sold in the various groups decreased with increasing mature cow liveweight (Table 6). For example, 15 Y1 heifers were sold when mature cow liveweight was 450 kg, whereas 12 Y1 heifers were sold when mature cow liveweight was 600 kg in scenario A.
Table 6.
Numbers of cattle sold of each sex and age with varying mature cow liveweight. Values are for scenario A as numbers did not differ by more than three for each group of equivalent cattle between scenarios A, B, and C.
3.4. Economics
Prices were consistent for each group of sold cattle in this analysis on a per kg basis as sale timings were consistent across scenarios and mature cow liveweights. Therefore, prices per head were higher with heavier cattle weights. Changes in beef income with varied mature cow liveweight were driven by changes in both cattle numbers and liveweights. For scenario A, increased mature cow liveweight had proportionate increases in calf weaning weight and sale weights of all non-mature cattle (Table 1). Beef income increased from NZD 203,000 to NZD 211,000 as mature cow liveweight increased from 450 to 600 kg (Figure 4), indicating increased sale liveweights increased income by a relatively larger value than income reductions from fewer total cattle. Although it is not certain which of the modelled scenarios with varied pre-weaning growth rates is most likely occurring on New Zealand beef farms, pre-weaning growth rates of 1.00 kg/day are considered to be an industry target [30,34]. An average pre-weaning growth rate of 1.19 kg/day for calves from a herd of 600 kg cows (scenario A in Table 1) is therefore not likely achieved in many beef herds feeding exclusively on pasture and in hill country conditions. Although mature cow liveweights have increased due to selection for higher potential growth rates [1], high growth rates are likely limited by the environment in which they are farmed. In the North Island hill country system under study, the beef herd typically feeds on low quality-pasture in summer prior to weaning when other stock classes on farm are prioritised, such as growing lambs for slaughter. Pre-weaning growth rates in scenarios B and C had less variation between calves from cows with varying mature liveweights compared with scenario A, either with a small range from 0.95 to 1.07 kg/day or fixed for all calves at 1.00 kg/day (Table 1, Table 2 and Table 3).

Figure 4.
Income from cattle sales, beef enterprise expenses, and beef enterprise cash operating surplus (COS, on the right hand side y axis), with varying mature cow liveweight for scenarios with (A) a constant ratio of birth and weaning weights to mature cow liveweight, (B) decreasing ratios of birth and weaning weights to mature cow liveweight as mature cow liveweight increased, and (C) the ratio of birth weight to mature cow liveweight decreased as mature cow liveweight increased and constant pre-weaning growth rates of 1.00 kg/day.
Relative to scenario A, scenarios B and C had smaller increases in calf weaning weights and cattle sale weights with increased mature cow liveweight (Table 1, Table 2 and Table 3). Therefore, differences in sale weights of cattle from cows with different mature cow liveweights were smaller (compared with scenario A) and the lower numbers of heavier cows did reduce income (Figure 4). Beef enterprise income decreased by NZD 7000 or NZD 15,000 as mature cow liveweight increased from 450 to 600 kg in scenario B or C, respectively. Scenario C had the most similar weaning weights for calves from cows of the varied mature liveweights (Table 1), where the reduced cattle numbers with heavier cows had the biggest reduction in income.
Total annual beef feed demand was maintained at 12 million MJ ME for all modelled scenarios. Therefore, with stock units based on feed demand (Section 2.5), expenses were the same for all scenarios at NZD 114,000 (Figure 4). [11] reasoned that larger beef cows would be more profitable than smaller cows if all cows were equally as efficient in converting feed to product and if expenses were constant on a per cow basis. The experimental data of beef cows WWRs (Figure 1) combined with the greater feed demand for cow maintenance with heavier liveweights [7] have indicated larger cows to be less efficient in conversion of feed to product. Economic analysis in New Zealand beef systems usually consider expenses on a per stock unit or hectare basis [27], essentially on a per unit of feed consumed basis. This suggests that larger cows incur higher expenses per head. Therefore, the base assumptions of [11] that informed their suggestion that a herd of larger cows would be more profitable may not be relevant to New Zealand beef production systems.
With expenses held constant on a total herd level, beef enterprise COS changed with the changes in income outlined above. COS ranged from NZD 401/ha to NZD 474/ha with varying mature cow liveweights in scenario C. The range in COS for scenarios A and B fell between the range in scenario C. Industry survey data suggest the median EBITR (earnings before interest, tax, and rent) to be slightly above NZD 450/ha for East Coast hill country sheep and beef farms in the 2017/2018 production year [46]. The predicted beef enterprise COS in the current analysis were similar to industry survey values, suggesting the model outputs to be representative of North Island hill country beef production systems.
As mature cow liveweight and cattle sale weights increased in scenario A, beef enterprise income and COS rose (Figure 4). COS increased from NZD 421/ha to NZD 460/ha as mature cow liveweight increased from 450 to 600 kg, an increase of 9%. However, as scenario A is unlikely to be representative of pre-weaning calf growth rates occurring in beef production systems in New Zealand hill country, the reductions in beef enterprise COS in scenarios B and C of 7% and 15% as cow liveweight increased from 450 to 600 kg, respectively, were likely more relevant for New Zealand farmers. Across the beef enterprise equivalent area of the farm, 40% of 530 ha, these reductions in COS were NZD 7000 and NZD 15,000 for scenarios B and C, respectively.
Changes in COS with varying mature cow liveweights were not linear for any of the modelled scenarios (Figure 4). As shown in Table 1, Table 2 and Table 3, differences in weaning weights were not constant between calves from cows with liveweights differing by 50 kg. For example, in scenario B, calves were 11 kg heavier at weaning as mature cow liveweight increased from 450 to 500 kg, then 6 and 8 kg heavier as mature cow liveweight increased by further 50 kg increments to 550 and 600 kg. As differences in weaning weights caused changes in total feed demand for lactation and for growing cattle, changes in COS between modelled herds with cows of varying mature liveweights were not expected to be linear.
Considering the size of COS reductions between scenarios B and C, it is important to consider which would be most realistic for the North Island hill country beef herds modelled. Although pre-weaning growth rates of 1.00 kg/day are considered an industry target for these production systems [30,34], the trend towards heavier mature cow liveweights has occurred with selection for increased weaning weight, yearling weight, and final sale weight. All scenarios had higher post-weaning growth rates for offspring of heavier cows (Table 1, Table 2 and Table 3), and the higher pre-weaning growth rates of calves from heavier cows in scenario B mean that it is likely that the closest of the modelled scenarios to growth rates occurring on these commercial beef farms. In contrast, the WWR of 48% for 450 kg cows in scenario C may overestimate the performance of lighter cows.
Scenario B predicted reductions in COS of 7% for an increased mature cow liveweight from 450 to 600 kg (Figure 4B). For a New Zealand North Island hill country farmer focusing on increasing beef cattle growth rates, the potential 1% reduction in COS for a mature cow liveweight increase from 550 to 600 kg would likely not change their breeding priorities towards lighter cattle. Greenhouse gas emissions intensity (kg CO2e emitted per unit of product) is closely related to kgs of pasture eaten per unit of product [47]. Greenhouse gas emissions intensity is lower with a higher proportion of feed used for production rather than maintenance [48], which the results of the current analysis for scenarios B and C suggest would occur with lighter cows. Beef breeding herds are generally farmed on hill country in New Zealand and heavier cows may cause more damage to soil and pasture during wet conditions [34]. Therefore, these factors also suggest heavier cows to be less efficient and appropriate for producers in the pastoral hill country system modelled. Beef cattle weighing more than 600 kg are farmed in beef production systems internationally, with similar concerns around the production efficiency of increasing mature cow liveweights [15,49]. However, the results of the current analysis combined with likely negative impacts on soils and pasture suggest that the optimum liveweight of beef cows for New Zealand hill country farms will not be as heavy. Further, heifers should achieve 60% of mature liveweight at 15 months of age for successful breeding [34] which may be more difficult for those with heavier mature liveweights in a seasonal, pasture-based New Zealand beef production system.
Factors other than mature cow liveweight can also influence WWRs and efficiencies in beef production [15], such as the milk production potential of different breeds [13]. Law et al. [13] identified lighter New Zealand beef cows to be more efficient. Law et al. [13] also identified cows of breeds with higher milk production potential to be more efficient as they mobilised more of their fat reserves during lactation. Differences in WWRs for a given cow liveweight may be achieved between different farms and the indirect economic impacts of farming heavier cows may be overcome with effective management. Therefore, although published data indicate heavier cows to have lower WWRs than lighter cows (Figure 1), this may not always occur for comparisons between breeds, farms, or individual cows. Sufficiently fed heavier cows in hill country conditions may produce heavy weaner calves with an advantage in sooner reaching target slaughter weights before their second winter. These calves would be more attractive to farmers finishing beef cattle on easy contour land, thus heavier cows may be suited to hill country farms selling a high proportion of weaner calves to another farmer to finish. Heavier weaner calves could also be achieved through breeding of older cows with terminal sire breed bulls to produce heavier, faster-growing crossbred calves. This was not included in the current analysis.
4. Conclusions
If herds of beef cows with heavier liveweights were equally as efficient in calf production as lighter beef cows (scenario A), then farming heavier cows would be more profitable despite the smaller herd size. In scenario A, beef enterprise cash operating surplus (COS) increased from NZD 401/ha to NZD 460/ha when mature cow liveweight increased from 450 to 600 kg. However, published data suggest heavier cows to be less efficient regarding ratios of calf birth and weaning weights relative to cow liveweight. When efficiency ratios from literature were applied (scenario B), herds of lighter cows were more profitable, with COS decreasing from NZD 456/ha to NZD 424/ha when mature cow liveweight increased from 450 to 600 kg. With pre-weaning growth rates of 1.00 kg/day for calves from all cows (scenario C), COS decreased from NZD 474/ha to NZD 401/ha when mature cow liveweight increased from 450 to 600 kg. Scenario B was likely the best representation of the variation in cattle growth rates with varying mature cow liveweight occurring on New Zealand hill country farms. The reductions in COS as mature cow liveweight increased in scenario B were relatively small and may not deter farmers from breeding heavier cows for higher calf growth rates. The results of this analysis combined with indirect economic impacts of farming heavier cows suggest heavier cows to be less suitable for pastoral hill country farming conditions. However, it is acknowledged that the negative potential impacts of farming heavier cows may be overcome with changes in animal and pasture management.
Author Contributions
Conceptualization, S.T.M.; methodology, L.J.F.; software, L.J.F.; validation, L.J.F., S.T.M., P.R.K. and P.R.T.; formal analysis, L.J.F.; investigation, L.J.F.; writing—original draft preparation, L.J.F.; writing—review and editing, S.T.M., P.R.K. and P.R.T. All authors have read and agreed to the published version of the manuscript.
Funding
This research was funded by Massey University.
Data Availability Statement
The data presented in this study are available within the article.
Conflicts of Interest
The authors declare no conflict of interest.
References
- Morris, S.T. A precis of beef-cattle research over the last 45 years. In Proceedings of the New Zealand Society of Animal Production; New Zealand Society of Animal Production: Palmerston North, New Zealand, 2019; Volume 79, pp. 188–197. [Google Scholar]
- Smeaton, D.; McCall, D.; Wadams, T. Effects of pasture allowance level after calving on performance of beef cows on hill country. N. Z. J. Exp. Agric. 1983, 11, 303–308. [Google Scholar] [CrossRef]
- Morris, C.; Wilton, J. Influence of body size on the biological efficiency of cows: A review. Can. J. Anim. Sci. 1976, 56, 613–647. [Google Scholar] [CrossRef]
- McMillan, W.; McCall, D. Are yearling heifer mating and more productive beef cow breeds a worthwhile use of winter feed? In Proceedings of the New Zealand Society of Animal Production; New Zealand Society of Animal Production: Palmerston North, New Zealand, 1991; Volume 51, pp. 265–269. [Google Scholar]
- Tait, I.; Morris, S.; Kenyon, P.; Garrick, D.; Pleasants, A.; Hickson, R. Effect of cow body condition score on inter-calving interval, pregnancy diagnosis, weaning rate and calf weaning weight in beef cattle. In Proceedings of the New Zealand Society of Animal Production, Rotorua, New Zealand, 28–30 June 2017; New Zealand Society of Animal Production: Rotorua, New Zealand, 2017; Volume 77, pp. 23–28. [Google Scholar]
- Thomson, B.; Smith, N.; Muir, P. BRIEF COMMUNICATION: Meta-analysis of beef cow live weights in the mid-2000s. N. Z. J. Anim. Sci. Prod. 2020, 80, 128–130. [Google Scholar]
- CSIRO. Nutrient Requirements of Domesticated Ruminants; CSIRO Publishing: Collingwood, Australia, 2007. [Google Scholar]
- Nicol, A.M.; Brookes, I.M. The metabolisable energy requirements of grazing livestock. In Pasture and Supplements for Grazing Animals; Rattray, P.V., Brookes, I.M., Nicol, A.M., Eds.; New Zealand Society of Animal Production Occasional Publication: Hamilton, New Zealand, 2007; pp. 151–172. [Google Scholar]
- Ferrell, C.; Jenkins, T. Cow type and the nutritional environment: Nutritional aspects. J. Anim. Sci. 1985, 61, 725–741. [Google Scholar] [CrossRef] [PubMed]
- Dinkel, C.; Brown, M. An evaluation of the ratio of calf weight to cow weight as an indicator of cow efficiency. J. Anim. Sci. 1978, 46, 614–617. [Google Scholar] [CrossRef]
- Kress, D.; Anderson, D.; Stevens, J.; Miller, E.; Hirsch, T.; Sprinkle, J.; Davis, K.; Boss, D.; Bailey, D.; Ansotegui, R. Calf weight/cow weight ratio at weaning as a predictor of beef cow efficiency. In Proceedings of the American Society of Animal Science Western Section; New Zealand Society of Animal Production: Bozeman, MT, USA, 2001; Volume 73, pp. 130–132. [Google Scholar]
- MacNeil, M. Genetic evaluation of the ratio of calf weaning weight to cow weight. J. Anim. Sci. 2005, 83, 794–802. [Google Scholar] [CrossRef][Green Version]
- Law, N.; Hickson, R.; Lopez-Villalobos, N.; Kenyon, P.; Morris, S. Proceedings of the New Zealand Society of Animal Production. In Proceedings of the New Zealand Society of Animal Production; New Zealand Society of Animal Production: Hamilton, New Zealand, 2013; Volume 73, pp. 11–16. [Google Scholar]
- Scasta, J.; Henderson, L.; Smith, T. Drought effect on weaning weight and efficiency relative to cow size in semiarid rangeland. J. Anim. Sci. 2015, 93, 5829–5839. [Google Scholar] [CrossRef]
- Williams, A.R.; Wyffels, S.A.; Parsons, C.T.; Dafoe, J.M.; Boss, D.L.; Bowman, J.G.; Davis, N.G.; DelCurto, T. The influence of beef cow weaning weight ratio and cow size on winter grazing and supplement intake behavior. Transl. Anim. Sci. 2018, 2, S84–S88. [Google Scholar] [CrossRef]
- Smeaton, D.; Bown, M.; Clayton, J. Optimum liveweight, feed intake, reproduction, and calf output in beef cows on North Island hill country, New Zealand. N. Z. J. Agric. Res. 2000, 43, 71–82. [Google Scholar] [CrossRef]
- Stewart, T.; Martin, T. Optimal mature size of Angus cows for maximum cow productivity. Anim. Sci. 1983, 37, 179–182. [Google Scholar] [CrossRef]
- Arango, J.; Van Vleck, L.D. Size of beef cows: Early ideas, new developments. Genet. Mol. Res. 2002, 1, 52–63. [Google Scholar] [CrossRef]
- Jeffery, H.; Berg, R. An evaluation of several measurements of beef cow size as related to progeny performance. Can. J. Anim. Sci. 1972, 52, 23–37. [Google Scholar] [CrossRef]
- Marshall, D.A.; Parker, W.; Dinkel, C. Factors affecting efficiency to weaning in Angus, Charolais and reciprocal cross cows. J. Anim. Sci. 1976, 43, 1176–1187. [Google Scholar] [CrossRef]
- Stewart, T.; Martin, T. Mature weight, maturation rate, maternal performance and their interrelationships in purebred and crossbred cows of Angus and Milking Shorthorn parentage. J. Anim. Sci. 1981, 52, 51–56. [Google Scholar] [CrossRef] [PubMed]
- Olson, L.W.; Peschel, D.; Paulson, W.; Rutledge, J. Effects of cow size on cow productivity and on calf growth, postweaning growth efficiency and carcass traits. J. Anim. Sci. 1982, 54, 704–712. [Google Scholar] [CrossRef]
- Jenkins, T.; Ferrell, C. Beef cow efficiency–revisited. In Proceedings of the 2002 Beef Improvement Federation Annual Meeting, Athens, Greece, 28 June–1 July 2002; Volume 34, pp. 32–43. [Google Scholar]
- Morris, S.; Morel, P.; Kenyon, P. The effect of individual liveweight and condition of beef cows on their reproductive performance and birth and weaning weights of calves. N. Z. Vet. J. 2006, 54, 96–100. [Google Scholar] [CrossRef] [PubMed]
- Hickson, R.; Kenyon, P.; Lopez-Villalobos, N.; Morris, S. Effects of liveweight gain during pregnancy of 15-month-old Angus heifers on dystocia and birth weight, body dimensions, estimated milk intake and weaning weight of the calves. N. Z. J. Agric. Res. 2008, 51, 171–180. [Google Scholar] [CrossRef]
- Farrell, L.J.; Tozer, P.R.; Kenyon, P.R.; Ramilan, T.; Cranston, L.M. The effect of ewe wastage in New Zealand sheep and beef farms on flock productivity and farm profitability. Agric. Syst. 2019, 174, 125–132. [Google Scholar] [CrossRef]
- Benchmark Your Farm. Available online: https://beeflambnz.com/data-tools/benchmark-your-farm (accessed on 5 February 2020).
- STELLA Architect. Available online: https://www.iseesystems.com/store/products/stella-architect.aspx (accessed on 14 September 2020).
- Farrell, L.J.; Kenyon, P.R.; Morris, S.T.; Tozer, P.R. The Impact of Hogget and Mature Flock Reproductive Success on Sheep Farm Productivity. Agriculture 2020, 10, 566. [Google Scholar] [CrossRef]
- Guide to New Zealand Cattle Farming. Available online: https://beeflambnz.com/knowledge-hub/PDF/guide-new-zealand-cattle-farming (accessed on 5 July 2020).
- McFadden, A.; Heuer, C.; Jackson, R.; West, D.; Parkinson, T. Reproductive performance of beef cow herds in New Zealand. N. Z. Vet. J. 2005, 53, 39–44. [Google Scholar] [CrossRef]
- Hickson, R.; Anderson, W.; Kenyon, P.; Lopez-Villalobos, N.; Morris, S. A survey detailing the calving performance of primiparous 2-year-old beef heifers and outcomes of assisted calving. N. Z. Vet. J. 2012, 60, 35–41. [Google Scholar] [CrossRef] [PubMed]
- Hickson, R.; Lopez-Villalobos, N.; Kenyon, P.; Morris, S. The effect of maternal liveweight gain of 15-month-old beef heifers on foetal weight. In Proceedings of the New Zealand Society of Animal Production; New Zealand Society of Animal Production: Wanaka, New Zealand, 2007; Volume 67, pp. 117–120. [Google Scholar]
- Morris, S. Pastures and supplements in beef production systems. In Pasture and Supplements for Grazing Animals; Rattray, P.V., Brookes, I.M., Nicol, A.M., Eds.; New Zealand Society of Animal Production Occasional Publication: Hamilton, New Zealand, 2007. [Google Scholar]
- Morris, S.T.; Garrick, D.J.; Lopez-Villalobos, N.; Kenyon, P.R.; Burke, J.L.; Blair, H.T. Growth, feed intake and maternal performance of Angus heifers selected for high or low growth and milk production. Anim. Prod. Sci. 2010, 50, 349–353. [Google Scholar] [CrossRef]
- Morris, S.T.; Chan, F.Y.; Lopez-Villalobos, N.; Kenyon, P.R.; Garrick, D.J.; Blair, H.T. Growth, feed intake and maternal performance of Angus heifers from high and low feed efficiency selection lines. Anim. Prod. Sci. 2014, 54, 1428–1431. [Google Scholar] [CrossRef]
- Morris, S.T. Beef Production. In Livestock Production in New Zealand; Stafford, K., Ed.; Massey University Press: Auckland, New Zealand, 2017; pp. 84–122. [Google Scholar]
- Waghorn, G.C.; Burke, J.L.; Kolver, E.S. Principles of feeding value. In Pasture and Supplements for Grazing Animals; Rattray, P.V., Brookes, I.M., Nicol, A.M., Eds.; New Zealand Society of Animal Production Occasional Publication: Hamilton, New Zealand, 2007. [Google Scholar]
- White, T.; Snow, V.; King, W.M. Intensification of New Zealand beef farming systems. Agric. Syst. 2010, 103, 21–35. [Google Scholar] [CrossRef]
- Muir, P.; Wallace, G.; Dobbie, P.; Bown, M. A comparison of animal performance and carcass and meat quality characteristics in Hereford, Hereford× Friesian, and Friesian steers grazed together at pasture. N. Z. J. Agric. Res. 2000, 43, 193–205. [Google Scholar] [CrossRef][Green Version]
- Muir, P.; Thomson, B.; Fugle, C. The effect of colostrum intake on mortality and growth of Friesian bulls from birth to slaughter. In Proceedings of the New Zealand Society of Animal Production; New Zealand Society of Animal Production: Napier, New Zealand, 2006; Volume 66, pp. 382–385. [Google Scholar]
- Purchas, R.; Morris, S. A comparison of carcass characteristics and meat quality for Angus, Hereford x Friesian, and Jersey x Friesian steers. In Proceedings of the New Zealand Society of Animal Production; New Zealand Society of Animal Production: Wanaka, New Zealand, 2007; Volume 67, pp. 18–22. [Google Scholar]
- Livestock Saleyard Results. Available online: https://www.agonline.co.nz/Livestock-Saleyard-Results (accessed on 29 October 2020).
- Shadbolt, N.; Martin, S. Farm Management in New Zealand; Oxford University Press: Melbourne, Australia, 2005. [Google Scholar]
- Trafford, G.; Trafford, S. Farm Technical Manual; Lincoln University: Christchurch, New Zealand, 2011. [Google Scholar]
- Profitability Calculator. Available online: https://beeflambnz.com/data-tools/profitability-calculator (accessed on 14 September 2020).
- Clark, H.; Kelliher, F.; Pinares-Patino, C. Reducing CH 4 emissions from grazing ruminants in New Zealand: Challenges and opportunities. Asian-Aust. J. Anim. Sci. 2011, 24, 295–302. [Google Scholar] [CrossRef]
- Waghorn, G.C. Can livestock production be increased without increasing greenhouse gas emissions? In Proceedings of the New Zealand Society of Animal Production; New Zealand Society of Animal Production: Invercargill, New Zealand, 2011; Volume 77, pp. 156–162. [Google Scholar]
- Coyne, J.M.; Evans, R.D.; Berry, D.P. Dressing percentage and the differential between live weight and carcass weight in cattle are influenced by both genetic and non-genetic factors. J. Anim. Sci. 2019, 97, 1501–1512. [Google Scholar] [CrossRef]
Publisher’s Note: MDPI stays neutral with regard to jurisdictional claims in published maps and institutional affiliations. |
© 2021 by the authors. Licensee MDPI, Basel, Switzerland. This article is an open access article distributed under the terms and conditions of the Creative Commons Attribution (CC BY) license (http://creativecommons.org/licenses/by/4.0/).