Article

Responses of Total Biomass, Shoot Dry Weight, Yield and Yield Components of Jerusalem Artichoke (Helianthus tuberosus L.) Varieties under Different Terminal Drought Duration

1
Department of Agronomy, Faculty of Agriculture, Khon Kaen University, Khon Kaen 40002, Thailand
2
Peanut, Jerusalem Artichoke, and Cassava Improvement Research Group, Khon Kaen University, Khon Kaen 40002, Thailand
3
USDA-ARS, Crop Genetics and Breeding Research Unit, 115 Coastal Way, Tifton, GA 31793, USA
4
Crop & Soil Sciences, National Environmentally Sound Production Agriculture Laboratory (NESPAL), The University of Georgia, Tifton, GA 31793, USA
*
Author to whom correspondence should be addressed.
Agriculture 2020, 10(6), 198; https://doi.org/10.3390/agriculture10060198
Submission received: 20 April 2020 / Revised: 22 May 2020 / Accepted: 26 May 2020 / Published: 2 June 2020
(This article belongs to the Section Crop Production)

Abstract

:
As a secondary crop planting in the double-cropping system, terminal drought is the major constraint of Jerusalem artichoke production in the rainfed area. This study aims to estimate the effects of different durations of terminal drought on total biomass, tuber yields, harvest index, yield components, and to identify high yield potential and low yield reduction genotypes for the varietal improvement program. A split-plot design with four replications was conducted under field experiment for two years. Three drought durations including non-drought stress (SD0), drought from 60 and 45 days after transplanting until harvest (SD1 and SD2, respectively), were assigned in main plots and six genotypes were arranged in subplots. Crop parameters were greater decreased under a long-drought duration than under short-drought duration. The genotypes were identified; HEL256, JA37 and JA125 had high yield potential under SD0 conditions, whereas there was high yield reduction under drought conditions. In contrast, JA60 and HEL253 were identified as low yield potential and low yield reduction genotypes. This information suggested that high yield potential genotypes and low yield reduction genotypes should be selected and generated progeny population for improvement of new varieties with high yield potential and low yield reduction for growing in terminal drought-prone environments.

1. Introduction

Jerusalem artichoke (Helianthus tuberosus L.) is a functional food crop originating in the North Central part of the U.S., and is known to be an important source of inulin in higher plants as an alternative sweetener, which stores carbons like linear fructose polymers (fructans) in the tuber of JA crop [1,2]. Moreover, the above and below-ground parts of JA are valuable for various products. For instance, the tops are considered a suitable feed additive for animals [3,4], and the tubers are used as food products, bulking agents, fat replacements and diabetic foods in terms of medical and industrial applications [5,6]. In Thailand, in the results of the preliminary test, JA is produced successfully in both the early rainy season (March–July) and the late rainy season (September–December) [7]. Without drought, in the late rainy season, the tuberization stage occurs more rapidly than in the early rainy season, which, in turn, can lead to high tuber dry weight, large tuber size, and high tuber quality [8,9]. In contrast, small tuber size, high total biomass and disease infections have been found in the early rainy season. At terminal growth stages, the time of tuber bulking is significantly influenced by day length, temperature, and genotype, and it has a specific effect on increasing tuber yields and quality through the rapid accumulation of dry matter in the JA tuber [10,11]. The tuberization stage can play an important role to enhance tuber yield production in JA genotypes, especially under the tropical area [11].
Regrettably, the progressively changing climate has become an enormous threat to JA production, especially in the tropical regions where drought is expected to increase in frequency and severity in the future as a result of climate change [12]. In most target areas of JA produced under rainfed conditions in tropical areas of Thailand, the rainfall has a bimodal pattern with two peaks, either in mid- or late October. Durations of terminal droughts largely depend on the end of the rainy season, mainly as a consequence of a decrease in regional precipitation but also because of increasing evaporation brought on by global warming. Therefore, crops grown in the late rainy season under natural environments are frequently subjected to prolonged and severe droughts in late growth stages, with water shortages as the limiting factor for crop growth and yield of JA.
Many empirical studies of potted plants have reported that early droughts reduced yields by more than 86% under moderate drought (50% available water; AW) when compared with under well water (100% AW) in pot experiments [13]. Hence, the improvement of drought tolerance genotype is the appropriate method to alleviating drought problem. Even though there have been numerous studies on drought tolerance for improved tuber yield in JA under field conditions, we are not aware of any studies conducted under terminal drought durations. Besides, the view of the breeder is considering the genotype with high yield potential under field capacity conditions (non-drought) and it is expected that this genotype can maintain high yield under drought conditions or low yield reduction [14,15].
Unfortunately, the contributions of high yield potential and low yield reduction to economic yield (tuber fresh weight) productivity under different terminal drought durations have not been reported. Therefore, this study thus aims to estimate the effects of different durations of terminal drought on total biomass, tuber yield, harvest index, and yield components, and to identify high yield potential and low yield reduction genotypes for the varietal improvement program. This information should be useful for the selection of JA genotypes for the improvement of new varieties with high yield potential and low yield reduction in terminal drought-prone environments.

2. Materials and Methods

2.1. Experimental Design

A split-plot design, the main plots arranged in a randomized complete block, with four replications was used for the experiment, with a total of 72 plots. Terminal droughts included three durations: no drought stress (SD0), drought from 60 days after transplanting (DAT) until harvest (SD1) and drought from 45 DAT until harvest (SD2), and were assigned in main plots. Subplots consisted of six JA genotypes (HEL256, JA37, HEL253, JA4, JA60, and JA125) that were selected based on different responses of biomass and tuber yield to long periods of drought from early growth stage until harvest [14]. HEL256 and JA37 have a high tuber yield, biomass and high reductions under drought, whereas HEL253 and JA4 have an intermediate tuber yield, biomass, and intermediate reductions, as well as JA60 and JA125, have a low tuber yield, biomass and low reductions under drought. The genotypes used in this study were kindly donated from two institutions, including four varieties from Plant Gene Resource of Canada (PGRC), JA37, JA4, JA60, JA125 and two genotypes from the Leibniz Institute of Plant Genetics and Crop Plant Research (IPK) of Germany, HEL256 and HEL253 [7,14]. A field experiment was conducted for two years from October to January (2017/2018 and 2018/2019) at the Field Crop Research Station of Khon Kaen University, Khon Kaen, Thailand (latitude 16°26′ N, longitude 102°48′ E).

2.2. Crop Management

Conventional tillage was performed to prepare the soil by a tractor, including primary tillage, secondary tillage, harrowing, and then levelling. The plot size was 6 × 5 m with 12 rows per plot. The plant spacing was 30 cm and row spacing was 50 cm. The soil in each subplot was left flat without raised beds. An underground drip irrigation system was installed after soil preparation. For each subplot, thirteen drip lines between the rows of the plants with emitter distances of 30 cm and a depth of 10 cm below the soil surface were installed. The insecticide, Sevin 85 (carbaryl 85% WP) at the rate of 20 g per 20 L of water, was applied along the drip lines to control ants.
Healthy seed tubers of the JA genotypes were obtained from a multiplication field near the experimental site. The seed tubers were cut into small pieces with 2 or 3 buds per piece and tuber pieces were immersed into water containing fungicide (carboxylic acids) at the rate of 10 g per 20 L of water for 40 min. The tuber pieces were then pre-sprouted in charred rice husks with mixed Trichoderma (Trichoderma harzianum) at the ratio of 3:1 by volume under ambient conditions for 5–7 days to control Sclerotium rolfsii. The tuber pieces with uniform buds were transferred into plug trays with a mixed medium of soil, burnt rice husk and Trichoderma at a ratio of 3:3:1 by volume and covered again with mixed soil medium for 7–10 days, until the seedlings had 1–2 pairs of true leaves and were ready for transplanting to the experimental field.
Before transplanting, the drip irrigation system was supplied uniformly and sufficiently before planting for better establishment of the crop and Trichoderma was applied to each hole base. Uniform and healthy seedlings were selected and transplanted at one seedling per hole. After transplanting in each replication, water was supplied immediately to the depth of 60 cm at the level of field capacity to facilitate a uniform plant stand. Weeds were controlled manually at 20 DAT and during the remainder of the growing season. After the first weeding, single-dose fertilization of N-P2O5-K2O formula 15-15-15 at the rate of 156.25 kg ha−1 was applied to the crop. A Mancozeb fungicide was applied throughout the experiment at the rate of 40 g per 20 L of water to control leaf spot disease and pests were controlled by the insecticide Sevin 85 (Carbaryl 85% WP) at the rate of 20 g per 20 L of water at weekly intervals until harvest. Two electrical sprayer tanks (20 L; PS-767-20B, 7.6 bar, VIGOTECH, Inc., Bangkok, Thailand) were used separately for fungicide and insecticide.

2.3. Water Management

Water meters were placed in each main plot to monitor the amounts of water to be supplied to the plots. The soil moisture at field capacity (FC) and permanent wilting point (PWP) were 14.4% and 3.2%, respectively in 2017/18, and 14.2% and 2.6%, respectively in 2018/19, and were determined by the pressure plate method. Irrigation was stopped at 45 and 60 DAT until harvest for SD2 and SD1 conditions, respectively, but the SD0 condition was maintained at soil moisture not lower than 1% of FC until harvest. The amount of the crop water requirement of JA was calculated as described by [16], using the following equation:
ET crop = kc × ETo
where ET crop is a crop water requirement (mm day−1), ETo is evapotranspiration of a reference crop (mm), which is calculated following the pan evaporation method and kc is a coefficient of the crop at different growth stages of JA genotypes [14].
Soil evaporation (S.E.) was calculated as described previously [17]:
S.E. = β × (Eo/t)
where S.E. is the soil evaporation (mm), β is the light transmission coefficient measured depending on crop cover, Eo is the evaporation from class A pan (mm day−1) and t is the days from the last irrigation.

2.4. Data Collection

2.4.1. Determination of Soil Properties and Weather Conditions

The soil samples were randomly collected in the field at the plough layer (0–30 cm from the soil surface) with soil sampling auger by zigzag sampling method [18], with a total of 30 points before planting. Typically, the soil sample was air dried; after that, all samples were combined, then the composite sample was separated into two sets for laboratory analysis. The first set was analyzed for physical properties, including the soil texture (%sand, %silt and %clay) by the hydrometer method [19]. Soil moisture at field capacity (FC) and permanent wilting point (PWP) were determined by pressure plate method and bulk density was determined [18].
The second set was used for determining the chemical properties, including soil pH (Walkley and Black method), total N (Kjeldahl digestion and Flow Injection Analysis: FIA), available P (Bray II extraction), and exchangeable K and Ca (a Flame Photometer). Electrical conductivity (EC) was measured using 1:5 ratio of soil to H2O, while cation exchange capacity (CEC) was determined using 1 M ammonium acetate extraction [19].
Soil texture for the experiment in 2017/18 and 2018/19 was sandy and loamy sand, respectively (Table 1). Sand and loamy sand, soil with 6.7 pH, 0.3%–0.4% of organic matter, 0.02% of total N, 35.0–37.7 mg kg−1 of available P, 30.1–48.7 mg kg−1 of exchangeable potassium and 450.0–754.9 mg kg−1 of exchangeable calcium, 0.02 of electrical conductivity and 3.2–5.3 c mol kg−1 of cation exchange capacity were observed over the two years.
Solar radiation, rainfall, maximum and minimum air temperatures, relative humidity and evaporation from class A pan were taken daily from a meteorological station located on the agronomy farm during the growing season. Means of minimum and maximum air temperature were 18.8 and 31.1 °C in 2017/18 and 20.1 and 33.1 °C in 2018/19, respectively. Means of solar radiation were 13.0 and 14.7 MJ m−2 day−1 in 2017/18 and 2018/19, respectively (Figure 1). The amount of total rainfall during the growing season was 2.1 mm in 2017/18 and 3.7 mm in 2018/19. The amount of rainfall should be ignored because the crop was protected by the moveable rain-out shelter during the duration of the drought treatment. Means of daily pan evaporations were 4.7 mm in the year 2017/18 and 5.0 mm in the year 2018/19, and the relative humidity was 88.9% and 89.5% for year 2017/18 and 2018/19, respectively.

2.4.2. Determination of Soil Moisture Content and Relative Water Content

Soil moisture content was recorded at 45, 60 and 75 DAT at 30 and 60 cm below the soil surface using the gravimetric method. The wet weight of the soil samples and after oven-drying for 105 °C for at least 72 h or until the weight was constant, were recorded. Percentages of the soil moisture content (SMC) were calculated from the following formula:
% SMC = ((WW − DW)/DW) × 100
where WW is soil wet weight and DW is soil dry weight.
Relative water content (RWC) was measured on the third and fourth fully expanded leaves from the top of the main stem from four plants in each subplot between 10.00 a.m. and 12.00 p.m. on sunny days. Two leaves per plant were cut into small pieces with a disc borer of 2.0 cm2. The leaf samples were put into zipped polyethylene bags and placed immediately in a cooler box to prevent moisture loss. Leaf fresh weight (FW) was recorded by weight as soon as possible. Turgid leaf weight (TW) was recorded after immersion into distilled water under controlled room temperature at 25 °C under dim light for 8 h, and then, dry weight was recorded after oven drying at 80 °C for at least 72 h or until the weight was constant. RWC was calculated based on a formula suggested by [20]:
RWC = (FW − DW)/(TW − DW) × 100
where FW is initial fresh weight, TW is turgid fresh weight and DW is the dry weight.

2.4.3. Determination of Total Biomass, Shoot Dry Weight, Tuber Yield, Harvest Index, and Yield Components

The plants in the border rows and 2 ends of the middle row were discarded, and 35 plants in an area of 5.25 m2 of each subplot were cut at ground level and separated into leaves, stems, and tubers. The samples were used to record the number of tubers per plant and fresh weights of all plant parts. Dry weights were recorded after those samples were oven-dried at 70 °C for 72 h or until weights were constant. Total biomass was calculated by the sum of stem, leaf, and tuber dry weight and shoot dry weight was computed by the sum of stem and leaf dry weight. Harvest index (HI) was calculated from tuber dry weight divided by total biomass. Fresh weight per tuber was calculated from the tuber fresh weight divided by the number of tubers per plant.

2.5. Statistical Analysis

Data for each year were analyzed according to a split-plot design. Homogeneity of error variance for all traits was tested, and combined analysis of variance over two years of data was done. The means were compared by the least significant difference (LSD) at the 0.05 probability level. A simple linear regression analysis was performed to estimate the reductions in all parameters [21]. All calculations were performed using MSTAT-C package (MSTAT-C Version 1.42.; East Lansing, Michigan: Michigan State University).

3. Results

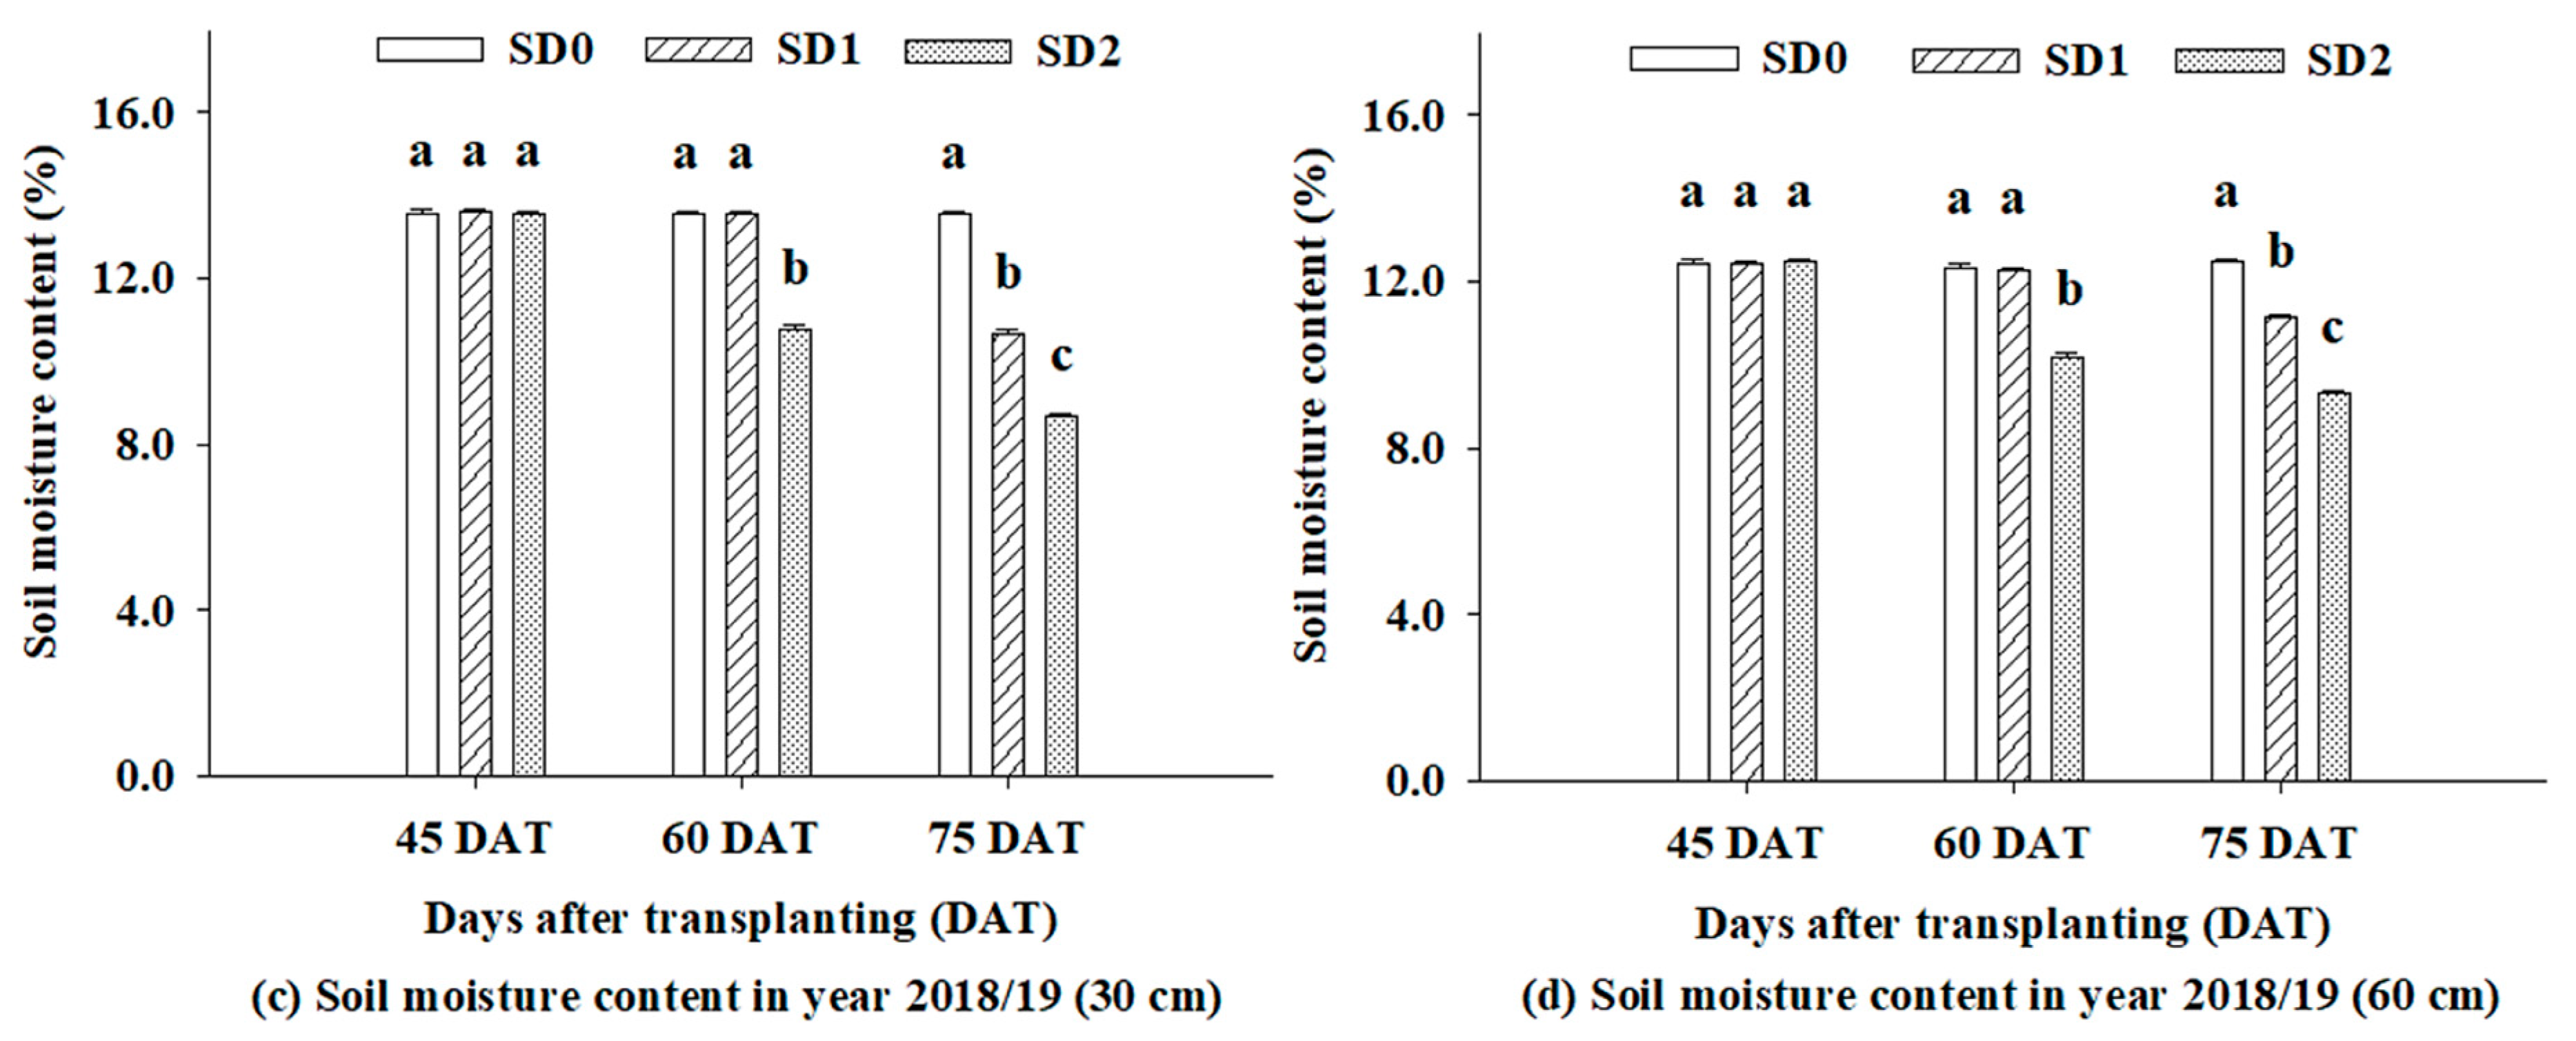
3.1. Soil Moisture Contents and Plant Water Status

There were no significant differences in soil water content at 45 DAT in both years, according to the water was withheld beginning at 45 DAT until the harvest time (Figure 2). Significant differences among drought durations were observed at 60 DAT at 30 and 60 cm below the soil surface, and SD2 was significantly lower than SD0 and SD1 conditions. Soil moisture was significantly different for all drought treatments at 75 DAT; under SD0 had higher soil moisture than SD1 and SD2, whereas SD1 was higher than the SD2. The results for RWC were similar to those for soil water content (Figure 3); this result indicated that the plants were more severely wilting under SD2 than SD1 and SD0, respectively.

3.2. Combined Analysis of Variance for Growth, Yield, and Yield Components

Combined analysis of variance showed non-significant differences between year (Y) for most traits (p ≤ 0.01 and p ≤ 0.05) except for harvest index (HI), tuber fresh weight and tuber number (Table 2). The difference in drought durations (SD) and JA genotypes (G) were significant for total biomass, shoot dry weight, fresh and dry tuber weight, harvest index, number of tubers per plant and fresh weight per tuber.
Year × drought duration (Y × SD) interactions were not significant for most traits but were significant for tuber fresh weight and fresh weight per tuber. The interactions between SD × G were highly significant for most traits. Y × G interactions for most traits were highly significant except for total biomass and shoot dry weight, thus, data in responses of varieties to terminal drought durations were presented in each terminal drought duration in separate years. The second level interactions (Y × SD × G) were also highly significant for most traits, but not for shoot dry weight and harvest index (Table 2).
Drought duration (SD) contributed to a large portion of the total variation for total biomass (73.08%), tuber dry weight (66.55%), tuber fresh weight (78.12%) and fresh weight per tuber (41.54%) (Table 2). Similarly, genotypes were also a large source of the total variation in shoot dry weight (50.13%), harvest index (36.69%) and number of tubers per plant (40.36%). Year (Y) contributed rather small portions of variation for total biomass (0.04%), shoot dry weight (0.29%), tuber dry weight (0.03%), harvest index (3.19%), tuber fresh weight (1.88%), number of tubers per plant (1.59%) and fresh weight per tuber (0.01%). Additionally, the interaction effects contributed small portions of variations for all parameters, ranging from 0.03% to 1.83% for the interactions between year and drought duration, ranging from 0.90% to 5.92% for the interactions between year and genotype and ranging from 2.29% to 8.10% for the interactions between drought duration and genotype.

3.3. Performance of Jerusalem Artichoke Genotype under Different Terminal Drought Durations

The results demonstrated that drought duration reduced total biomass, shoot dry weight, tuber dry weight, harvest index, tuber fresh weight, number of tubers per plant and fresh weight per tuber of JA in both years (Table 3 and Table 4). The reductions in most parameters were more severe under long-drought duration (SD2) than short-drought duration (SD1) except for harvest index in 2017/18 and shoot dry weight in 2018/19.
Genotypes were significantly different for the reductions (b-value) in most parameters in both years (Table 3 and Table 4).
In 2017/18, among the genotypes with high reduction for most parameters, HEL256 had a high reduction for biomass, shoot dry weight, tuber dry weight, tuber fresh weight and fresh weight per tuber. JA37 had high reduction for tuber dry weight, harvest index, tuber fresh weight and fresh weight per tuber, whereas JA4 has a high reduction for biomass, tuber dry weight, tuber fresh weight, harvest index and the number of tubers per plant. Among the low reduction genotypes, JA60 had the lowest reduction for biomass, shoot dry weight, tuber dry weight, harvest index, tuber fresh weight and fresh weight per tuber except for the number of tubers per plant.
In 2018/19, among the genotypes with high reduction of most parameters, HEL256 had a high reduction for biomass, shoot dry weight, tuber dry weight, tuber fresh weight and number of tubers per plant except for harvest index and fresh weight per tuber, whereas JA37 had high reduction for biomass, tuber dry weight, harvest index, tuber fresh weight, and fresh weight per tuber except for shoot dry weight and the number of tubers per plant. Among the low reduction genotypes, HEL253 had low reduction for all traits except for shoot dry weight and fresh weight per tuber, whereas JA60 had low reduction for all traits except for tuber dry weight and harvest index.
Similarly, there were significant differences among JA genotypes in all traits under field capacity conditions (SD0) across years (Table 3 and Table 4).
In 2017/18, among the genotypes with high potential genotypes for most parameters, HEL256, had high potential for all parameters but not for harvest index and the number of tubers per plant. JA37 had high potential traits for biomass, tuber dry weight, harvest index, tuber fresh weight and fresh weight per tuber, whereas JA4 had high potential traits for biomass, tuber dry weight, harvest index, tuber fresh weight, and the number of tubers per plant but not for shoot dry weight and fresh weight per tuber. Among the low potential genotypes for most traits, HEL253 had low potential traits for biomass, tuber dry weight, harvest index, tuber fresh weight, and the number of tubers per plant but not for shoot dry weight and fresh weight per tuber, whereas JA60 had low potential traits for biomass, shoot dry weight, tuber dry weight, tuber fresh weight, and fresh weight per tuber but not for harvest index and the number of tubers per plant.
In 2018/19, among the genotypes with high potential genotypes for most parameters, JA37 had the highest potential genotype for most parameters but not for shoot dry weight and the number of tubers per plant. HEL253 and JA4 had the low potential genotypes for most parameters but not for shoot dry weight of HEL253 and number of tubers per plant for JA4. Among the low potential genotypes for most traits, HEL253 had low potential traits for biomass, tuber dry weight, harvest index, tuber fresh weight, number of tubers per plant, and fresh weight per tuber but not for shoot dry weight, while JA60 had low potential traits for biomass, shoot dry weight, tuber dry weight, tuber fresh weight, and the number of tubers per plant but not for harvest index and fresh weight per tuber

4. Discussion

Information on the effect of terminal drought durations for growth, yield and yield components and responses of genotypes for those traits is important for the selection of JA genotypes for varietal improvement of JA for the terminal drought-prone environment. Drought durations largely contributed proportions of the total variation in biomass, tuber dry weight, tuber fresh weight and fresh weight per tuber (Table 2). In contrast, an earlier study reported that water regimes greater contributed only 33.5%, 35.9% and 43.6% in biomass, tuber dry weight and tuber fresh weight, respectively [14]. The difference between studies might be possible to the drought severity, drought duration and weather conditions, as a result of the different contributions to those crop parameters. Therefore, our current study demonstrated that irrigation management is very vital for obtaining high growth, tuber yield and yield components production, especially under terminal drought-prone areas.
The effect of interactions between year × drought duration (Y × SD) was not significant for most traits, except for tuber fresh weight and fresh weight per tuber, indicating that effect of drought duration on total biomass, shoot dry weight, tuber dry weight, harvest index (HI) and the number of tubers per plant were more stable than other traits across years. In contrast, year × genotype (Y × G) and year × drought duration × genotype (Y × SD × G) interaction was highly significant for most traits except for total biomass and shoot dry weight for Y × G interactions, and shoot dry weight and harvest index for Y × SD × G interactions. These results reveal that the JA genotype responds differently under a different year (climatic factor) and different drought duration for most traits except for some traits. Although overall these interactions were significant for most traits, they were rather a small portion of the total variation to crop characteristics when compared to main effects (drought duration and genotype).
Similarly, the effect of the year contributed rather small portions of variation for total biomass, shoot dry weight, tuber dry weight, harvest index, tuber fresh weight, number of tubers per plant and fresh weight per tuber (Table 2). This indicated that these traits were rather consistent between years. Total biomass, shoot dry weight, and fresh weight per tuber in 2018/19 was higher than in 2017/18, whereas tuber dry weight, harvest index, tuber fresh weight, and the number of tubers per plant in 2017/18 were higher than 2018/19 (Table 3 and Table 4). The differences in these traits between the two years were likely due to higher temperature, rainfall and relative humidity in 2018/19 that enhanced the establishment of genotype performance in the primary growth stage (Figure 1). Plus, the high solar radiation and evaporation from soil surface throughout the growing season progressively increased drought duration intensity in year 2018/19, owing to soil moisture content and relative water content in year 2018/19 being lower than year 2017/18 (Figure 2 and Figure 3). These may have reduced tuber yield, harvest index and yield components of JA. Likewise, in some case, JA planting in high temperature regions decreased harvest index and dry weight of individual tubers, whereas it increased the number of tubers per plant [10]. They suggested that the JA should be investigated for growth and tuber yield in the growing environments during the dry season and low temperature to achieve appropriate production management in the tropical area. Likewise, in potato, high temperature reduced the allocation of photosynthates to the individual tuber [22]. Therefore, low temperature may help to increase the accumulation of dry matter into harvestable tubers, possibly leading to progressively increased economic yield productivity in JA genotypes. Moreover, low temperature during the first year resulted in low evaporation demand that allows water deficits to develop slower [23]. Nevertheless, multi-location trials found that the contribution of environmental influence was significant for tuber fresh weight, number of tubers per plant and dry weight per tuber [24]. In general, JA genotypes demand an average annual temperature around 6–26 °C through the growing cycles under temperate conditions [25]. However, the growing temperatures in this study (tropical areas) were much higher than optimum temperatures for the JA. In tropical regions, drought is also more severe than in the temperate regions as temperature and solar radiation are higher, resulting in greater drought intensity. This drought condition is the vigorous limiting factor for tuber yield production [14].
Genotype (V) was significant for all traits including economic yield. Besides, the genotype was a rather large source of variation for shoot dry weight, harvest index and number of tubers per plant (Table 2). The results indicated that JA genotypes could be selected for economic yield, harvest index and yield components under tropical areas. The interactions between drought duration and genotypes (SD × G) were significant for all traits for both years. The results indicated different responses of genotypes to drought duration in all traits for both years. The high obtained tuber yield is the main target for planting JA in drought-prone environments. For example, in peanut, high pod yield under drought was conditioned by high yield potential under well-watered conditions or low yield reduction under drought [26]. Meanwhile, in JA, high yield potential and low yield reduction genotypes had been identified only under long period drought and early season drought under field and pot experiments, respectively [13,14]. However, under terminal drought in field conditions, identification of JA genotypes for high yield potential or low yield reduction had not been done yet.
The results from this study indicated that HEL256, JA37 and JA4 had high potential for total biomass, tuber dry weight and tuber fresh weight in the year 2017/18, whereas in the year 2018/19, JA37 had the only one with high potential for total biomass, tuber dry weight and tuber fresh weight (Table 3 and Table 4). For economic yield or tuber fresh weight, the high potential genotypes always had a high reduction whenever subjected to water stress and the potential genotypes always had low reduction (Figure 4). For this investigation, in 2017/18, the JA genotypes could be classified into two groups; HEL256, JA37, JA125 and JA4 were classified into the group with high yield potential and high yield reduction, whereas JA60 and HEL253 were classified into the group with low yield potential and low yield reduction. In 2018/19, HEL256, JA37, and JA125 were classified into the group with high yield potential and high yield reduction, whereas JA60, HEL253 and JA4 were classified into the group with low yield potential and low yield reduction. The results of this two years study recommend that HEL256, JA37 and JA125 may be possible to select as genotypes with yield potential (under non-drought condition) and JA60 and HEL253 may be selected as genotypes with low yield reduction under terminal drought durations. The physiological mechanisms for achieving high yield potential and low yield reduction under terminal drought duration should be considered. Hence, information on physiological traits contributing to high yield under terminal drought duration and relating to yield that could be useful to enhance the effectiveness and speed up of breeding for drought tolerance in JA in the future. Briefly, the two groups of these genotypes should be selected as parental genotypes to generate progeny population for improvement of new varieties with high yield potential and low yield reduction for the terminal drought-prone environment. In this situation, the new varieties can maintain high yield even if the crop is subjected to terminal drought.

5. Conclusions

In conclusion, the terminal drought durations decreased biomass, tuber fresh weight, tuber dry weight, number of tubers per plant and fresh weight per tuber consistently across years. The reductions in these traits were more severe under long-terminal drought duration than short-terminal drought duration. The terminal drought duration and genotype contributed to a large portion of the total variations for all crop parameters, indicating that the selection the apparent genotypic variations in all crop parameters are generally expressed mainly due to crop responses dealing with high yield potential and low yield reduction under different durations of terminal drought.
JA genotypes could be classified into two groups. HEL256, JA37 and JA125 were classified into the group with high yield potential genotypes, whereas JA60 and HEL253 were classified into the group with low yield potential and low yield reduction. This information should be useful for the selection of the JA genotypes. The two groups of these genotypes should be selected and used as parental genotypes to generate progeny population for improvement of new varieties with high yield potential and low yield reduction for the terminal drought-prone environment.

Author Contributions

Conceptualization, S.J. and N.V.; methodology, A.C., S.J., N.V., B.T., N.J., C.C.H. and C.K.K.; validation, A.C., S.J. and N.V.; formal analysis, A.C.; investigation, S.J., N.V., B.T., N.J., C.C.H. and C.K.K.; resources, S.J.; data curation, A.C.; writing—original draft preparation, A.C. and T.K. writing—review and editing, S.J., C.C.H. and C.K.K.; supervision, S.J.; funding acquisition, S.J. All authors have read and agreed to the published version of the manuscript.

Funding

The research was funded by the Royal Golden Jubilee Ph.D. Program, grant number PHD/0035/2558. Assistance was also received from the Peanut and Jerusalem Artichoke Improvement Project for the Functional Food Research Group, and the Thailand Research Fund for providing financial support through the Senior Research Scholar Project of Sanun Jogloy (Project no. RTA6180002).

Acknowledgments

The research was funded by the Royal Golden Jubilee Program (grant no. PHD/0035/2558). Assistance was also received from the Peanut and Jerusalem Artichoke Improvement Project for the Functional Food Research Group, and the Thailand Research Fund for providing financial support through the Senior Research Scholar Project of Sanun Jogloy (Project no. RTA6180002). The Leibniz Institute of Plant Genetics and Crop Plant Research (IPK), Stadt, Seeland, Germany, and the Plant Gene Resources of Canada (PGRC) Agriculture and Agri-Food Canada, Saskatoon, Saskatchewan, Canada are acknowledged for their donation of Jerusalem artichoke germplasm.

Conflicts of Interest

The authors declare no conflict of interest.

References

  1. Saengthongpinit, W.; Sajjaanantakul, T. Influence of harvest time and forage temperature on characteristics of inulin from Jerusalem artichoke (Helianthus tuberosus L.) tubers. Postharvest Biol. Technol. 2005, 37, 93–100. [Google Scholar] [CrossRef]
  2. Schittenhelm, S. Agronomic performance of root chicory, Jerusalem artichoke, and sugarbeet in stress and non-stress environments. Crop. Sci. 1999, 39, 1815–1823. [Google Scholar] [CrossRef]
  3. Seiler, G.J.; Campbell, L.G. Genetic variability for mineral element concentrations of wild Jerusalem artichoke forage. Crop. Sci. 2004, 44, 289–292. [Google Scholar] [CrossRef]
  4. Sritiawthai, E.; Kaewtapee, C.; Bunchasak, C.; Poeikhampha, T. Effect of Jerusalem artichoke (Helianthus tuberosus L.) supplementation on production performances, egg quality characteristics and intestinal microflora of laying hens. J. Appl. Sci. 2013, 13, 183–187. [Google Scholar] [CrossRef] [Green Version]
  5. Rodrigues, M.A.; Sousa, L.; Cabanas, J.E.; Arrobas, M. Tuber yield and leaf mineral composition of Jerusalem artichoke (Helianthus tuberosus L.) grown under different cropping practices. Span. J. Agric. Res. 2007, 5, 545–553. [Google Scholar] [CrossRef] [Green Version]
  6. Barclay, T.; Ginic-Markovic, M.; Coope, P.; Petrovsky, N. Inulin-a versatile polysaccharide with multiple pharmaceutical and food chemical uses. J. Excip. Food Chem. 2010, 1, 27–50. [Google Scholar]
  7. Puttha, R.; Jogloy, S.; Wangsomnuk, P.P.; Srijaranai, S.; Kesmala, T.; Patanothai, A. Genotypic variability and genotype by environment interactions for inulin content of Jerusalem artichoke germplasm. Euphytica 2012, 183, 119–131. [Google Scholar] [CrossRef]
  8. Sennoi, R.; Jogloy, S.; Saksirirat, W.; Patanothai, A. Pathogenicity test of Sclerotium rolfsii, a causal agent of Jerusalem artichoke (Helianthus tuberosus L.) stem rot. Asian J. Plant Sci. 2010, 9, 281–284. [Google Scholar] [CrossRef]
  9. Puangbut, D.; Jogloy, S.; Vorasoot, N.; Patanothai, A. Responses of growth, physiological traits and tuber yield in Helianthus tuberosus to seasonal variations under tropical area. Sci. Hortic. 2015, 195, 108–115. [Google Scholar] [CrossRef]
  10. Ruttanaprasert, R.; Jogloy, S.; Vorasoot, N.; Kesmala, T.; Kanwar, R.S.; Holbrook, C.C.; Patanothai, A. Photoperiod and growing degree days’ effect on dry matter partitioning in Jerusalem artichoke. Int. J. Plant Prod. 2013, 7, 393–416. [Google Scholar]
  11. Puangbut, D.; Jogloy, S.; Vorasoot, N.; Patanothai, A. Growth and phenology of Jerusalem artichoke (Helianthus tuberosus L.). Pak. J. Bot. 2015, 47, 2207–2214. [Google Scholar]
  12. Puangbut, D.; Jogloy, S.; Vorasoot, N. Association of photosynthetic traits with water use efficiency and SPAD chlorophyll meter reading of Jerusalem artichoke under drought conditions. Agric. Water. Manag. 2017, 188, 29–35. [Google Scholar] [CrossRef]
  13. Ruttanaprasert, R.; Jogloy, S.; Vorasoot, N.; Kesmala, T.; Kanwar, R.S.; Holbrook, C.C.; Patanothai, A. Effect of water stress on total biomass, tuber yield, harvest index and water use efficiency in Jerusalem artichoke. Agric. Water Manag. 2016, 166, 130–138. [Google Scholar] [CrossRef] [Green Version]
  14. Ruttanaprasert, R.; Banterng, P.; Jogloy, S.; Vorasoot, N.; Kesmala, T.; Kanwar, R.S.; Holbrook, C.C.; Patanothai, A. Genotypic variability for tuber yield, biomass and drought tolerance in Jerusalem artichoke germplasm. Turk. J. Agric. For. 2014, 38, 570–580. [Google Scholar] [CrossRef]
  15. Blum, A. Drought resistance, water-use efficiency, and yield potential-are they compatible, dissonant, or mutually exclusive? Aust. J. Agric. Res. 2005, 56, 1159–1168. [Google Scholar] [CrossRef]
  16. Doorenbos, J.; Pruitt, W.O. Calculation of crop water requirement. In Crop Water Requirement: FAO Irrigation and Drainage Paper No. 24; FAO: Rome, Italy, 1992; pp. 1–65. [Google Scholar]
  17. Singh, S.; Russell, M.B. Water use by maize/pigeon peas intercrop on a deep vertisol. In Proceedings of the International Workshop on Pigeonpeas, ICISAT Center Patancheru, Andhra Pradesh, India, 15–19 December 1981; Volume 1, pp. 271–282. [Google Scholar]
  18. Carter, M.R.; Gregorich, E.G. Soil Sampling and Methods of Analysis, 2nd ed.; Taylor & Francis Group: Boca Raton, FL, USA, 2006; pp. 1–198. [Google Scholar]
  19. Butphu, S.; Rasche, F.; Cadisch, G.; Kaewpradit, W. Eucalyptus biochar application enhances Ca uptake of upland rice, soil available P, exchangeable K, yield, and N use efficiency of sugarcane in a crop rotation system. J. Plant Nutr. Soil Sci. 2020, 183, 58–68. [Google Scholar] [CrossRef]
  20. Barr, H.D.; Weatherley, P.E. A re-examination of the relative turgidity technique for estimating water deficit in leaves. Aust. J. Biol. Sci. 1962, 15, 413–428. [Google Scholar] [CrossRef] [Green Version]
  21. Gomez, K.A.; Gomez, A.A. Statistical Procedures for Agriculture Research, 2nd ed.; John Wiley & Sons: New York, NY, USA, 1984; pp. 1–657. [Google Scholar]
  22. Ewing, E.E.; Sandlan, K.P. Biomass partitioning in the potato: Considerations for modelling. In Modelling and Parameterization of the Soil-Plant-Atmosphere System: A Comparison of Potato Growth Models; Kabat, P., Marshall, B., Van Den Boroek, B.J., Eds.; Wageningen Pers: Wageningen, The Netherlands, 1995; pp. 7–16. [Google Scholar]
  23. Denmead, O.T.; Shaw, R.H. Availability of soil water to plants as affected by soil moisture content and meteorological conditions. Agron. J. 1962, 54, 385–390. [Google Scholar] [CrossRef]
  24. Pimsaen, W.; Jogloy, S.; Suriharn, B.; Kesmala, T.; Pensuk, V.; Patanothai, A. Genotype by environment (G×E) interactions for yield components of Jerusalem artichoke (Helianthus tuberosus L.). Asian J. Plant Sci. 2010, 9, 11–19. [Google Scholar] [CrossRef]
  25. Cosgrove, D.R.; Oelka, D.A.; Doll, D.J.; Davis, D.W.; Undersander, D.J.; Oplinger, E.S. Jerusalem artichoke. Alternative Field Crops Manual; University of Wisconsin Press: Madison, WI, USA, 1991. [Google Scholar]
  26. Songsri, P.; Jogloy, S.; Kesmala, T.; Vorasoot, N.; Akkasaeng, C.; Patanothai, A.; Holbrook, C.C. Response of reproductive characteristics of drought resistant peanut genotypes to drought. Asian J. Plant Sci. 2008, 7, 427–439. [Google Scholar] [CrossRef]
Figure 1. Solar radiation, maximum (Tmax) and minimum (Tmin) temperature in 2017/18 (a) and 2018/19 (c), rainfall, pan evaporation (Eo) and relative humidity (RH) in 2017/18 (b) and 2018/19 (d) at the meteorological station, Khon Kaen University, Thailand.
Agriculture 10 00198 g001
Figure 2. The soil moisture content at 45, 60 and 75 DAT of six JA genotypes grown under three drought durations as SD0 (no drought), SD1 (drought from 60 DAT until harvest) and SD2 (drought from 45 DAT until harvest) at the depths of 30 and 60 cm in years 2017/18 (a,b), respectively, and 2018/19 (c,d), respectively. Note: Error bars were the standard deviation of the drought duration. The same letters indicated at each drought duration in 2017/18 and 2018/19 were not different for each date by the least significant difference (LSD) at p ≤ 0.05 probability level.
Agriculture 10 00198 g002aAgriculture 10 00198 g002b
Figure 3. Leaves relative water content at 45, 60 and 75 DAT of six JA genotypes grown under three drought durations as SD0 (no drought), SD1 (drought from 60 DAT until harvest) and SD2 (drought from 45 DAT until harvest) in years 2017/18 (a) and 2018/19 (b). Note: Error bars are the standard deviation of each drought duration. The same letters in 2017/18 and 2018/19 were not different in each drought duration at each planting date by the least significant difference (LSD) at p ≤ 0.05 probability level.
Agriculture 10 00198 g003
Figure 4. Regression coefficient (b-values) for tuber fresh weight of six JA genotypes under SD0 (no drought) in years 2017/18 (a) and 2018/19 (b).
Agriculture 10 00198 g004
Table 1. Soil physical and chemical properties of field experiments in 2017/18 and 2018/19.
Soil Properties2017/182018/19
Soil physical properties
Sand (%)88.976.4
Silt (%)7.018.0
Clay (%)4.05.6
Texture classSandLoamy Sand
Soil chemical properties
pH6.76.7
Organic matter (%)0.40.3
Total nitrogen (%)0.020.02
Available phosphorus (mg kg−1)37.735.0
Exchangeable potassium (mg kg−1)30.148.7
Exchangeable calcium (mg kg−1)450.0754.9
Electrical conductivity (EC., dS m−1)0.020.02
Cation exchange capacity (CEC) (cmol kg−1)3.25.3
Table 2. Combined analysis of variance of total biomass, shoot dry weight, tuber dry weight, harvest index, tuber fresh weight, number of tubers per plant and fresh weight per tuber of six JA genotypes at harvest grown under three drought durations in years 2017/18 and 2018/19.
Source of VarianceDFTotal Biomass
(t ha−1)
Shoot Dry Weight
(t ha−1)
Tuber Dry Weight
(t ha−1)
Harvest IndexTuber Fresh Weight
(t ha−1)
Number of Tubers Per Plant
(no. Plant−1)
Fresh Weight Per Tuber
(g Tuber−1 FW)
Year (Y)10.15 ns (0.04) 10.10 ns (0.29)0.07 ns (0.03)0.06 * (3.19)60.33 ** (1.88)83.55 * (1.59)0.21 ns (0.01)
Rep within year60.35 (0.60)0.09 (1.60)0.22 (0.52)0.01 (2.02)4.75 (0.89)7.46 (0.85)6.19 (2.21)
Drought duration (SD)2128.17 ** (73.08)3.21 ** (17.85)85.49 ** (66.55)0.24 ** (24.37)1254.28 ** (78.12)826.08 ** (31.37)349.94 ** (41.54)
Y × SD20.05 ns (0.03)0.11 ns (0.64)0.17 ns (0.13)0.01 ns (1.13)29.39 ** (1.83)4.90 ns (0.19)8.85 ** (1.05)
Pooled error (a)120.26 (0.90)0.15 (5.16)0.36 (1.69)0.01 (5.95)1.35 (0.50)6.24 (1.42)1.37 (0.98)
Genotypes (G)56.61 ** (9.43)3.60 ** (50.13)4.68 ** (9.11)0.14 ** (36.69)39.81 ** (6.20)425.09 ** (40.36)63.65 ** (18.89)
Y × G50.63 ns (0.90)0.08 ns (1.12)0.75 * (1.45)0.02 ** (5.13)9.01 ** (1.40)46.16 ** (4.38)19.96 ** (5.92)
SD × G101.22 ** (3.48)0.26 ** (7.22)1.24 ** (4.82)0.01 * (3.40)7.36 ** (2.29)22.63 ** (4.30)13.65 ** (8.10)
Y × SD × G101.09 ** (3.10)0.05 ns (1.40)1.63 ** (6.35)0.01 ns (2.59)8.88 ** (2.76)18.79 ** (3.57)6.64 * (3.94)
Pooled error (b)900.33 (8.44)0.06 (14.60)0.27 (9.35)0.00 (15.53)1.47 (4.12)7.01 (11.98)3.25 (17.36)
Total143
CV (a) 12.9632.1222.1314.9512.6015.1413.78
CV (b) 14.4519.7319.038.8213.1616.0421.22
Note: SD0 (no drought), SD1 (drought from 60 DAT until harvest) and SD2 (drought from 45 DAT until harvest). DF = degree of freedom; CV = coefficient of variation. ns, *, ** non-significant, significant and highly significant at p ≤ 0.05 and p ≤ 0.01 probability level, respectively. 1 Numbers in the parentheses are percent (%) of sum squares to the total sum of squares.
Table 3. Total biomass, shoot dry weight, tuber dry weight, regression coefficient (b-value) and coefficient of determinations (R2) of six JA genotypes at harvest grown under three drought durations in years 2017/18 and 2018/19.
GenotypesTotal Biomass (t ha−1)Shoot Dry Weight (t ha−1)Tuber Dry Weight (t ha−1)
SD0SD1SD2b-ValueR2SD0SD1SD2b-ValueR2SD0SD1SD2b-ValueR2
Year 2017/18
HEL2566.70 a4.13 a2.83 a−1.94 **0.882.02 b1.76 a1.16 a−0.43 **0.664.68 ab2.36 ab1.67 a,b−1.50 **0.83
JA375.76 a,b3.64 a,b2.79 a−1.49 **0.871.16 c1.03 b0.88 b,c−0.14 *0.444.61 a,b2.61 a,b1.90 a,b−1.35 **0.88
HEL2535.32 b4.18 a2.16 b−1.58 **0.872.28 a1.88 a1.16 a−0.56 **0.883.04 d2.30 a,b0.99 c−1.02 **0.84
JA46.52 a3.22 b,c2.94 a−1.79 **0.761.19 c1.00 b0.94 a,b−0.12 *0.355.33 a2.21 a,b1.99 a−1.67 **0.76
JA604.32 c2.85 c2.20 b−1.06 **0.630.82 d0.84 b0.66 c−0.08 ns0.163.50 c,d2.02 b1.54 b−0.98 **0.60
JA1255.43 b3.62 a,b2.22 b−1.60 **0.941.11 c0.97 b0.66 c−0.22 **0.704.32 b,c2.65 a1.56 a,b−1.38 **0.92
Mean5.68A3.61B2.52C−1.580.831.43A1.25A0.91B−0.260.534.25A2.36B1.61C−1.320.81
F-test***** ****** *****
Year 2018/19
HEL2566.47 a,b4.95 a2.72 a−1.88 **0.902.42 a1.68 a1.26 a,b−0.58 **0.534.05 b3.27 a1.46 a,b−1.29 **0.81
JA377.44 a3.83 b2.65 a−2.39 **0.791.22 b1.15 b1.04 a,b,c−0.09 ns0.066.22 a2.68 a,b1.61 a,b−2.31 **0.79
HEL2535.14 b,c3.40 b2.53 a−1.30 **0.862.03 a1.51 a1.35 a−0.34 **0.493.10 b1.88 c1.18 b−0.96 **0.76
JA45.35 b,c3.60 b2.73 a−1.31 **0.891.23 b1.00 b,c0.81 c−0.21 *0.353.11 b2.60 b1.93 a−0.59 **0.59
JA604.99 c2.09 c2.20 a−1.39 **0.690.97 b0.81 c0.82 c−0.07 ns0.134.03 b1.27 c1.38 a,b−1.32 **0.68
JA1255.51 b,c3.95 b2.41 a−1.55 **0.771.36 b0.96 b,c0.86 b,c−0.25 *0.374.15 b2.99 a,b1.55 a,b−1.30 **0.79
Mean5.82A3.64B2.54C−1.640.821.54A1.19B1.02B−0.260.324.11A2.45B1.52C−1.300.74
F-test****ns ***** *****
Note: SD0 (no drought), SD1 (drought from 60 DAT until harvest) and SD2 (drought from 45 DAT until harvest). ns, *, ** non-significant, significant and highly significant at p ≤ 0.05 and p ≤ 0.01 probability level, respectively. Means followed by the same small letter in a column and means followed by a capital letter in each row were not significantly different by least significant difference (LSD) at p ≤ 0.05 probability level.
Table 4. Harvest index, tuber fresh weight, number of tubers per plant, fresh weight per tuber, regression coefficient (b-value) and coefficient of determinations (R2) of six JA genotypes at harvest grown under three drought durations in years 2017/18 and 2018/19.
GenotypesHarvest IndexTuber Fresh Weight (t ha−1)Number of Tubers Per Plant (no. Plant−1)Fresh Weight Per Tuber (g Tuber−1 FW)
SD0SD1SD2b-ValueR2SD0SD1SD2b-ValueR2SD0SD1SD2b-ValueR2SD0SD1SD2b-ValueR2
Year 2017/18
HEL2560.70 b0.57 b0.59 b−0.05 ns0.3118.63 a8.40 a,b5.05 a,b−6.79 **0.8921.24 b,c16.37 b12.47 b,c−4.38 **0.6213.46 a7.76 b6.20 a,b−3.63 **0.77
JA370.80 a0.72 a0.68 a,b−0.06 **0.8618.19 a9.48 a5.75 a,b−6.22 **0.9221.88 b,c17.90 b14.00 b−3.94 **0.8312.46 a8.03 b6.13 a,b−3.17 **0.88
HEL2530.57 c0.55 b0.45 c−0.06 **0.6313.60 b7.44 b3.13 c−5.23 **0.9015.22 d12.16 c7.93 d−3.64 **0.6214.02 a9.22 b5.83 a,b−4.09 **0.73
JA40.82 a0.68 a0.68 a,b−0.07 **0.6718.91 a7.98 a,b6.50 a−6.21 **0.8130.44 a25.23 a21.03 a−4.70 **0.669.35 b4.78 c4.74 b−2.30 **0.66
JA600.80 a0.71 a0.69 a−0.06 ns0.2911.83 b7.06 b4.74 b−3.54 **0.8623.75 b18.45 b12.44 b,c−5.66 **0.757.71 b5.77 c5.71 a,b−1.00 ns0.28
JA1250.80 a0.73 a0.70 a−0.05 **0.4617.07 a9.31 a4.46 b,c−6.30 **0.9618.20 c,d12.25 c9.79 c,d−4.21 **0.8314.06 a11.47 a6.91 a−3.58 **0.84
Mean0.75A0.66B0.63B−0.060.5416.37A8.28B4.94C−5.720.8921.79A17.06B12.94C−4.420.7211.84A7.84B5.92C−2.960.69
F-test ** **** ***** ****** *****
Year 2018/19
HEL2560.63 c0.66 b,c0.54 a,b−0.05 ns0.2114.14 b10.00 a4.38 a−4.88 **0.9324.73 a17.60 b9.58 c−7.57**0.908.70 c8.58 a,b6.90 a−0.90 ns0.26
JA370.83 a0.70 a,b0.62 a−0.10 **0.5616.19 a9.52 a5.14 a−5.52 **0.8616.96 b16.98 b14.24 a,b−1.36 ns0.2214.61 a8.45 b5.46 a−4.57 **0.75
HEL2530.61 c0.54 d0.46 b−0.07 ns0.2911.43 c,d6.00 b,c3.43 a−4.00 **0.9214.95 b11.23 c11.69 b,c−1.63 ns0.1711.61 b,c8.59 a,b4.77 a−3.42 **0.70
JA40.72 b0.54 d0.47 b−0.13 **0.9210.19 d6.95 b5.24 a−2.48 **0.8127.71 a25.26 a15.41 a−6.14 **0.785.55 d4.17 c5.13 a−0.21 ns0.03
JA600.80 a0.61 c,d0.62 a−0.09 *0.4313.24 b,c5.04 c5.05 a−4.09 **0.6916.44 b8.80 c10.43 c−3.00 *0.3912.22 a,b9.52 a,b7.41 a−2.40 *0.40
JA1250.75 a,b0.75 a0.64 a−0.06 ns0.3114.48 a,b8.86 a4.95 a−4.76 **0.9018.35 b11.38 c11.58 b,c−3.38 *0.4412.34 a,b11.83 a6.43 a−2.95 **0.53
Mean0.72A0.63B0.56C−0.080.4513.28A7.73B4.70C−4.290.8519.86A15.21B12.15C−3.850.4810.84A8.52B6.02C−2.410.44
F-test***** ****ns ****** ****ns
Note: SD0 (no drought), SD1 (drought from 60 DAT until harvest) and SD2 (drought from 45 DAT until harvest). ns, *, ** non-significant, significant and highly significant at p ≤ 0.05 and p ≤ 0.01 probability level, respectively. Means followed by the same small letter in a column and means followed by a capital letter in each row were not significantly different by least significant difference (LSD) at p ≤ 0.05 probability level.

