Article

Mid-Term Impact of Climate Change on Hazelnut Yield

1
Institute of Environmental Sciences, Bogazici University, Istanbul 34342, Turkey
2
Center for Climate Change and Policy Studies, Bogazici University, Istanbul 34342, Turkey
3
Department of Physics, Bogazici University, Istanbul 34342, Turkey
*
Author to whom correspondence should be addressed.
Agriculture 2020, 10(5), 159; https://doi.org/10.3390/agriculture10050159
Submission received: 12 February 2020 / Revised: 3 April 2020 / Accepted: 8 April 2020 / Published: 9 May 2020
(This article belongs to the Special Issue Impact of Climate Change on Agriculture)

Abstract

:
The impacts of climate change on hazelnut production in Turkey—the world’s largest producer and exporter—may significantly affect the global hazelnut market depending on production and yield change. In this paper, based on gridded climate data with a 10-km horizontal resolution from regional climate model RegCM4.4 under the RCP8.5 business-as-usual scenario, multiple regression analysis was conducted to investigate yield change for the period of 2021–2050. We examined a total of 88 different locations and three phenological growth stages. We observed that hazelnut yield exhibits considerable variability depending on the phenological and sub-regional and the microclimate conditions in the humid-temperate Black Sea and the semi-humid Marmara regions. Until the middle of the century, we project that hazelnut yield will decrease up to 13% in approximately half of the current production areas. In addition, the fact that the majority of the decreases will be observed in the eastern Black Sea sub-region will cause hazelnut quality to be adversely affected. These findings are highly relevant in the context of regional development and trade in Turkey, and hazelnut processing and manufacturing sectors abroad.

Graphical Abstract

1. Introduction

According to the Fifth Assessment Report (AR5) of the Intergovernmental Panel on Climate Change (IPCC), crop yields in many parts of the world show a decreasing trend with changing climate [1]. The variability in crop yield is undesirable for many reasons, such as income risk and supply stability. Changes in climate (e.g., temperature, precipitation, relative humidity, duration of sunshine) and soil conditions (e.g., nutrients, moisture content, water stress) affect agricultural yield through changes in agricultural productivity and quality. In this way, climate change threatens the quality of life of the growing population by reducing the amount of available food. Several developing countries, which are vulnerable to the effects of climate change and currently facing food security issues, are struggling extensively with extreme climate events arising from climate change. Agricultural vulnerability also varies regionally depending on the ability of farmers to use technological implementations in agriculture [2].
Various studies on three basic crops such as corn, rice, and wheat emphasize that a few degrees of temperature increase may result in a substantial decline in crop yields [3]. The severity of this adverse impact exhibits a spatio-temporal variability. For example, the excessive increase in mean temperatures will further affect crop yields, and this effect might be more destructive in tropical regions than in temperate regions [1]. If today’s trends continue, it is expected that the potential agricultural output will decrease globally, and the rate of decrease will be higher in the developing countries [4]. Climate change has been threatening the quality of life by reducing the amount of available food for the growing population and more frequent extreme climate events in these countries. Hence, weather forecasts and climate projections play an important role in accurately monitoring global food production for the countries that are dependent on agricultural production and/or food import [5].
There has been much discussion on the impact of climatic factors on the crops [6,7]. Climate variability can explain more than 30% of the interannual variability of global crop yield [8]. The planting and harvest dates and phenological growth periods of the agricultural products are influenced by the climatic conditions. Changes in phenological structure depending on changes in climatic and soil conditions affect production quantity and crop quality, which are especially important for the crops with high commercial value. Studies conducted in Slovenia and Slovakia have revealed that temperature increases cause the phenological growth period of the hazelnut to start earlier and the flowering period to shorten [9,10]. Similarly, a study in Poland indicates that the vegetative period begins later and the flowering period becomes shorter due to the colder climate [11]. In other words, climatic conditions, in particular, temperatures, affect the beginning and phases of the phenological growth period [12].
Changes in soil temperature and water content also affect the metabolic activities in the soil [13]. Soil temperature is the main factor in controlling CO2 in the soil, and extreme climate events alter the level of CO2 in the soil [14]. In the beginning, increasing CO2 level in the soil is an advantageous situation for the plant by reducing the effect of evapotranspiration with the biomass conversion provided by the plant using the water accumulated in the leaves. However, as the air temperatures continue to increase, this positive effect observed at the beginning may disappear afterwards.
In the study by Lobell et al. [15] investigating the impact of climate trends on crop production (i.e., corn, rice, wheat, and soybeans) globally, it is seen that the change in temperature is more critical than the change in precipitation. Duration of sunshine, relative humidity, and wind speed are also influential variables on crop yields [16]. Chen et al. [17] found that a decrease in solar radiation reduced the maize and wheat yields in Beijing during the period of 1961 to 2003.
Peltonen-Sainio et al. [18] analyzed the relationship between climate and crop yields in several countries of Europe and concluded that the rising temperatures have a negative impact on the yields. While the yield is expected to increase and new species to be able to grow in Northern Europe, there is an expectation of the opposite effect in Southern Europe [1,19,20]. With the increase in temperature in Southern Europe, the expectation of a reduction in fertile agricultural land due to inadequate irrigation in agricultural areas may be an important issue in terms of the living conditions of Mediterranean farmers [1,19,20]. Severe agricultural losses are also expected in the Mediterranean Basin, where Turkey is also located [1]. Despite the high temperature in the Mediterranean, the production has increased in recent years, but the yield is still low [21,22]. However, another expectation is that agricultural areas in hot and arid regions may be severely affected by adverse conditions because of climate change [19]. For instance, while yields of most grown agricultural crops like maize, wheat, and rice have increased in the US, a sharp decline has been observed in Pakistan and Turkey. At a global level, yield variability of wheat and rice is less, while there is extreme variability in millet yield in the middle of the time interval. One reason for this may be the reduced variability in the amount of precipitation per area [23].
Turkey has a significant share of world production of some commercial agricultural products (e.g., hazelnut, apricots, cherry). Hazelnut has a high commercial value, and Turkey is the world leader in production. Turkey’s hazelnut output is on the average of 70% of world production, followed by Italy, the Caucasus countries (Azerbaijan and Georgia), Iran, the United States, and Spain, respectively. The share of the European Union is 17% [24].
Almost all of the hazelnut consumption in the world (91%) is realized by the European Union and other European countries. Hazelnut is mostly used as a raw material in the chocolate and confectionery industry (about 80%). Therefore, the increase in hazelnut demand is linked to the growth of the chocolate and confectionery industries [24]. It is estimated that the total hazelnut consumption in the world is around 750–850 thousand tons according to the calculations based on the amount of stocks remaining in the hands of the major producer countries [24].
Hazelnut farming in Turkey covers 700 thousand hectares, mostly within the Black Sea region and the eastern Marmara sub-region. The reason for choosing hazelnut as a target fruit in this analysis is its mono-cultural characteristics, high production quantity in Turkey, and the strong effects of Turkey’s production on the global hazelnut market.
Hazelnut is a native plant that grows in humid temperate regions and micro-climate areas of Turkey. Particularly, the Black Sea region in Turkey is a natural habitat for hazelnut growing with humid temperate climate and year to year variability and lowest seasonality with the highest precipitation in the autumn [25,26]. While the hazelnut grows most efficiently in low-lying areas near the shore, the climatic conditions above 600 m limit hazelnut production [27].
According to the geographical distribution of the Köppen–Geiger climate classification for Turkey [26,28], the Black Sea region coastlines and the eastern part of the Marmara region are dominated by the humid temperate (mid-latitude) climate. The fully humid temperate climate with warm summer and mild winter is seen in the middle and eastern parts of the Black Sea region. In the eastern Marmara sub-region, it is observed that temperate dry summer climate is dominant. According to the Thornthwaite moisture index, the zones that make up the natural habitat of hazelnut are located in the class of moist climate type [26,28]. In terms of annual precipitation amounts of Turkey, two of the three wet regions are the western Black Sea and the eastern Black Sea. The moist mid-latitude climates are suitable climate zones for forest and woody vegetation since they have the temperature and precipitation conditions necessary for tree community growth [26]. Therefore, it has suitable conditions for hazelnut to grow. In terms of climate classification, although the hazelnut-grown regions have humid temperate mid-latitude climates with mild winters, microclimate conditions are observed in some parts of the region. While the central Black Sea sub-region has a moderate mid-latitude climate, very hot summers are observed in the east and west. A semi-humid and humid climate dominates over the eastern Marmara sub-region. In addition, as the altitude increases from the coastline to the inner part, climatic conditions also vary spatially. As for the drought vulnerability and risk assessment of the Black Sea coastal belt, except for the larger Istanbul district, the northern part of the Thrace sub-region of Marmara, the western Black Sea, and the eastern Black Sea sub-region districts have the lowest risk of vulnerability and drought in Turkey [29].
Hazelnut (Corylus avellana L.) is a perennial climax crop that requires specific climatic conditions. Perennial crops are affected by climatic conditions in the phase of uncertainties in climate impacts and crop responses [30]. Generally, the altitudes, where frost risk is rare, are suitable for hazelnut growing, and those areas receive sufficient and regular precipitation unless there is an extreme weather event. The flowering of hazelnut is completed in the first four months of the year, and it produces fruit approximately in the last months of spring and early summer. Hazelnut is grown under humid and temperate climatic conditions due to regular precipitation demand [27,31,32]. It grows more efficiently in areas with an average annual total precipitation of 755 mm, and the average annual temperature for growing hazelnut is 13–16 °C. The period between April and July is also important for the shoot growth of the plant, and the duration of sunshine provides the structural forming of the plant in this period [33]. In addition to these requirements, the hazelnut fruit requires 60% relative humidity during the last part of the bearing and beginning of the ripening period within the grain filling season in the study [27].
Hazelnut is also affected by extreme climate events. It is relatively less affected by temperatures below 0 °C, but under conditions where the winter temperatures fall below −8 °C and the summer temperatures rise above 36 °C [27], the fruit is damaged. During the flowering (pollination) period, minimum air temperature and minimum soil air temperature should not fall below 0 °C. Temperatures below 0 °C in the period from mid-February until early April adversely affect the yield [32,34]. The most important factor limiting the hazelnut production in the inner parts away from the coast is very low winter temperatures. Hazelnut species giving early leaves are very sensitive to spring frost risks. Although the hazelnut tree is resistant up to −25 to −30 °C during the dormancy period, the cold tolerance reduces with the beginning of the development process [27]. The number and variety of climate variables and the effect of them on crop may diversify depending on the phenological periods of the crop. To explain it more clearly, the climate variable that is effective in a phenological period may not have the same impact in another phenological period.
Studies are generally based on annual averages, and studies about the effect of climate depending on phenological periods are less common in the literature [35,36,37,38]. Therefore, in the study, the effect of climate change on hazelnut yield is examined by separating phenological periods (i.e., vegetative season (VS), flowering season (FS), and grain filling season (GS) [39] (Table 1) rather than considering annual values.
The hazelnut yield is affected by certain climatic conditions as well as some cultural and physiological factors, such as the use of traditional practices, trimming, weeding, soil type, and nutrient content of soil. The change in those factors, depending on various reasons, has a direct effect on yield [40,41].
The phenological stages determined for Oregon hazelnut represent the general outlook for all hazelnuts grown in the Northern Hemisphere, and the sequence of those stages is also the same in other places. Flowering occurs after the dormancy period in winter, and the leaves appear in March–April. Hazelnut bearing begins in May–June, while fruit fertilization begins at the end of June and early July. Maturation occurs in July and August, and the nutshell gradually matures [42,43].
During the grain-filling period matched to summer months, absolute maximum temperature, irregular or inadequate precipitation, and loss of moisture cause water stress, which leads to deterioration of hazelnut water balance. It is called agricultural drought for fruit, which leads to the burning and falling of the hazelnut clusters, and makes a loss of yield inevitable. In addition, the hazelnut tree, which is not exposed to sufficient heat during the flowering period, may encounter the issue of non-flowering. When hazelnut trees are exposed to more sunlight, there is an increase in stomatal density and chlorophyll count as well as thickening of the palisade tissue, which means a positive effect for photosynthesis [44]. The lack of adequate temperature and sunshine prevents the growth of the fruit due to the decrease of photosynthesis [31,45,46].
The number of studies revealing the relationship between climate and hazelnut is extremely limited [33,42,47,48]. Projected warming of 6 °C until the end of the century will have a negative effect on hazelnut production [49,50]. Soil moisture stress because of high temperature and low humidity affects the hazelnut production adversely in Australia [42]. Since water stress leads to a decrease in photosynthesis, water is a key element for the growth process and hazelnut yield [51,52]. As the hazelnut is a water sensitive fruit, the quality and quantity are adversely affected when it does not get enough water during the growing season [53,54,55].
In the study, hazelnut yield is evaluated in terms of future climate projections. The aim of the study is to analyze the effects of climate change on hazelnut yield with the statistical and climate model-based scientific assessments. When considering the effects of climate change on agricultural products, the risks are particularly meaningful for commercial crops. Therefore, hazelnut can be expected to suffer from climate change.
Hazelnut (Corylus avellana L.) cultivation—native plant in Turkey—directly and indirectly concerns 5 million people in Turkey [56]. More importantly, hazelnut production is the only livelihood source for about 400 thousand families [56,57]. Hazelnut constitutes approximately 20% of the exports of agricultural products in Turkey [57]. In this context, considering its value in the chocolate production industry, the projection of possible yield changes in the future is quite important. Therefore, ensuring the agricultural sustainability of hazelnut is critical in terms of biodiversity and economy. This study aims to have an idea about the future yield changes of this important agricultural product by using the future projections of climate change and the variability in agricultural production projections. In this sense, it might contribute to the implementation of adaptation mechanisms to climate change in terms of hazelnut production and yield. As a result, this study aims to close an important gap in terms of better understanding of what will happen in hazelnut production in the future.

2. Materials and Methods

The first step in the study is to obtain the outputs from the widely used regional climate model RegCM4.4 [58,59,60,61,62,63,64,65,66,67]. It is preferred for the study because it is open source and user friendly as well as giving reliable results for the region [64,68]. In this section, the Max Planck Institute for Meteorology Earth System Model Medium Resolution (MPI–ESM–MR) global climate model’s coarse outputs [69], which has been shown to model the climate of the region fairly well [67,68] when it is compared with observations, are dynamically downscaled to 10-km resolution using the RegCM4.4 regional climate model [70] developed by the Abdus Salam International Center for Theoretical Physics (ICTP) for attaining higher resolution climate data. The model’s validation has been done by comparing model outputs with the observation and reanalysis datasets, as applied earlier by previous studies [64,67,68]. For climate projections, only the RCP8.5 scenario [71] of the IPCC is used since it is similar to the current trend (BAU)—a more realistic case—in greenhouse gas emissions.
Since climate change impact studies generally include dynamic models and big data, it is necessary to consider some limitations and assumptions in the analysis. In order to minimize the uncertainties and errors in data and methodological analysis, it is the most important point to pay attention to check both input data and output data meticulously. Firstly, the consistency and accuracy of time series should be checked very well in the location scale of the yield data, which is the dependent variable of the statistical model. Correction of erroneous data, if possible, or sorting out the data of which reliability cannot be confirmed, should be applied carefully during the preparation of the data. Another step is to check the accuracy and reliability of the climate parameters, which constitute the independent variables of the statistical model. In the studies involving climate projections, the quality of the climatic data is very sensitive to the initial and boundary conditions of the model, as well as the resolution of the model. In this study, the regional climate model RegCM4.4, which has been successfully used before for Turkey, was run with the initial and boundary conditions for the region in the literature, and the climate outputs were obtained at the highest resolution possible. The term “possible” should be underlined here. This is because, in this type of agricultural impact study, it may be better to work with an even higher resolution (less than 10 km horizontal resolution/grid size) climate data at each location scale. In addition, especially when studying the regions with different topographic and geographic features, performing individual parameterizations for each region and determining the initial and boundary conditions will further increase the reliability of the climatic model results. However, as it is known, obtaining high-resolution data from regional climate models requires a lot of computer power and data storage capacity. In this context, carrying out a modeling study in the mentioned detail constitutes the most important obstacle for many researchers today. In addition, making a comparative analysis using multiple global and regional models under various scenarios also constitutes a barrier in terms of computers and time. In summary, in climate change impact studies, it is a situation that should never be ignored is both handicaps of observation and projection data in the evaluation of the results. For this purpose, the collaboration of different researchers is more beneficial in climate change impact studies.

2.1. Variables in the Model

2.1.1. Hazelnut Data

The data for the period of 1991 to 2012 is obtained from the Turkish Statistical Institute, including production, cultivated area, and number of fruit trees [72]. When the data on the number of trees with fruits is used in yield calculations, significant errors related to some years are determined; therefore, the yield data used in the analysis is considered as per cultivated area (in 1000 m2; Equation (1)):
Y i e l d   ( kg 10 3   m 2 ) = P r o d u c t i o n   ( kg ) C u l t i v a t e d   A r e a   ( 10 3   m 2 )

2.1.2. Climate Data and Indices

The parameters are determined based on hazelnut specific climate requirements and the relationship between yield and climate variables in the literature. The statistical model is designed to observe the effect of climate parameters on the yield obtained from the regional climate model. In the study, only the contribution of the climate effect is evaluated without any other factors. Mean air temperature (°C), precipitation (mm), actual evapotranspiration (mm), RH (%), and duration of sunshine (hr) are used in the study as climatic variables [16]. In addition to these variables, the diurnal temperature range (°C) is also calculated using temperature outputs of the climate model. The definition and time range of the variables are explained below (Table 2).

Diurnal Temperature Range (DTR)

The diurnal temperature range is basically defined as the difference between daily maximum temperature (Tmax) and daily minimum temperature (Tmin) (Equation (2)). Although DTR gives more information on climate change rather than average temperatures, it is generally ignored in the studies assessing the impact of climate change on crop yields [73]. DTR can give a better understanding of the effect of change in extreme temperatures on crop yield because DTR can increase or decrease depending on the positive or negative change in maximum and minimum temperatures. Considering the nonlinear relationship between temperature and the plant physiology [59], the harmful impact of change in DTR on crops can be associated with high water stress, low photosynthesis rate, and high chilly or scorching temperatures [73,74,75,76].
D T R = T m a x T m i n

2.2. Hybrid Approach

In the study, a hybrid approach is employed by integrating dynamical climate model outputs with a statistical model. Thus, the analysis of the relationship between climate variables and hazelnut yield is carried out in two parts after determining micro-optimal conditions, considering the thresholds and optimum conditions required for hazelnut on the basis of the growing region.
The statistical approach has been applied with the climate inputs obtained from the regional climate model RegCM4.4 under the RCP8.5 business-as-usual (BAU) scenario for the 30-year future period covering 2021 to 2050. Humid-temperate coastal zone (maximum 30 km to inner parts) of the Black Sea region and the eastern part of the Marmara region, where the natural habitat of the hazelnut is located, are also the domains used in the study.
In the following step, climatic variables affecting hazelnut yield are specified, and statistical analysis is performed to state the effective climate parameters on yield and the prospective yield change.

Statistical Model

Multiple regression analysis is applied in order to predict how hazelnut yield will change in the period 2021–2050 with respect to the reference period of 1991–2012 under the effects of climate change. All locations having a significant share of hazelnut production are included in the study and analyzed for a total of 88 locations.
In the multiple regression analysis, a statistical model is established based on the relationship between observed yield data and the climate historical data for the 1991–2012 period for 88 locations in the Black Sea region and the eastern part of the Marmara region. Similarly, future yield estimation is also made using the climate model’s RCP8.5 scenario-based outputs. All these calculations are made separately for different periods (i.e., vegetative, flowering, and grain filling) on a monthly scale, which are important during the entire growth period of hazelnut to better understand the effects of climate variables on the different stages of growth. Mean air temperature (Tmean), precipitation amount (Pr), actual evapotranspiration (AET), relative humidity (RH), and duration of sunshine (SunD), and diurnal temperature change (DTR) are used as the independent variables in the statistical model while the yield is the dependent variable.
In order to avoid biased results, the estimation methods are determined after the tests, as the model should be selected under appropriate assumptions (i.e., cross-sectional dependence, heteroscedasticity, and autocorrelation). Following the F test [77], the most likelihood test [78], the Breusch–Pagan Lagrangian multiplier test (LM), and the adjusted LM test [79,80] and cross-sectional dependency test [81], the second-generation unit root test [82] is performed to check the existence of unit and/or time effects in the model and to specify the random effect model preference accordingly [83].

3. Results

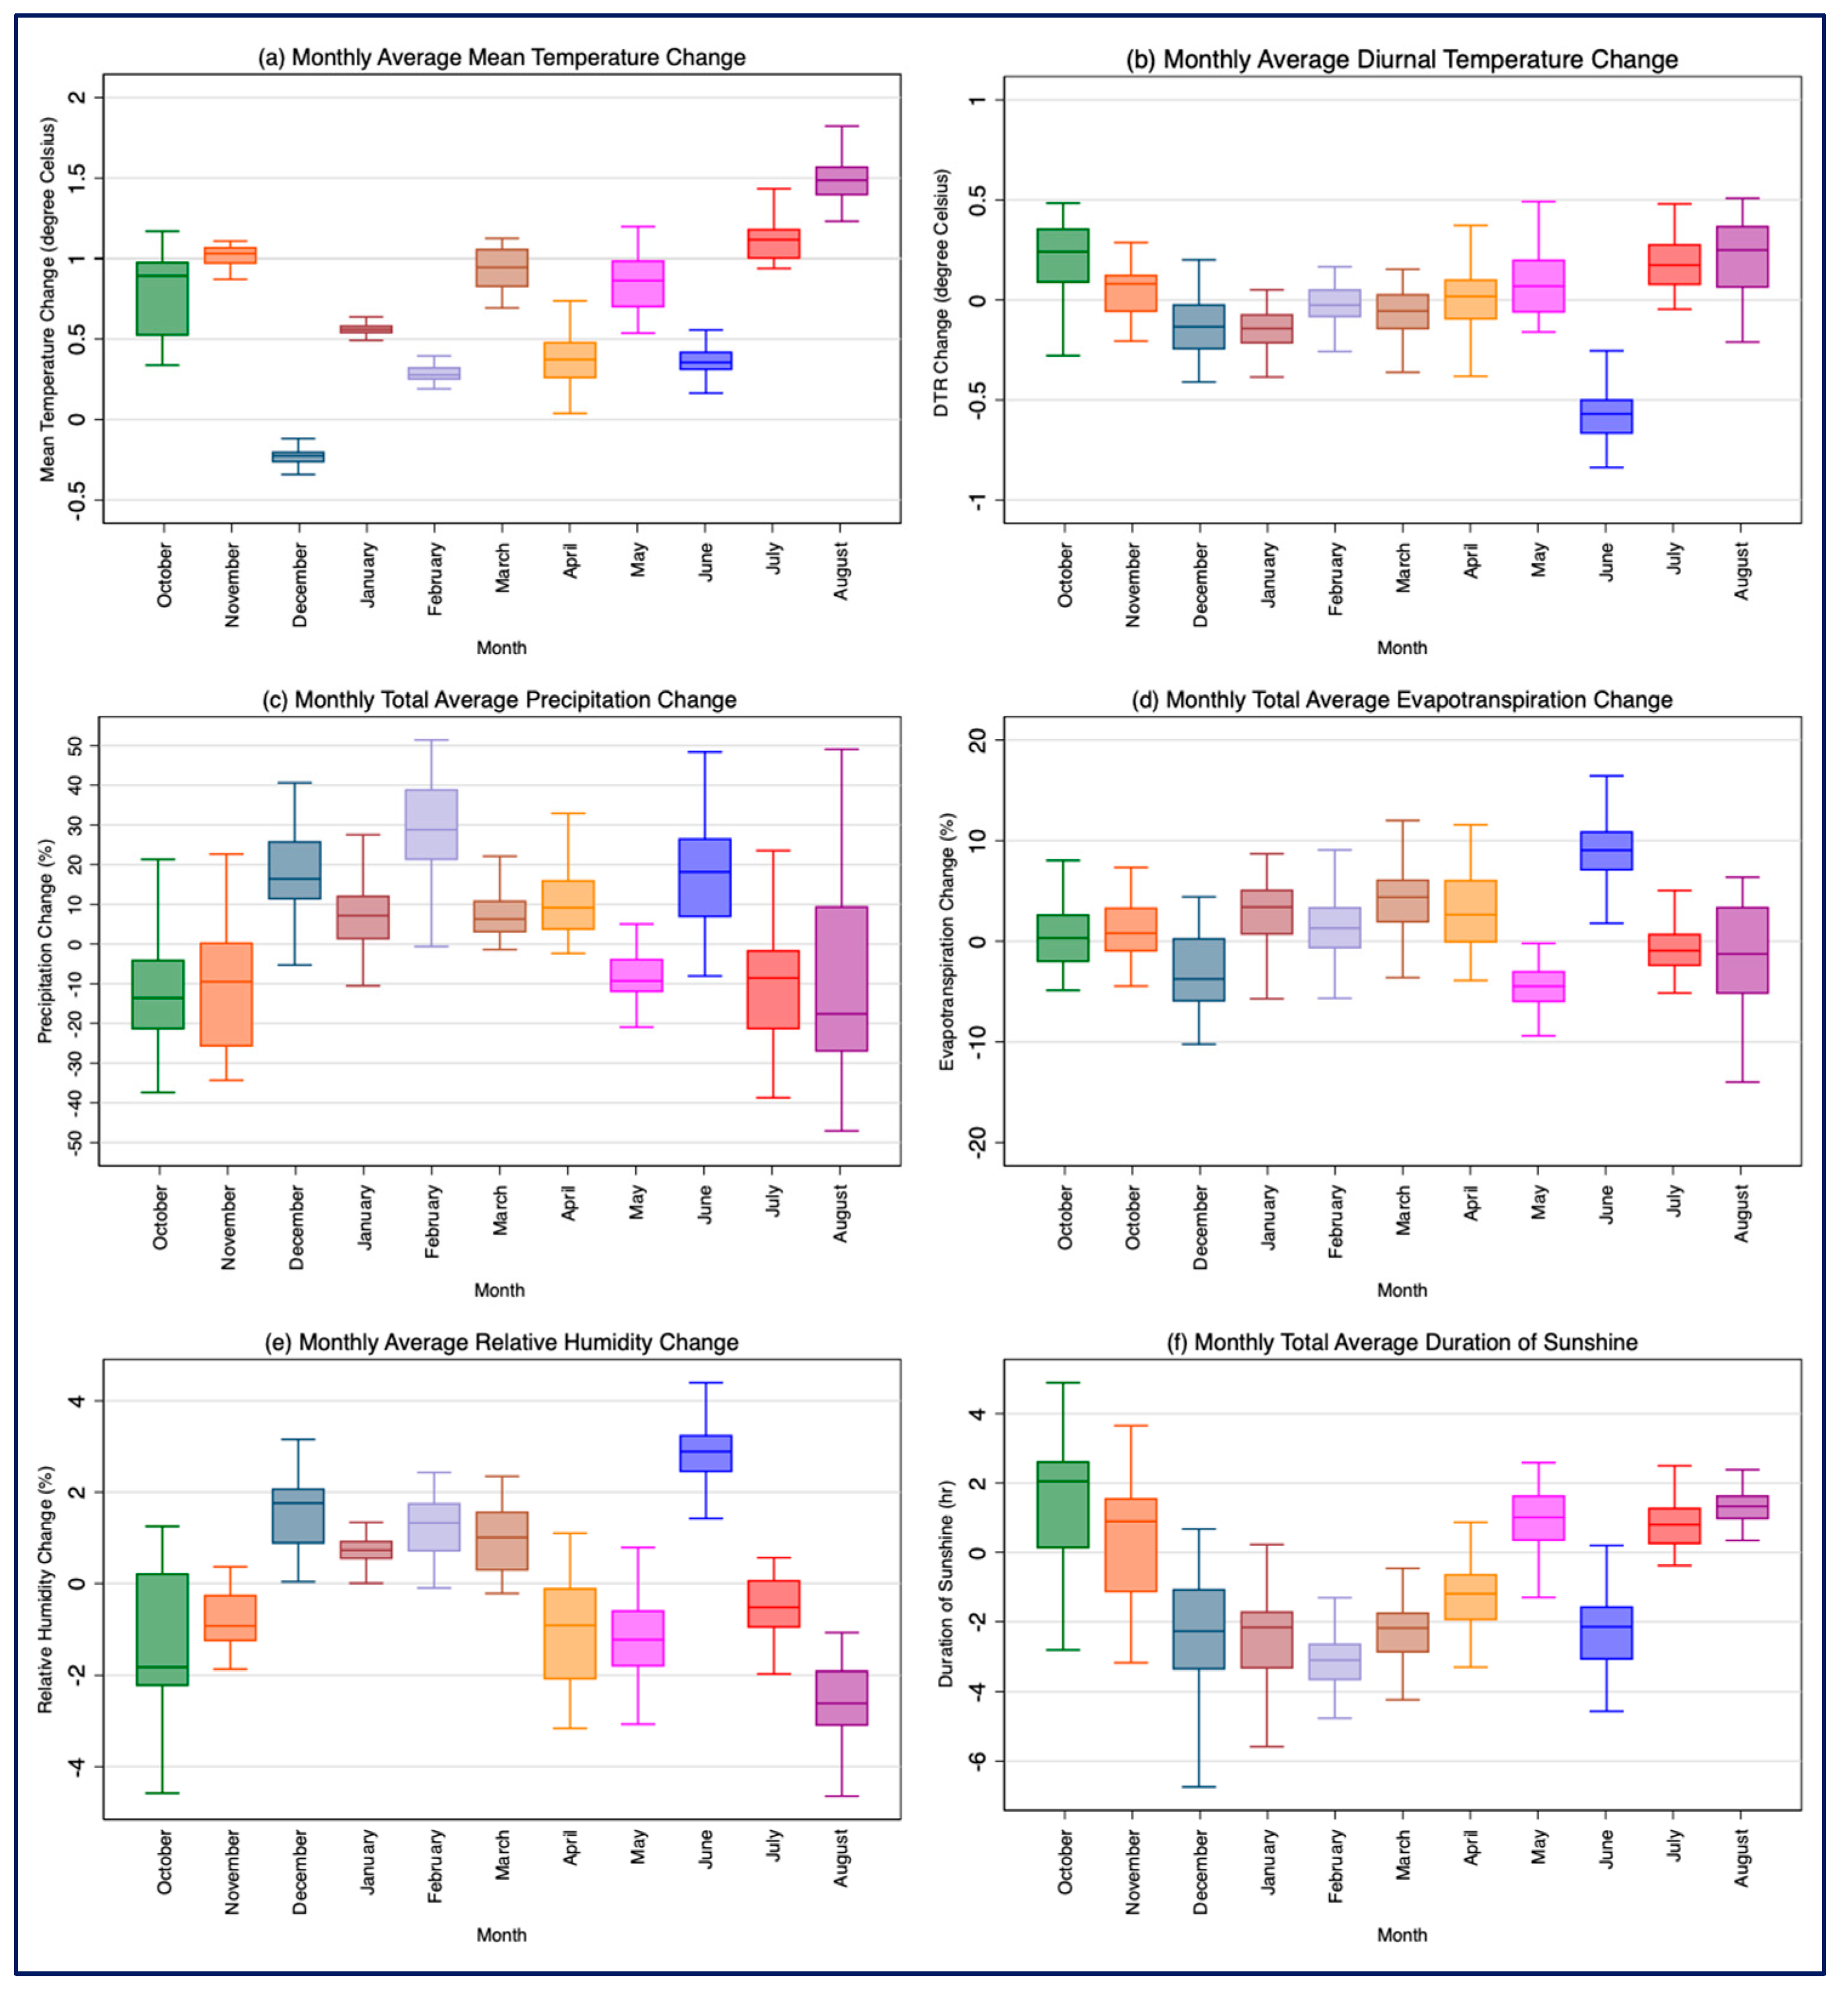
3.1. Regional Climate Model Results

In this section, changes in the climate variables used in the study are examined for the period of 2021–2050 with respect to the reference period of 1991–2012 for the hazelnut growing regions (Figure 1) with different altitudes in the Black Sea region and the eastern Marmara sub-region (Figure 2). The boxplots for the change in monthly averages of the climate variables are illustrated in Figure 3.
Looking at the changes in Tmean for the period of 2021–2050 compared to the reference period of 1991–2012, it is expected that Tmean will increase in all months except December in the hazelnut growing regions (Figure 3a). It is seen that the increase in summer temperatures in July–August will be the highest (1–1.5 °C), and it is expected that there will be an increase of around 0.5–1 °C in the other months. The difference between Tmax and Tmin will be slightly greater in October and August (Figure 3b). A positive increase is expected in October, November, May, July, and August. The positive increase can be explained by a higher rise in maximum temperatures in these months compared to minimum temperatures. In October, November, May, July, and August, an increase of up to 0.5 °C or a decrease of up to 0.4 °C can be observed for DTR. Higher minimum temperatures and lower maximum temperatures in June may result in a decline (up to 1 °C) in average DTR in the same month. There is high variability in Pr change (Figure 3c), and it is particularly the highest in August. In all months except February, both increases and decreases can be observed. In February, an increase is expected in all locations. It is also seen that there will be an increase in seasonal precipitation averages in winter, including the first month of the spring season. It is expected that Pr amounts will decrease more in summer and autumn. As in Pr, temporal and spatial variability in the change in monthly total AET is quite high (Figure 3d). On average, the highest decrease in total AET will be in May, and the highest increase will be in June for the period of 2021–2050 with respect to the period of 1991–2012. It is also noteworthy that the total AET average will increase in January-February-March-April. It is projected that the average RH in June for the future period will be higher than in the past (Figure 3e). In general, RH will increase slightly in December, January, February, March, and June and decrease in other months. The amount of change varies by nearly ±5%. Since the amount of moisture, especially in June, is more substantial, the positive change in this month can be effective on hazelnut. For SunD, there is a general expectation of a decrease in December, January, February, March, and May, whereas an increase in October, November, April, June, July, and August is foreseen (Figure 3f). A decrease in SunD is expected more particularly in the flowering period, during which the amount of AET and RH increases. The situation may be related to the increase in the amount of cloudiness in the same months in the future. On average, while the decrease in SunD in February is expected to be slightly higher than in other months, the highest increase is foreseen in October and August.

3.2. Statistical Model Results for the Climate Variables

The climate requirements of the plant may differ according to the phenological periods. A favorable climate condition in one period may damage the plant in another period, meaning that different variables for different times become substantial [35].
Following the hybrid approach integrating dynamical climate model outputs with the multi-variate regression method, the results, including coefficients, standard deviations, and significant levels, are presented in Table 3. Totally, twenty-eight variables are statistically significant (13 variables at 99% confidence level, 13 variables at 95% confidence level, 2 variables at 90% confidence level). The most significant (p > 0.01) variables are Tmean in October, December, March, April, and August; DTR in October and April; precipitation in August; AET in July and August; RH in January and March and duration of sunshine in November. Tmean in November; DTR in November, January, February, and March; Pr in October, February, and July; AET in October and February; RH in October and November; SunD in February are also significant at a level of p > 0.05, while Tmean in January and SunD in March are significant at a level of p > 0.10. There is a negative relationship between the hazelnut yield and Tmean in November, December, and August; DTR in February and April; Pr in February and August; AET in July and RH; SunD in November. There is also a positive relationship between the hazelnut yield and the other significant variables.

Phenological Assessment of the Relationship between the Climate Variables and Hazelnut Yield

Hazelnut trees generally resist up to −25 or −30 °C during the dormancy period. It has been detected that low temperatures have no adverse effect on the fruit until the development stage begins. With the start of development, low temperatures reaching the minus degrees have a direct negative impact on fruit development and also prevent bud burst and flowering [27,84]. Considering the ecological requirements that provide the transition from the dormancy to bud-burst and flowering, the change in precipitation, evapotranspiration, and minimum and maximum temperatures becomes important. Hazelnut phenology differs from other fruit species because hazelnut comes into flowers in winter. During the dormancy period, fruit buds are able to protect themselves up to −10 °C, but they are damaged after −15 °C. Temperatures are not tolerated below −4 °C when the buds start to open. Depending on the species, the sensitivity of the fruit to cold differs from the end of February to the end of March [27,85].
The flowering period is the longest phenological period of hazelnut. In order not to expose to agricultural frost during flowering, very low temperatures should not be seen during this period. Besides, high temperature will be a threatening factor for hazelnut because of the risk of early blooming.
During the flowering period, a statistically significant (99% confidence level) positive correlation is observed between average temperatures and the yield in March and April so that the projected increase in the average temperatures in the future is expected to have a positive effect on the yield. Although the increase in monthly average temperatures is considered to have a positive influence on the yield, the effect of changes in daily temperature values should not be ignored, meaning that the extremely hot or cold conditions may have more impact on the yield. Late frosts in the spring season are one of the most significant factors affecting the productivity of hazelnuts. In this period, a statistically significant negative correlation is observed between DTR and yield in April (99% confidence level). In the future, the projected increase in DTR in April is not remarkable on average. The increase in DTR can be explained by either an increase in the Tmax or a decrease in the Tmin. However, the expected increase in Tmin should not mislead us, because this does not prevent the increase in the number of extremely cold days that can occur during that month even if Tmin increases. In other words, rather than increases or decreases in Tmean, changes in the number of extremely hot or cold days that may occur temporally and spatially may have been influential on productivity. Therefore, a possible increase in the number of frost days, particularly in April, may adversely affect the yield. The expected increase in Pr in the winter months of flowering may have a negative effect on the yield (95% confidence level), but it can be balanced with the positive effect of the expected increase in AET, which is statistically significant (95% confidence level) in the same period. Another statistically significant variable for the flowering period is SunD. There is a positive relationship between SunD and yield during flowering. A negligible reduction in SunD is foreseen, and this is not expected to have a substantial impact on yield in the future.
Grain filling is divided into two parts, one (bearing) in May and June and the other (ripening) in July and August. At the beginning of the second half of the grain filling period, a statistically significant (95% confidence level) positive relationship is observed between Pr and yield. In the same period, AET is found to have a statistically significant (99% confidence level) negative relationship on yield. The two variables are in agreement with each other in terms of their effect on yield. Since hazelnut requires regular precipitation, dry summers damage hazelnut development. Although the decrease in AET may seem to be an advantage at first glance, it is predicted that the yield may decrease due to the decline in Pr. Since the projected decrease in AET is less than the decrease in Pr, the positive effect of the decrease in AET may disappear.

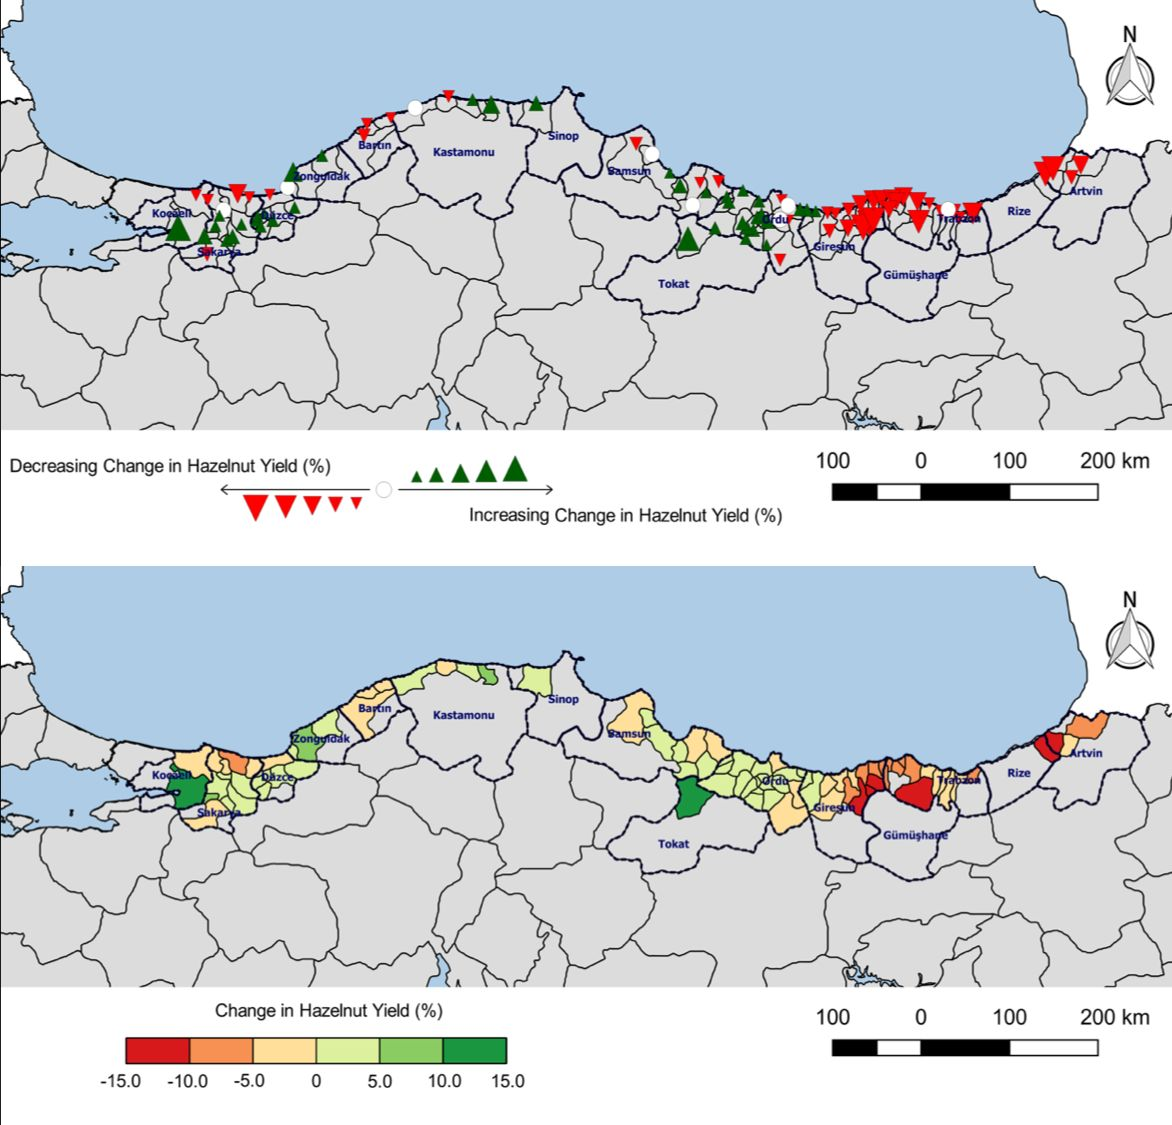
3.3. Statistical Model Results for Hazelnut Yield

Based on the model results taking into account phenological periods, hazelnut yield in Turkey might be affected by future climate change. It is projected that the change in hazelnut yield varies spatially in the future (Figure 4). Accordingly, yield may decrease in 42 of the 88 selected locations up to 13% while hazelnut yield may increase in the remaining 38 locations up to 14% in 2021–2050 compared to the period of 1991–2012 (Figure 4). There will be almost no change in yield for 8 locations. Of the 42 locations foreseen to decrease, 26 are located in the eastern Black Sea sub-region. The eastern Black Sea sub-region, having a significant portion of total hazelnut production, is projected to be the region most affected by the decrease.
In the eastern Black Sea sub-region, which has the highest share in the decrease (1% to 13%) with 26 locations (out of 42), an increase of up to 3% is projected in only 2 locations. The decrease rate is above 10% in 6 locations. A decrease up to 3% in 6 locations and an increase (1% to 12%) in 18 locations of the central Black Sea sub-region; a decrease up to 3% in only 5 counties, an increase with a range of 1% to 8% in 11 locations of the western Black Sea sub-region; a decrease (1% to 7%) in 5 locations and an increase (1% to 14%) in 7 locations of the eastern Marmara sub-region have been projected for the period of 2021 to 2050. Besides, there is almost no change in 8 locations of 88. The number of locations expected to decrease in hazelnut yield increases from west to east (Figure 5).
According to the Turkish Statistical Institute, almost all hazelnut in Turkey is produced in the Black Sea region and the eastern Marmara sub-region [72]. Approximately 80% of the total hazelnut production is provided by the cities of Düzce (western Black Sea) (12%), Giresun (eastern Black Sea) (15%), Ordu (eastern Black Sea) (28%), Trabzon (eastern Black Sea) (9%), and Sakarya (eastern Marmara) (16%). The proportional distribution of only 88 locations in the study is consistent with general distribution, including all hazelnut growing locations.
Projected yield change by province is illustrated in Figure 6. Hence, Ordu, which has the highest hazelnut production, is predicted to have an increase of 1% to 4% in 14 locations and a decrease of 1–2% in 3 out of 19 locations. The projection results show that climate change is more likely to affect hazelnut yield in Giresun (eastern Black Sea), with a wider range between −13% to 3%. In 6 locations of Sakarya (western Black Sea), hazelnut yield will rise by 1–5%, while 4 locations have a decrease by 1–7%. In Düzce (western Black Sea), one of the most important cities for hazelnut production after Ordu, Giresun, and Sakarya, an increase with a range of 1–2% is predicted in all locations except Akçakoca. A decrease of up to 11% is projected in all locations (12 locations in total) of Trabzon.

4. Discussion

In the study, the statistical model focuses on observing the relationship between climate change and yield by ignoring any changes in other factors (e.g., management and technology options, economic indicators). Hence, assuming that the effects of climate change may vary greatly on a regional and temporal scale, working at higher resolution both temporally and spatially considering the changes in other factors can yield more reliable and effective results. A more comprehensive study requires a much larger data set and field study, which may limit the work to be done in many regions. For example, although the motivation of this study focuses only on examining the climate impact on the yield, it may be difficult to access the data of the specified non-climatic factors in the region. Although detailed studies involving all factors will make clearer results for the future, studies dealing with each factor separately will also be useful in predicting the future about the climate change–yield relationship [30].
Hazelnut yield per area and per tree in Turkey is lower compared to other countries [32,72], which may be a result of management and technology options. Moreover, in the 2021–2050 future period with respect to the 1991–2012 reference period, the results indicate that changes in hazelnut yield may be increased (up to 14%) or decreased (up to 13%) depending on location. The majority of the decrease is expected to be in the eastern Black Sea sub-region, which is the most important area of Turkey in terms of high-quality hazelnut production. Particularly due to the aging of hazelnut trees, the yield of quality hazelnuts may decrease even more in the mid and distant future in the eastern Black Sea sub-region where the yield is already lower compared to the central Black Sea, the western Black Sea and the eastern Marmara sub-regions.
Based on the phenological model results, the yield is expected to decrease in 42 of 88 locations and increase in 38 locations. Considering hazelnut phenological structure in the medium term, it is projected that the yield may decrease the most in the eastern Black Sea sub-region up to 13%. For the growth process, it is important to see the statistical significance to understand the substantial parameters and their effect on yield. In general, it can be said that the Tmean, DTR, Pr, AET, RH, and SunD, as mentioned earlier in the article, show significant differences in the direction of statistical relationship for different phenological periods in the development process. Model findings indicate that Pr and AET are statistically significant with the different relationships at the vegetative (dormancy) and reproductive process (flowering, grain filling). Since hazelnut still needs to be chilling during the dormancy period to start slightly flowering, a statistically significant positive relationship with DTR is striking. Hazelnut is known to be damaged by late spring frosts, and the negative significant relationship between hazelnut yield and DTR during flowering supports this. Since hazelnut requires humid climatic conditions, it needs humidity during the whole development process and needs humidity above a certain level during the summer period for ripening. Statistically significant positive test results also support that, to some extent, during the flowering period. There is a negative significant relationship, as excessive SunD may affect the need for chilling during dormancy, and a positive relationship at the beginning of the development process in flowering.
Hazelnut requires regular annual precipitation, so summer droughts damage production and reduce yields. In case of insufficient precipitation and summer drought, the fruit does not reach sufficient size and does not fully mature. Thus, the harvest time comes early, and the yield is reduced by almost half. Therefore, hazelnut should grow in a humid and temperate climate in general. Under normal conditions, it does not grow in continental climate zones. However, in the subtropical regions with high temperatures (i.e., Valencia-Catalonia of Spain, the south of Italy, the Oregon region on the Pacific coast of the USA, and Washington state), economic hazelnut orchards have been established through the application of irrigated farming methods in the summer months [86]. These orchards are irrigated several times during the summer, with an interval of about 20 days [86]. This method increases the yield several times according to natural growing conditions. Compared with the yield per hectare in Italy and Spain, it is almost half of these countries in Turkey.
The increased precipitation variability caused by climate change and the increase in intensity and frequency of excessive precipitation poses a risk for hazelnuts that require regular precipitation throughout the year. For example, in the not-too-distant future, particularly in the eastern Black Sea sub-region—the homeland of high-quality hazelnut—it is predicted that the variability may increase in all seasons, as a possible rise in winter precipitation may lead to changes in precipitation pattern and excessive precipitation without any decrease or too many changes in other seasons. In addition, considering the topography of the region, it can be said that the possible increase in the frequency of excessive and heavy precipitation may trigger flood and landslide risk in the affected area and cause land degradation and loss. Likewise, an increase in average temperatures in the future may cause shifts in the phenological periods of hazelnut. In addition, it can cause premature flowering and early maturation and consequently decrease in quality and yield. Moreover, it is estimated that the average temperature increases, which are expected to be higher in the summer season, meaning a dry summer, may lead to a decrease in yield in hazelnut growing areas by affecting the grain-filling phenological process. One of the most important climatic threats in hazelnuts is the late spring frosts. For example, agricultural frost in the Black Sea region in 1993, 2004, and 2014 caused serious damage to hazelnut [87]. All of these points to the direct effects of climate change, and it should not be ignored that there may be indirect impacts of climate change. It is also important to remember negative conditions such as the spread of existing insects or the reproduction of new ones. Another point is that the locations above 600 m are not currently suitable for hazelnut cultivation due to late spring frosts, but when considered together with the impacts of climate change in the future, higher altitudes may become suitable for hazelnut.
While Tmean of the flowering period has a positive effect, DTR indicating the possible frost risk has a negative effect. This effect is especially noticeable in late winter and spring. Since the requirement of regular annual precipitation, it is necessary to have enough precipitation during the summer months for efficient grain filling process. Therefore, it is observed that Pr has a positive effect, particularly in July. Consistent with it, the increase in AET during this period also has a negative effect on yield.
Due to the need for physiological dormancy, hazelnut is followed by a less productive year (about 30–40% less) after a productive year as in other fruits. If the hazelnut is exposed to frost in late spring that year, it is greatly damaged. Late spring frosts and summer droughts are the most important climate indicators that determine the regional distribution of hazelnut orchards. Especially in the cultivated hazelnut orchards over 600 m, it is possible to experience a significant loss of yield due to late spring frosts. In other words, the lands over 600 m altitude are less suitable for hazelnut cultivation. Ecological conditions such as regular precipitation and summer droughts are effective in hazelnut cultivation. In the Black Sea region, where natural conditions are already present, revising the hazelnut orchards by identifying the appropriate altitude will allow protection from late spring frosts. It will also contribute to the elimination of yield losses due to climate and various physiological and cultural conditions to a certain extent with appropriate management options. For instance, hoeing at regular intervals (every two years), rejuvenation pruning, and sorting in the orchards can greatly contribute yield increase. Especially considering climatic changes, the contribution of regular maintenance practices and technical implementations become even more important.

5. Conclusions

The total amount of the global hazelnut market will reach almost 9.45 billion USD in the next decade [88]. With various production options such as dark-white and milk chocolate, sugar-free chocolate, or confectionery, the consumption area of hazelnut is expanding and the demand for hazelnut is increasing worldwide. The retail market is growing day by day with the demand for chocolate producers to reach out to a wider consumer, with products with improved confectionery features and demand for confectionery products linked to an increasingly urban lifestyle. According to general consumption, approximately 90% of hazelnut is used as a constituent in confectionery chocolate, biscuit, bread, dessert, pastries, ice creams, and meals. In other words, hazelnut is used both as a side component and as a main component in the chocolate sector. Turkey is the main producer of world production, and therefore, the impact of climate change on hazelnut yield in Turkey largely concerns the world’s hazelnut sector.
The relationship between climate and crop yield variability is stronger than that addressed by the widely used linear models in the literature [38]. Each region has different characteristics and behavior towards climate change so that each product is affected differently by climate change. Planting date and growth time may vary by product and region. Also, in each phenological period, variables affecting productivity may vary. Unlike annual crops, rooted and perennial crops are highly dependent on specific climate parameters and are highly affected by climate change in the long run. Perennial crops grow in regions that can be directly influenced by climate change. Hazelnut naturally grows in the mild semi-humid and humid temperate regions of Turkey. Since the seasonality and the year-to-year variability is lowest in the Black Sea coastal zone and relatively lower in the eastern Marmara in comparison with other climate regions of Turkey, these regions are well suited to climatic conditions for hazelnut development.
Since the first half of the 1990s, government policies have been effective on hazelnuts, and base prices have been introduced in hazelnut [86]. Regardless of the quantity and quality of the product, the manufacturers are guaranteed to purchase by the government. Although the situation seems positive for the producer, many places have been transformed into hazelnut orchards irrespective of ecological conditions, and production has been made inefficient by going out of economic production. Furthermore, the government provides technical support and incentives to hazelnut growers through cooperatives, so that both small businesses from the parents continue with traditional practices and without regular maintenance, and the number of newly opened small horticultural enterprises increases.
In order to grow quality and organic hazelnut, the use of inorganic fertilizer should be abandoned, and organic farming techniques (e.g., farm manure) should be used. Farm manure used in cornfields is also used in hazelnut orchards. However, for quality hazelnuts, farm manure should be used much more than inorganic fertilizer.
In other words, hazelnut has spread out from economic production areas to regions where there are no ecologically adequate climatic conditions [86]. The hazelnut orchards spreading to the eastern parts of the Marmara are the best examples of it. Hazelnut production in the Marmara region is supported by additional irrigation in summer drought, and the yield of the region is higher than the eastern Black Sea sub-region. Although the region seems to be advantageous in terms of high yield, it should be taken into consideration that the cultivation should be considered with additional and frequent irrigation compared to the regions receiving natural precipitation. In Italy and Spain, which do not have natural precipitation conditions, high quality and high yielding hazelnut are grown with additional irrigation methods [86]. Turkey’s market share shrinks depending on highly productive hazelnut in those countries. Therefore, in order to compete with those countries, improvements (i.e., old trees should be replaced with the new ones at suitable altitudes) in the area-natural habitat of hazelnut in Turkey should be provided. For that matter, a detailed assessment of climatic suitability for hazelnut production in Turkey will be a follow-up study of this research.

Author Contributions

Conceptualization, N.A. and M.T.T.; Data curation, N.A. and M.T.T.; Formal analysis, N.A.; Investigation, N.A. and M.T.T.; Methodology, N.A. and M.T.T.; Resources, N.A. and M.T.T.; Software, N.A. and M.T.T.; Supervision, M.L.K.; Validation, N.A., M.T.T., and M.T.; Visualization, N.A.; Writing—original draft, N.A., M.T.T., M.T., and M.L.K.; Writing—review and editing, N.A., M.T.T., M.T., and M.L.K. All authors have read and agreed to the published version of the manuscript.

Funding

This research was funded by Bogazici University Research Fund, grant number 13561 and 15042. M. Tufan Turp and M. Levent Kurnaz were also supported by the Scientific and Technological Research Council of Turkey (Tubitak) 1001, a scientific and technological research projects funding program, with the project number 215K066.

Acknowledgments

We would like to thank Abdullah Akbas from Uludag University, and Zekican Demiralay and Basak Bilgin from Bogazici University for their valuable contributions.

Conflicts of Interest

The authors declare no conflict of interest. The funders had no role in the design of the study; in the collection, analyses, or interpretation of data; in the writing of the manuscript, or in the decision to publish the results.

References

  1. Porter, J.R.; Xie, L.; Challinor, A.J.; Cochrane, K.; Howden, M.; Iqbal, M.M.; Lobell, D.B.; Aggarwal, P.; Hakala, K. Food Security and Food Production Systems. In Climate Change 2014: Impacts, Adaptation, and Vulnerability. Part A: Global and Sectoral Aspects. Contribution of Working Group II to the Fifth Assessment Report of the Intergovernmental Panel on Climate Change; Field, C.B., Barros, V.R., Dokken, D.J., Mach, K.J., Mastrandrea, M.D., Bilir, T.E., Chatterjee, M., Ebi, K.L., Estrada, Y.O., Genova, R.C., et al., Eds.; Cambridge University Press: Cambridge, UK, 2014; Chapter 7; pp. 485–533. [Google Scholar]
  2. Brown, M.E.; Funk, C.C. Food security under climate change. Science 2008, 319, 580–581. [Google Scholar] [CrossRef] [PubMed] [Green Version]
  3. Asseng, S.; Foster, I.A.N.; Turner, N.C. The impact of temperature variability on wheat yields. Glob. Chang. Biol. 2011, 17, 997–1012. [Google Scholar] [CrossRef]
  4. Türkeş, M. Impacts of the climate change on agricultural food security, traditional knowledge and agroecology. Turk. J. Agric.-Food Sci. Technol. 2014, 2, 71–85. [Google Scholar]
  5. Iizumi, T.; Sakuma, H.; Yokozawa, M.; Luo, J.J.; Challinor, A.J.; Brown, M.E.; Sakurai, G.; Yamagata, T. Prediction of seasonal climate-induced variations in global food production. Nat. Clim. Chang. 2013, 3, 904–908. [Google Scholar] [CrossRef]
  6. Adams, R.M.; Chen, C.C.; McCarl, B.A.; Schimmelpfennig, D.E. Climate Variability and Climate Change: Implications for Agriculture. In The Long-Term Economics of Climate Change: Beyond a Doubling of Greenhouse Gas Concentrations; Hall, D.C., Horwarth, R.B., Eds.; Emerald Group Publishing Limited: Bingley, UK, 2001; pp. 95–113. ISBN 0-7623-0305-0. [Google Scholar]
  7. Mall, R.K.; Singh, R.; Gupta, A.; Srinivasan, G.; Rathore, L.S. Impact of climate change on Indian agriculture: A review. Clim. Change 2006, 78, 445–478. [Google Scholar] [CrossRef] [Green Version]
  8. Ray, D.K.; Gerber, J.S.; MacDonald, G.K.; West, P.C. Climate variation explains a third of global crop yield variability. Nat. Commun. 2015, 6, 5989. [Google Scholar] [CrossRef] [PubMed] [Green Version]
  9. Črepinšek, Z.; Štampar, F.; Kajfež-Bogataj, L.; Solar, A. The response of Corylus avellana L. phenology to rising temperature in north-eastern Slovenia. Int. J. Biometeorol. 2012, 56, 681–694. [Google Scholar]
  10. Škvareninová, J. Impact of climatic conditions on the reproductive phenological phases of European hazel (Corylus avellana L.) in Slovakia. J. For. Sci. 2016, 62, 47–52. [Google Scholar]
  11. Kasprzyk, I. Flowering phenology and airborne pollen grains of chosen tree taxa in Rzeszów (SE Poland). Aerobiologia 2003, 19, 113–120. [Google Scholar] [CrossRef]
  12. Kasprzyk, I.; Uruska, A.; Szczepanek, K.; Latałowa, M.; Gaweł, J.; Harmata, K.; Myszkowska, D.; Stach, A.; Stępalska, D. Regional differentiation in the dynamics of the pollen seasons of Alnus, Corylus and Fraxinus in Poland (preliminary results). Aerobiologia 2004, 20, 141–151. [Google Scholar] [CrossRef]
  13. Cappai, C.; Kemanian, A.R.; Lagomarsino, A.; Roggero, P.P.; Lai, R.; Agnelli, A.E.; Seddaiu, G. Small-scale spatial variation of soil organic matter pools generated by cork oak trees in Mediterranean agro-silvo-pastoral systems. Geoderma 2017, 304, 59–67. [Google Scholar] [CrossRef]
  14. González-Ubierna, S.; Lai, R. Modelling the effects of climate factors on soil respiration across Mediterranean ecosystems. J. Arid Environ. 2019, 165, 46–54. [Google Scholar] [CrossRef]
  15. Lobell, D.B.; Schlenker, W.; Costa-Roberts, J. Climate trends and global crop production since 1980. Science 2011, 333, 616–620. [Google Scholar] [CrossRef] [PubMed] [Green Version]
  16. Zhang, P.; Zhang, J.; Chen, M. Economic impacts of climate change on agriculture: The importance of additional climatic variables other than temperature and precipitation. J. Environ. Econ. Manag. 2017, 83, 8–31. [Google Scholar] [CrossRef]
  17. Chen, C.; Baethgen, W.E.; Robertson, A. Contributions of individual variation in temperature, solar radiation and precipitation to crop yield in the North China Plain, 1961–2003. Clim. Chang. 2013, 116, 767–788. [Google Scholar] [CrossRef] [Green Version]
  18. Peltonen-Sainio, P.; Jauhiainen, L.; Trnka, M.; Olesen, J.E.; Calanca, P.; Eckersten, H.; Eitzinger, J.; Gobin, A.; Kersebaum, K.C.; Kozyra, J. Coincidence of variation in yield and climate in Europe. Agric. Ecosyst. Environ. 2010, 139, 483–489. [Google Scholar] [CrossRef]
  19. Olesen, J.E.; Bindi, M. Consequences of climate change for European agricultural productivity, land use and policy. Eur. J. Agron. 2002, 16, 239–262. [Google Scholar] [CrossRef]
  20. Ewert, F.; Rounsevell, M.D.A.; Reginster, I.; Metzger, M.J.; Leemans, R. Future scenarios of European agricultural land use: I. estimating changes in crop productivity. Agric. Ecosyst. Environ. 2005, 107, 101–116. [Google Scholar] [CrossRef]
  21. European Energy Agency. Impacts of Europe’s Changing Climate-An Indicator-based Assessment; European Energy Agency Report No 2; European Energy Agency: Copenhagen, Denmark, 2004. [Google Scholar]
  22. Ciais, P.; Reichstein, M.; Viovy, N.; Granier, A.; Ogée, J.; Allard, V.; Aubinet, M.; Buchmann, N.; Bernhofer, C.; Carrara, A. Europe-wide reduction in primary productivity caused by the heat and drought in 2003. Nature 2005, 437, 529–533. [Google Scholar] [CrossRef]
  23. Osborne, T.M.; Wheeler, T.R. Evidence for a climate signal in trends of global crop yield variability over the past 50 years. Environ. Res. Lett. 2013, 8, 024001. [Google Scholar] [CrossRef]
  24. Directorate General of Cooperatives. Hazelnut Report for 2017 (in Turkish); Republic of Turkey Ministry of Customs and Trade, Directorate General of Cooperatives: Ankara, Turkey, 2018. Available online: http://koop.gtb.gov.tr/data/5ad06bb9ddee7dd8b423eb23/2017%20F%C4%B1nd%C4%B1k%20Raporu.pdf (accessed on 12 September 2019).
  25. Türkeş, M. Influence of geopotential heights, cyclone frequency and Southern Oscillation on rainfall variations in Turkey. Int. J. Climatol. 1998, 18, 649–680. [Google Scholar] [CrossRef]
  26. Türkeş, M. General Climatology: Fundamentals of Atmosphere, Weather, and Climate, 1st ed.; Kriter Press: Istanbul, Turkey, 2016. (In Turkish) [Google Scholar]
  27. Köksal, A.İ. Turkish Hazelnut Types; Hazelnut Promotion Group: Ankara, Turkey, 2002; ISBN 975-92886-0-5. (In Turkish) [Google Scholar]
  28. Türkeş, M. Climatology and Meteorology, 1st ed.; Kriter Press: Istanbul, Turkey, 2010. (In Turkish) [Google Scholar]
  29. Türkeş, M. Drought vulnerability and risk analysis of Turkey with respect to climatic variability and socio-ecological indicators (in Turkish with the English abstract, figure and table captions). Aegean Geogr. J. 2017, 26, 47–70. [Google Scholar]
  30. Lobell, D.B.; Field, C.B.; Cahill, K.N.; Bonfils, C. Impacts of future climate change on California perennial crop yields: Model projections with climate and crop uncertainties. Agric. For. Meteorol. 2006, 141, 208–218. [Google Scholar] [CrossRef] [Green Version]
  31. Mehlenbacher, S.A.; Smith, D.C.; Brenner, L.K. Variance components and heritability of nut and kernel defects in hazelnut. Plant Breed. 1993, 110, 144–152. [Google Scholar] [CrossRef]
  32. Beyhan, N.; Odabaş, F. The climate factors’ effects on the yield in hazelnut and importance for growing. Ondokuz Mayis Univ. J. Agric. Fac. 1996, 11, 177–188. (In Turkish) [Google Scholar]
  33. Ana, A.S.; Silva, P.; Rosa, E. Shoot growth and yield of hazelnut (Corylus avellana L.) and the influence of climate: Ten years of observations. J. Hortic. Sci. Biotechnol. 1998, 73, 245–250. [Google Scholar] [CrossRef]
  34. Climateurope. Climate and Hazelnuts: Ferrero. Available online: https://www.climateurope.eu/climate-and-hazelnuts-ferrero/ (accessed on 14 June 2019).
  35. Tao, F.; Yokozawa, M.; Xu, Y.; Hayashi, Y.; Zhang, Z. Climate changes and trends in phenology and yields of field crops in China, 1981–2000. Agric. For. Meteorol. 2006, 138, 82–92. [Google Scholar] [CrossRef]
  36. Ortiz-Bobea, A.; Just, R.E. Modeling the structure of adaptation in climate change impact assessment. Am. J. Agric. Econ. 2012, 95, 244–251. [Google Scholar] [CrossRef] [Green Version]
  37. Ahmad, S.; Abbas, Q.; Abbas, G.; Fatima, Z.; Rehman, A.-U.; Naz, S.; Younis, H.; Khan, R.J.; Nasim, W.; Rahman, M.H.U.; et al. Quantification of climate warming and crop management impacts on cotton phenology. Plants 2017, 6, 7. [Google Scholar] [CrossRef] [Green Version]
  38. Zscheischler, J.; Orth, R.; Seneviratne, S.I. Bivariate return periods of temperature and precipitation explain a large fraction of European crop yields. Biogeosciences 2017, 14, 3309–3320. [Google Scholar] [CrossRef] [Green Version]
  39. Turkish State Meteorological Service. Phenological Maps (in Turkish). Available online: https://mgm.gov.tr/veridegerlendirme/fenolojik-normal-haritalari.aspx?b=findik#sfB (accessed on 30 April 2017).
  40. Beyhan, N.; Odabaş, F. A research on the flower and fruit drops of hazelnut. In Proceedings of the Symposium on the 150th Anniversary of Agricultural Teaching-Hazelnut and Other Nut Fruits, Samsun, Turkey, 10–11 January 1996; pp. 110–118. (In Turkish). [Google Scholar]
  41. Lobell, D.B.; Cahill, K.N.; Field, C.B. Historical effects of temperature and precipitation on California crop yields. Clim. Chang. 2007, 81, 187–203. [Google Scholar] [CrossRef]
  42. Baldwin, B. The Growth and Productivity of Hazelnut Cultivars (Corylus avellana L.) in Australia. Ph.D. Thesis, University of Sydney, Sydney, Australia, 2015. [Google Scholar]
  43. Lagerstedt, H.B. Filberts. In Nut Tree Culture in North America; Jaynes, R.A., Ed.; The Northern Nut Grower Association Incorporation: Indiana, IN, USA, 1981; p. 139. [Google Scholar]
  44. Valentini, N.; Caviglione, M.; Ponso, A.; Lovisolo, C.; Me, G. Physiological Aspects of Hazelnut Trees Grown in Different Training Systems. In Proceedings of the VII, International Congress on Hazelnut, Viterbo, Italy, 23 June 2008; pp. 233–238. [Google Scholar]
  45. Beyhan, N.; Marangoz, D. Investigation of blank nuts formation of hazelnut. In Proceedings of the Turkey III, National Congress on Horticulture, Ankara, Turkey, 15–17 September 1999; pp. 585–589. (In Turkish). [Google Scholar]
  46. Silva, A.P.; Ribeiro, R.M.; Santos, A.; Rosa, E. Blank fruits in hazelnut (Corylus avellana L.) cv. ‘Butler’: Characterization and influence of climate. J. Hortic. Sci. 1996, 71, 709–720. [Google Scholar] [CrossRef]
  47. Beyhan, N.; Marangoz, D. An investigation of the relationship between reproductive growth and yield loss in hazelnut. Sci. Hortic. 2007, 113, 208–215. [Google Scholar] [CrossRef]
  48. Tous, J. Hazelnut Production in Spain. In Acta Horticulturae; Tous, J., Rovira, M., Romero, A., Eds.; International Society for Horticultural Science: Virginia, VA, USA, 2005; pp. 659–664. [Google Scholar]
  49. Ustaoğlu, B. The effect of climatic conditions on hazelnut (Corylus avellana) yield in Giresun (Turkey). Marmara Geogr. Rev. 2012, 26, 302–323. [Google Scholar]
  50. Ustaoglu, B.; Karaca, M. The effects of climate change on spatiotemporal changes of hazelnut (Corylus avellana) cultivation areas in the Black Sea Region, Turkey. Appl. Ecol. Environ. Res. 2014, 12, 309–324. [Google Scholar] [CrossRef]
  51. Mingeau, M.; Rousseau, P. Water use of hazelnut trees as measured with lysimeters. In Acta Horticulturae; Me, G., Radicati, L., Eds.; International Society for Horticultural Science: Virginia, VA, USA, 1994; pp. 315–322. [Google Scholar]
  52. Tombesi, A. Influence of Soil Water Levels on Assimilation and Water Use Efficiency in Hazelnuts. In Acta Horticulturae; Me, G., Radicati, L., Eds.; International Society for Horticultural Science: Virginia, VA, USA, 1994; pp. 247–255. [Google Scholar]
  53. Girona, J.; Cohen, M.; Mata, M.; Marsal, J.; Miravete, C. Physiological, Growth and Yield Responses of Hazelnut (Corylus avellana L.) to Different Irrigation Regimes. In Proceedings of the III, International Congress on Hazelnut, Alba, Italy, 14 September 1992; pp. 463–472. [Google Scholar]
  54. Bignami, C.; Natali, S. Influence of Irrigation on the Growth and Production of Young Hazelnuts. In Proceedings of the IV, International Symposium on Hazelnut, Ordu, Turkey, 30 July 1996; pp. 247–262. [Google Scholar]
  55. Cristofori, V.; Muleo, R.; Bignami, C.; Rugini, E. Long Term Evaluation of Hazelnut Response to Drip Irrigation. In Proceedings of the VIII, International Congress on Hazelnut, Temuco City, Chile, 19–22 March 2012; pp. 179–185. [Google Scholar]
  56. Hekimoğlu, B.; Altındeğer, M. Status of Hazelnut Sector, Its Problems and Solutions Proposals (in Turkish). Republic of Turkey Governorship of Samsun, Samsun Agriculture Provincial Directorate: Samsun, Turkey, 2006. Available online: https://samsun.tarimorman.gov.tr/Belgeler/Yayinlar/Kitaplarimiz/Findik_Sektorunun_Durumu_Sorunlari_ve_Cozum_Onerileri.pdf (accessed on 31 March 2020).
  57. General Directorate of Tradesmen, Artisans and Cooperatives. Hazelnut Report for 2018 (in Turkish). Republic of Turkey Ministry of Commerce, General Directorate of Tradesmen, Artisans and Cooperatives: Ankara, Turkey, 2019. Available online: https://ticaret.gov.tr/data/5d41e59913b87639ac9e02e8/5c41e34d540794faaa011bdfa3466ff3.pdf (accessed on 31 March 2020).
  58. Gao, X.; Zhao, Z.; Giorgi, F. Changes of extreme events in regional climate simulations over East Asia. Adv. Atmos. Sci. 2002, 19, 927–942. [Google Scholar]
  59. Chen, M.; Pollard, D.; Barron, E.J. Comparison of future climate change over North America simulated by two regional models. J. Geophys. Res. Atmos. 2003, 108, 4348. [Google Scholar] [CrossRef] [Green Version]
  60. Almazroui, M. Dynamical downscaling of rainfall and temperature over the Arabian Peninsula using RegCM4. Clim. Res. 2012, 52, 49–62. [Google Scholar] [CrossRef] [Green Version]
  61. Gu, H.; Wang, G.; Yu, Z.; Mei, R. Assessing future climate changes and extreme indicators in east and south Asia using the RegCM4 regional climate model. Clim. Chang. 2012, 114, 301–317. [Google Scholar] [CrossRef]
  62. Coppola, E.; Giorgi, F.; Raffaele, F.; Fuentes-Franco, R.; Giuliani, G.; Llopart-Pereira, M.; Mamgain, A.; Mariotti, L.; Diro, G.T.; Torma, C. Present and future climatologies in the phase I CREMA experiment. Clim. Chang. 2014, 125, 23–38. [Google Scholar] [CrossRef]
  63. Mariotti, L.; Diallo, I.; Coppola, E.; Giorgi, F. Seasonal and intraseasonal changes of African monsoon climates in 21st century CORDEX projections. Clim. Chang. 2014, 125, 53–65. [Google Scholar] [CrossRef]
  64. Turp, M.T.; Öztürk, T.; Türkeş, M.; Kurnaz, M.L. Investigation of projected changes for near future air temperature and precipitation climatology of Turkey and surrounding regions by using the regional climate model RegCM4.3.5 (in Turkish with the English abstract, figure and table captions). Aegean Geogr. J. 2014, 23, 1–24. [Google Scholar]
  65. Sylla, M.B.; Pal, J.S.; Wang, G.L.; Lawrence, P.J. Impact of land cover characterization on regional climate modeling over West Africa. Clim. Dyn. 2016, 46, 637–650. [Google Scholar] [CrossRef]
  66. Ozturk, T.; Turp, M.T.; Türkeş, M.; Kurnaz, M.L. Projected changes in temperature and precipitation climatology of Central Asia CORDEX Region 8 by using RegCM4.3.5. Atmos. Res. 2017, 183, 296–307. [Google Scholar] [CrossRef]
  67. Ozturk, T.; Turp, M.T.; Türkeş, M.; Kurnaz, M.L. Future projections of temperature and precipitation climatology for CORDEX-MENA domain using RegCM4.4. Atmos. Res. 2018, 206, 87–107. [Google Scholar] [CrossRef]
  68. Ozturk, T.; Turp, M.T.; Türkes, M.; Kurnaz, M.L. Investigation of high-resolution climate projections over Turkey and its surrounding regions using RegCM4.4. Geophys. Res. Abstr. 2017, 19, 8020. [Google Scholar]
  69. Taylor, K.E.; Stouffer, R.J.; Meehl, G.A. An overview of CMIP5 and the experiment design. Bull. Am. Meteorol. Soc. 2012, 93, 485–498. [Google Scholar] [CrossRef] [Green Version]
  70. Giorgi, F.; Coppola, E.; Solmon, F.; Mariotti, L.; Sylla, M.B.; Bi, X.; Elguindi, N.; Diro, G.T.; Nair, V.; Giuliani, G.; et al. RegCM4: Model description and preliminary tests over multiple CORDEX domains. Clim. Res. 2012, 52, 7–29. [Google Scholar] [CrossRef] [Green Version]
  71. Van Vuuren, D.P.; Edmonds, J.; Kainuma, M.; Riahi, K.; Thomson, A.; Hibbard, K.; Hurtt, G.C.; Kram, T.; Krey, V.; Lamarque, J.F. The representative concentration pathways: An overview. Clim. Chang. 2011, 109, 5–31. [Google Scholar] [CrossRef]
  72. Turkish Statistical Institute. Statistics by Theme. Available online: http://www.turkstat.gov.tr/UstMenu.do?metod=kategorist (accessed on 5 December 2016).
  73. Lobell, D.B. Changes in diurnal temperature range and national cereal yields. Agric. For. Meteorol. 2007, 145, 229–238. [Google Scholar] [CrossRef]
  74. Rosenzweig, C.; Tubiello, F.N. Effects of changes in minimum and maximum temperature on wheat yields in the central US A simulation study. Agric. For. Meteorol. 1996, 80, 215–230. [Google Scholar] [CrossRef]
  75. Dhakhwa, G.B.; Campbell, C.L. Potential effects of differential day-night warming in global climate change on crop production. Clim. Chang. 1998, 40, 647–667. [Google Scholar] [CrossRef]
  76. Tubiello, F.N.; Rosenzweig, C.; Goldberg, R.A.; Jagtap, S.; Jones, J.W. Effects of climate change on US crop production: Simulation results using two different GCM scenarios. Part I: Wheat, potato, maize, and citrus. Clim. Res. 2002, 20, 259–270. [Google Scholar] [CrossRef] [Green Version]
  77. Moulton, B.R.; Randolph, W.C. Alternative tests of the error components model. Econometrica 1989, 57, 685–693. [Google Scholar] [CrossRef]
  78. Breusch, T.S. Maximum likelihood estimation of random effects models. J. Econ. 1987, 36, 383–389. [Google Scholar] [CrossRef]
  79. Breusch, T.S.; Pagan, A.R. The Lagrange multiplier test and its applications to model specification in econometrics. Rev. Econ. Stud. 1980, 47, 239–253. [Google Scholar] [CrossRef]
  80. Baltagi, B.H.; Li, Q.A. Lagrange multiplier test for the error components model with incomplete panels. Econ. Rev. 1990, 9, 103–107. [Google Scholar] [CrossRef]
  81. Pesaran, M.H. General Diagnostic Tests for Cross Section Dependence in Panels; Cambridge Working Papers in Economics No 0435; The Faculty of Economics of the University of Cambridge: Cambridge, UK, 2004. [Google Scholar]
  82. Pesaran, M.H. A simple panel unit root test in the presence of cross-section dependence. J. Appl. Econ. 2007, 22, 265–312. [Google Scholar] [CrossRef] [Green Version]
  83. Hausman, J.A. Specification tests in econometrics. Econometrica 1978, 46, 1251–1271. [Google Scholar] [CrossRef] [Green Version]
  84. Özbek, S. Private Fruit Growing; Ankara University Press: Ankara, Turkey, 1978. [Google Scholar]
  85. Hummer, K.; Lagerstedt, H.B.; Kim, S.K. Filbert acclimation, maximum cold hardiness, and deacclimation. J. Am. Soc. Hortic. Sci. 1986, 111, 474–482. (In Turkish) [Google Scholar]
  86. Doğanay, H. New developments in Turkish hazelnut cultivation (in Turkish with an English abstract). East. Geogr. Rev. 2012, 17, 1–22. [Google Scholar]
  87. Balık, H.İ.; Kayalak Balık, S. Investigation on the Frost Damage on Hazelnut in 2014. In Proceedings of the GAP VII, Agriculture Congress, Şanlıurfa, Turkey, 28 April–1 May 2014; pp. 291–294. (In Turkish). [Google Scholar]
  88. Yu, D. Chocolate Companies Drive Growth for Global Hazelnut Market. Confectionery News, 28 August 2018. Available online: https://www.confectionerynews.com/Article/2018/08/28/Chocolate-companies-drive-growth-for-global-hazelnut-market (accessed on 13 September 2019).
Figure 1. Topographical map of Turkey and the hazelnut growing regions.
Agriculture 10 00159 g001
Figure 2. Altitude distribution for 88 locations in the Black Sea region and the eastern Marmara sub-region.
Agriculture 10 00159 g002
Figure 3. Projected changes in (a) monthly mean temperature (Tmean; °C), (b) monthly average diurnal temperature range (DTR; °C), (c) monthly average total precipitation amount (Pr; %), (d) monthly average total actual evapotranspiration (AET; %), (e) monthly average relative humidity (RH; %), and (f) monthly average total duration of sunshine (SunD; hr) under RCP8.5 scenario for the period of 2021–2050 with respect to the period of 1991–2012, using dynamically downscaled model outputs.
Agriculture 10 00159 g003
Figure 4. Spatial distribution of percentage changes in yield. On the left, the values on the vertical axis are the percentage changes, whereas the navy-blue dots represent each location within the related region given on the horizontal axis. On the right, the relationship between the number of locations and the percentage ranges of the regional changes are illustrated.
Agriculture 10 00159 g004
Figure 5. Spatial distribution of the model results in the change in hazelnut yield in Turkey for the period of 2021–2050 with respect to the period of 1991–2012.
Agriculture 10 00159 g005
Figure 6. Projected yield change by province based on RCP8.5 for the period of 2021–2050 with respect to the period of 1991–2012, using dynamically downscaled MPI–ESM–MR model outputs.
Agriculture 10 00159 g006
Table 1. Phenological periods of hazelnut. They cover the 11-month period between October of the previous year and August of the following year.
Vegetative Season (from dormancy to flowering)October, November, December
Flowering Season (bud break and fully flowering)January, February, March, April
Grain Filling Season (from flowering to maturity)May, June, July, August
Table 2. Detailed description of the variables used in the model. Yield data have the annual time series of 1991–1992 for the reference period and 2021–2050 for the future period. Time range of the climate variables covers each month of the years between 1991 and 2012 for the reference period while it covers each month of the years between 2021 and 2050 for the future period.
VariableDefinitionTime RangeUnit
YieldAnnual yieldAnnual(kg/103 m2)
Mean air temperature
Precipitation amount
Monthly average of mean temperature
Monthly total precipitation
  Oct.–Aug. *
Oct.–Aug.
(°C)
(mm)
Actual evapotranspirationMonthly total actual evapotranspirationOct.–Aug.(mm)
Relative humidityMonthly average of relative humidityOct.–Aug.(%)
Duration of sunshineMonthly total duration of sunshineOct.–Aug.(hr)
Diurnal temperature rangeMonthly difference between maximum temperature and minimum temperatureOct.–Aug.(°C)
* October–August.
Table 3. Statistical yield model results of the climate variables for the phenological periods of hazelnut.
DormancyFloweringGrain Filling
(Bearing and Maturing)
VariableCoefficientVariableCoefficientVariableCoefficient
TmeanOct17.761 *
(6.307)
TmeanJan13.452 ***
(7.891)
TmeanMay15.167
(12.048)
TmeanNov−14.935 **
(7.531)
TmeanFeb1.716
(8.538)
TmeanJun−6.651
(8.512)
TmeanDec−19.307 *
(6.286)
TmeanMar22.187 *
(8.547)
TmeanJul−6.797
(11.145)
DTROct1.045 *
(0.325)
TmeanApr16.902 *
(4.875)
TmeanAug−32.907 *
(8.322)
DTRNov0.853 **
(0.365)
DTRJan0.485 **
(0.248)
DTRMay−0.279
(0.300)
DTRDec−0.340
(0.316)
DTRFeb−0.552 **
(0.237)
DTRJun−0.255
(0.359)
PrOct0.073 **
(0.037)
DTRMar0.787 **
(0.311)
DTRJul0.078
(0.329)
PrNov0.003
(0.045)
DTRApr−0.900 *
(0.276)
DTRAug−0.056
(0.257)
PrDec−0.003
(0.039)
PrJan0.002
(0.052)
PrMay−0.041
(0.062)
AETOct0.329 **
(0.137)
PrFeb−0.103 **
(0.050)
PrJun0.056
(0.054)
AETNov−0.043
(0.125)
PrMar−0.055
(0.047)
PrJul0.072 **
(0.030)
AETDec0.107
(0.136)
PrApr−0.051
(0.059)
PrAug−0.249 *
(0.040)
RHOct1.072 **
(0.421)
AETJan−0.129
(0.108)
AETMay0.000
(0.174)
RHNov−1.853 **
(0.749)
AETFeb0.297 **
(0.132)
AETJun−0.073
(0.184)
RHDec−0.673
(0.627)
AETMar−0.169
(0.179)
AETJul−0.519 *
(0.142)
SunDOct−1.671
(1.390)
AETApr−0.123
(0.117)
AETAug0.508 *
(0.139)
SunDNov−2.539 *
(0.863)
RHJan2.780 *
(0.632)
RHMay0.233
(0.677)
SunDDec−0.074
(0.292)
RHFeb−0.507
(0.659)
RHJun−0.310
(0.513)
RHMar2.339 *
(0.528)
RHJul0.455
(0.470)
RHApr−0.269
(0.384)
RHAug−0.560
(0.506)
SunDJan−0.598
(0.586)
SunDMay−0.138
(1.724)
SunDFeb1.428 **
(0.560)
SunDJun−0.202
(1.569)
SunDMar1.831 ***
(1.007)
SunDJul2.506
(2.328)
SunDApr−1.007
(1.826)
SunDAug0.316
(1.913)
p > 0.01 *, p > 0.05 **, p > 0.10 ***; the numbers in parentheses are standard deviations.

