Article

Farmers’ Willingness to Pay for Services to Ensure Sustainable Agricultural Income in the GAP-Harran Plain, Şanlıurfa, Turkey

by
Hatice Parlakçı Doğan
1,
Mustafa Hakkı Aydoğdu
1,
Mehmet Reşit Sevinç
2,* and
Mehmet Cançelik
3
1
Department of Agricultural Economics, Faculty of Agriculture, Harran University, 63050 Şanlıurfa, Turkey
2
Department of Bozova Voc. Sch., Harran University, 63850 Şanlıurfa, Turkey
3
Department of Social Science Voc. Sch., Harran University, 63200 Şanlıurfa, Turkey
*
Author to whom correspondence should be addressed.
Agriculture 2020, 10(5), 152; https://doi.org/10.3390/agriculture10050152
Submission received: 27 March 2020 / Revised: 27 April 2020 / Accepted: 29 April 2020 / Published: 4 May 2020
(This article belongs to the Special Issue Productivity, Efficiency, and Sustainability in Agriculture)

Abstract

:
Sustainable agriculture is necessary for farmers to have a sustainable income. This research aims to determine the willingness to pay (WTP) of farmers in the GAP-Harran Plain for services that would ensure sustainable agricultural income, the factors affecting their willingness, and the minimum amount they would be willing to pay. The main material of the research has been obtained by means of face-to-face surveys involving farmers selected by a simple random sampling method in the GAP-Harran Plain. The sampling volume was determined with a 95% confidence limit and a 5% error margin. Heckman’s two-stage model was used for the analysis. According to the results of the research, 22.61% of the participants showed WTP, and the average amount they were willing to pay was 180.82 TL/hectare (ha) ($31.86/ha). This amount was 3.08% of the average annual agricultural income calculated. About 41.22% of the participants showed no WTP. They believed that the public sector is accountable of the services and consequently, they should be provided free of charge. About 23.14% of the participants showed WTP only for the services that they needed. The average WTP for all participants was calculated as 40.9 TL/ha ($7.21/ha) and 1.2 million $/year for the GAP-Harran Plain. This amount is the minimum and may increase by several folds with a demand-based variety of service delivery. The factors that statistically effect WTP have been determined as age, education, experience, number of households working in agriculture, amount of land, agricultural income, non-agricultural income, membership status of agricultural cooperatives, and product pattern. The results provide useful information to guide researchers, decision-makers, and policy-makers.

1. Introduction

Agriculture has of great importance to all countries to meet their food needs. Agricultural production, which is the main source of life, faces sustainability problems due to various reasons. Agricultural production is a source of rural livelihood and employment, and it is becoming more important as a driving force for rural economic growth and poverty reduction in developing countries [1]. For sustainable agriculture, farmers must obtain sustainable satisfactory income from their production [2]. According to the Global Risks Report of 2018, the five most serious global risks that may occur are weapons of mass destruction, extreme weather events, natural disasters, migration and adaptation problems due to climate change, and water crises [3]. Almost all of these five global risks are directly related to agriculture and food safety issues and threaten sustainable agricultural activities. On the other hand, it cannot be said that decision-makers pursue adequate, rapid, and effective measures against these risks. To be able to meet the global food demand in 2050, agricultural production should be increased by 60% more than in 2005–2007 [4]. In addition to natural disasters such as climate change and drought, human activities such as intensive agricultural production have worsened the sustainability problems [5]. Despite the rapidly increasing world food demand, the possibility of expanding agricultural production areas is quite limited. Even in many countries, agricultural lands are gradually decreasing [6]; globally, more than 10 million ha of land continue to deteriorate annually [7] and more pressure is put on the rest of the agricultural production areas. On the other hand, deliberate practices have been made to increase the quantity of products from a unit area have resulted in some problems, too. The widespread use of synthetic chemicals for uncontrolled irrigation, frequent tillage, fertilization, and pesticides to increase yield for crop production and income in the early years [8,9]. However, later on, depending on the structure and topography of the cultivated land, these practices started to affect the production area, yield, produce, ecology, environment, and natural resources negatively in the medium and long term [10,11]. Besides, the relationship between pesticides, fertilizers, and hormones which are used in agricultural practices and increasing health problems have has been increasingly discussed [10,12].
Sustainable agricultural income is the income that farmers and their families obtain by using agricultural resources to provide their livelihood in the rural areas and to be at the welfare standards of the society in which they live for today and cover future needs. As a result of uncontrolled natural events, the income of farmers can fluctuate from year to year, and in the years when the product to provide sufficient income cannot be bought, farmers are worried about their livelihoods [13,14]. While the increase in sustainable agricultural income basically will have positive effects on food security, employment, raw materials for other sectors, and at most on rural development targets. This situation positively affects the farmer’s tendency to remain in agriculture and to continue agricultural production [14]. In the case of a decrease in income, while the positive effects due to the increase will be negative, it will create negative pressures on social welfare, and migration from rural to urban. In this case, agricultural lands cannot be cultivated sufficiently and agricultural areas remain idle [15]. Accordingly, production amounts will decrease in rural areas, prices will increase, and pressure on public financing will increase both in rural and urban areas. At this point, those who do not have experience in working outside the agriculture sector and have low education levels cannot keep up with the rapid developments in information and technology, must either find a job in the marginalized sector or increase urban unemployment rates [16]. These results will cause to loss of welfare of the society. Sustainable agriculture includes systems and practices that lead to increased and diversified food production, with healthy, sufficient, and quality quantities at affordable costs; boost the economic viability of agriculture; and enhance the protection of the environment and natural agricultural areas, as well as the welfare of farmers and society [17]. Therefore, it becomes important to ensure food safety and to support the sustainable management of ecosystems, soil, water, and natural resources [4]. With sustainable agriculture, it is possible to obtain optimal yields from production areas, positively affect ecology, provide an additional contribution to production, and find solutions to food and employment problems. Sustainable agricultural income can be obtained through sustainable use of agricultural resources based on optimum usage principles [18]. Farmers generally make up the least educated part of the community in which they live [19]. Farmers need to be informed at all stages of agricultural activities, from production to marketing, for efficient, effective, and sustainable use of resources. Agricultural sustainability covers issues such as climate change, flood, drought, unexpected natural events, river basin system, ecosystem, environmental ecology, irrigation water, protection of agricultural land, advanced technologies, climate change, drought-resistant seeds, etc. Effective needs-oriented services that include policies, compliance policies that have been adapted by the public or private sector, are necessary for local conditions. The adoption of service delivery practices for sustainable agricultural income leads to a sustainable provision of agricultural activities and significantly contributes to a reduction in agricultural concerns. The responsibility here is not only the public sector’s but also the private sector and farmers also have responsibilities. In a study of EU countries, it is stated that producers—i.e., farmers—have responsibilities in the context of sustainable development [20]. These responsibilities cover not only the planning and participation dimensions but also the sharing of costs. While this is important to all countries, it is most important to developing countries. Therefore, it is vital to evaluate the participation of farmers in the valuation of services for sustainable agricultural income and to reveal the factors affecting this participation and its economic dimension.
The Southeastern Anatolia Project (GAP) is the most important integrated sustainable regional development project in the history of the Republic, aiming to increase the sustainable income and welfare of the people of the region. The project aims to activate the agricultural potential of the region based on water and soil resources. Şanlıurfa is the most important agricultural city of the GAP Region and the Harran Plain is the most important plain of the project. The expected increase in agricultural production and the income of farmers, both in Şanlıurfa and in the Harran plain, has not been sufficiently achieved due to many reasons and one of them is lack of detailed field survey based on the needs and attitudes of farmers.
The aim of this research is to determine the attitudes of farmers in the GAP-Harran Plain to accept payment for service supplies that will provide sustainable agricultural income. Also, the affecting factors on these attitudes of the farmers, and their willingness to pay (WTP) with the payment amount of Turkish liras per hectare for these services were investigated. This research is the first of its kind in the GAP Region in this context. The farmers’ WTP amount for service delivery for sustainable agricultural income in the GAP-Harran plain was calculated for the first time with this research. In this sense, the results of this study provide useful data and information that will constitute a basis for other studies both in other regions of Turkey which is a lack of this subject until now and also in other countries with the same socio-economic similarities.

2. Literature Review

In the literature-based studies given below, in essence, farmers’ WTP on various topics for sustainable agricultural activities has been investigated. This situation is also necessary for sustainable agricultural income. Therefore, it is assumed that it is also valid in sustainable income. Because the main source of sustainable income in agriculture is a sustainable agricultural environment and activities.
In a study on sustainable agriculture conducted in Oklahoma, USA, economic analysis of drought-resistant crop cultivation strategies was carried out to reduce the effects of climate change on agricultural production. It has been determined that farmers are concerned about crop types, productivity, and marketing, and that culture affects their WTP on sustainable agriculture [21]. A study conducted in Tanzania focused on the importance of advanced technologies adapted to local conditions for farmers under sustainable agricultural policies. However, it is not clear which factors affect the willingness and demands of small-scale farmers for such technologies. An improved agricultural extension service, besides seeds and fertilizers have been effective in increasing the WTP on sustainable agricultural policy based on the income of the farmers [22]. In a study conducted in Wuhan, China, it was determined that farmers are not satisfied with the ecological environment of existing agricultural lands, which affects sustainability, and that they express a WTP to protect agricultural lands. The research proposed the importance and necessity of factoring in WTP in policies on the protection of agricultural land for an income of sustainable farming [23].
In a study conducted in Şanlıurfa, GAP, Turkey, farmers’ WTP was determined as $48.8/ha for sustainable use of resources for sustainable income. The factors affecting WTP were determined as the location of farmers, the number of agricultural manpower available for a given household, quantity of land and ownership status, and the income derived from agriculture [24]. In a study conducted in Inner Mongolia of China, the participants’ WTP for ecosystem protection was determined as $25.11. The effective factors that determined the WTP were age, education, household income, and sustainability concerns about the income. Younger and more educated respondents had higher WTP, as well as those who were concerned about protection [25]. In a study conducted in Upper Hun River Basin, Northeast China, it was found that large losses were experienced as a result of the degradation of the basin ecosystem due to socio-economic activities of human origin. Emphasizing the importance of the protection and sustainability of the basin, a WTP of $3.2 million was calculated for preventing income losses at the basin [26]. In a study on watershed management in Ethiopia, the WTP was determined to reduce land degradation in 90% of rural residents, with an emphasis on sustainable use of farming lands for income [7].
In Taiwan, farmers’ WTP for meteorological information services for safe agricultural production activities are determined as $56.06 to $90.92 for safe of income. One of the factors affecting WTP is the acreage of the land [27]. In West Java, Indonesia, smallholder farmers have WTP of $2.67/ha for agricultural insurance and sustainable agricultural production based on the risk of climate change. The quantity of land, expectation based on crop pattern, and agricultural extension services were determined as the effective factors [28]. In a study conducted in Greece, it was found that farmers have the WTP for sustainable agricultural irrigation based on income [29]. A study carried out in South Korea also found that participants had WTP for sustainable integrated agricultural productions [30]. In another study by the same author, demographic data were found to be influential factors that determine WTP for farming [31].
In a study on the Ganjiang River Basin, China, the importance of protecting the river basin ecosystem for sustainable use was noted. It was stated that this protection should not only be left for the government but those other stakeholders should be involved in the planning without being ignored. Using Heckman’s two-stage model, participants’ WTP was calculated as $47.62 for sustainable use of the ecosystem. The effective factors were found to be the level of education, nature of work, water quality, and quantity [32]. In a study conducted in Uganda, 89% of farmers were found to have a WTP for sustainable agricultural activities for sustainable income. The most important factors were determined as land ownership type, land quantity, and income [33].

3. Materials and Methods
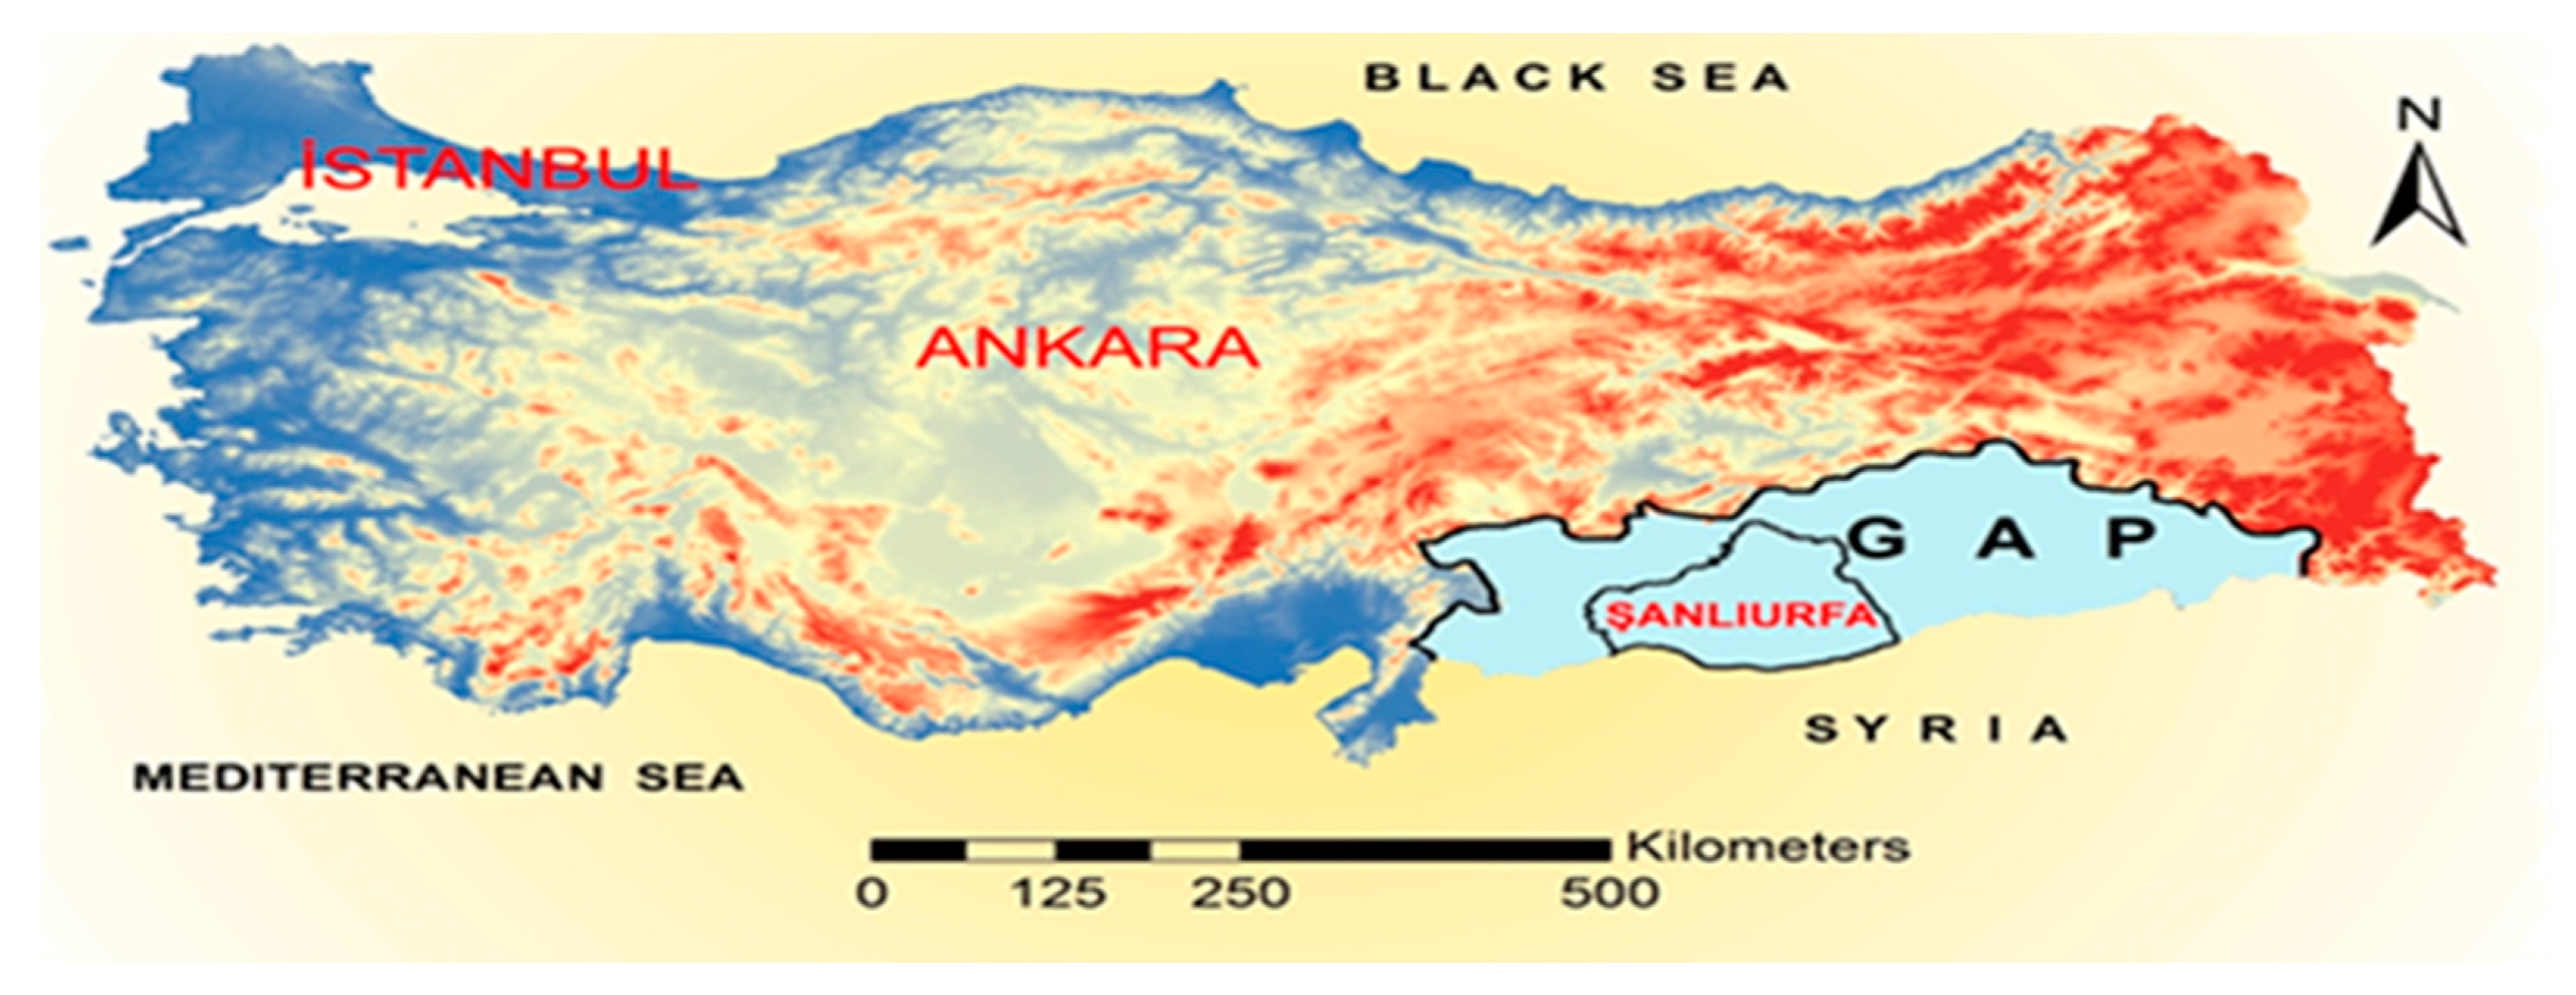
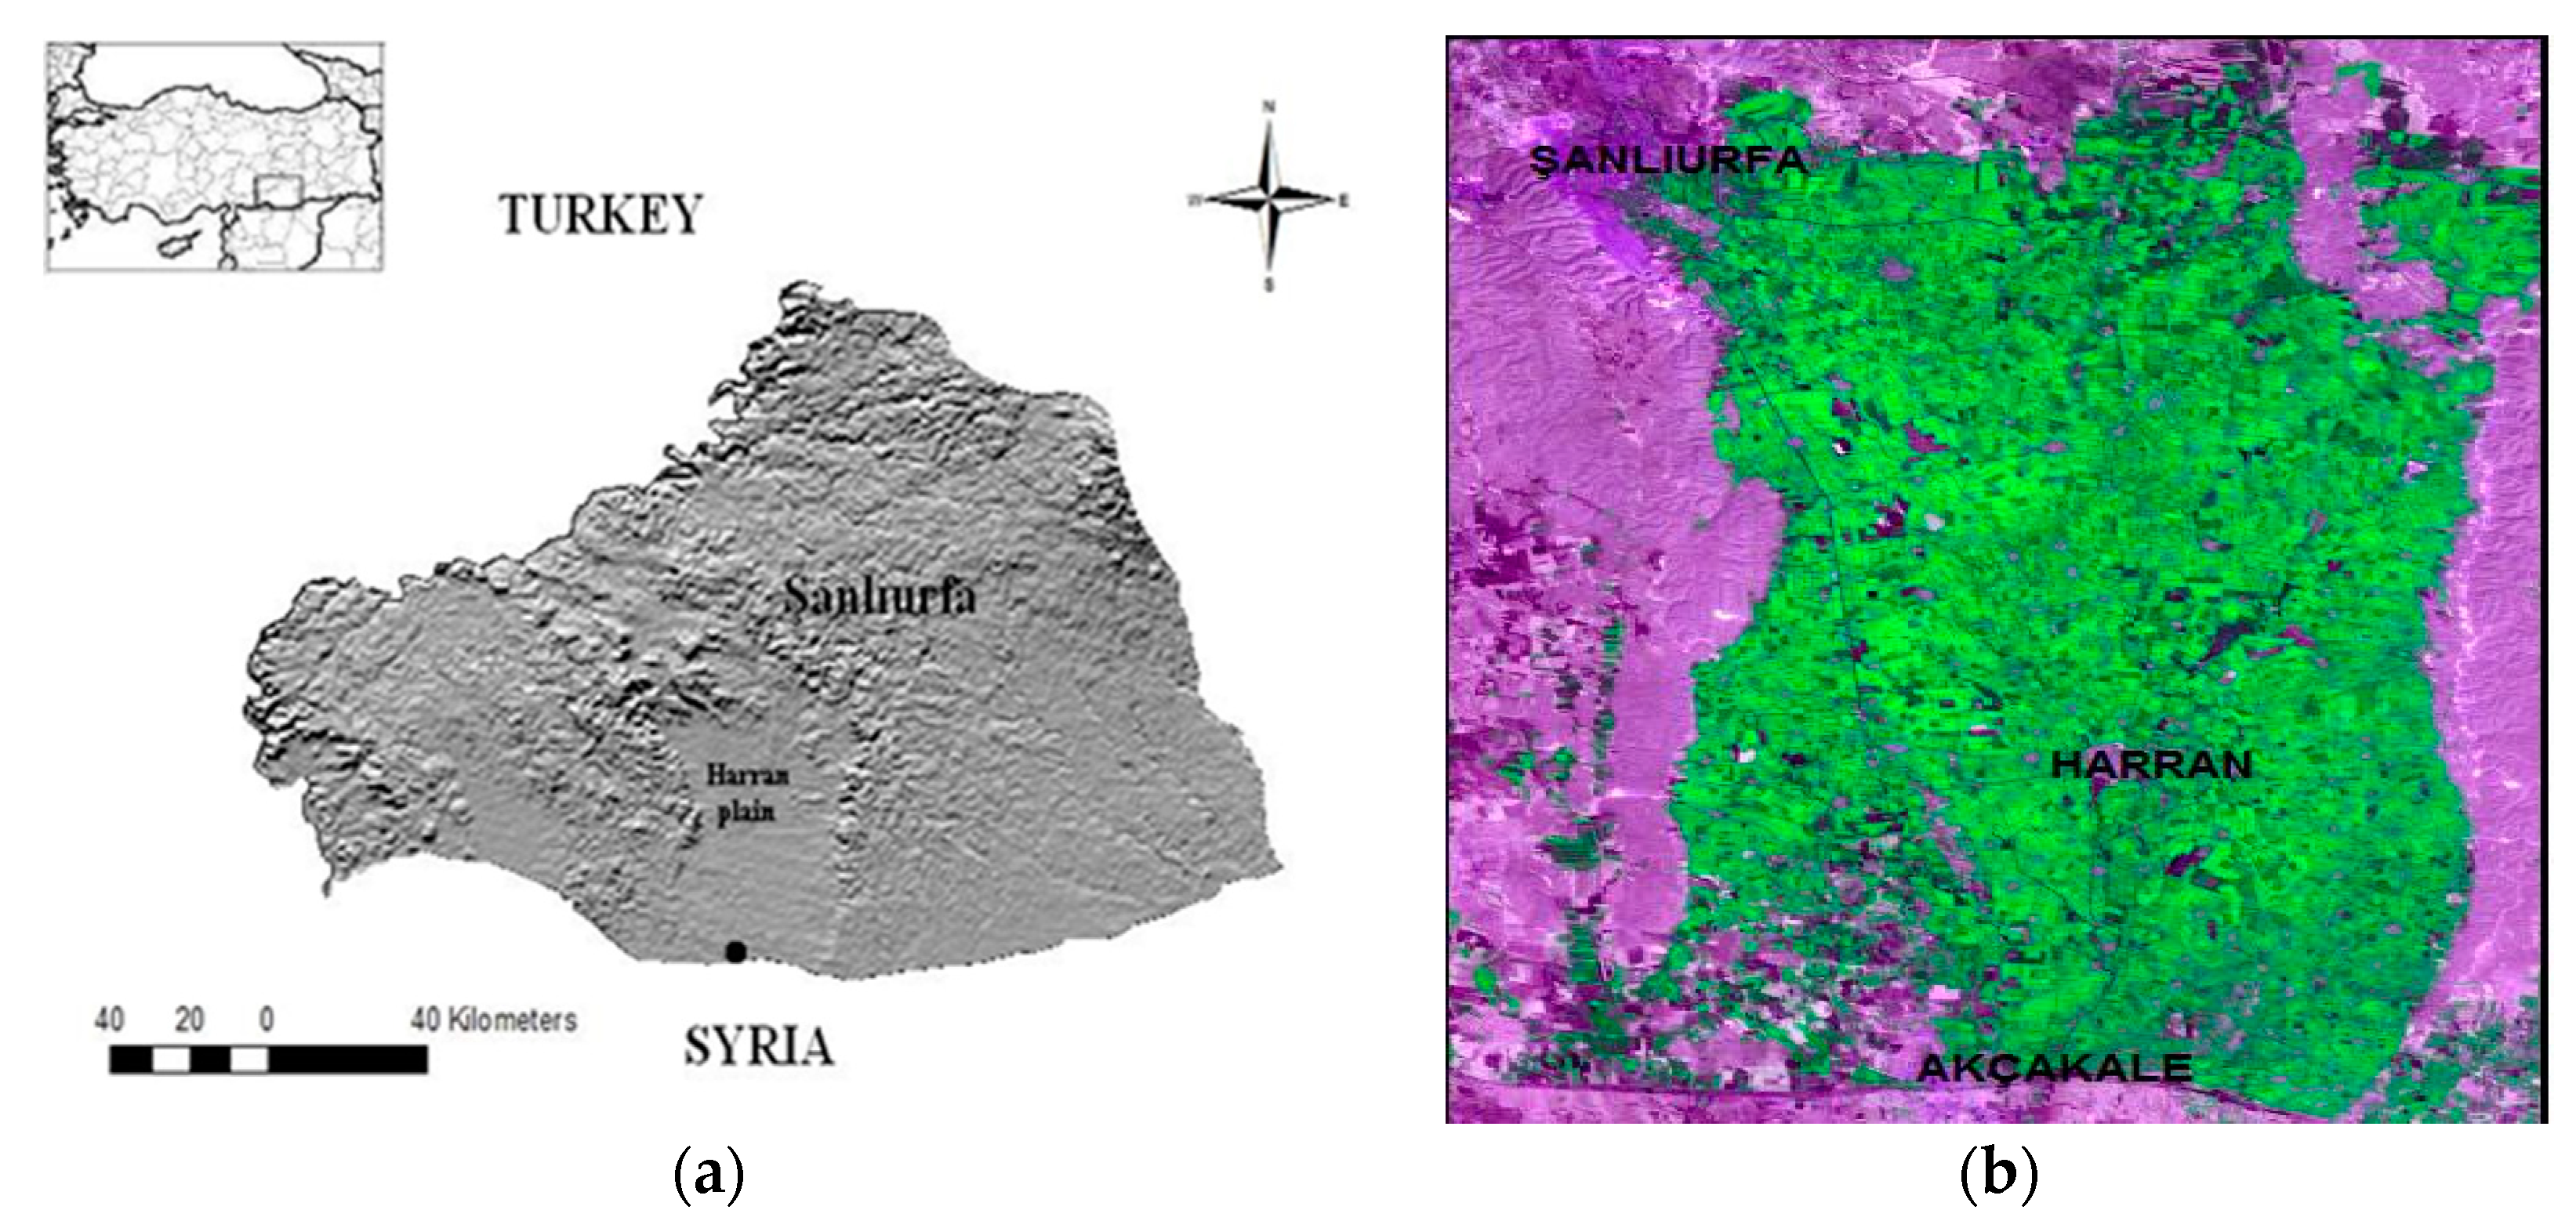
3.1. Research Area

Turkey is divided into seven geographical regions. Southeastern Anatolia Region, despite having the most water and land resources, is the second of Turkey’s least developed. The region has a semi-arid climate [34]. Also, this region has geopolitical importance due to the creation of Turkey’s border with Syria and Iraq. Its main source of livelihood is agriculture and agriculture-based industry [35]. The Southeastern Anatolia Project (for which the Turkish acronym is GAP) is the most comprehensive and costliest project in Turkey, which is located in the southeast at the Euphrates–Tigris basin in the plains of Upper Mesopotamia. The GAP project covers about 11% of Turkey in terms of land area and population [36]. The location of Şanlıurfa, GAP, and Turkey is given in Figure 1 [24].
The main objectives of GAP are to increase the income level and life quality of the local people by utilizing the water and soil resources of the region, to eliminate the development gap between this region and other regions, to increase productivity and employment opportunities in the rural area, and to contribute to economic development and social stability goals at the national level. Within the scope of the project, there are 22 dams, 19 HEPPs, and 1.8 million ha of irrigation areas, with a project budget of $32 billion [36].
Harran Plain is the most important plain in the Southeastern Anatolia Region, which is located in Şanlıurfa. Harran Plain has an area of 151.7 thousand ha, and the first irrigations in relation to GAP started in an area of 30 thousand ha in 1995 (Figure 2); today, the entire plain is under irrigated agriculture. The acreage of the irrigated area, including the Upper Harran irrigated area which is just above the Harran Plain since 2005, is around 166 thousand ha. Harran Plain has 88.5% gravity and 11.5% pressurized irrigation. While there is excessive use of water in the upper parts of the plain, there is water failure in the lower parts towards the south. While this creates a risk of salinity in the upper parts, it creates a drought effect in the lower parts. In both cases, yield and income loss occur in agricultural production [37,38].

3.2. Materials

The research was based on primary sources of data. The main material of this research was obtained from face-to-face surveys of farmers in the GAP-Şanlıurfa-Harran plain. The number of farmers registered in the state farmer registration system on the Şanlıurfa-Harran Plain was 15,824 in 2019. Farmers were selected by a simple random sampling method, using the sample volume table [39], with a 95% confidence limit and a 5% margin of error. The sample size was 376 and 379 questionnaires were used in the analyses. The surveys were conducted in 2019. The surveys included questions to measure the willingness of the farmers to pay for sustainable agricultural income, the farmers’ demographic and socio-economic characteristics, and their ability to pay.

3.3. Methods

During the research, zero observation was obtained because some participants did not want to participate in the payment of services that would enhance sustainable agriculture. Estimation of the model, with the data showing zero observation, would have caused the deviation of the coefficient estimates, and since estimating the model by removing zero observation would also have caused inconsistency. This situation is known as the sample selection deviation. The two-stage estimation method was used to eliminate sample selection deviation [40]. In the Heckman model, using probit instead of logit in the first stage and using the ordinary least square (OLS) instead of other models in the second stage eliminates errors [41]. Several papers use this model to estimate WTP avoiding the problem of selection bias. This research was modeled in two stages to determine the participants’ WTP for sustainable agricultural income and the factors that affect the WTP amount, for those who agreed to pay. Heckman’s two-step model was used in the analysis by using the probit model at the first stage and OLS in the second stage. Heckman correction is a statistical method applied to correct the errors in randomly selected samples or randomly truncated dependent variables [42]. Heckman correction is a two-step statistical approach. Here, a two-step prediction method is used to correct bias resulting from the use of non-randomly selected samples to predict behavioral relationships as a specification error [43,44].
Due to the two-stage nature of the research, Heckman’s two-stage estimation method was applied to the data. The first step of the method involved using a typical binary selection probit model to determine whether farmers were willing to pay for sustainable agricultural income or not. The model can be written for the first stage as [32,45,46]
P ( 0 , 1 ) = β 0 + β 1 X 1 + β 2 X 2 + . + β n X n + ε i
P represents the declared variable; if the participant was willing to pay, it is shown as 1, if not, it is indicated with 0. β 0 is constant, β 0 β n represent the regression coefficients of variables, X 1 X n represent the explanatory variables, and ε i represents the error term.
The second stage of the model is the ordinary least square (OLS) approach, which tries to explain the factors affecting the payment levels if the farmers show WTP for sustainable agricultural income. The model can be written as follows for the second stage [32,45,46].
Y i | P 0 = β 0 + β 1 X 1 + β 2 X 2 + . + β n X n + β n + 1 λ + ε i
Y i represents the declared variable, i.e., the level of WTP of the participants, β 0 is constant, β 0 β n represent the regression coefficients of variables, X 1 X n represent the explanatory variables, and ε i represents the error term. In Equation (2), λ (lambda) represents the Mills ratio. Several papers use this model to estimate WTP avoiding the problem of selection bias. Detailed information about the model used in this research is available in the studies of Heckman, 1976, Heckman, 1979; Amemiya, 1985; Newey et al., 1990; Winship and Mare, 1992; Nawata, 1994; Puhani, 2000; Lee, 2001; Cameron and Trivedi, 2005; Toomet and Henningsen, 2008; Cameron et al., 2010; Xiong, et al., 2018; Kyaw, 2018; Xiong, 2019 [32,42,43,45,46,47,48,49,50,51,52,53,54].

4. Results and Discussion

4.1. Research Findings

The surveys involved only male farmers due to the patriarchal structure of the research area. The research area is generally conservative, with a tribal structure and a sense of belonging. Norms and region-specific cultural values predominate [55]. For example, the oldest one in the family and the chief of the tribe are always the final decision-makers, even about the approval or rejection of marriage decisions, who are men. Young people in the region are mostly uncomfortable with this situation and often prefer urban life when they have the opportunity. Because young people are more educated and open-minded than the final decision-makers although they mostly do not approve of tribal decisions, they show consent due to their sense of belonging [56]. Therefore, they have more opportunities to implement their own decisions and income and freedom in city life. Except for the spouses of the oldest and the chief of the tribe, women do not have much say. Early age marriage is common among women, on the other hand, divorce is not a situation that is approved and welcomed. Education levels are generally low, especially among women [15]. The government has been implementing several policies for the positive development of the socio-economic structure of the region.
Cotton is a product of strategic importance, both in Şanlıurfa and all over Turkey [6,57,58,59]. Of the 81 provinces in Turkey, 6 of them produce 85% of the total cotton in Turkey. Şanlıurfa is the top cotton producer province of Turkey, with 40% of the total production happening in the researched area [59]. Cotton is known as white gold in Şanlıurfa. The variables used in this research were selected depending on the socio-economic characteristics of the research area. Of all the participants, 94.9% were married, 2.9% were single, and 2.2% were widowed. In 2019, on average, $1 was 5.676 TL (Turkish lira) [60]. The descriptive statistics of the participants are given in Table 1.
Participants were asked about their WTP for services needed to generate sustainable agricultural income. The results are given in Table 2.
According to the responses received, the amount declared by those who have WTP is 3.08% of their annual average agricultural income. The farmers who showed no WTP perceived these services as public services and it was believed that it should be provided free of charge. The farmers who had understood the importance of sustainable agriculture for a regular income showed themselves to be conditionally in favor of WTP if there was a service that they needed which satisfied their demands.
Heckman’s first-stage model results regarding the willingness of the surveyed farmers to pay for sustainable agricultural income are given in Table 3, where Pseudo-R2 was calculated as the measure of goodness of fit in the model and its value is 18%. This value is an indicator of the effectiveness of the variables in the model in explaining the dependent variable. Heckman’s second-stage model results are given in Table 4. Wald chi-square value of the model is calculated as 64.14 and p-value as 0.000. We see from these results that the model was statistically significant as a whole. Besides, the Mills rate is meaningless (p > 5%). It can be concluded, from the statistical values, that there is no selection bias in the model. Therefore, the results obtained are reliable.
Table 4 shows the relationship between the factors that affected the payment level of the variables used in the model and their subgroups.

4.2. Discussion

According to the model results in Table 3, there was a statistically significant relationship between the independent variables—which were age, education, experience, the number of households working in agriculture, the quantity of land, agricultural income, non-agricultural income, membership status in agricultural cooperatives, and the crop pattern—and sustainable agricultural income, which as a variable was dependent on the WTP of the farmers.
The average age of the participants was 46.73 years. Young farmers between 18 and 30 years old were taken as the reference in the age variable groups. A statistically significant relationship was detected on the farmers between 41 and 50 years of age, with a significance level of p < 5%. However, a study conducted in China found out that young people showed more WTP for income derived sustainable ecosystem [25]. In another study conducted in South Korea, it was found that the demographic data of farmers effectively determined the WTP for integrated agricultural production [31].
Literate farmers were taken as the reference in the education variable groups. There was a statistically significant relationship at high school graduates, and university graduates. This significance level was p < 10% for high school graduates and p < 5% for university graduates. The participation of adult individuals in education has been found to be inversely proportional to the need for training. As the level of education increases, individuals’ willingness to learn more increases, too [2]. An individual with a high level of education needs less information but the demand for knowledge is high. Because of the increase in the level of knowledge, the individual would be motivated to learn new things [61]. A study conducted in Oklahoma, USA found that culture is an effective determinant of the WTP for a sustainable ecosystem system [62]. Again, another study in China found that educated people showed more WTP for income derived from a sustainable ecosystem [25].
The average farming experience of the participants was determined as 24.77 years. Farmers with between 1 and 10 years’ experience were taken as the reference in the experience variable groups. However, no statistically significant relationship was detected at any of the subgroups (p > 10%). The average household was 8.15 people. Households with between 1 and 4 people were taken as the reference group. As the household increased, concerns about sustainable income also increased. This was as a result of the prevailing conditions for agricultural production, since agricultural production depends on natural conditions, climate, and soil. However, no statistical significance was determined (p > 10%).
On average, 4.80 people of each household work in agriculture. Households with between 1 and 4 people working in agriculture were taken as the reference group for the number of people working in agriculture. There was a statistical relationship on households between 5 and 9 working in agriculture. The significance level was determined as p < 10%. There was a negative relationship on households with 10 or more people working in agriculture, a result that is remarkable and unpredictable. In such a family with over 10 members working in agriculture, the labor force can be a work not only on their own family farms but also for other households for a fee. Thus, participants from these families had extra sources of income. Similar results were obtained in another study conducted in the same region about sustainable use of natural resources [24].
The average land size of each participant was 19.5 ha. Landowners of 5 ha and below were taken as the reference group for the land amount variable. A statistically significant relationship was detected between all subgroups. This significance was determined as p < 5% for the 5.1 to 10 ha and 10.1 to 20 ha subgroups, and p <1% for the over 20 ha subgroup. Similar results were obtained for another study conducted in the same region for an income of sustainable farming [24]. In a study conducted in Wuhan, China, it was found that farmland and productivity effectively affect farmers’ WTP to protect agricultural lands for sustainable income [23]. A study in Taiwan found that one of the most effective factors that affect WTP for safe agricultural production is the acreage of farmland [27]. Another study conducted in West Java, Indonesia found that the quantity of land was an effective factor for WTP for sustainable agricultural production [28]. In another study conducted in Uganda, the size of the land was considered as an effective factor for WTP for sustainable agricultural activities for sustainable income [33].
Land ownership in the research area is in the form of property, rent, and partnership. For the land ownership variable, farmers who used only their land were taken as reference. There was an inverse relationship between those who owned property and those who did not. However, this relationship was not statistically significant (p > 10%). In another study conducted in Uganda, it was determined that land ownership type was an effective factor for WTP for sustainable agricultural activities for sustainable income [33].
The average annual agricultural income of each participant was calculated as 110,543 TL ($ 19,476). An annual income of 25 thousand TL and below was taken as the reference for the income variable. There was a statistically significant relationship in the group of an annual income of over 100 thousand TL at a significance level of p < 10%. As the level of income rose, there was an increased likelihood of individuals willing to pay more to sustain the same level of income [61]. In a study conducted in Iran, farmers’ income was identified as the most important factor affecting WTP for sustainable agriculture and to reduce flood risk due to climate for a safe income [63]. In other studies, it was determined that income was an effective factor for WTP for sustainable agricultural environment and activities for sustainable income [24,25,33].
On average, 0.85 person of each household worked outside agriculture. The average annual income of participants from non-agricultural sources was calculated as 4584 TL. Those who have non-agricultural income was taken as the reference group. There was a statistically significant relationship, with the level of p < 5%. A study conducted in Kenya found that non-agricultural income has a positive effect on farmers’ access to sustainable irrigation for more income [64].
Membership of agricultural cooperatives was taken as the reference group in the membership variable. There was a statistically significant relationship with the level of p < 5%. Membership of a cooperative protects a farmer safe, with regard to income, and gives the farmer a sense of solidarity. In Şanlıurfa, the sense of belonging that comes with membership of agricultural cooperatives is evident among farmers [65]. Member farmers enjoy some privileges but non-members do not, which may come as input supply, marketing, etc. In this sense, the result is consistent. In a study conducted in northern Italy, it was determined that the membership by farmers of farmer organizations was an effective factor for the production of sustainable olive oil [66].
Farmers who practiced mixed cropping (cotton, wheat, corn, barley, etc.) were taken as the reference group in the crop type variable. No statistically significant relationship was detected on any other subgroup in the crop type variable (p > 10%). In another study conducted in West Java, Indonesia, the expectation based on product pattern was found to be an influential factor affecting WTP for sustainable agricultural production [28]. In studies conducted in Oklahoma, USA; Tanzania; and Uganda, it has been found that crop and seed varieties are effective factors affecting WTP for sustainable agricultural activities for sustainable income [21,22,33].
Table 4 shows the relationship between the factors that affected the payment level of the variables used in the model and their subgroups. All other sub-groups in the age variable showed more WTP with respect to the reference group. However, there was no statistically significant relationship at any subgroup (p > 10%). In the education variable, all other sub-groups showed more WTP with respect to the reference group. There was a statistically significant relationship in all of the subgroups, middle school, high school, and university graduates, and the significance level was determined as p < 5% for middle and high school graduates and p < 10% for university graduates. In the experience variable, those with 11–20 years of farming experience showed more WTP with respect to the reference group. On the other hand, those with between 21 and 30 years’ and above 30 years’ experience showed less WTP with respect to the reference group. No statistically significant relationship was detected at any of the subgroups (p > 10%).
As the number of people in a household increased, there was less WTP with respect to the reference group. There was a statistically significant relationship at each of the subgroups of the household variable. The statistical significance was p < 5% between households of 5–9 people, and p < 1% between households with 10 and above people. Large households often mean high living expenses for families. Therefore, even if there has been a WTP for such households, the excess number of people must have been negatively affected by their payment ability.
The subgroups of the variable, the number of people in a household working in agriculture, showed more WTP with respect to the reference group. A statistically significant relationship was found on the subgroup of 5–9 people working in agriculture and the reference group, with the level of significance of p < 5%. There was a positive relationship between the number of people working in agriculture and the level of ability to pay. All subgroups in the land quantity variable showed more WTP with respect to the reference group. A statistically significant relationship was found on all sub-variables. There was a significant level of p < 10% at farmers with 5.1 to 10 ha of land. The statistical significance level at the land amount of 10.1 to 20 ha and above 20 ha was determined as p < 5%. In other words, as the acreage of land increased, the ability to pay equally increased, therefore WTP, too.
There was a statistically meaningful relationship between the two subgroups of the property variable—i.e., non-landowners and landowners—which were the reference group. This relationship was inverse and negative. The degree of significance was p < 1%, which was expected. Because those who did not own property signed seasonal partnership or tenancy agreements, this group had less income than those who owned property, and this affected their ability to pay.
Subgroups of the income variable group showed more WTP with respect to the reference group, as was expected, because as farmers’ income increased, their ability to pay increased. However, no statistically significant relationship was detected at any of the subgroups of the income variable (p > 10%). Remarkably, the WTP decreased as the income level of the farmers’ increased. This was unexpected before the research. This situation may be because the farmers felt more with increased income and tended not to think that paying more money would lead to losses. In the non-agricultural income variable, those who did not have non-agricultural income showed more WTP with respect to the reference group, where non-agricultural income was the reference group. However, a statistically significant relationship could not be detected between the two groups (p > 10%). Farmers, whose sole source of income was agriculture showed greater WTP for sustainable income.
Taking the mixed croppers (cotton, wheat, corn, and barley) as the reference group in the crop type variable, it was found that those who cultivated the only cotton and only wheat showed less WTP with respect to the reference group, unlike other mono croppers. There was a statistically significant and negative relationship at cotton-only farmers with a significance of p < 1%. This result is unexpected under normal conditions, because cotton is a product with high production and income yield and added value. Unusual climate events took place in Şanlıurfa in 2019. While the average annual precipitation of Şanlıurfa (1929–2018) is often 451 mm, the average rainfall in the first three months of the 2018–2019 production season has been over 470 mm [34]. This situation caused the late cultivation of cotton. On the other hand, the temperature in August 2019 was 21% below the average for many years. All of these reduced cotton yield and thus caused loss of income. While the long term average cotton yield in Şanlıurfa was between 5.5 and 6 tons/ha, it was between 2.5 and 3 tons/ha in 2019. Besides, although the input costs of cotton production increased by around 30% on average, cotton prices decreased by about 26% [67]. The average quantity of land used for mixed cropping, which was the reference group, was 30.01 ha, the average quantity of land used for only cotton crops was 11.56 ha, and the overall average quantity of land was 13.65 ha. Mixed crop cultivators, therefore, showed greater ability to pay due to the advantage of product pattern diversity and land size. Even how these unforeseen circumstances affected cotton yield is enough argument for the importance of sustainable income in agriculture. The results obtained, considering the reasons stated, are meaningful and consistent.
According to the calculation that was made considering account of all participants (Table 4), the WTP for service delivery for sustainable agricultural income in the GAP-Harran plains irrigation was calculated as $1.2 million by multiplying 166 thousand hectares with $7.21.

5. Conclusions

One of the problems of the socio-economic sustainability of countries is the income gap between the agricultural and non-agricultural sectors. Many studies have shown that agricultural sustainability bridges this gap and enhances individual and social welfare. Sustainable agricultural production benefits both producers and consumers. Agricultural sustainability cannot be achieved only through the most efficient use of agricultural production resources. It is necessary to educate and take responsibility of the farmers who use these resources. In other words, sustainable agriculture requires not only a technical approach, but also social, economic, and political approaches. The requirements of agricultural sustainability may differ for each community and region, because there are many combinations of local parameters, conditions, and factors that affect them. Therefore, a general and global approach to sustainable agricultural production may not give accurate and feasible results.
GAP is the flag project of the Republic of Turkey, in which agriculture is the most important sector. Many investments and projects have been made for the development of the region within the scope of GAP, but the targeted progress based on many reasons has not been achieved sufficiently. Although many types of research have been done on agricultural production and income, the expected benefits cannot be said to have been satisfactorily provided. Because there is no comprehensive field study on farmers’ sustainable agricultural income and the factors affecting it in the GAP Region. In far-reaching integrated development projects, farmer’s thoughts, expectations, and participation in the process significantly affect the level of project success.
According to the results obtained, 41.22% of the participants were not in favor of taking responsibility for cost-sharing. This result is meaningful and remarkable. Special attention should be given to this group. It should be explained to the group that waiting for the public sector to provide all services may cause delays in the provision of the expected services and thus loss of income. About 23.14% of the participants believed in the necessity of providing services to boost sustainable agricultural income, but they had not felt sufficient and income-increasing effects from the services provided so far. The provision of services based on the needs of this group would foster and increase their WTP.
The WTP for service delivery for sustainable agricultural income in the GAP-Harran plain was calculated as $1.2 million. This amount is the minimum and can be increased by several folds with a variety of accurate and acceptable service delivery based on the demands of the farmers. In this research, the general WTP of farmers for sustainable agricultural activities has been determined. The next stage of this is to determine, by local and subject-based studies, which groups of farmers are willing to pay and the factors affecting their willingness or otherwise. The results obtained from such studies, together with those of the current research, will provide useful information to guide researchers, decision-makers, and agricultural policymakers in the public and private sectors. This study is the first of its kind in the GAP Region.

Author Contributions

Conceptualization, H.P.D. and M.H.A.; Methodology, M.R.S.; Software, M.C.; Validation, H.P.D., M.R.S., and M.H.A.; Formal analysis, M.C.; Investigation, H.P.D.; Resources, M.R.S.; Data curation, M.C.; Writing—original draft preparation, M.H.A.; Writing—review and editing, H.P.D.; Visualization, M.R.S.; Supervision, M.H.A. All authors have read and agreed to the published version of the manuscript.

Funding

This research received no external funding.

Conflicts of Interest

The authors declare no conflict of interest.

References

  1. Leao, I.; Ahmed, M.; Kar, A. Jobs from Agriculture in Afghanistan; The World Bank: Washington, DC, USA, 2018; ISBN 978-1-4648-1265-1. [Google Scholar]
  2. Aydogdu, M.H. Evaluation of farmers’ willingness to pay for agricultural extension services in GAP-Harran Plain, Turkey. J. Agric. Sci. Technol. 2017, 19, 785–796. [Google Scholar]
  3. World Economic Forum. Global Risks Report 2018, 13th ed.; World Economic Forum: Geneva, The Switzerland, 2018; ISBN 978-1-944835-15-6. [Google Scholar]
  4. SKD. Sürdürülebilir Tarım: Dünya’da ve Türkiye’de Güncel Durum. Available online: http://www.skdturkiye.org/blog/surdurulebilir-tarim-dunyada-ve-turkiyede-guncel-durum (accessed on 11 January 2020).
  5. Bateman, I.J.; Day, B.H.; Georgiou, S.; Lake, I. The aggregation of environmental benefit values: Welfare measures, distance decay and total WTP. Ecol. Econ. 2006, 60, 450–460. [Google Scholar] [CrossRef] [Green Version]
  6. Sevinç, G.; Aydoğdu, M.H.; Cançelik, M.; Sevinç, M.R. Farmers’ attitudes toward public support policy for sustainable agriculture in GAP-Şanlıurfa, Turkey. Sustainability 2019, 11, 6617. [Google Scholar] [CrossRef]
  7. Abebe, S.T.; Dagnew, V.G.; Zeleke, G.Z.; Eshetu, G.Z.; Cirella, G.T. Willingness to pay for watershed management. Resources 2019, 8, 77. [Google Scholar] [CrossRef] [Green Version]
  8. Sirat, A. Organik tahıl tarımı. Yüzüncü Yıl Üniversitesi Tarım Bilimleri Dergisi 2016, 26, 455–474. [Google Scholar]
  9. Aydoğdu, M.H.; Kaya, F.; Eren, M.E.; Doğan, H. Organik ürün tüketim nedenleri üzerine bir araştırma: Şanlıurfa örneklemesi. Akademik Sosyal Araştırmalar Dergisi 2018, 6, 161–170. [Google Scholar] [CrossRef]
  10. Nicolopoulou-Stamati, P.; Maipas, S.; Kotampasi, C.; Stamatis, P.; Hens, L. Chemical pesticides and human health: The urgent need for a new concept in agriculture. Front. Public Health 2016, 4, 148. [Google Scholar] [CrossRef] [Green Version]
  11. Zhang, L.; Yan, C.; Guo, G.; Zhang, J.; Ruiz-Menjivar, J. The impact of agricultural chemical inputs on environment: Global evidence from informetrics analysis and visualization. Int. J. Low Carbon Technol. 2018, 13, 338–352. [Google Scholar] [CrossRef] [Green Version]
  12. Aydogdu, M.H.; Kaya, F. Factors affecting consumers’ consumption of organic foods: A case study in GAP-Şanlıurfa in Turkey. J. Agric. Sci. Technol. JAST 2020, 22, 347–359. [Google Scholar]
  13. Akçaöz, H.; Özkan, B.; Kızılay, H. Antalya ilinde tarımsal üretimde risk yönetimi ve tarım sigortası uygulamaları. Tekirdağ Ziraat Fakültesi Dergisi 2006, 3, 93–103. [Google Scholar]
  14. Sav, O.; Sayın, C. Tarımda kalma eğilimini etkileyen başlıca faktörlerin genel bir değerlendirmesi. Kahramanmaraş Sütçü İmam Üniversitesi Tarım Ve Doğa Dergisi 2018, 21, 190–197. [Google Scholar] [CrossRef] [Green Version]
  15. Davran, M.K.; Sevinç, M.R.; Cançelik, M. Şanlıurfa ili köylerinde yaşlıların demografik ve sosyo-ekonomik durumları ile yoksulluk ve yaşlılık algıları. Elektronik Sosyal Bilimler Dergisi 2020, 19, 1–17. [Google Scholar] [CrossRef] [Green Version]
  16. Sevinç, G.; Davran, M.K.; Sevinç, M.R. Türkiye’de kırda kente göç ve göçün aile üzerindeki etkileri. İktisadi İdari Ve Siyasal Araştırmalar Dergisi 2018, 3, 70–82. [Google Scholar] [CrossRef]
  17. Kalkınma Bakanlığı. Onuncu Kalkınma Planı (2014–2018). Gıda Ürünleri ve Güvenilirliği, Özel İhtisas Komisyon Raporu-2023, 1st ed.; Kalkınma Bakanlığı Yayın No 2867; ÖİK: Ankara, Turkey, 2014; ISBN 978-605-4667-63-5. [Google Scholar]
  18. GTHB. 2018 Yılı Performans Programı, Stratejik Plan 2018–2022. Eğitim Yayım ve Yayınlar Dairesi Başkanlığı. Available online: https://www.tarimorman.gov.tr/SGB/Belgeler/Performans%20Programlar%C4%B1/2018%20Performans%20Program%C4%B1.pdf (accessed on 15 March 2020).
  19. Aydoğdu, M.H.; Altun, M. Mısır ekimi yapan çiftçilerin tarımsal yayım ve danışmanlık hizmetleri için ödemeye yönelik tutumları: Şanlıurfa örneklemesi. Al Farabi Uluslararası Sosyal Bilimler Dergisi 2019, 3, 109–115. [Google Scholar]
  20. Deutz, P. Producer responsibility in a sustainable development context: Ecological modernisation or industrial ecology? Geogr. J. 2009, 175, 274–285. [Google Scholar] [CrossRef]
  21. Vitale, J.; Adam, B.; Vitale, P. Economics of wheat breeding strategies: Focusing on Oklahoma hard red winter wheat. Agronomy 2020, 10, 238. [Google Scholar] [CrossRef] [Green Version]
  22. Shee, A.; Azzarri, C.; Haile, B. Farmers’ willingness to pay for improved agricultural technologies: Evidence from a field experiment in Tanzania. Sustainability 2020, 12, 216. [Google Scholar] [CrossRef] [Green Version]
  23. Yang, X.; Zhang, A.; Zhang, F. Farmers’ heterogeneous willingness to pay for farmland non-market goods and services on the basis of a mixed logit model-A case study of Wuhan, China. Int. J. Environ. Res. Public Health 2019, 16, 3876. [Google Scholar] [CrossRef] [Green Version]
  24. Aydogdu, M.H. Farmers’ attitudes to the pricing of natural resources for sustainability: GAP-Şanlıurfa sampling of Turkey. Water 2019, 11, 1772. [Google Scholar] [CrossRef] [Green Version]
  25. Ning, J.; Jin, J.; Kuang, F.; Wan, X.; Zhang, C.; Guan, T. The valuation of grassland ecosystem services in Inner Mongolia of China and its spatial differences. Sustainability 2019, 17, 7117. [Google Scholar] [CrossRef] [Green Version]
  26. Jiang, X.; Liu, Y.; Zhao, R. A framework for ecological compensation assessment: A case study in the Upper Hun River Basin, Northeast China. Sustainability 2019, 11, 1205. [Google Scholar] [CrossRef] [Green Version]
  27. Lin, H.-I.; Liou, J.-L.; Hsu, S.-H. Economic valuation of public meteorological information services-A case study of agricultural producers in Taiwan. Atmosphere 2019, 10, 753. [Google Scholar] [CrossRef] [Green Version]
  28. Mutaqin, D.J.; Usami, K. Smallholder farmers’ willingness to pay for agricultural production cost insurance in rural West Java, Indonesia: A contingent valuation method (CVM) approach. Risks 2019, 7, 69. [Google Scholar] [CrossRef] [Green Version]
  29. Lazaridou, D.; Michailidis, A.; Mattas, K. Evaluating the willingness to pay for using recycled water for irrigation. Sustainability 2019, 11, 5220. [Google Scholar] [CrossRef] [Green Version]
  30. Yi, S. Contingent valuation of sustainable integrated agriculture-aquaculture products: The case of rice-fish farming systems in South Korea. Agronomy 2019, 9, 601. [Google Scholar] [CrossRef] [Green Version]
  31. Yi, S. Willingness-to-pay for sustainable aquaculture products: Evidence from Korean red seabream aquaculture. Sustainability 2019, 11, 1577. [Google Scholar] [CrossRef] [Green Version]
  32. Xiong, K.; Kong, F.; Zhang, N.; Lei, N.; Sun, C. Analysis of the factors influencing willingness to pay and payout level for ecological environment improvement of the Ganjiang River Basin. Sustainability 2018, 10, 2149. [Google Scholar] [CrossRef] [Green Version]
  33. Ulimwengu, J.; Sanyal, P. Joint Estimation of Farmers’ Stated Willingness to Pay for Agricultural Services. Available online: https://core.ac.uk/download/pdf/6237697.pdf (accessed on 18 March 2020).
  34. TSMS. Climate Data of Şanlıurfa Province, Turkish State Meteorological Service. Available online: https://mgm.gov.tr/veridegerlendirme/il-ve-ilceler-istatistik.aspx?k=A&m=SANLIURFA (accessed on 12 March 2020).
  35. Aydogdu, M.H.; Yenigün, K. Willingness to pay for sustainable water usage in Harran Plain-GAP Region, Turkey. Appl. Ecol. Environ. Res. 2016, 14, 147–160. [Google Scholar] [CrossRef]
  36. GAP Regional Development Administration. What’s GAP? Available online: http://www.gap.gov.tr/en/ (accessed on 18 March 2020).
  37. Aydogdu, M.; Aydogdu, M.H.; Çullu, M.A. The determination of the cotton productivity and losses under the effect of salinity by using geographical information system (GIS) and remote sensing (RS) GAP region, Akçakale sampling, Turkey. J. Acad. Soc. Sci. Stud. 2014, 24, 617–630. [Google Scholar] [CrossRef]
  38. Aydoğdu, M.; Aydoğdu, M.H.; Çullu, M.A. Farklı tuz seviyelerindeki toprakların pamuk verimine etkisinin belirlenmesi ve uydu verileriyle ilişkilendirilmesi (Şanlıurfa, Harran Ovası; İmambakır Sulama Birliği). Turk. Stud. 2014, 9, 231–250. [Google Scholar] [CrossRef]
  39. Bayram, N. Sosyal Bilimlerde SPSS Ile Veri Analizi, 5th ed.; Ezgi Litabevi: Bursa, Turkey, 2015; ISBN 9758606436. [Google Scholar]
  40. Fisunoğlu, H.M.; Şengül, S. Adana kentsel alanda hane halkı tüketimi. Çukurova Üniversitesi Sosyal Bilimler Enstitüsü Dergisi 2011, 20, 251–266. [Google Scholar]
  41. Bushway, S.; Johnson, B.D.; Slocum, L.A. Is the magic still there? The use of the Heckman two-step correction for selection bias in criminology. J. Quant. Criminol. 2007, 23, 151–178. [Google Scholar] [CrossRef]
  42. Winship, C.; Mare, R.D. Models for sample selection Bias. Annu. Rev. Sociol. 1992, 18, 327–350. [Google Scholar] [CrossRef]
  43. Heckman, J. Sample selection bias as a specification error. Econometrica 1979, 47, 153–161. [Google Scholar] [CrossRef]
  44. Nawata, K. Estimation of sample selection bias models by the maximum likelihood estimator and Heckman’s Two-Step Estimator. Econ. Lett. 1994, 45, 33–40. [Google Scholar] [CrossRef]
  45. Xiong, K.; Zhang, N.; Kung, C.-C.; Kong, F. Determinants of residents’ willingness to accept and their levels for ecological conservation in Ganjiang River Basin, China: An empirical analysis of survey data for 677 households. Sustainability 2019, 11, 6138. [Google Scholar] [CrossRef] [Green Version]
  46. Kyaw, N.N.; Ahn, S.; Lee, S.H. Analysis of the factors influencing market participation among smallholder rice farmers in Magway Region, central dry zone of Myanmar. Sustainability 2018, 10, 4441. [Google Scholar] [CrossRef] [Green Version]
  47. Heckman, J. The common structure of statistical models of truncation, sample selection and limited dependent variables and a simple estimator for such models. Ann. Econ. Soc. Meas. 1976, 5, 475–492. [Google Scholar]
  48. Amemiya, T. Advanced Econometrics, 8th ed.; Harvard University Press: Cambridge, MA, USA, 1985; ISBN 0-674-00560-0. [Google Scholar]
  49. Newey, W.K.; Powell, J.L.; Walker, J.R. Semiparametric estimation of selection models: Some empirical results. Am. Econ. Rev. 1990, 80, 324–328. [Google Scholar]
  50. Puhani, P. The Heckman correction for sample selection and its critique. J. Econ. Surv. 2000, 14, 53–68. [Google Scholar] [CrossRef]
  51. Lee, L.-F. Self-Selection. In A Companion to Theoretical Econometrics; John Wiley & Sons, Ltd.: Oxford, UK, 2007; pp. 383–409. ISBN 978-0-470-99624-9. [Google Scholar]
  52. Cameron, C.A.; Trivedi, P.K. Sequential Two-Step M-Estimation. Microeconometrics: Methods and Applications, 1st ed.; Cambridge University Press: New York, NY, USA, 2005; ISBN 0-521-84805-9. [Google Scholar]
  53. Toomet, O.; Henningsen, A. Sample selection models in R: Package sample selection. J. Stat. Softw. 2008, 27, 1–23. [Google Scholar] [CrossRef] [Green Version]
  54. Cameron, C.A.; Trivedi, P.K. Microeconometrics Using Stata, 2nd ed.; Stata Press: College Station, TX, USA, 2010; ISBN 978-1-59718-073-3. [Google Scholar]
  55. Sevinç, M.R.; Davran, M.K.; Sevinç, G. Osmanlı İmparatorluğu’ndan günümüze kırsal alanda uygulanan eğitim politikaları. Elektronik Sosyal Bilimler Dergisi 2016, 15, 253–272. [Google Scholar] [CrossRef] [Green Version]
  56. Türkdoğan, O. Osmanlıdan Günümüze Türk Toplum Yapısı, 5th ed.; Çamlıca Yayınları: İstanbul, Turkey, 2008. [Google Scholar]
  57. Küçük, N.; Aydogdu, M.H. Türkiye’de pamuk üretiminin son dönemlerdeki genel analizi. Eur. J. Math. Eng. Nat. Med. Sci. 2020, 8, 77–82. [Google Scholar]
  58. Küçük, N.; Issı, S. Pamuk üretiminin stratejik önemi üzerine genel bir değerlendirme. TURAN-CSR: TURAN Cent. Strateg. Res. 2019, 11, 391–397. [Google Scholar]
  59. TEPGE. Tarım Ürünleri Piyasası Pamuk. Available online: https://arastirma.tarimorman.gov.tr/tepge/Belgeler/PDF%20Tar%C4%B1m%20%C3%9Cr%C3%BCnleri%20Piyasalar%C4%B1/2019-Temmuz%20Tar%C4%B1m%20%C3%9Cr%C3%BCnleri%20Raporu/2019-Temmuz%20Pamuk.pdf (accessed on 14 March 2020).
  60. Anonymous. 2019 Yılı Ortalama Dolar Kuru. Available online: https://paracevirici.com/doviz-arsiv/merkez-bankasi/gecmis-tarihli-doviz/2019/amerikan-dolari (accessed on 13 March 2020).
  61. Değirmenci, Y.; Manyaz, İ.; Güzelaydın, İ.; Erkuş, E.; Koçak, E.; Arı, B. Tarımsal Yayım ve Danışmanlık; T.C. Gıda Tarım ve Hayvancılık Bakanlığı, Eğitim Yayım ve Yayınlar Dairesi Başkanlığı: Ankara, Turkey, 2012. [Google Scholar]
  62. Burch, C.; Busch, M.; Higgins, E.; Bittner, S.; Perera, N.; Neal, K.; Burkett, L.; Castro, A.J.; Anderson, C. Revisiting a water conflict in Southeastern Oklahoma 6 Years Later: A new valuation of the willingness to pay for ecosystem services. Sustainability 2020, 12, 819. [Google Scholar] [CrossRef] [Green Version]
  63. Maghsood, F.F.; Moradi, H.; Berndtsson, R.; Panahi, M.; Daneshi, A.; Hashemi, H.; Bavani, A.R.M. Social acceptability of flood management strategies under climate change using contingent valuation method (CVM). Sustainability 2019, 11, 5053. [Google Scholar] [CrossRef] [Green Version]
  64. Omondi, S.O.; Mbogoh, S.G.; Munei, K. An evaluatıon of the factors influencıng farmers’ willingness to pay (WTP) for irrigation water: The case of ahero irrigation scheme in Kenya. Int. J. Sci. Environ. Technol. 2014, 3, 1778–1789. [Google Scholar]
  65. Cançelik, M.; Aydogdu, M.H.; Sevinç, M.R. A research on the activities and problems of agro-based producers and breeder associations in Sanliurfa, Turkey. IOSR J. Bus. Manag. 2020, 22, 15–23. [Google Scholar] [CrossRef]
  66. Menozzi, D. Extra-virgin olive oil production sustainability in northern Italy: A preliminary study. Br. Food J. 2014, 116, 1942–1959. [Google Scholar] [CrossRef]
  67. Progenseed. 2019 Yılında Pamuk Verimlerinde Görülen Düşüş Ve Destekleme Primiyle İlgili Görüş. Available online: https://www.progenseed.com/images/upload/8385_4486.pdf (accessed on 11 March 2020).
Figure 1. Turkey, GAP, and Şanlıurfa.
Agriculture 10 00152 g001
Figure 2. Şanlıurfa and Harran Plain: (a) the places of Şanlıurfa and Harran Plain in Turkey; (b) irrigated area of the Harran Plain (Source: Prof. Dr. Mehmet Ali Çullu, Harran University).
Agriculture 10 00152 g002
Table 1. Descriptive statistics of the participants.
VariableDefinitionMeanStd. Dev
AgeIf the age of the farmer; between 18–30 is 1 (6.6%), if between 31–40 is 2 (27.17%), if between 41–50 is 3 (31.4%), if between 51–60 is 4 (21.11%), 61 and over is 5 (13.72%).3.0821.1367
EducationIf the farmer is literate 1 (13.72%), primary school graduate 2 (47.76%), middle school graduate 3 (15.57%), high school graduate 4 (13.98%), university graduate 5 (8.97%).2.5671.1581
ExperienceIf the farmer’s experience is 1 (16.62%) for 1–10 years, 2 (31.93%) for 11–20 years, 3 (25.33%) for 21–30 years, 4 (26.12%) for 31 years and over.2.6101.0467
Household numberThe number of households of the farmer is 1 (15.3%), if, between 1–4, 2 (53.3%) if between 5–9, and 3 (31.4%) if 10 and over.2.1610.6651
Number of household working in agricultureThe number of households working in agriculture is 1 (69.69%), if, between 1–4, 2 (26.39%) if between 5–9, and 3 (12.92%) if 10 and over.1.5220.7137
Land AmountIf the amount of land cultivated by the farmer is 5 ha and less is 1 (23.75%), between 5.1–10 ha is 2 (26.65%), 10.1–20 ha is 3 (23.48%), 20.1 ha and over is 4 (26.12%).2.5201.1118
Property TypeIf the farmer’s cultivated land is his own property 1 (58.58%) and if the tenant and/or partnership is 0 (41.42%).0.5860.4932
IncomeIf the agricultural annual net income of the farmer; 25,000 TL and less is 1 (22.96%), if between 25,001–50,000 TL is 2 (21.11%), if between 50,001–100,000 TL is 3 (25.33%), and if 100,001 and over is 4 (30.6%).2.6361.1429
Non-agricultural incomeIf the farmer has non-agricultural income is 1 (12.93%), if not is 0 (87.07%).0.1290.3359
Membership of agricultural cooperativesIf the farmer has a membership of any agricultural cooperative is 1 (22.69%), if there is no membership is 0 (77.31%).0.2270.4194
Crop patternIf the farmer only cultivates cotton is 1 (51.98%), if only wheat is 2 (5.8%), if mixed crop (cotton, wheat, corn, and barley) is 3 (42.22%).1.9020.9669
Table 2. Results of the participants’ WTP for services to generate sustainable agricultural income.
WTP for ServicesRatio (%)Annual Average Agricultural Income (TL/ha)Annual Average Agricultural Income ($/ha)Average WTP
(TL/ha)
Average WTP ($/ha)
Those who do not accept41.225552.81978.29
In favor of—accepted22.615875.231035.09180.8231.86
Conditionally in favor of WTP23.145498.87968.78
Have enough knowledge—not accepted13.035706.761005.41
Average value 5668.87998.7440.97.21
Table 3. Heckman’s first-stage model (Probit model/selection model) estimation results.
VariableSub-GroupsCoef.Std. Err.Zp > |z|
Age (year)31–400.5720.4471.280.201
41–500.927 b0.4572.030.043
51–600.7060.4861.450.147
61 and over0.6510.5231.250.213
Education (level)Primary School0.0970.2560.380.704
Secondary School0.1660.3120.530.593
High School0.541 c0.3150.710.087
University0.774 b0.3652.120.034
Experience (year)Between 11–200.3190.2641.210.228
Between 21–300.1590.2960.540.591
31 and above0.1550.3120.500.619
Household (person)Between 5–90.0150.2450.060.951
10 and above0.0590.3010.200.843
Working in agriculture (person)Between 5–90.331 c0.1961.680.093
10 and above−0.1520.306−0.500.619
Land amount (hectare)Between 5.1–10.00.700 b0.2882.430.015
Between 10.1–20.00.804 a0.3072.620.009
20.1 and above0.643 b0.3172.030.043
Land ownership typeNot own property−0.1790.157−1.140.255
Income (TL)Between 25,001–50,0000.4260.2821.510.131
Between 50,001–100,0000.3360.2781.210.226
100,001 and above0.510 c0.2891.760.078
Non-agricultural incomeNo0.557 b0.2362.360.018
Agricultural cooperative membershipNo0.434 b0.1822.380.017
Crop typeCotton0.0120.1860.070.946
Wheat−0.5930.373−1.590.112
Constant −2.844 a0.588−4.830.000
LR chi-square = 80.71Prob > chi-square = 0.000Pseudo R2 = 0.180
The reference groups of variables: those between “18 and 30” for age, “literate” for education, “1–10” for experience, “1–4” for households, “1–4” for agricultural workers, “5 ha and less” for land amount, “property owner” for land ownership type, “25,000 and under” for income, “yes” for non-agricultural income, “yes” for agricultural cooperative membership, “mixed” for crop type are taken as a basic level for the reference group.
a,b,c Orderly indicates the degree of the statistical significance level of 0.01, 0.05, and 0.10.
Table 4. Heckman’s second-stage model (OLS model/payment model) estimation results.
VariableSub-GroupsCoef.Std. Err.Zp > |z|
Age (year)31–4014.17518.1310.780.434
41–5026.72019.7701.350.177
51–6024.93319.8811.250.210
61 and above30.47720.1851.510.131
Education (level)Primary School8.4317.9621.060.290
Secondary School23.542 b9.5002.480.013
High School28.966 b11.7122.470.013
University24.880 c14.2031.750.080
Experience (year)Between 11–202.86210.3740.280.783
Between 21–30−5.22410.638−0.490.623
31 and above−2.14310.525−0.200.839
Household (person)Between 5–9−13.059 c7.240−1.800.071
10 and above−22.759 a8.431−2.700.007
Working in agriculture (person)Between 5–916.725 b7.0822.360.018
10 and above13.4359.5301.410.159
Land amount (hectare)Between 5.1–10.025.328 c15.3791.650.099
Between 10.1–20.043.469 b17.1182.540.011
20.1 and above37.729 b15.6872.410.016
Land ownership typeNot own property−14.224 a5.211−2.730.006
Income (TL)Between 25,001–50,00016.86510.8361.560.120
Between 50,001–100,0004.21810.8680.390.698
100,001 and above3.20611.9150.270.788
Non-agricultural incomeNo10.9929.2861.180.237
Crop typeCotton−16.153 a4.996−3.230.001
Wheat−18.92313.710−1.380.168
Constant −54.34558.283−0.930.351
lambda 22.78318.1781.250.210
rho 0.880
sigma 25.887
Number of obs = 379 Censored obs = 274 Uncensored obs = 105 Wald chi2(25) = 64.14 Prob > chi2 = 0.000
a,b,c Orderly indicates the degree of the statistical significance level of 0.01, 0.05, and 0.10.

