Article

Enteric Methane Emissions of Dairy Cattle Considering Breed Composition, Pasture Management, Housing Conditions and Feeding Characteristics along a Rural-Urban Gradient in a Rising Megacity

1
Institute of Animal Breeding and Genetics, Justus Liebig University Giessen, Ludwigstraße 21 b, 35390 Gießen, Germany
2
Group Animal Husbandry in the Tropics and Subtropics, University of Kassel, Steinstrasse 19, 37213 Witzenhausen and Georg-August-University Göttingen, Albrecht-Thaer-Weg 3, 37075 Göttingen, Germany
3
National Institute of Animal Nutrition and Physiology (NIANP), Hosur Rd, Chennakeshava Nagar, Adugodi, Bengaluru, Karnataka 560030, India
*
Author to whom correspondence should be addressed.
Agriculture 2020, 10(12), 628; https://doi.org/10.3390/agriculture10120628
Submission received: 23 September 2020 / Revised: 2 December 2020 / Accepted: 11 December 2020 / Published: 13 December 2020

Abstract

:
Greenhouse gas emissions from livestock farming and in particular enteric methane (CH4) from ruminants are criticized for being one of the main contributors to climate change. Different breeding, feeding and management strategies are tested to decrease these emissions, but a status quo analysis is also relevant to implement such measures. The present study aimed to analyze the concentration of CH4 in air exhaled by dairy cows along a rural-urban gradient of Bangalore, India. Urban, mixed and rural areas were defined based on a survey stratification index (SSI) comprising build-up density and distance to the city center. Using a laser methane detector (LMD), CH4 concentration was determined in 2-min spot measurements of exhaled air of 448 cows at three equally spaced visits between June 2017 and April 2018. Mean, maximum and CH4 concentration per duration of the overall measurement, eructation and respiration bouts were calculated. For the overall mean and respiration bouts, CH4 concentration was higher in cows from urban areas, which had also higher milk yield than cows from mixed and rural areas. Although no differences were found in terms of the intake level of fibrous diet components, the type of measurement location (indoor, half-outdoor or outdoor) and pasture access had an impact on CH4 concentration. To our knowledge, this is the first study using the LMD on-farm and in an urbanizing environment. The LMD measurements show variations in enteric CH4 emissions along the rural-urban gradient of Bangalore that reflect differences in dairy husbandry systems governed by the social-ecological context.

1. Introduction

In the past 30 years, world milk production has increased by more than 52% from 542 million tons in 1990 to 828 million tons in 2017. In the same period, India has tripled its milk production from 54 to 176 million tons, becoming the world’s largest milk producer with 21% of the global production [1]. With more than 78 million dairy farms [2] that are mostly smallholdings with two to six cows [3], India hosts 18% of the global dairy cattle population [1]. Moreover, urbanization in India has increased rapidly and the share of urban population has doubled in the past 60 years [4]. Urban and (peri-)urban agriculture have contributed to food security and covered the demand for food products in these areas, e.g., with regard to milk consumption, by keeping dairy cattle close to urban areas [5].
As a detrimental by-product, the livestock farming sector contributes 14.5% to the global greenhouse gas (GHG) emissions [6], whereby enteric methane (CH4) emitted by ruminant livestock is the largest source (17%) of global anthropogenic CH4 emissions [7]. GHG emissions are expected to increase by 35% until 2050, especially in developing countries due to animal population growth driven by increased demands of meat and dairy products [8].
Several techniques have been developed to measure enteric CH4 emissions from ruminants. Among them, the respiration chamber is considered the reference method although it is neither portable nor suitable for recording a large number of animals [9]. Under practical farming conditions, the Sulphur hexafluoride (SF6) tracer technique [10] has a high accuracy. Nevertheless, both CH4 recording techniques are expensive and can interfere with animal behavior [9,11]. Sniffer methods like GreenFeed (C-Lock Inc., Rapid City, SD, USA) are portable and labor extensive, but require a certain extent of animal training [11]. The laser methane detector (LMD) technique was first suggested by Chagunda et al. [12] for large-scale trait recording in the field. Since then, several studies applied the methodology in ruminants [13,14,15,16]. Even though concerns exist in view of the repeatability and accuracy of the measurements [11,17], due to its portability, low cost, ease of handling, non-invasiveness and non-interference with animal behavior, the LMD is currently the most flexible and simple method for on-farm determination of enteric CH4 emissions.
The predictions of CH4 emission from ruminant livestock traits is another option to calculate GHG emissions. Ricci et al. [18] proposed a multiple equation approach including energy intake, physiological stage and the diet type to improve the precision of CH4 predictions. Based on feeding characteristics and cow conformation traits, Yin et al. [19] predicted test-day methane emission via deterministic equations from cattle nutrition combined with stochastic simulations. Amount and quality of feed intake have a direct impact on enteric CH4 emission [20]. The recorded CH4 emission is also affected by the length of the time interval between cattle feeding and LMD recording [15,21]. Feed intake is associated with farm management practices and affected by environmental components. For example, season, ambient temperature and rainfall influence forage quality and possible access to pasture, and there is evidence that pasture-based dairy farming systems and confinement systems differ in enteric CH4 output [22]. Heat stress may be higher when animals graze on pasture than when staying in the barn and this affects feed intake [23] as well as animal health [24]. Furthermore, Garnsworthy et al. [25] observed variations in CH4 emissions depending on body weight (BW) and milk yield (MY) of dairy cows, whereby emissions were higher for cows with higher BW and MY. Although these effects are partly mediated by feed intake and feed composition, the higher metabolic rate of a heavier animal and/or an animal synthesizing more milk may also play a role [26]. Thus, enteric CH4 emission is the result of a variety of partly coupled physiological, environmental and managerial factors (Figure 1). In the urbanizing Indian context, an important element that integrates both environmental and social aspects is farm location within a rural-urban interface [27]. The spatial location of a farm not only governs its physical access to resources such as pasture, but also plays a role concerning breed type kept, herd structure, housing space and housing structure [27]. These factors in turn shape the livestock management, and as a further consequence they influence productivity as well as CH4 emissions.
The combination of social and environmental components within a so-called social-ecological system has recently been proposed for livestock farming systems’ classification [28]. Rising megacities are hotspots of complex and dynamic social-ecological systems, because they are very vulnerable to environmental and anthropogenic hazards, and their social-economic components are more diverse than those of smaller urban areas [29]. In consequence, the aim of the present study was an assessment of the social-ecological responsiveness of enteric CH4 emissions along a rural to urban gradient, choosing the Indian megacity of Bangalore with its challenging environmental conditions, social complexity and large (peri-)urban dairy production [5] as the research site.

2. Materials and Methods

2.1. Farm Selection and Description

The study was conducted in Bangalore, southern India, where the population has doubled in the past 15 years and is expected to grow to over 12 million inhabitants by 2021 [30]. Dairy farms were sampled from 31 different villages located along a northern and southern transect in Bangalore (Figure 2). In order to study the influence of ecological gradients in combination with human-animal interaction, a survey stratification index (SSI) was developed by Hoffmann et al. [31] for each geographical location within the mapped area. The SSI (between 0 and 1) considered the built-up density (houses and infrastructures) and the distance to the city center. In the current study, the SSI considered three SSI clusters: “urban” (SSI < 0.3), “rural” (SSI > 0.5), and “mixed” (SSI: 0.3–0.5). A two-step approach was applied to select the 119 dairy farms. In a first step, villages were selected semi-randomly, considering pre-defined percentages per SSI. In a second step, 20 to 30% of dairy cow herds were randomly selected per village (300 herds), based on the latest vaccination list for foot-and-mouth disease. To ensure continued, though minimal, participation in milk production, only dairy cow herds with two or more dairy cows were sampled. The original 300 dairy cow herds were reduced to 119 herds after being clustered into four groups based on coordinates for herd location, feeding strategies and predominant herd genotypes [27,32]. Each farm was visited three times between June 2017 and April 2018 in intervals of four months, resulting in 835 individual measurements at cow-level from 448 milking cows. The average herd size comprised 3 milking cows and ranged from 2 to 12 cows per farm.
Temperature and humidity were recorded at every farm visit using a portable weather station (HAMA 87,682 LCD THERMO-/HYGROM. TH-200). The average temperature during the visits was 26.7 °C, ranging from 15.2 to 35.9 °C. Humidity on the farms ranged from 20 to 88%, with an average of 54.7% across farms and visits. The temperature-humidity index (THI) per farm and visit was calculated considering temperature (T) and relative humidity (RH) and applying the NRC [33] formula:
THI   =   ( 1.8 × T + 32 ) ( 0.55 0.0055 × RH % ) × ( 1.8 × T 26 )
In Bangalore, access of cattle to pasture depended on farm location and varied with season, farmer’s management strategy and health status of the cow. In this regard, at every visit, the pasture access (Past: yes, no) was recorded for each animal. Percentages of measurements with access to pasture in the three SSI clusters are listed in Table 1. None of the farms had ad libitum access to water, however, they offered water at milking time (15 L approx. twice a day) along with the concentrates.

2.2. Cattle Production and Conformation Traits

Milk yield (MY), heart girth (HG) and body condition score (BCS) were recorded for all cows. BCS was subjectively scored on a linear scale ranging from 1 (thin) to 5 (fat) in increments of 0.25 [34]. Out of 448 cows, 285 were exotic breeds (Holstein Friesian and Jersey), 13 were native breeds (Zebu cattle, mainly of the breed Hallikar) and 150 were first and multigenerational crossbreeds (exotic × native). Due to significant correlations between CH4 and BW in previous studies [25], BW of cows at recording was predicted based on the conformation traits HG, BCS, age, breed and pregnancy status. according to the following equation [35]:
BW   =   exp ( 7.35492 + ( 2.55408 × ln ( HG ) ) + ( 0.04043 × ln ( age ) ) + ( ß 1 × BCS ) + ( ß 2 × breed ) + ( 0.024741 × pregnant ) + 0.08317 )
where HG = heart girth measured in cm; age = age at measurement (in month); ß1 = linear regression coefficient for BCS; BCS = body condition score; ß2 = regression coefficient for breed; breed = exotic, native or crossbreed; pregnant = 1 (pregnant) or 0 (non-pregnant).
The average lactation number was 2.9 and the maximum lactation number was 12. On average, daily MY, BCS, and BW from the 835 measurements were 10.67 L, 2.65 points, and 383.29 kg, respectively. Average daily MY and BW in the three clusters are displayed in Table 1.

2.3. Methane Spot Measurements

The CH4 concentration in the exhaled air per cow was measured using the LMD, model Laser Methane mini [36] considering windless environmental conditions, so that wind did not disturb the CH4 measurements. The measurement location (Loc) was classified into outdoor, indoor and half-outdoor according to the type of shed, in which CH4 emissions from individual cows were measured: the indoor class depicted a closed room with four walls and a roof, with or without ventilation (Figure 3a); The outdoor class was assigned when cattle were kept on an open field or in a shed without walls (Figure 3c); Half-outdoor was in-between the outdoor and the indoor classification, e.g., a shed with only two walls where air could freely circulate (Figure 3b). Percentage of measurements per measurement location for each SSI cluster in shown in Table 1.
The LMD was programmed to record the CH4 concentration in narrow intervals of 0.1 s. To capture the exhaled air, the green laser guide light from the LMD was pointed at the animal’s nostrils for 2 min, implying a single dataset per measurement including 1200 CH4 concentration values. Measurements were taken once per cow and visit, by milking time and at least 2 h after feeding. Thus, the mean time interval from cow feeding to the CH4 recording was 3.85 h with a standard deviation of 3.56 h. The LMD automatically identified and recorded errors in the reflectance of the (invisible) laser beam occurring at any 0.1 s. These erroneous values were manually deleted from the data set upon processing. The recorded unit for CH4 concentration was ppm x meter, but since the distance between the nostrils of the animal and LMD was exactly 1 m, all values were expressed in ppm. A distance range laser was used to ensure the 1 m distance between the nostrils and the LMD.
In a first step, all CH4 measurements were corrected for the background environmental CH4 at the measurement location. The minimum CH4 concentration for each individual measurement and visit was set as environmental CH4, which was subtracted from all other values of the respective data set. Afterwards, the corrected measurements were categorized into mini-peaks and mini-troughs [15]. Only mini-peaks were kept for further calculations, and the remaining measurements were assumed to represent a mixture of two normal distributions with different means and variances, which correspond to two physiological paths of CH4 emissions in ruminants, i.e., respiration and eructation of CH4 [37,38]. Therefore, the CH4 concentrations were separated into lower (the one with lower mean) and upper (the one with greater mean) normal distributions according to thresholds defined at 10% cumulative probabilities of the upper normal distribution for every individual and visit [15]. The thresholds for every individual measurement were estimated based on the “mixtool” package in R [39]. Measurements lower than the thresholds were defined as respiration CH4 and the remaining measurements as eructation CH4. The average share of eructation CH4 was 77.18% and for respiration CH4 22.82% in line with previous studies [37,38]. Means (absolute values) of overall CH4 (AllMean, including respiration and eructation measures), respiration CH4 (RespMean) and eructation CH4 (ErucMean) were calculated by averaging the measurements per individual and visit according to the three definitions. Thereafter, the interval between starting and ending the LMD measurement was calculated and termed “measurement duration”. The sum of all mini-peaks for every individual and visit was further divided into the respective measurement duration to calculate overall CH4 (AllMinute, including respiration and eructation measures), respiration CH4 (RespMinute) and eructation CH4 (ErucMinute). Finally, maximum respiration CH4 (RespMax) and eructation CH4 (ErucMax) were determined for each measurement. Descriptive statistics for the eight CH4 traits are listed in Table 2.

2.4. Nutrition Monitoring Subsample

Nutritional monitoring was carried out in 27 out of the 119 selected herds, with 8 herd visits in intervals of 6 weeks during the study period as described by Reichenbach [32]. The green fodder component included tall African maize (Zea mays) and Napier’s hybrid grass (Pennisetum glaucum × P. purpureum). Urban dairy producers additionally used organic wastes (vegetable and fruit peels) for feeding their cattle. Dry forages were mostly straw of finger millet (Eleusine coracanal) and dried maize. Concentrated feed contributed to 27–28% of the daily dry matter (DM) intake. On average, the cattle stayed on pasture for 5.9 ± 2.3 h [32]. Feed type and quantitative feed intake of each individual cow in these herds were recorded. Fodder samples were analyzed for neutral detergent fiber (NDF) concentration according to Van Soest et al. [40] at the National Institute of Animal Nutrition and Physiology (NIANP) in Bangalore. Organic waste, pasture biomass, and green and dry forages had an average fiber concentration of 482, 669, 675 and 708 g NDF kg−1 DM, respectively [32]. Descriptive statistics for the eight CH4 traits as determined in the nutrition subsample are listed in Table 3.

2.5. Statistical Models

A linear mixed model implemented in R package “lme4” [41] was applied to analyze the CH4 traits. The basic statistical model was:
y ijklmno = µ + ( MY BW × 100 ) i + B j + THI k + FasT l + F m + cow n + e ijklmno
where yijklmno = logarithm transformation of the CH4 traits; µ = overall mean effect; ( MY BW × 100 ) i   = fixed effect for MY/BW ratio in liter per kg multiplied by 100; Bj = fixed effect for breeds (exotic, crossbreed and native); THIk = fixed effect for temperature-humidity index; FasTl = fixed effect for the time interval from cow feeding until the CH4 recording (in hours); Fm = random farm effect; cown = random cow effect for repeated measurements; eijklmno = random residual effect.
Following the model 1, three different variables, i.e., SSI cluster, pasture access and measurement location, were included one by one into the basic statistical model:
y ijklmnop = µ + ( MY BW × 100 ) i + B j + THI k + FasT l + TestEff m + F n + cow o + e ijklmnop  
where TestEffm = included the fixed effects SSI cluster (rural, mixed, urban), Past (yes, no) and Loc (outdoor, half-outdoor and indoor) in consecutive runs.
For the nutrition monitoring subsample, one additional variable was included as TestEffm in model 2, where TestEffm = level of NDF intake per metabolic weight (MW = BW0.75; in g NDF/kg MW) on the day of visit. Two NDF intake levels were distinguished: high (NDF ≥ 94 g/kg MW, n = 71 measurements) and low (NDF < 94 g/kg MW, n = 75 measurements).
The R package “emmeans” [42] was applied to estimate least square means (LSMeans) of levels within different effects.

3. Results

3.1. Basic Environmental Factors on CH4 Concentrations

From the basic statistical model 1, the MY/BW ratio significantly influenced AllMean (Table 4). Except for RespMinute and ErucMax, an increase in the MY/BW ratio was associated with an increased CH4 concentration. The fixed effect THI significantly influenced the eructation CH4, i.e., ErucMean, ErucMinute and ErucMax (Table 4). However, ErucMean and ErucMax decreased with THI and ErucMinute had a positive regression coefficient of 0.02. With the prolongation of the time interval from feeding to CH4 recording, AllMean, ErucMean and ErucMax decreased significantly. The fixed effect breed was not significant for the CH4 traits. However, the exotic breed had the lowest values for all CH4 traits, except for ErucMinute. The crossbreed showed highest LSMeans for ErucMean and for the respiration CH4, including RespMean, RespMax and RespMinute (Table 4).

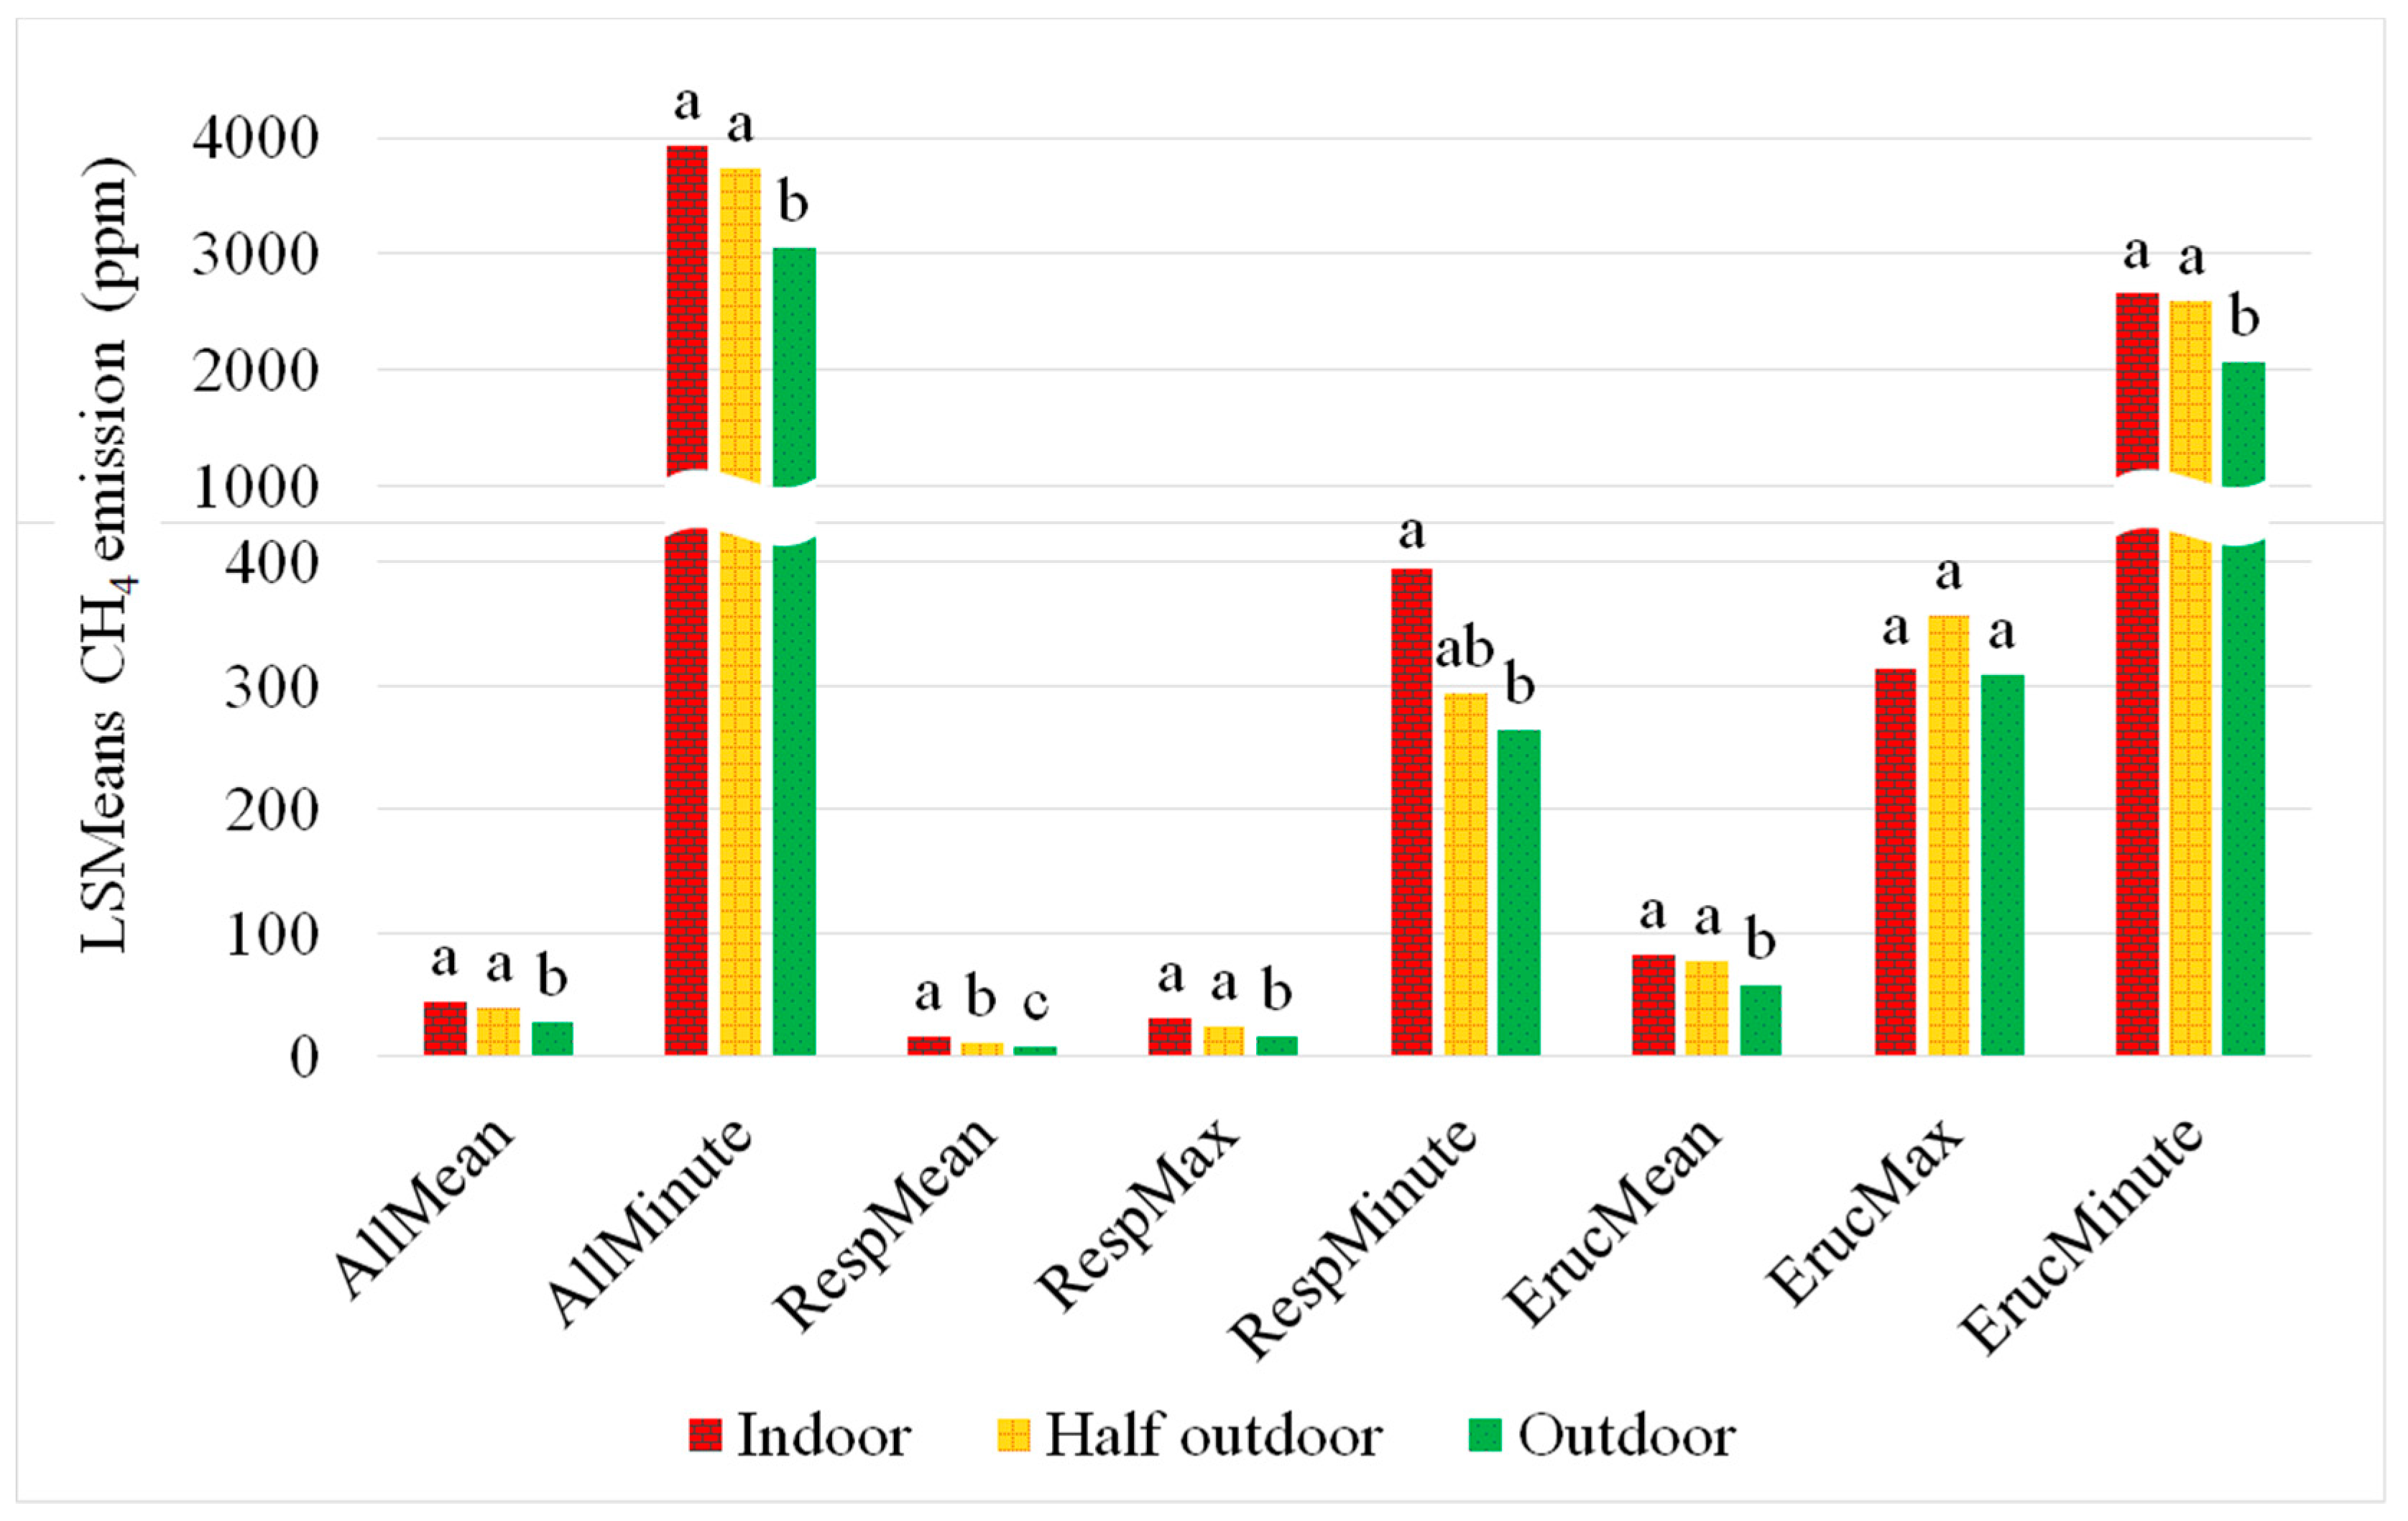
3.2. Impact of Measurement Location on CH4 Concentrations

The location at which the LMD measurement took place also had an effect on CH4 concentrations. LSMeans for AllMean, AllMinute, RespMean, RespMax, RespMinute, ErucMean and ErucMinute were significantly higher (p-value < 0.05) in the indoor class, followed by the half-outdoor and the outdoor classes (Figure 4). For ErucMax, the CH4 concentration was 356.45 ppm in half-outdoor and decreased to 313.05 ppm in indoor and to 308.78 ppm in outdoor classes. No differences were detected between locations for ErucMax. Significant differences in CH4 between indoor and outdoor classes were observed for AllMean (16.13 ppm), AllMinute (870.26 ppm/minute), RespMean (7.70 ppm), RespMax (14.19 ppm), RespMinute (131.52 ppm/min), ErucMean (25.47 ppm) and ErucMinute (587.39 ppm/min).

3.3. Impact of Access to Pasture on CH4 Concentrations

Pasture access was an important factor, because LSMeans for AllMean, AllMinute, RespMean, RespMax, RespMinute, ErucMean and ErucMinute were significantly higher (p-value < 0.05) for cows having no access to pasture (Figure 5). The differences between CH4 concentrations in cows with and without access to pasture were 6.01 ppm for AllMean, 541.26 ppm/min for AllMinute, 3.26 ppm for RespMean, 7.96 ppm for RespMax, 132.71 ppm/min for RespMinute, 19.00 ppm for ErucMean, and 55.63 ppm for ErucMax.

3.4. Impact of Fibre Intake on CH4 Concentrations

No significant impact on the CH4 traits was identified with respect to the daily NDF intake level, even though LSMeans for all CH4 traits were numerically higher at the high NDF intake level (Figure 6). The differences in CH4 concentrations between cows with high and low NDF intake level were 3.93 ppm for AllMean, 425.03 ppm/min for AllMinute, 1.40 ppm for RespMean, 4.64 ppm for RespMax, 49.84 ppm/min for RespMinute, 16.64 ppm for ErucMean, 71.34 ppm for ErucMax, and 85.22 ppm/min for ErucMinute.

3.5. Impact of SSI Cluster on CH4 Concentrations

LSMeans for AllMean, AllMinute, RespMean, RespMax, RespMinute, ErucMean and ErucMinute were highest in the urban areas, followed by the rural and the mixed areas. For ErucMax, the highest CH4 concentration was observed in the mixed areas (Figure 7). The fixed effect SSI cluster had a significant impact (p-value < 0.05) between urban and mixed areas on both AllMean and RespMean while between urban and rural areas impact was only significant on AllMean. The differences in CH4 concentrations between urban and mixed areas were 10.31 ppm for AllMean and 3.89 ppm for RespMean.

4. Discussion

4.1. Methane Emission Traits

In some studies, the spot exhaled air samples were transformed to diurnal CH4 productions (in g/d) based on linear regression models [43,44], or by considering the ratio between CH4 and CO2 concentrations from each visit in automatic milking systems [45]. However, the transformations are only accurate for constant CH4 and CO2 concentrations throughout the testing day, and for climatic conditions at 25 °C with 1 atmosphere (101.3 kPa) pressure (the density of CH4 is 665.7 mg/L under these conditions). These assumptions can easily be violated because the CH4 and CO2 concentrations definitively vary during the day [46], and temperature and pressure also differ across visits and farms. Therefore, only the CH4 concentration as measured by the LMD, in parts per million (ppm), was used in the present study. This information can reflect relative differences in CH4 concentrations between farms applying different dairy cattle management systems along the rural-urban gradient in Bangalore.
Van Engelen et al. [46] measured CH4 concentrations from 1508 Dutch Holstein Friesian cows with infrared sensors installed in automatic milking systems and reported that the mean CH4 concentration per visit ranged between 11 and 2073 ppm (mean = 254 ppm). In comparison, AllMean obtained from LMD ranged from 8.25 to 351.75 ppm (mean = 42.85 ppm), which is significantly lower than AllMean reported by van Engelen et al. [46]. However, the CH4 concentrations, including all, respiration, and eructation CH4, from steers measured with an LMD [15] are comparable to our findings. The methods applied for measuring CH4 output can be a reason behind the varying CH4 emission values. Differences between seasons, sheds and diets contribute to further variations in CH4 and impede the comparison of data from different studies [47].

4.2. Body Weight and Milk Yield

Given the diversity in body size and weight of the sampled genotypes in this study, the positive correlation between MY and BW [48] would have overemphasised breed differences in MY. Additionally, the imbalanced numbers of cows of different genotypes biased the analysis of MY effects on CH4 concentration. Therefore, MY was corrected and expressed in liters per kg BW. In this study, AllMean is used as the reference value to represent a full exhalation–inhalation cycle [11,12]. The positive regression coefficient of 0.03 for MY/BW (p-value < 0.05) agrees with the findings from Garnsworthy et al. [43], who found that CH4 emissions were positively associated with MY. Cows on urban dairy farms had higher MY and BW than cows on mixed and rural farms. Usually, CH4 per unit of product, i.e., liter of milk, decreases with increasing MY [49,50]. When considering AllMean to calculate CH4 per liter of milk, urban areas still showed the highest CH4 emission (4.62 ppm/L) followed by rural areas (3.92 ppm/L), while mixed areas had the lowest CH4 emission per liter of milk (3.88 ppm/L). In this regard, farms in the mixed areas seemed to be more efficient in terms of methane output per unit of product (liter of milk).

4.3. Time Interval from Feeding to CH4 Recording

In line with the decreasing CH4 concentrations with the increasing time interval from feeding to CH4 recording reported by Chagunda [21] and Ricci et al. [15], the time interval from feeding to CH4 recording always had negative regression coefficients for all CH4 traits. Actually, CH4 emissions are higher after feeding when more substrate is available for rumen fermentation and more hydrogen is available for methanogenesis [51] and it decreases over time when the substrate (feed) is degrading and undegraded feed is getting scarce.

4.4. Breed

Swamy and Bhattacharya [52] stated that Indian indigenous cattle had higher CH4 emission per unit of milk than crossbred cattle. In the present study, native cows had highest CH4 emissions for AllMean, AllMinute and ErucMax (Table 4), although no significant difference to the other breeds existed. Chagunda et al. [49] compared cattle enteric CH4 between groups of low and high genetic merit for milk fat and protein content in combination with low and high forage intake and concluded that breeding for cows with high genetic merit was associated with a decrease in enteric CH4 emissions per liter of milk. However, the number of native cows in our sample was very small (n = 13) compared to exotic (n = 448) and crossbreed cows (n = 285) since native cows are not primarily used for dairy production but for fieldwork. In urban areas, since there is no field to cultivate, the native cows are used as dairy cows. For this reason, we found a higher percentage of native dairy cows in urban and mixed than in rural areas (Table 1).

4.5. Heat Stress and Measurement Location

Heat stress is associated with a reduction in the DM intake in ruminants [23] and consequently leads to a reduction in enteric CH4 emissions [20]. Even though in this study there was no significant impact of THI on AllMean (Table 4), a decrease in emissions of all CH4 traits was associated with increasing THI. Along the rural-urban gradient, THI on farms located in rural areas (72.85) was higher than on farms in the remaining areas, i.e., urban (70.19) and mixed (69.94). In urban areas, due to the building density, cattle are predominantly kept in the basement or ground floor or in front of the house under a well-insulated roof. In rural areas, only a simple wooden structure with some hay on top is used as a shed, offering little protection against heat stress. As a consequence, the increase in THI in rural areas might be due to the scarcity of shadow and heat insulation.
Independent of the rural-urban gradient, highest CH4 concentrations were measured in the indoor barns, followed by the half-outdoor and the outdoor sheds (Figure 5). As stated above, in the densely populated urban areas, limited space is available for cattle, forcing farmers to keep their cows indoors. As a consequence, 46.07% of the CH4 measurements in urban areas were conducted indoors, compared to 22.59% of indoor CH4 measurements in rural areas (Table 1). According to Ngwabie et al. [53], indoor air temperature is negatively correlated with daily CH4 emissions, because with the higher temperatures that prevail in (poorly ventilated) indoor conditions the feed intake decreases, resulting in lower CH4 emissions. However, in our study, the highest THI was found for half-outdoor locations (72.70) which were the most common in rural areas (Table 1). Besides, Ngwabie et al. [47] also showed that CH4 concentrations in indoor barns were higher than in outdoor barns and that ventilation rate had an inverse linear relationship to the CH4 concentrations. Thus, the ventilation determined by shed type has more influence on measured CH4 emissions relative to dry matter intake than the THI.

4.6. Pasture Access and Fibre Intake

The main factor driving CH4 production is feed intake. Nevertheless, reducing intake has not been considered as a strategy of CH4 reduction because of concerns in decreasing animal productivity [54]. However, modulating fibre content in diets and grazing management have been successfully used as mitigation strategies [55,56]. Grazing strategies employed to mitigate CH4 emissions are often related to forage quality, which means type and maturity of the fodder. Thus, feeding higher quality forage facilitates CH4 mitigation [57].
Pasture-based dairy farming systems and confinement systems differ in the amount of CH4 produced [22]. In a tropical environment, the access of cows to pasture changes with season as well as with farm location, cow breed, lactation stage and health status of the cow. In Bangalore, more than half of the cows (53.41%) had access to pasture, although the percentage of pasture access decreased in the dry season when the availability of vegetation declined. Lower CH4 concentrations were determined in cattle with pasture access, which accounted for 70.68% of cows in urban areas (Table 1). Access to high quality pasture ensures lower CH4 emissions from grazing animals [58], but due to the increasing population size and build-up density, the quality of inner-urban pasturing sites (vacant building plots, organic waste dumps, roadsides) in Bangalore was very variable. In urban areas, local shops and neighbours also supply farms with organic waste (vegetable and fruit peels) as cow feed [32]. In mixed and rural areas, cows mostly received Napier grass, maize stover and finger millet straw, as well as concentrate feed. In the nutrition subsample, we used the quantitative threshold of 94 g NDF/kg MW to separate fibre intake levels—the qualitative equivalent of this threshold is 600 g NDF/kg DM. Similar diets, in terms of NDF concentration, were also reported by Ali et al. [59] for heifers in Kenya (ca. 700 g NDF/kg DM) although recommendations for the diets of high-producing dairy cows in peak lactation range from 250 to 400 g NDF/kg DM [60,61,62]. However, no impact of the intake level of fibre (low vs. high NDF) on CH4 concentration was detected in our study, even though ruminants emit more CH4 when ingesting a fibrous diet [63].

4.7. Rural-Urban Gradient

Results from the present study unveiled impacts of SSI on CH4 emission. Although the SSI was constructed based on spatial information on a neighbourhood’s building density and distance to the city centre [31], it was also able to capture differences in management on the dairy farms. Compared to mixed and rural areas, higher CH4 concentrations were found for cows kept in urban areas. Urban dairy production is common in India [5] because of the strong market demand for milk products and higher milk prices in urban areas [27]. Furthermore, due to Indian culture and tradition, cattle are endeared and respected animals and are commonly allowed to graze or roam freely around in the whole city where they are often able to consume good quality vegetable residues from dumpsites. Access to quality pasture is associated with a decrease in CH4 emissions [56], thus, the higher accessibility to pasture in the mixed areas along with their highest percentage of outdoor locations may explain the lower CH4 emission in mixed as compared with urban areas. In rural areas, apart from a higher number of outdoor measurement locations, the low productivity (MY) of the cattle and the higher THI might contribute to lower CH4 emissions than in urban areas.
These examples demonstrate that social-ecological conditions influence farm management of dairy cattle along the rural-urban gradient in Bangalore and lead to variations in CH4 emissions. On one hand, in urban areas, dairy cows benefited from better management and high quality pasture, thus having a higher MY and BW [32]. On the other hand, urban dairy farms are characterized by indoor sheds, lower THI, less heat stress, and improved hygienic and health conditions [27]. Although these conditions generally reduce CH4 emissions, LMD spot measurements in urban locations yielded the highest values. Here, the measurement location type (poorly ventilated indoor barn with higher background CH4 concentration versus well ventilated outdoor barn with lower background CH4 concentration) may have overridden the positive effects of an improved cattle management in urban areas. In our study, we considered THI (which takes into account temperature and relative humidity) as an environmental factor that may influence the CH4 measurement. However, Chagunda et al. [64] additionally considered atmospheric pressure, wind speed and wind direction to correct outdoor LMD emissions. Thus, the CH4 concentration determined in outdoor locations of Bangalore may not represent the real values and rather underestimate these due to ignorance of the aforementioned atmospheric variables.
The impact of a rural-urban gradient on CH4 emissions displays the relevance of the underlying factors, namely herd management and environmental conditions, as shaped by the (progressing) city environment. An index summarizing those factors, such as the SSI, can therefore be used as a social-environmental feature in which human/management effects and environmental effects (e.g., THI) are expressed together.

5. Conclusions

This study is a pioneer in the use of the LMD for on-farm methane emission measurements of dairy cattle in an urbanizing environment. The LMD technique showed variations in the CH4 emissions along the rural-urban gradient of Bangalore. The additional consideration of SSI in CH4 emission contributed to capturing variations in dairy husbandry systems that are variations associated with social-ecological conditions. Except for the fibre content in the diet (NDF), which was inconclusive due to the small sample size, the remaining effects, i.e., milk yield, body weight, the time interval between feeding and CH4 measurement, pasture access and SSI cluster, as well as THI and measurement location (type of shed), significantly affected CH4 emissions. Higher concentrations of CH4 were associated with cows in urban areas with higher milk yield, kept in poorly ventilated indoor sheds, but with lower THI. Outdoor measurement locations and the high heterogeneity of farm management worked in favor of the rural farms’ CH4 emissions. Variations in individual CH4 emissions indicate the potential for reduction, e.g., via breeding and feeding strategies. Nevertheless, some disturbing factors as identified in the present study suggest a standardisation and improvements of LMD-based CH4 measurements.

Author Contributions

Conceptualization and methodology, S.K. and E.S.; data collection, A.P. and M.R.; data curation and investigation, A.P.; software, T.Y.; validation, S.K. and T.Y.; resources, R.B. and P.K.M.; writing—original draft preparation, A.P.; writing—review and editing, S.K., M.R. and E.S. All authors have read and agreed to the published version of the manuscript.

Funding

This research was funded by the German National Science Foundation, DFG, grant number KO 3520/5-1 and SCHL 587/6-1.

Acknowledgments

The authors gratefully acknowledge the kindness, patience and help of the dairy farmers and field assistants involved in the fieldwork, the logistic and scientific support offered by our Indian partners at the ICAR-National Institute of Animal Nutrition and Physiology (ICAR-NIANP) and the financial support provided by the German National Science Foundation, DFG, through grant number KO 3520/5-1 and SCHL 587/6-1, and by the Indian Department of Biotechnology (DBT), through grant number DBT/IN/German/DFG/14/BVCR/2016, as part of the Indo-German consortium of DFG Research Unit FOR2432/1 and DBT (The Rural-Urban Interface of Bangalore: A Space of Transitions in Agriculture, Economics, and Society). We also thank Regina Roessler for her statistical support with R.

Conflicts of Interest

The authors declare no conflict of interest. The funders had no role in the design of the study; in the collection, analyses, or interpretation of data; in the writing of the manuscript, or in the decision to publish the results.

References

  1. FAOSTAT. Live Animals & Livestock Primary Dataset. Food and Agriculture Organization of the United Nations. Available online: http://www.fao.org/faostat/en/#data/QA (accessed on 13 February 2020).
  2. International Farm Comparison Network Dairy Report 2011. For a Better Understanding of Milk Production World-Wide. IFCN—Dairy Research Center, Kiel, Germany. Available online: https://ifcndairy.org/wp-content/uploads/2017/07/Dairy-Report-2011.pdf (accessed on 11 February 2020).
  3. International Farm Comparison Network Dairy Report 2019. For a Better Understanding of the Dairy World. IFCN—Dairy Research Center, Kiel, Germany. Available online: https://ifcndairy.org/wp-content/uploads/2019/10/Dairy-Report_2019_extraction_for-marketing.pdf (accessed on 11 February 2020).
  4. World Bank Urban Population Growth (Annual %)—India. Available online: https://data.worldbank.org/indicator/SP.URB.TOTL.IN.ZS?end=2018&locations=IN&start=1960&view=chart (accessed on 13 February 2020).
  5. Prasad, C.S.; Anandan, S.; Gowda, N.K.S.; Schlecht, E.; Buerkert, A. Managing nutrient flows in Indian urban and peri-urban livestock systems. Nutr. Cycling Agroecosyst. 2019, 115, 159–172. [Google Scholar] [CrossRef]
  6. Gerber, P.J.; Steinfeld, H.; Henderson, B.; Mottet, A.; Opio, C.; Dijkman, J.; Falcucci, A.; Tempio, G. Tackling Climate Change through Livestock: A Global Assessment of Emissions and Mitigation Opportunities; Food and Agriculture Organization of the United Nations (FAO): Rome, Italy, 2013; ISBN 978-92-5-107920-1. [Google Scholar]
  7. Knapp, J.R.; Laur, G.L.; Vadas, P.A.; Weiss, W.P.; Tricarico, J.M. Invited review: Enteric methane in dairy cattle production: Quantifying the opportunities and impact of reducing emissions. J. Dairy Sci. 2014, 97, 3231–3261. [Google Scholar] [CrossRef] [PubMed] [Green Version]
  8. Patra, A.K. Trends and projected estimates of GHG emissions from Indian livestock in comparisons with GHG emissions from world and developing countries. Asian-Australas. J. Anim. Sci. 2014, 27, 592–599. [Google Scholar] [CrossRef] [PubMed] [Green Version]
  9. Goopy, J.P.; Chang, C.; Tomkins, N. A Comparison of Methodologies for Measuring Methane Emissions from Ruminants. In Methods for Measuring Greenhouse Gas Balances and Evaluating Mitigation Options in Smallholder Agriculture; Rosenstock, T.S., Rufino, M.C., Butterbach-Bahl, K., Wollenberg, L., Richards, M., Eds.; Springer International Publishing: Cham, Switzerland, 2016; pp. 97–117. ISBN 978-3-319-29794-1. [Google Scholar]
  10. Grainger, C.; Clarke, T.; McGinn, S.M.; Auldist, M.J.; Beauchemin, K.A.; Hannah, M.C.; Waghorn, G.C.; Clark, H.; Eckard, R.J. Methane emissions from dairy cows measured using the sulfur hexafluoride (SF6) tracer and chamber techniques. J. Dairy Sci. 2007, 90, 2755–2766. [Google Scholar] [CrossRef] [PubMed]
  11. Garnsworthy, P.C.; Difford, G.F.; Bell, M.J.; Bayat, A.R.; Huhtanen, P.; Kuhla, B.; Lassen, J.; Peiren, N.; Pszczola, M.; Sorg, D.; et al. Comparison of methods to measure methane for use in genetic evaluation of dairy cattle. Animals (Basel) 2019, 9, 837. [Google Scholar] [CrossRef] [Green Version]
  12. Chagunda, M.G.G.; Ross, D.; Roberts, D.J. On the use of a laser methane detector in dairy cows. Comput. Electron. Agric. 2009, 68, 157–160. [Google Scholar] [CrossRef]
  13. Chagunda, M.G.G.; Yan, T. Do methane measurements from a laser detector and an indirect open-circuit respiration calorimetric chamber agree sufficiently closely? Anim. Feed. Sci. Technol. 2011, 165, 8–14. [Google Scholar] [CrossRef]
  14. Reintke, J.; Brügemann, K.; Yin, T.; Engel, P.; Wagner, H.; Wehrend, A.; König, S. Assessment of methane emission traits in ewes using a laser methane detector: Genetic parameters and impact on lamb weaning performance. Arch. Anim. Breed. 2020, 63, 113–123. [Google Scholar] [CrossRef] [Green Version]
  15. Ricci, P.; Chagunda, M.G.G.; Rooke, J.M.; Houdijk, J.G.; Duthie, C.-A.; Hyslop, J.; Roehe, R.; Waterhouse, A. Evaluation of the laser methane detector to estimate methane emissions from ewes and steers. J. Anim. Sci. 2014, 92, 5239–5250. [Google Scholar] [CrossRef]
  16. Sorg, D.; Mühlbach, S.; Rosner, F.; Kuhla, B.; Derno, M.; Meese, S.; Schwarm, A.; Kreuzer, M.; Swalve, H. The agreement between two next-generation laser methane detectors and respiration chamber facilities in recording methane concentrations in the spent air produced by dairy cows. Comput. Electron. Agric. 2017, 143, 262–272. [Google Scholar] [CrossRef]
  17. Pickering, N.K.; Chagunda, M.G.G.; Banos, G.; Mrode, R.; McEwan, J.C.; Wall, E. Genetic parameters for predicted methane production and laser methane detector measurements. J. Anim. Sci. 2015, 93, 11–20. [Google Scholar] [CrossRef] [PubMed] [Green Version]
  18. Ricci, P.; Rooke, J.A.; Nevison, I.; Waterhouse, A. Methane emissions from beef and dairy cattle: Quantifying the effect of physiological stage and diet characteristics. J. Anim. Sci. 2013, 91, 5379–5389. [Google Scholar] [CrossRef] [PubMed]
  19. Yin, T.; Pinent, T.; Brügemann, K.; Simianer, H.; König, S. Simulation, prediction, and genetic analyses of daily methane emissions in dairy cattle. J. Dairy Sci. 2015, 98, 5748–5762. [Google Scholar] [CrossRef] [PubMed]
  20. Hammond, K.J.; Muetzel, S.; Waghorn, G.C.; Pinares-Patino, C.S.; Burke, J.L.; Hoskin, S.O. The variation in methane emissions from sheep and cattle is not explained by the chemical composition of ryegrass. Proc. N. Z. Soc. Anim. Prod. 2009, 69, 174–178. [Google Scholar]
  21. Chagunda, M.G.G. Opportunities and challenges in the use of the Laser Methane Detector to monitor enteric methane emissions from ruminants. Animal 2013, 7, 394–400. [Google Scholar] [CrossRef] [Green Version]
  22. O’Brien, D.; Capper, J.L.; Garnsworthy, P.C.; Grainger, C.; Shalloo, L. A case study of the carbon footprint of milk from high-performing confinement and grass-based dairy farms. J. Dairy Sci. 2014, 97, 1835–1851. [Google Scholar] [CrossRef] [Green Version]
  23. Rhoads, M.L.; Rhoads, R.P.; VanBaale, M.J.; Collier, R.J.; Sanders, S.R.; Weber, W.J.; Crooker, B.A.; Baumgard, L.H. Effects of heat stress and plane of nutrition on lactating Holstein cows: I. Production, metabolism, and aspects of circulating somatotropin. J. Dairy Sci. 2009, 92, 1986–1997. [Google Scholar] [CrossRef] [Green Version]
  24. Broaddus, B. Impact of Season and Heat Stress on Somatic Cell Counts. Master Thesis, University of Kentucky, Kentucky, KY, USA, 2001. [Google Scholar]
  25. Garnsworthy, P.C.; Craigon, J.; Hernandez-Medrano, J.H.; Saunders, N. Variation among individual dairy cows in methane measurements made on farm during milking. J. Dairy Sci. 2012, 95, 3181–3189. [Google Scholar] [CrossRef] [Green Version]
  26. Yan, T.; Mayne, C.S.; Gordon, F.G.; Porter, M.G.; Agnew, R.E.; Patterson, D.C.; Ferris, C.P.; Kilpatrick, D.J. Mitigation of enteric methane emissions through improving efficiency of energy utilization and productivity in lactating dairy cows. J. Dairy Sci. 2010, 93, 2630–2638. [Google Scholar] [CrossRef]
  27. Pinto, A.; Yin, T.; Reichenbach, M.; Bhatta, R.; Schlecht, E.; König, S. Phenotypic Dairy Cattle Trait Expressions in Dependency of Social-Ecological Characteristics along Rural–Urban Gradients. Sustainability 2020, 12, 9021. [Google Scholar] [CrossRef]
  28. Martin-Collado, D.; Soini, K.; Mäki-Tanila, A.; Toro, M.A.; Díaz, C. Defining farmer typology to analyze the current state and development prospects of livestock breeds: The Avileña-Negra Ibérica beef cattle breed as a case study. Livest. Sci. 2014, 169, 137–145. [Google Scholar] [CrossRef]
  29. Kraas, F. Megacities and global change: Key priorities. Geogr. J. 2007, 173, 79–82. [Google Scholar] [CrossRef]
  30. Groupe SCE India Revised of Structure Plan—2031 Bangalore Metropolitan Region. Available online: http://opencity.in/documents/bmrda-revised-structure-plan-2031-draft-report (accessed on 17 August 2020).
  31. Hoffmann, E.M.; Jose, M.; Nölke, N.; Möckel, T. Construction and use of a simple index of urbanisation in the rural–urban interface of Bangalore, India. Sustainability 2017, 9, 2146. [Google Scholar] [CrossRef] [Green Version]
  32. Reichenbach, M. Dairy Production in an Urbanizing Environment. A System Approach in Bengaluru, India. Ph.D. Thesis, University of Kassel, Witzenhausen, Germany, 2020. [Google Scholar]
  33. National Research Council (NRC). A Guide to Environmental Research on Animals; National Academy of Sciences: Washington, DC, USA, 1971. [Google Scholar]
  34. Ferguson, J.D.; Galligan, D.T.; Thomsen, N. Principal descriptors of body condition score in Holstein cows. J. Dairy Sci. 1994, 77, 2695–2703. [Google Scholar] [CrossRef]
  35. Grund, J.-N. Biometric Characteristics of Dairy Cattle in Karnataka. Master’s Thesis, Georg-August Universität Göttingen, Göttingen, Germany, 2018. [Google Scholar]
  36. Tokyo Gas Engineering Solutions Corporation. Laser Methane Mini SA3C32A Operation Manual; Tokyo Gas Engineering Solutions Corporation: Tokio, Japan, 2015. [Google Scholar]
  37. Blaxter, K.L.; Joyce, J.P. The accuracy and ease with which measurements of respiratory metabolism can be made with tracheostomised sheep. Br. J. Nutr. 1963, 17, 523–537. [Google Scholar] [CrossRef] [Green Version]
  38. Murray, R.M.; Bryant, A.M.; Leng, R.A. Rates of production of methane in the rumen and large intestine of sheep. Br. J. Nutr. 1976, 36, 1–14. [Google Scholar] [CrossRef] [Green Version]
  39. Benaglia, T.; Chauveau, D.; Hunter, D.R.; Young, D.S. Mixtools: An R package for analyzing mixture models. J. Stat. Softw. 2009, 32, 1–29. [Google Scholar] [CrossRef] [Green Version]
  40. Van Soest, P.J.; Robertson, J.B.; Lewis, B.A. Methods for dietary fiber, neutral detergent fiber, and nonstarch polysaccharides in relation to animal nutrition. J. Dairy Sci. 1991, 74, 3583–3597. [Google Scholar] [CrossRef]
  41. Bates, D.; Mächler, M.; Bolker, B.; Walker, S. Fitting linear mixed-effects models using lme4. J. Stat. Softw. 2015, 67, 1–48. [Google Scholar] [CrossRef]
  42. Lenth, R.; Singmann, H.; Love, J.; Buerkner, P.; Herve, M. Emmeans: Estimated marginal means, aka least-squares means.2018. Available online: https://CRAN.R-project.org/package=emmeans (accessed on 11 February 2020).
  43. Garnsworthy, P.C.; Craigon, J.; Hernandez-Medrano, J.H.; Saunders, N. On-farm methane measurements during milking correlate with total methane production by individual dairy cows. J. Dairy Sci. 2012, 95, 3166–3180. [Google Scholar] [CrossRef] [Green Version]
  44. Pszczola, M.; Rzewuska, K.; Mucha, S.; Strabel, T. Heritability of methane emissions from dairy cows over a lactation measured on commercial farms. J. Anim. Sci. 2017, 95, 4813–4819. [Google Scholar] [CrossRef] [PubMed] [Green Version]
  45. Lassen, J.; Løvendahl, P. Heritability estimates for enteric methane emissions from Holstein cattle measured using noninvasive methods. J. Dairy Sci. 2016, 99, 1959–1967. [Google Scholar] [CrossRef] [PubMed] [Green Version]
  46. van Engelen, S.; Bovenhuis, H.; van der Tol, P.P.J.; Visker, M.H.P.W. Genetic background of methane emission by Dutch Holstein Friesian cows measured with infrared sensors in automatic milking systems. J. Anim. Sci. 2018, 101, 2226–2234. [Google Scholar] [CrossRef] [PubMed] [Green Version]
  47. Ngwabie, N.M.; Jeppsson, K.-H.; Nimmermark, S.; Swensson, C.; Gustafsson, G. Multi-location measurements of greenhouse gases and emission rates of methane and ammonia from a naturally-ventilated barn for dairy cows. Biosyst. Eng. 2009, 103, 68–77. [Google Scholar] [CrossRef]
  48. Berry, D.P.; Buckley, F.; Dillon, P. Body condition score and live-weight effects on milk production in Irish Holstein-Friesian dairy cows. Animal. 2007, 1, 1351–1359. [Google Scholar] [CrossRef] [Green Version]
  49. Chagunda, M.G.G.; Römer, D.A.M.; Roberts, D.J. Effect of genotype and feeding regime on enteric methane, non-milk nitrogen and performance of dairy cows during the winter feeding period. Livest. Sci. 2009, 122, 323–332. [Google Scholar] [CrossRef]
  50. Kirchgessner, M.; Windisch, W.; Mueller, H.L.; Kreuzer, M. Release of methane and of carbon dioxide by dairy cattle. Agribiol. Res. 1991, 44, 91–102. [Google Scholar]
  51. Basarab, J.A.; Beauchemin, K.A.; Baron, V.S.; Ominski, K.H.; Guan, L.L.; Miller, S.P.; Crowley, J.J. Reducing GHG emissions through genetic improvement for feed efficiency: Effects on economically important traits and enteric methane production. Animal 2013, 7, 303–315. [Google Scholar] [CrossRef] [Green Version]
  52. Swamy, M.; Bhattacharya, S. Budgeting anthropogenic greenhouse gas emission from Indian livestock using country-specific emission coefficients. Curr. Sci. 2006, 91, 1340–1353. [Google Scholar]
  53. Ngwabie, N.M.; Jeppsson, K.-H.; Gustafsson, G.; Nimmermark, S. Effects of animal activity and air temperature on methane and ammonia emissions from a naturally ventilated building for dairy cows. Atmos. Environ. 2011, 45, 6760–6768. [Google Scholar] [CrossRef]
  54. Alford, A.R.; Hegarty, R.S.; Parnell, P.F.; Cacho, O.J.; Herd, R.M.; Griffith, G.R. The impact of breeding to reduce residual feed intake on enteric methane emissions from the Australian beef industry. Aust. J. Exp. Agric. 2006, 46, 813. [Google Scholar] [CrossRef]
  55. Hammond, K.J.; Jones, A.K.; Humphries, D.J.; Crompton, L.A.; Reynolds, C.K. Effects of diet forage source and neutral detergent fiber content on milk production of dairy cattle and methane emissions determined using GreenFeed and respiration chamber techniques. J. Dairy Sci. 2016, 99, 7904–7917. [Google Scholar] [CrossRef] [PubMed]
  56. Hristov, A.; Lee, C.-C.; Meinen, R.; Montes, F.; Ott, T.; Firkins, J.; Rotz, C.A.; Dell, C.; Adesogan, A.; Yang, W.; et al. Mitigation of Greenhouse Gas Emissions in Livestock Production—A Review of Technical Options for Non-CO2 Emissions; Food and Agriculture Organization of the United Nations (FAO): Rome, Italy, 2013; Volume 177, ISBN 978-92-5-107658-3. [Google Scholar]
  57. Hristov, A.N.; Oh, J.; Firkins, J.L.; Dijkstra, J.; Kebreab, E.; Waghorn, G.; Makkar, H.P.S.; Adesogan, A.T.; Yang, W.; Lee, C.; et al. SPECIAL TOPICS—Mitigation of methane and nitrous oxide emissions from animal operations: I. A review of enteric methane mitigation options. J. Anim. Sci. 2013, 91, 5045–5069. [Google Scholar] [CrossRef] [PubMed] [Green Version]
  58. Robertson, L.J.; Waghorn, G.C. Dairy industry perspectives of methane emissions and production from cattle fed pasture or total mixed rations in New Zealand. Proc. N. Z. Soc. Anim. Prod. 2002, 62, 213–218. [Google Scholar]
  59. Ali, A.I.M.; Wassie, S.E.; Korir, D.; Merbold, L.; Goopy, J.P.; Butterbach-Bahl, K.; Dickhoefer, U.; Schlecht, E. Supplementing tropical cattle for improved nutrient utilization and reduced enteric methane emissions. Animals 2019, 9, 210. [Google Scholar] [CrossRef] [Green Version]
  60. Mertens, D.R. Regulation of forage intake. In Forage Quality, Evaluation, and Utilization; John Wiley & Sons, Ltd.: Hoboken, NJ, USA, 1994; pp. 450–493. ISBN 978-0-89118-579-6. [Google Scholar]
  61. Standing Committee of Agriculture (SCA). Feeding Standards for Australian Livestock Ruminants. Ruminants Subcommittee; Corbett, J.L., Ed.; CSIRO: Melbourne, Australia, 1990; p. 266. [Google Scholar]
  62. National Research Council (NRC). Nutrient Requirements of Dairy Cattle, 6th ed.; National Academy of Sciences: Washington, DC, USA, 1989; ISBN 0-309-03826-X. [Google Scholar]
  63. Moe, P.W.; Tyrrell, H.F. Methane Production in Dairy Cows. J. Dairy Sci. 1979, 62, 1583–1586. [Google Scholar] [CrossRef]
  64. Chagunda, M.G.G.; Ross, D.; Rooke, J.; Yan, T.; Douglas, J.-L.; Poret, L.; McEwan, N.R.; Teeranavattanakul, P.; Roberts, D.J. Measurement of enteric methane from ruminants using a hand-held laser methane detector. Acta Agric. Scand. A Anim. Sci. 2013, 63, 68–75. [Google Scholar] [CrossRef]
Figure 1. Conceptual framework depicting the relations of spatial, managerial and environmental factors with enteric methane emission across a rural-urban interface.
Agriculture 10 00628 g001
Figure 2. Map of Bangalore depicting the 31 sampled settlements. The dark grey area represents the urban city zone. The orange contours indicate the northern and southern transects.
Agriculture 10 00628 g002
Figure 3. Measurement location for methane emissions: (a) Indoor, (b) half outdoor and (c) outdoor location.
Agriculture 10 00628 g003
Figure 4. Least square means (LSMeans) for the methane traits in indoor, half-outdoor and outdoor classes. Different letters on bars indicate significant differences (p-value < 0.05).
Agriculture 10 00628 g004
Figure 5. Least square means (LSMeans) for the methane traits in classes with (Yes) and without (No) access to pasture. Different letters on bars indicate significant differences (p-value < 0.05).
Agriculture 10 00628 g005
Figure 6. Least square means (LSMeans) for the methane traits subjected to a high (High) and a low (Low) neutral detergent fiber intake level.
Agriculture 10 00628 g006
Figure 7. Least square means (LSMeans) for the methane traits across three location clusters classified by the survey stratification index. Different letters on bars indicate significant differences (p-value < 0.05).
Agriculture 10 00628 g007
Table 1. Percentage of measurements per breed, pasture access (Past), measurement location (Loc), average milk yield (MY) and body weight (BW) for each survey stratification index (SSI) cluster.
SSI ClusterNo. of MeasurementsBreed (%)Past (%)Loc (%)MYBW
ExoticCrossbreedNativeNoYesIndoorHalf-OutdoorOutdoor(L/day)(kg)
Urban19151.345.63.129.370.746.116.737.211.5392.6
Mixed25062.031.26.834.465.632.011.256.810.5382.8
Rural39468.331.50.262.737.322.629.747.710.4379.1
Table 2. Descriptive statistics of the defined methane emission traits.
CH4 Trait# Farm# Cow# MeasurementMethane Emission (ppm)
MeanSDMin.Max.
AllMean11944883542.834.928.2351.7
AllMinute1194488353969.02446.35771.123,785.2
RespMean11944883516.017.211.0160.3
RespMax11944883548.481.401.0900.0
RespMinute119448835879.91249.820.512,873.9
ErucMean119448835108.1148.289.71425.0
ErucMax119448835410.2371.9931.04152.0
ErucMinute1194488353089.02253.80106.022,098.0
# = Number of; SD = Standard Deviation; Min = minimum value; Max = maximum value; AllMean = average all methane; Allminute = all methane per minute; RespMean = average respiration methane; RespMax = maximal respiration methane; RespMinute = respiration methane per minute; ErucMean = average eructation methane; ErucMax = maximal eructation methane; ErucMinute = eructation methane per minute.
Table 3. Descriptive statistics of methane emission from 27 farms with nutrition information.
CH4 Trait# Farm# Cow# MeasurementMethane Emission (ppm)
MeanSDMin.Max.
AllMean277814637.225.008.2119.2
AllMinute27781463645.02110.67905.211,353.7
RespMean277814613.312.861.074.8
RespMax277814648.689.581.0721.0
RespMinute2778146891.01207.360.57550.2
ErucMean2778146114.2174.4210.11271.2
ErucMax2778146489.1537.9639.04152.0
ErucMinute27781462754.11993.99106.010,747.6
# = Number of; SD = Standard Deviation; Min = minimum value; Max = maximum value; AllMean = average all methane; Allminute = all methane per minute; RespMean = average respiration methane; RespMax = maximal respiration methane; RespMinute = respiration methane per minute; ErucMean = average eructation methane; ErucMax = maximal eructation methane; ErucMinute = eructation methane per minute.
Table 4. Regression coefficients of milk yield to body weight ratio (MY/BW), temperature humidity index (THI) and time interval from feeding to methane recording (FasT) and least square means of breed levels for methane emission (CH4) traits.
CH4 TraitFixed Effects
MY/BW 1THI 1FasT 1Breed 2
ExoticCrossbreedNative
AllMean0.03 *−0.00 ns−0.01 *33.19 a33.33 a35.38 a
AllMinute0.02 ns−0.01 ns−0.01 ns3328.17 a3351.99 a3550.51 a
RespMean0.03 ns−0.01 ns−0.00 ns10.09 a10.88 a10.81 a
RespMax0.03 ns−0.00 ns−0.02 ns19.80 a23.63 a21.48 a
RespMinute−0.01 ns0.01 ns0.00 ns275.74 a344.81 a284.45 a
ErucMean0.02 ns−0.03 **−0.03 **61.50 a70.33 a70.31 a
ErucMax−0.01 ns−0.04 ***−0.04 ***296.92 a305.91 a358.25 a
ErucMinute0.04 ns0.02 *−0.00 ns2406.74 a2242.53 a2313.07 a
1 = regression coefficient; 2 = LSMeans; ns = not significant; * = p-value < 0.05; ** = p-value < 0.01; *** = p-value < 0.001; Different letters in the same row indicate significant difference between breed levels (p-value < 0.05); AllMean = average all methane; Allminute = all methane per minute; RespMean = average respiration methane; RespMax = maximal respiration methane; RespMinute = respiration methane per minute; ErucMean = average eructation methane; ErucMax = maximal eructation methane; ErucMinute = eructation methane per minute.
Publisher’s Note: MDPI stays neutral with regard to jurisdictional claims in published maps and institutional affiliations.

