Article

Effects of Social Network on Herder Livestock Production Income and the Mediation by Fund Loans

1
College of Economics and Management, Northwest A&F University, Yangling 712100, China
2
Research Center for Rural Development in Western China, Northwest A&F University, Yangling 712100, China
3
Shaanxi Collaborative Innovation Center of Rural Economy and Social Development, Northwest A&F University, Yangling 712100, China
*
Author to whom correspondence should be addressed.
Agriculture 2020, 10(12), 629; https://doi.org/10.3390/agriculture10120629
Submission received: 21 November 2020 / Revised: 2 December 2020 / Accepted: 11 December 2020 / Published: 13 December 2020
(This article belongs to the Special Issue Livestock Farm and Agribusiness Management)

Abstract

:
Due to its alpine geography and harsh environment, the pastoral region of Qinghai Province is widely recognized as one of China’s concentrated and contiguous poverty-stricken regions, while climate change, market competition and grazing control exert further pressure on the income security of herders. After more than 1000 years of nomadic practice, cooperation and reciprocity have been entrenched in the culture of pastoral ethnic minorities, in which a well-developed social network may play a crucial role in herders’ social and economic activities, including their financial and production behaviors. Based on a questionnaire survey of 278 households in two counties of Qinghai, this study empirically examined the effects of herders’ social network on their livestock production income and the mediation function of fund loans therein. The social network was found to exert a significant positive impact on household income, and loans had a positive mediation effect. By comparison, the mediation effect of formal borrowing channels was statistically significant while that of informal channels was not, which may be attributed to the relative degree of maturity of the two disparate financial markets. It is suggested that a closer and more inclusive social network should be fostered, the quality of bank financial services should be improved, and the regulation on informal credit activities should be reinforced, so as to fully exploit the positive roles of the social network and fund loans for income growth of herder households in vast pastoral areas of China.

1. Introduction

Situated at the Qinghai-Tibet plateau, the Qinghai Province of China has a rangeland area of 4.19 million hectares, accounting for 60.20% of the total area of the province, most of which is alpine meadow. As the headwater region of the Yangtze River, Yellow River, and Lancang-Mekong River, Qinghai is widely recognized as the “Asian Water Tower,” supplying vital water resources for China and Southeast Asian countries [1]. Moreover, as one of the five largest animal production bases in China, animal breeding is traditionally the most important, if not the only, source of income for millions of herdsmen of ethnic minorities, including the Tibetan, Tu, and Mongolian [2]. Its alpine geography and harsh environment mean that the production conditions for animal husbandry in Qinghai are extremely hostile, and the Chinese government has identified this pastoral region as one of China’s concentrated and contiguous poverty-stricken areas.
In recent decades, as a result of global climate change, the incidence of extreme weather events, such as drought and snow storms, in this region has increased considerably, causing serious damage to livestock production and the security of local herders’ livelihoods [3,4]. Moreover, market competition and the urbanization process have resulted in a continuous increase in production cost of animal husbandry and remarkable volatility in sales prices, making it more difficult for herders to secure their income [5]. Since the end of the last century, the Chinese government implemented several nation-wide rangeland protection initiatives, including the Returning Grazing Land to Grassland Project and the Grassland Ecological Protection Subsidy and Reward Scheme, all of which identified Qinghai as one of the most important implementation areas [6,7]. The measures adopted mainly aimed to reduce grazing pressure on grasslands by means of year-round or seasonal grazing cessation, rotational grazing, and achieving a forage-livestock balance [8,9]. Moreover, a large swath of land in the south of the province (17.04% of Qinghai’s total land area) was officially designated as the Three-River-Source National Park in 2016. In the National Park, the former nomadic herders were resettled in neighboring towns and grazing restrictions were also adopted, further inhibiting the performance of animal husbandry and exerting pressure on the income of herdsmen [10,11].
After the introduction of rangeland conservation initiatives and herdsmen settlements, the local government vigorously promoted the shift of livestock feeding mode to captive breeding. However, this mode inevitably entails a significant increase in production costs due to the need to purchase external forages and fodder, acquire fixed assets and machinery, and increase labor input [12,13]. Although the government provides subsidies, most herdsmen still have to rely on their own funds to transform the production mode and expand the production scale. In the case of production fund shortages, they also frequently turn to banks or contacts to borrow money [14,15]. Due to the low-profit and high-risk nature of agricultural credit, commercial banks are usually reluctant to grant credit to rural farmers. In this context, informal borrowing channels, such as borrowing from relatives and acquaintances, are the most common form of borrowing among small-scale herders who wish to take out a loan [16].
After more than 1000 years of nomadic practice, pastoralists in the vast rangeland have developed unique and strong norms of cooperative production and mutual assistance in order to cope with the hostile natural environment and harsh production conditions [17]. Mutual trust and reciprocity have been entrenched in the culture of pastoral ethnic minorities [18]. As such, it is conceivable that a well-developed social network of herders has already existed for a long time and exerted crucial impacts on their social and economic life, including their borrowing and production activities. A social network is, in essence, the carrier of social capital, and the varying positional features of individual actors in the social network, in part, explain the differential levels of their own individual social capital, and more importantly, of the social capital that they could acquire from the network [19]. Nonetheless, studies examining the social network of pastoral herders have rarely been carried out.
Studies on the social network of crop-planting farmers in farming areas suggest that the social network plays an important role in affecting farmer behaviors through channeling the transmission of information, resource exchanges, and facilitating mutual cooperation and reciprocity [20,21,22,23]. For instance, during a busy farming season, farmers can receive assistance from relatives to compensate for a labor shortage, and a farmer who has a closer relational density in their ego network can obtain more help [24]. Farmers can also borrow money from contacts to compensate for insufficient production funds, and a farmer with a more central position in the social network is in a better position to replenish their capital [25]. A boundary spanner who acts as a bridge between two or more different groups (e.g., farmer entrepreneurs, resident officials) can obtain more heterogeneous and non-redundant information from external organizations, which can be subsequently converted into production practices [26,27]. A farmer occupying a ‘structural hole’ position can even control, monopolize, and filtrate the information flow to other marginal farmers [28,29].
Considering the long-standing norms of cooperation and reciprocity entrenched in the culture of pastoral regions, we argue that the well-developed herder social network plays a crucial role in herders’ livestock production and fund loan activities. In particular, we hypothesized that a herder with a superior position in the social network can transform their structural advantages into resource and information advantages, subsequently facilitate the acquisition of both formal and informal credit, and therefore, enhance production efficiency and household income growth by enlarging their production scale, optimizing the configuration of input factors, and improving their production efficiency [30,31]. In such a process, we highlighted a mediating function of fund loans with regard to the effects of the social network on herder income.
Based on a survey involving 278 herdsmen from a typical pastoral area in Qinghai Province, this study aimed to empirically test the effects of the social network of individual herders on their household livestock breeding income, as well as the mediating effects of borrowing therein. We hope that the empirical data and econometric modeling presented in this study can reveal the effect mechanism of social networks on livestock production at the individual level, and that this research can address the knowledge gap that exists in relation to understanding the role of social networks in vast pastoral areas, which can guide animal husbandry and environmental policies in Qinghai and other pastoral areas in China, and help to ensure the livestock production system more resilient to risks arisen from policy adjustments and environmental changes.

2. Materials and Methods

2.1. Data Source and Sample Statistics

2.1.1. Data Source

The data used in this study were obtained from a field survey that was conducted in October 2019 among herders in two counties (Menyuan and Qilian) of the Qinghai Province, both of which are typical pastoral counties in the alpine rangeland. Both counties are located in the northeast of Qinghai, with an average altitude of more than 3500 m above sea level and an annual mean precipitation of 400–500 mm. The main bred livestock are Tibetan sheep and yak, both of which adapt well to the hypoxia and cold climate on the plateau.
In total, four villages in Menyuan and two in Qilian were surveyed. In order to construct the social network of the villagers, the survey targeted all households in the villages, although ultimately, about one-third of the families were not surveyed because they left the area for various reasons during the survey period. A face-to-face survey method was applied, and the questions covered basic information about households and household heads, household loans and income, livestock production, as well as the social network. A total of 333 household questionnaires were distributed. After excluding questionnaires with missing data and obvious inconsistencies in their answers, 278 questionnaires were deemed valid, with an effective recovery rate of 83.48%.
Following the typology developed by Borgatti et al. [32], three types of social ties were surveyed: (1) affections, including kinship, friends, and other relations with whom the respondents had an emotional attachment; (2) membership, which referred to an affiliation with the same organization, such as government agencies, firms, cooperatives, etc.; and (3) interaction, including cooperative production, information and resource exchanges, etc. Having considered the possibility that the respondents may have forgotten some important contacts, the roster method was used. With the assistance of local village cadres, a full list of households in the villages was compiled before the field survey. Each respondent was required to identify seven households, which represented their most important contacts for each category of social tie. Each respondent was requested to rate the relational strength according to a scale which ranged from 1 (the least) to 5 (the highest). After that, the three types of interactions were aggregated into a single social network by equally weighting each type of social ties.

2.1.2. Descriptive Statistics of the Sample

The heads of surveyed households were mainly male, about 70% of whom were aged between 40 and 60 years old; their education level was relatively low, and 93.17% had a middle school education level or below; the majority of the respondents had an abundance of experience in grazing, and about 90% had more than 15 years of grazing experience (Table 1).
In terms of household characteristics, most families had a credit certificate; 71.22% of households stated that more than 75% of their labor force was engaged in animal husbandry, which indicated that animal husbandry is still the main livelihood source for most families; 60.07% of households had 500–1999 mu (15 mu = 1 ha) of grassland, which was significantly higher than the farmland size held by an average farmer in farming regions; overall, the breeding scale was not high, as only 5.75% of households fed more than 500 standard sheep units (SU) (the numbers of all species of animals were converted into standard sheep units (SU); the conversion rule was set as: 1 Tibetan sheep/sheep/goat = 1 SU; 1 yak = 4 SU; 1 cattle/cow = 5 SU; 1 horse = 6 SU) and 29.14% were found to have a livestock number of less than 150 SU. Despite these observations, the livestock production is generally a lucrative business, and 37.05% of the surveyed families had a mean annual income of more than 100,000 Yuan (7 Yuan = 1 US$) in the last three years, and 5.40% of these households earned more than 200,000 Yuan (Table 1). This annual income is even higher than that earned from crop farming in certain more developed areas of southeast China, which may be attributed to the sustained rising price of meats due to the continuous growth in consumption demand in recent years.
When it comes to fund borrowing, 73.74% of families had a loan worth more than 50,000 Yuan, and 33.45% had borrowed more than 200,000 Yuan. Most of these families borrowed money from formal financial institutions, while 50.85% of households used formal financial institutions as their only borrowing channels, and 38.98% used both formal and informal channels (Table 1).

2.1.3. Social Network Characteristics

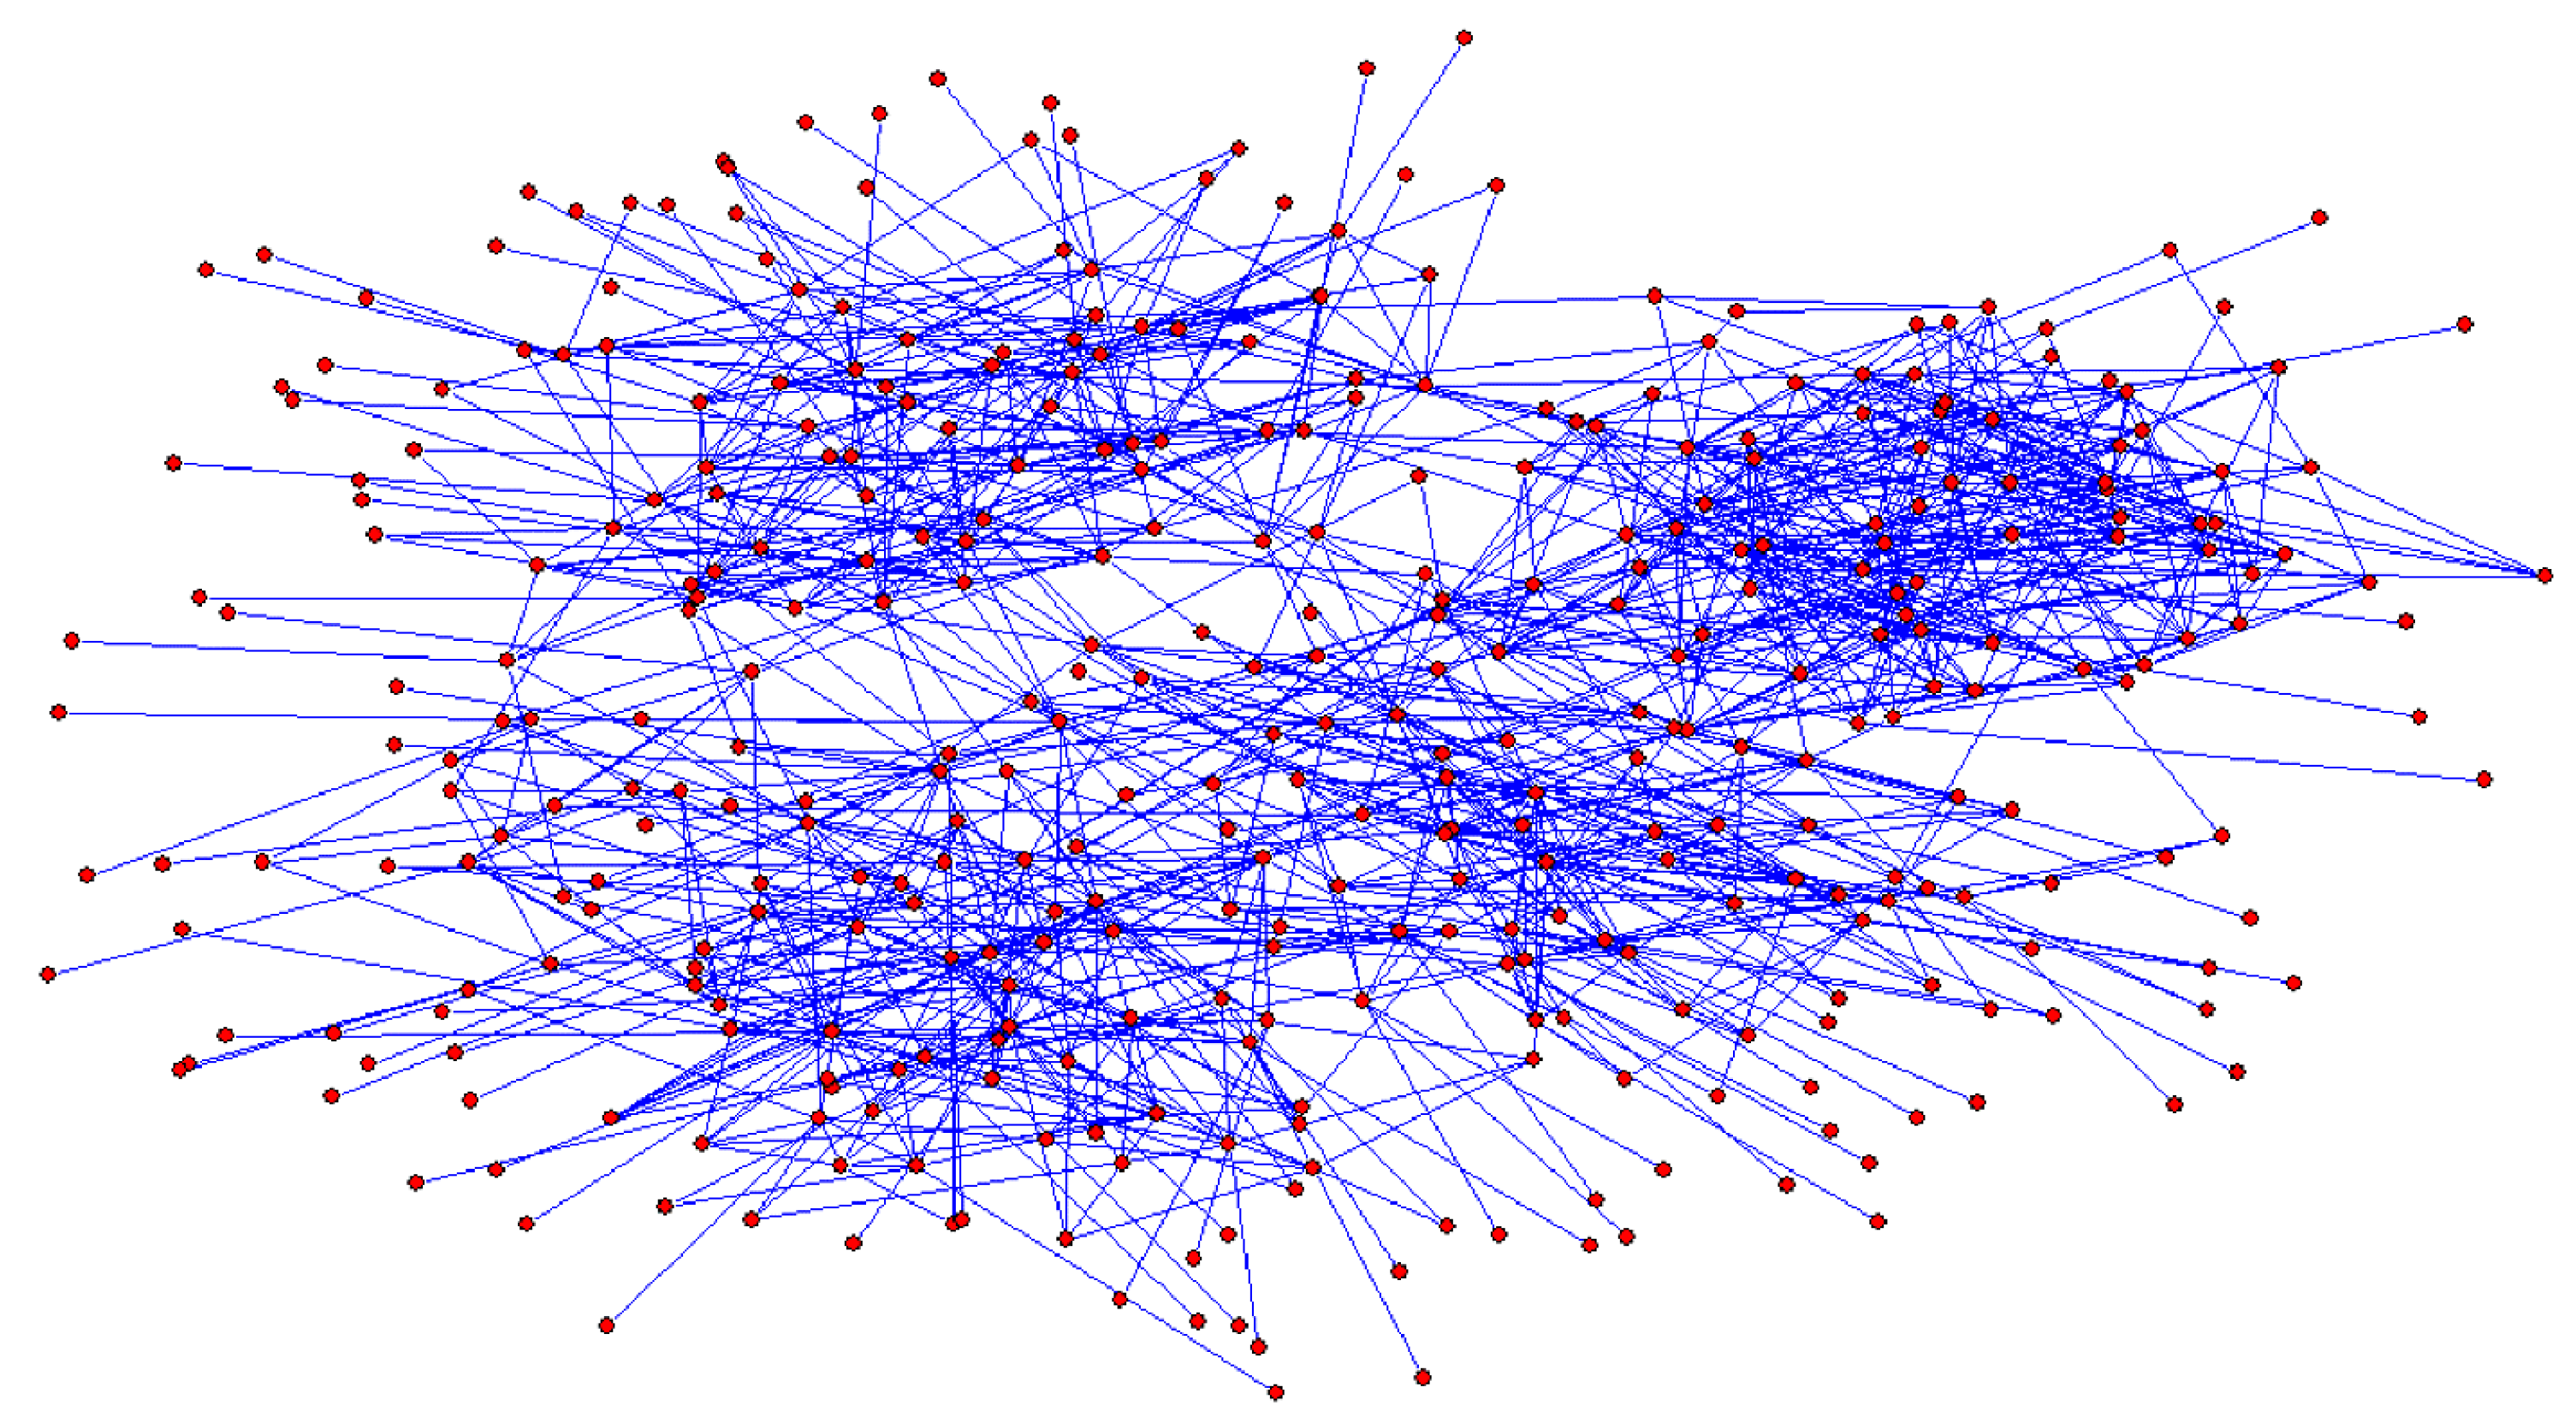
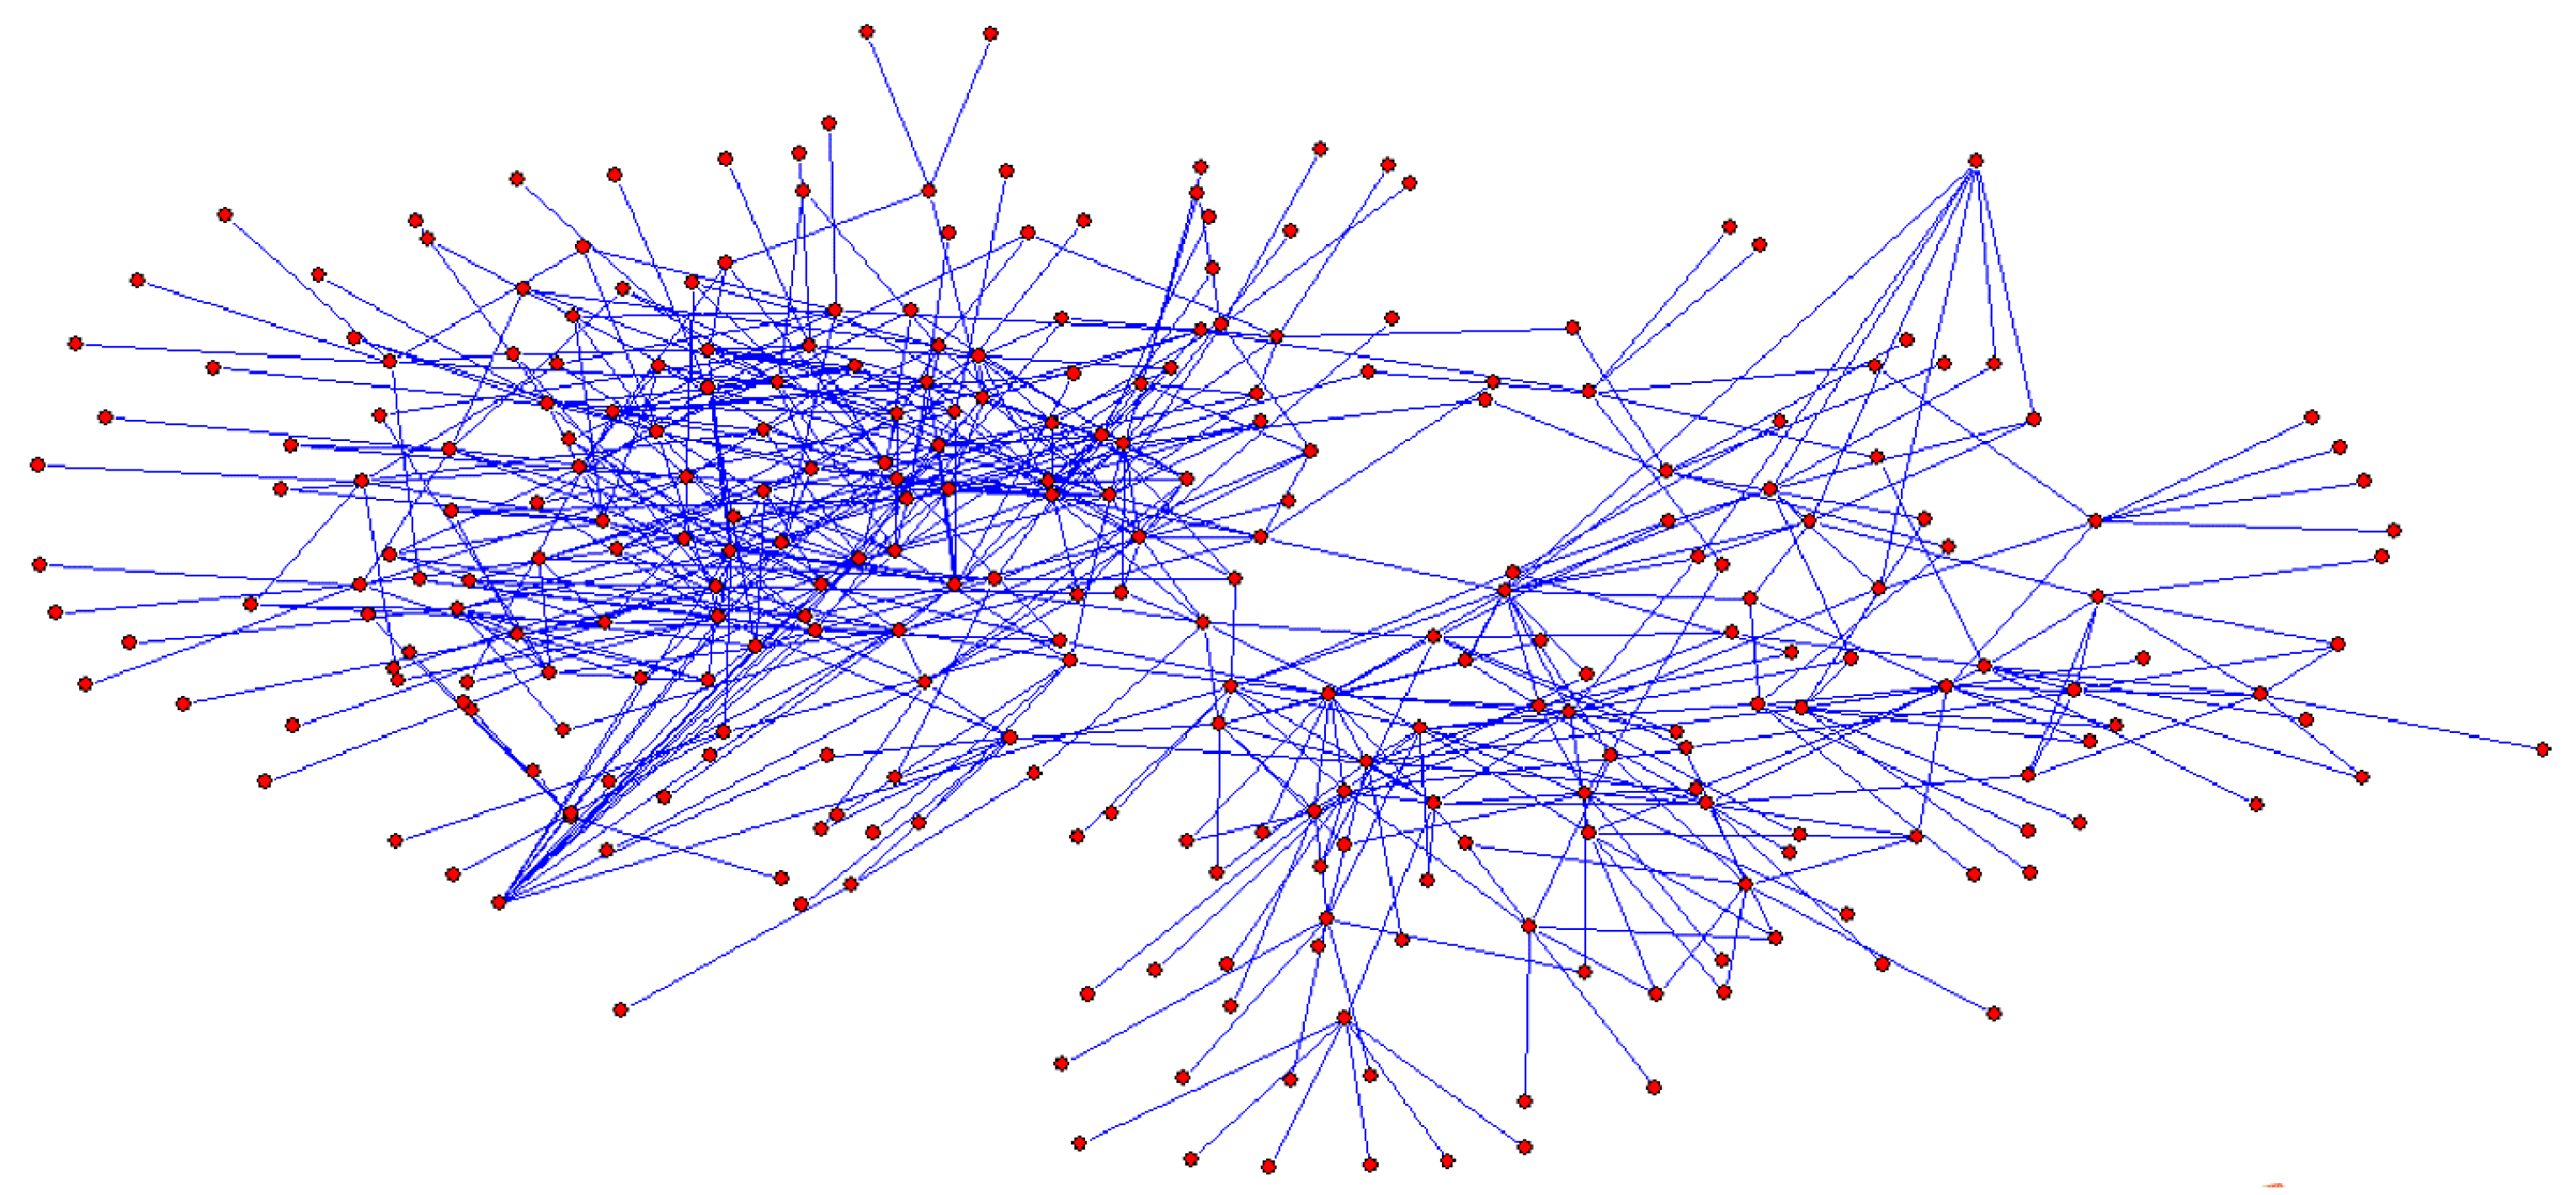
Using a social network visualization software package, Pajek version 5.08, the social network was constructed, with the nodes representing the herder households, and the linkages representing their social ties. The networks of the two counties are shown in Figure 1 and Figure 2, respectively. Comparing the networks between the two counties and those between villages, it can be seen that there are obvious regional discrepancies. The relational density of Menyuan County is much higher than that of Qilian County, which may be explained by the observation that more individual interactions take place in the former rather than the latter. Alternatively, it may simply be due to the fact that we collected more samples in the former than in the latter. Nonetheless, in both counties, individual interactions were mainly concentrated in their own villages and obvious subgroups were identified. This is consistent with the theory of “differential patterns” developed by Whyte [33], who argued that the relational closeness of traditional rural Chinese villagers and others showed a distinct declining gradient corresponding to blood lineage and geographical proximity. In spite of this, there are still a number of cross-village linkages, and such linkages are much more prevalent in Menyuan than in Qilian, suggesting that cross-village interactions occur more frequently in Menyuan than in Qilian.
In contrast to the whole social network, an ego network refers to the network that is directly connected with an individual node. There are many structural indicators that can be used to reflect the characteristics of an ego network. According to the two most prominent theories concerning social networks, namely, the Strength of Weak Ties Theory proposed by Granovetter [34] and the Structural Holes Theory by Burt [35], the network size, positional centrality and structural holes occupied by a node are the most important aspects affecting individual behaviors. Therefore, we selected corresponding indicators to represent the characteristics of ego networks. The software package UCINET 6.365 was used to calculate the indicators, and the results are shown in Table 2.
(1) Network size. The network size of a node refers to the total number of linkages contained in the node’s ego network, that is, the relational size of an individual herder in the whole social network. The network size reflects the number of channels that an individual can use to acquire information and resources through the network. Table 2 shows that 261 nodes had a network size of less than or equal to 10, accounting for 93.88% of the total number of nodes; only 17 nodes had a network size greater than 10, accounting for 6.12%. This result implied that self-identified strong social ties were mainly concentrated among a small number of individual herders. As indicated by the survey data, such individuals included those of village cadres, town government officials, grassland rangers, and local entrepreneurs.
(2) Structural holes. According to the Structural Holes Theory proposed by Burt [35], when two nodes that have no direct connection are connected by a third node, the third node is deemed to occupy a structural hole. The more structural holes occupied by a node, the greater the corresponding individual’s ability to manipulate the information and resources that flow through it. Two indicators (i.e., the effective size and the degree of constraint) were chosen to measure the structural holes occupied by individual herders. The former refers to the non-redundant factors in one node’s ego network; the latter refers to the ability of a node to manipulate the structural holes in its ego network; the formulas are constructed as follows:
E S i = j ( 1 q P i q m j q ) ,   q i , j
C i = j ( p i j + q p i q p q j ) 2  
where Equation (1) indicates the effective size and Equation (2) reveals the degree of constraints. In addition, i represents the ego node, j represents the nodes that have a direct linkage with node i , and q represents all nodes other than i and j   in the ego network of node i . Moreover, p i q represents the relational proportion that node i contributed to node q and m j q denotes the marginal strength of the relationship between j and q, which is equal to the value of the relationship between j and q divided by the maximum value of the relationship between j and other nodes. As a result, p i q m j q denotes the redundancy between node i and node j . Thus, the effective size of node i is equal to the ego network size of node i minus the network redundancy. The larger the effective size of a node, the lower the redundancy of the node’s ego network, which means that it could manipulate a greater number of structural holes.
Similarly, p i j is the relational proportion that node i contributed to node j , and p q j represents the proportion that node q contributed to j . Accordingly, p i j indicates the direct relational input of i to j , and q p i q p q j expresses the indirect relational input of i to j . Therefore, C i measures the degree of dependence of node i on all other nodes, that is, the constraint that results from other nodes. The larger the degree of constraint, the more the node is dependent on other nodes, which means that the node is less capable of manipulating structural holes.
According to the measurement results, 95.32% of herdsmen had an effective size of less than 10 (Table 2), which is basically consistent with the results of the network size. This suggests that, overall, there was a rather higher relational redundancy in the social network, and there was a great possibility that structural holes would appear and be manipulated. Correspondingly, 87.41% of herdsmen had a degree of constraint which was less than 0.6 (Table 2), indicating that most herders had a relatively high ability to manipulate the structural holes.
(3) Network centrality. Indicators of network centrality include degree centrality, betweenness centrality, and closeness centrality. This paper selected closeness centrality to measure the network centrality of individual herdsmen, which is most suitable for analyzing the independence and effectiveness of information transmission. The formula is expressed as follows:
  C A P i 1 = j = 1 n d i j
where   d i j is the distance of the shortcut between node i and node j , i.e., the number of linkages contained in the shortcut. As a result, the closeness centrality of node i is defined as the sum of its shortcut distances with all other nodes in the network. Hence, closeness centrality reflects the degree of closeness between one node and all other nodes in the network, and the lower the closeness centrality, the closer a node is to all other nodes, meaning that it occupies a more central position in the network.
No herdsmen showed a closeness centrality of less than 10, and only 22.66% were found to have a closeness centrality of less than 15 (Table 2), which indicates that the social ties in the study area were relatively decentralized. This finding is consistent with the fact that the geographical distribution of herder households was rather scattered across the vast pastoral area.

2.2. Variable Selection and Definition

(1) Dependent variable. On account of our research purpose, the mean annual household income from livestock production during the previous three years was selected as the dependent variable, and a natural logarithm transformation was conducted on the dependent variable.
(2) Intermediate variables. The formal loan amount and the informal loan amount were selected as the intermediate variables, and the natural logarithm transformation was conducted on both variables.
(3) Core independent variables. The four individual social network indicators were selected as the core independent variables, i.e., the network size, effective size, degree of constraint, and closeness centrality. Section 2.1.3 presents the calculation methods used.
(4) Control variables. In order to control for the influences of other factors, characteristics related to three aspects of herder households (i.e., the personal characteristics of the household head, family characteristics, and characteristics of livestock production) were input to the model as control variables. The chosen variables for the characteristics of the household head included the gender, age, and education level; the variables for family characteristics included whether the family had a credit certificate and the proportion of the labor force engaged in livestock production; the variables for the characteristics of livestock production included the livestock number and size of the rangeland area.
Variable definitions and basic statistics are presented in Table 3.

2.3. Principal Component Analysis (PCA)

A PCA is used to transform multiple original variables, which are highly correlated, into a smaller number of linearly independent variables [36]. The variables after transformation are called principal components, and each principal component is a linear combination of the original variables. In this study, given the high correlation between the network size (X1), effective size (X2), degree of constraint (X3), and closeness centrality (X4), a PCA was carried out to transform these four variables into principal components, which were then combined into a comprehensive variable as the proxy for individual social network characteristics. The four original variables were normalized before conducting the PCA.

2.4. Model Specifications

According to the mediation effect test process developed by Mackinnon et al. [37], the following three econometric models were constructed to test the total effect of the social network on livestock production income, the direct effect of social network on fund borrowing, and the mediation effect of fund borrowing in terms of the influence of the social network process on livestock production income, respectively:
I n c o m e i = α 0 + α 1 N e t w o r k i + α 2 X i + ε i
L o a n i = β 0 + β 1 N e t w o r k i + β 2 X i + ε i
I n c o m e i = δ 0 + δ 1 N e t w o r k i + δ 2 L o a n i + δ 3 X i + ε i
In the above equations, i denotes an individual herder household. I n c o m e is the mean annual income of herder households from animal production during the last three years; N e t w o r k is the comprehensive proxy variable of individual social network characteristics; L o a n is the formal or informal loan amount of the herder household; X is the set of control variables; and ε is the random disturbance term. The coefficient α 1 in Equation (4) represents the total effect of social networks on livestock production income, β 1 in Equation (5) represents the direct effect of the social network on capital borrowing, δ 1 in Equation (6) is the direct effect of the social network on livestock production income, and δ 2   is the direct effect of capital borrowing on income. By combining the three equations, the mediation effect of capital borrowing can be calculated as β 1 δ 2 .
Considering that the dependent variables of formal loan amounts and informal loan amounts tend to be zero at the corner point (i.e., no fund borrowing), Equation (5) was formulated as the Tobit model, and correspondingly, the maximum likelihood method was used to estimate the parameters of Equation (5). Contrarily, Equations (4) and (6) were estimated using the ordinary least squares method. The Stata 13.1 software package was used to perform the estimation.

3. Results

3.1. Results of Principal Component Analysis

3.1.1. KMO and Bartlett Test

The Kaiser-Meyer-Olkin (KMO) Measure and Bartlett’s Sphericity Test were used to determine the applicability of the PCA. As shown in Table 4, the value of the KMO measure was 0.710, which indicated a high correlation between the variables. The value of the approximate chi-square statistic of Bartlett’s test was 1281.781, and the statistical significance level was 0.000, meaning that the null hypothesis on variable independence was rejected. Given these results, the four variables were deemed suitable for PCA.

3.1.2. Principal Components Extraction

Four components were generated, among which F1 and F2 produced the highest contribution for the total variance of original variables. In combination, they produced a cumulative contribution rate of 91.14% (Table 5), suggesting that these two components were sufficient to explain the total variance of original variables, and hence, they could be extracted as the principal components.

3.1.3. Common Factor Variance

The common factor variance indicates the extent to which the information of the original variables can be reflected by the extracted principal components. As shown in Table 6, all common factor variances of the four original variables were greater than 0.7, and three of the common factor variances were larger than 0.95, which indicated that the two extracted principal components explained the main information of the original variables.

3.1.4. Building a Comprehensive Proxy Variable for Social Network

Based on the coefficient matrix presented in Table 7, the principal components can be calculated for each individual herder, as follows:
F 1 i = ( 0.940 X 1 i + 0.706 X 2 i + 0.863 X 3 i + 0.948 X 4 i ) / 3.025
F 2 i = ( 0.264 X 1 i + 0.695 X 2 i + 0.007 X 3 i 0.262 X 4 i ) / 0.621
As the coefficients indicate, the principal component F1 had a large load on the network size, degree of constraint, and effective size, indicating that F1 mainly measured the relational scale and structural holes of individuals. The principal component F2 had a large load on the closeness centrality, suggesting that F2 mainly measured the centrality of individuals in the social network.
Finally, a comprehensive proxy variable for the individual social network was calculated by summing the values of two principal components weighted by their variance contribution rates. The equation can be formulated as follows:
N e t w o r k i = F 1 i × 75.621 % + F 2 i × 15.519 % 91.14 %
It can be seen that the variance contribution rate of F1 was much larger than F2, indicating that the network scale and structure holes reflected most of the information in the original social network variables.

3.2. Modeling Results

3.2.1. Effects of the Social Network on Household Livestock Production Income

The estimation results of Equation (4) are presented in Table 8. The adjusted r-squared was 0.482, suggesting that, overall, the goodness of fit of the model was acceptable.
The social network characteristics of individual herders had a significant positive impact on household livestock production income (p < 1%), which was consistent with the expectation. With regard to the control variables, the gender of household heads, the proportion of the household labor force engaged in livestock production, and the breeding scale, all had a positive impact on the annual livestock production income of herdsmen at the significance level of 1%, and the household’s grassland area also had a significant positive impact, but at a marginal level of significance (p < 10%). These results were generally consistent with our expectations.

3.2.2. Mediation Function of Fund Loans

Based on Equation (5), we further tested the direct effects of the social network on fund borrowing, including formal loans and informal loans, and the results are reported in the columns related to Model 1 and Model 2 in Table 9, respectively. Based on Equation (6), we proceeded to test the mediation effects of formal loans and informal loans in terms of how the social network process affected livestock production income, and the results are shown in the columns related to Model 3 and Model 4 in Table 9, respectively.
It can be seen from Model 1 in Table 9 that the social network had a significant positive impact on formal loans (p < 0.10), with an impacting coefficient ( β 1 ) of 0.168. In Model 3, formal loans had a significant positive impact on livestock production income (p < 0.01), after controlling for the impacts of the social network as well as other factors, and the impacting coefficient ( δ 2 ) was 0.190. Moreover, the social network also had a significant positive impact on livestock production income (p < 0.01), with an impacting coefficient ( δ 1 ) of 0.184. In combination with the results from Table 8, all relevant coefficients were significant, indicating that the mediation test was passed. In other words, formal loans played a mediation effect in terms of the impact of the social network on household livestock husbandry income, and the mediation effect accounted for 14.64% of the total effect.
From the estimation results of Model 2 in Table 9, it can be seen that the impact of the social network on informal loans was not statistically significant; and from Model 4, the impacts of both the social network and informal loans on the animal production income of herders were also not statistically significant. A Sobel test further verified these results, suggesting that the mediation effect of informal loans in respect to the impact of the social network on household livestock production income was not significant.

4. Discussions

A comprehensive review of existing literature around crop-planting farmers in farming areas found that the influences of the social network on household income could be mainly attributed to two mechanisms, namely, resource acquisition and information transmission. A large number of researchers analyzed the role of social networks in terms of their relationship with social capital, acknowledging that the position occupied by a farmer in the social network in part determines their individual social capital, and a superior position (e.g., a higher centrality and possessing more structural holes) usually means a higher individual social capital, and vice versa [38]. The differences in the characteristics of the ego social network directly affect the ability of farmers to mobilize resources and information from the relational network for their agricultural operations, and thus, have an effect on their income growth potential [39,40]. Our modeling results offer further support for this conclusion regarding herders in pastoral areas. Similar to the situation in farming areas, a herder who occupies a superior position means that they are in a better position to acquire or even control the information and resources that flow through the social network, which increases the probability that they can improve their production efficiency, manage various risks arising from natural shocks and market volatility, and thus, increase their household income. Furthermore, as indicated by Equation (9), the first principal component F1 was dominant in determining the value of the comprehensive network proxy variable, it is reasonable to attribute this significant positive effect to F1, which is, in turn, mainly decided by the network size, degree of constraint, and effective size possessed by individual herders (Table 7). In general, this result suggested that the larger the size of a herder’s ego social network, the more structural holes a herder occupies in the social network, and the higher the level of annual livestock production income that can be earned.
Our modeling results further verify the mediation function played by formal loans in the effects of the social network on household livestock husbandry income. In essence, the rationale underlying the influence of social networks on herder borrowing behavior is the same as that observed in the case of herder household income, except that the former usually works as a mediator for the latter. A herder who holds a superior position in the social network can utilize their positional advantages to acquire more information and resources with regard to formal credit, and hence, they have a higher probability of securing a loan [41,42]. Subsequently, the money borrowed is usually used to replenish production capital, and it may contribute to a higher level of production efficiency and to higher profits.
In contrast to the effects on household income, individual social network positions could also function as a signal of credit standing. A superior network position is perceived as a reliable credit guarantee, thus making it easier for the corresponding individuals to obtain a loan [43]. The problem of adverse selection is a major concern for creditors, as it hinders the availability of credit and the development of the financial market [44]. Social network indicators are conducive to identifying the high-quality “oranges” and to exclude the low-quality “lemons” from the market, thus avoiding the phenomena of “bad money driving out good money.” In addition, the norms and customs inherent to the social network of pastoral society also work as an invisible supervisory mechanism for credit defaults [45]. A herder who holds a superior network position usually enjoys a higher reputation, but they are also subject to greater moral constraints [46]. In this way, the social network actually serves as a mechanism of punishment to reduce the incidence of credit defaults and avoid moral hazards. In light of the long-standing strong social norms of mutual trust and valuing reputation that have been entrenched in the culture of pastoral ethnic minorities, we argue that such an invisible supervisory and punishment function wielded by herder social network should not be ignored, and is sometimes even of vital importance.
Nonetheless, the impact of the social network on informal loans was not statistically significant, and consequently, the mediation effect of informal loans was also insignificant. This result may be attributed to the imperfect informal rural financial market, where the upper limit of the interest rate is usually not restricted effectively, and usurious loans are frequently seen. In some cases, informal loans are obtained from relatives and close friends. Therefore, the signing of the contract and its notarization are often not finalized, and without security, disputes can easily arise. For instance, once the lender violates the oral agreement and requests for a repayment of the loan ahead of schedule, the borrower will enter into a financial crisis. Considering the relative underdevelopment reality of a formal financial market in rural China and the indispensable role played by informal borrowing channels in replenishing capital shortage, further regulation and supervision on the informal financial market is warranted.

5. Conclusions

Based on a field survey dataset of 278 herder households in Qinghai Province on the Qinghai-Tibet plateau, this paper examined the influences of the social network on herders’ household livestock production income and the mediation function of fund borrowing therein. The results indicate that the social network had a significant positive impact on herder income and the mediation effect of formal loans was statistically significant while that of informal loans was not. The study revealed that social networks, via the acquisition of information and resources, influence the ability of herders to access credit and in turn influence the potential of increasing livestock production efficiency and income growth. They also act as an invisible form of security and create constraints via social norms, so as to avoid moral hazard problems inherent to the financial market. The findings confirm the conclusions drawn from studies on farming areas and fill the research gap in pastoral areas.
Three policy implications are given. First, a closer and more inclusive social network in pastoral areas should be fostered and exploited to give a full play of its positive role in herder income growth and improving the effectiveness of rural financial market. More ethnic cultural events, such as Nadam Fairs, could be held, and all types of cooperatives should be supported, to provide more platforms for herders to share information and exchange resources., Second, individual social network information, such as the relational size and quality, can be used as an important reference for credit rating by financial institutions, so as to mitigate the problem of adverse selection and fulfil the mediation functions of formal loans. Third, the informal financial market should be further developed and regulated, by enhancing the formulation and enforcement of relevant laws and regulations.

Author Contributions

L.S. and H.C. conceived and designed the research; L.S. and Y.Z. set up the econometric models and collected the data; Y.Z. and Y.W. analyzed the data. All authors engaged in writing the paper. All authors have read and agreed to the published version of the manuscript.

Funding

This study was funded by the National Natural Science Foundation of China grant number 71603207 and 71873098, the Humanities and Social Sciences Fund of Ministry of Education of China grant number 16YJC790085 and 16YJC630003, and the China Agriculture Research System grant number CARS-28. And the APC was funded by Northwest A&F University, Yangling, China.

Acknowledgments

The authors would like to thank all survey respondents for their unreserved and sincere feedback and the cadres of six villages of Mengyuan and Qilian Counties for their unselfish help in the survey process. Thanks are also extended to the two anonymous reviewers for their constructive and insightful comments.

Conflicts of Interest

The authors declare no conflict of interest.

References

  1. An, R.; Wang, Z.; Wang, H.; Wu, H.; Quaye-Ballard, J.A. Monitoring rangeland degradation on the “Three River Headwaters” region in 1990 and 2004, Qinghai, China. In Proceedings of the 2014 IEEE Geoscience and Remote Sensing Symposium, Quebec City, QC, Canada, 13–18 July 2014; pp. 3526–3529. [Google Scholar] [CrossRef]
  2. Wu, X.; Zhang, X.; Dong, S.; Cai, H.; Zhao, T.; Yang, W.; Jiang, R.; Shi, Y.; Shao, J. Local perceptions of rangeland degradation and climate change in the pastoral society of Qinghai-Tibetan Plateau. Rangel. J. 2015, 37, 11–19. [Google Scholar] [CrossRef]
  3. Huang, K.; Zhang, Y.; Zhu, J.; Liu, Y.; Zu, J.; Zhang, J. The influences of climate change and human activities on vegetation dynamics in the Qinghai-Tibet Plateau. Remote Sens. 2016, 8, 876. [Google Scholar] [CrossRef] [Green Version]
  4. Linden, A.V.D.; Olde, E.M.D.; Mostert, P.F.; Boer, I.J.M.D. A review of European models to assess the sustainability performance of livestock production systems. Agric. Syst. 2020, 182, 102842. [Google Scholar] [CrossRef]
  5. Li, X.; Yuan, Q.; Wan, L.; He, F. Perspectives on livestock production systems in China. Rangel. J. 2008, 30, 211–220. [Google Scholar] [CrossRef]
  6. Li, W.; Li, Y. Rangeland degradation control in China: A policy review. In The End of Desertification? Springer: Berlin/Heidelberg, Germany, 2016; pp. 491–511. [Google Scholar]
  7. Li, P.; Bennet, J. Understanding herders’ stocking rate decisions in response to policy initiatives. Sci. Total Environ. 2019, 672, 141–149. [Google Scholar] [CrossRef] [PubMed]
  8. Shao, L.; Chen, H.; Zhang, C.; Huo, X. Effects of major grassland conservation programs implemented in Inner Mongolia since 2000 on vegetation restoration and natural and anthropogenic disturbances to their success. Sustainability 2017, 9, 466. [Google Scholar] [CrossRef] [Green Version]
  9. Chen, H.; Shao, L.; Zhao, M.; Zhang, X.; Zhang, D. Grassland conservation programs, vegetation rehabilitation and spatial dependency in Inner Mongolia, china. Land Use Policy 2017, 64, 429–439. [Google Scholar] [CrossRef]
  10. Fu, M.; Tian, J.; Ren, Y.; Li, J.; Liu, W.; Zhu, Y. Functional zoning and space management of Three-River-Source National Park. J. Geogr. Sci. 2019, 29, 2069–2084. [Google Scholar] [CrossRef] [Green Version]
  11. Barragán-Ocaña, A.; Silva-Borjas, P.; Olmos-Peña, S.; Polanco-Olguín, M. Biotechnology and bioprocesses: Their contribution to sustainability. Processes 2020, 8, 436. [Google Scholar] [CrossRef] [Green Version]
  12. Waldron, S.; Brown, C.; Longworth, J. Grassland degradation and livelihoods in China’s western pastoral region: A framework for understanding and refining China’s recent policy responses. China Agric. Econ. Rev. 2010, 2, 298–320. [Google Scholar] [CrossRef]
  13. Li, P.; Bennet, J.; Zhang, B. Ranking policies to achieve sustainable stocking rates in Inner Mongolia. J. Environ. Econ. Policy 2020, 9, 421–429. [Google Scholar] [CrossRef]
  14. Li, Z.; Han, G.; Zhao, M.; Wang, J.; Wang, Z.; Kemp, D.R.; Michalk, D.L.; Wilkes, A.; Behrendt, K.; Wang, H.; et al. Identifying management strategies to improve sustainability and household income for herders on the desert steppe in Inner Mongolia, China. Agric. Syst. 2015, 132, 62–72. [Google Scholar] [CrossRef]
  15. Fayiah, M.; Dong, S.; Khomera, S.W.; Rehman, S.A.U.; Yang, M.; Xiao, J. Status and challenges of Qinghai–Tibet Plateau’s grasslands: An analysis of causes, mitigation measures, and way forward. Sustainability 2020, 12, 1099. [Google Scholar] [CrossRef] [Green Version]
  16. Jia, X.; Heidhues, F.; Zeller, M. Credit rationing of rural households in China. Agric. Financ. Rev. 2010, 70, 37–54. [Google Scholar] [CrossRef]
  17. Tsui, Y. Swinging between nomadism and sedentarism: A case study of social and environmental change in the nomadic society of the Altay steppes, Xinjiang. Nomadic Peoples 2012, 16, 50–67. [Google Scholar] [CrossRef]
  18. Zhu, T.; Ganesh, P.S.; Chen, H.; Maddox, D.A. Survey-based evaluation of community-based co-management of forest resources: A case study of Baishuijiang National Natural Reserve in China. Environ. Dev. Sustain. 2012, 14, 197–220. [Google Scholar]
  19. Giugni, M.; Lorenzini, J. Social Networks and Social Capital. In Jobless Citizens; Palgrave Pivot: London, UK, 2017; pp. 63–77. [Google Scholar]
  20. Oriana, B.; Imran, R. Social networks and technology adoption in northern Mozambique. Econ. J. 2010, 116, 869–902. [Google Scholar]
  21. Vasilaky, K. Female social networks and farmer training: Can randomized information exchange improve outcomes? Am. J. Agric. Econ. 2013, 95, 376–383. [Google Scholar] [CrossRef]
  22. Ramirez, A. The influence of social networks on agricultural technology adoption. Procedia Soc. Behav. Sci. 2013, 79, 101–116. [Google Scholar] [CrossRef] [Green Version]
  23. Kim, M.K.; Narasimhan, R. Designing supply networks in automobile and electronics manufacturing industries: A multiplex analysis. Processes 2019, 7, 176. [Google Scholar] [CrossRef] [Green Version]
  24. Magnan, N.; Spielman, D.J.; Lybbert, T.J.; Gulati, K. Leveling with friends: Social networks and indian farmers’ demand for a technology with heterogeneous benefits. J. Dev. Econ. 2015, 116, 223–251. [Google Scholar] [CrossRef] [Green Version]
  25. Pena-López, A.J.; Sánchez-Santos, Manuel, J. Individual social capital: Accessibility and mobilization of resources embedded in social networks. Soc. Netw. 2017, 49, 1–11. [Google Scholar]
  26. Rugksa, J.; Shortt, N.K.; Boydell, L. The right tool for the task: ’boundary spanners’ in a partnership approach to tackle fuel poverty in rural northern ireland. Health Soc. Care Community 2010, 15, 221–230. [Google Scholar] [CrossRef] [PubMed]
  27. Skaalsveen, K.; Ingram, J.; Urquhart, J. The role of farmers’ social networks in the implementation of no-till farming practices. Agric. Syst. 2020, 181, 102824. [Google Scholar] [CrossRef]
  28. Fazikova, M.; Melichova, K. The problems of knowledge economy and innovation processes in agriculture case study of the Nitra region. Acta Reg. Environ. 2014, 11, 24–29. [Google Scholar]
  29. Hunecke, C.; Engler, A.; Jara-Rojas, R.; Poortvliet, P.M. Understanding the role of social capital in adoption decisions: An application to irrigation technology. Agric. Syst. 2017, 153, 221–231. [Google Scholar] [CrossRef]
  30. Sikwela, M.M.; Mushunje, A. The impact of farmer support programmes on household income and sustainability in smallholder production: A case study of the Eastern Cape and KwaZulu Natal farmers, South Africa. Afr. J. Agric. Res. 2013, 8, 2502–2511. [Google Scholar]
  31. Karlan, D.; Osei, R.; Osei-Akoto, I.; Udry, C. Agricultural decisions after relaxing credit and risk constraints. Q. J. Econ. 2014, 129, 579–652. [Google Scholar] [CrossRef] [Green Version]
  32. Borgatti, S.P.; Mehra, A.; Brass, D.; Labianca, G. Network analysis in the social sciences. Science 2009, 323, 892–895. [Google Scholar] [CrossRef] [Green Version]
  33. Whyte, A.F. Earthbound China: A study of rural economy in Yunnan. Int. Aff. 1949, 25, 547–548. [Google Scholar] [CrossRef]
  34. Granovetter, M.S. The strength of weak ties. Am. J. Sociol. 1973, 78, 1360–1380. [Google Scholar] [CrossRef] [Green Version]
  35. Burt, R. Structural Holes; Harvard University Press: Cambridge, MA, USA, 1992. [Google Scholar]
  36. Jolliffe, I.T. Principal component analysis. J. Mark. Res. 2002, 87, 513. [Google Scholar]
  37. Mackinnon, D.P.; Fairchild, A.J.; Fritz, M.S. Mediation analysis. Annu. Rev. Psychol. 2007, 58, 593–614. [Google Scholar] [CrossRef] [PubMed]
  38. Li, M. Social network and social capital in leadership and management research: A review of causal methods. Leadersh. Q. 2013, 24, 638–665. [Google Scholar] [CrossRef]
  39. Barrett, C. Smallholder Identities and Social Networks: The Challenge of Improving Productivity and Welfare. In The Social Economics of Poverty: On Identities, Communities, Groups, and Networks; Routledge Taylor & Francis Group: Oxford, UK, 2005; pp. 204–231. [Google Scholar]
  40. Johny, J.; Wichmann, B.; Swallow, B.M. Characterizing social networks and their effects on income diversification in rural Kerala, India. World Dev. 2017, 94, 375–392. [Google Scholar] [CrossRef]
  41. Chai, S.; Chen, Y.; Huang, B.; Ye, D. Social networks and informal financial inclusion in China. Asia Pac. J. Manag. 2019, 36, 529–563. [Google Scholar] [CrossRef]
  42. Ali, D.A.; Deininger, K.; Duponchel, M. Credit Constraints, Agricultural Productivity, and Rural Nonfarm Participation: Evidence from Rwanda. In World Bank Policy Research Working Paper 6769; The World Bank: Washington, DC, USA, 2014. [Google Scholar]
  43. Aloysius, G.B. Accessing formal credit: Social capital versus ‘social position’ (lesson from a Javanese village). In Proceedings of the 7th IRSA International Conference, Jakarta, Indonesia, 3–4 August 2005. [Google Scholar]
  44. Dahlstrom, R.; Ingram, R. Social networks and the adverse selection problem in agency relationships. J. Bus. Res. 2003, 56, 767–775. [Google Scholar] [CrossRef]
  45. Guiso, L.; Sapienza, P.; Zingales, L. The role of social capital in financial development. Am. Econ. Rev. 2004, 94, 526–556. [Google Scholar] [CrossRef] [Green Version]
  46. Biggart, N.W.; Castanias, R.P. Collateralized social relations: The social in economic calculation. Am. J. Econ. Sociol. 2001, 60, 471–500. [Google Scholar] [CrossRef]
Figure 1. Social network of herdsmen in Menyuan County. Each node represents a herder and each linkage between two nodes represents a relationship between two herders.
Agriculture 10 00629 g001
Figure 2. Social network of herdsmen in Qilian County. Each node represents a herder and each linkage between two nodes represents a relationship between two herders.
Agriculture 10 00629 g002
Table 1. Descriptive statistics of sample herders/households.
IndicatorsCategoriesNo.Proportion
GenderMale25892.81%
Female207.19%
Age<3082.88%
30–394917.63%
40–4910838.85%
50–609032.37%
>60238.27%
Years of schooling010638.13%
0–610437.41%
7–94917.63%
10–12186.47%
>1210.36%
Grazing experience (Year)˂153010.79%
15–2910638.13%
30–4412043.17%
45–50155.40%
>5072.52%
Whether has a credit certificate04315.47%
123584.53%
Proportion of labor force engaging in livestock production (%)<25%2715.17%
25–50%3111.15%
50–75%220.079%
75–100%19871.22%
<5005921.22%
Area of household rangeland (Mu)500–199916760.07%
2000–34993914.03%
3500–500072.52%
>500062.16%
Livestock number (SU) *0–1498129.14%
150–29910537.77%
300–4496623.74%
450–500103.60%
>500165.75%
Annual income from livestock production (Yuan)<50,0009433.81%
50,000–99,9998129.14%
100,000–149,9995519.78%
150,000–200,0003311.87%
>200,000155.40%
Loan amount (Yuan)04215.11%
0–49,9993111.15%
50,000–99,9993111.15%
100,000–149,9994215.11%
150,000–200,0003914.03%
>200,0009333.45%
Borrowing channelFormal12050.85%
Informal2410.17%
Combined9238.98%
Note: * The numbers of all species of animals were converted into standard sheep units (SU); the conversion rule was set as: 1 Tibetan sheep/sheep/goat = 1 SU; 1 yak = 4 SU; 1 cattle/cow = 5 SU; 1 horse = 6 SU.
Table 2. Distribution of ego social network indicators.
IndicatorRangeFrequencyPercentage
Network size1–516157.91%
6–1010035.97%
11–15155.40%
16–2020.72%
Effective Size1.00–4.0012444.60%
4.01–7.0010136.33%
7.01–10.004014.39%
10.01–17.63134.68%
Degree of Constraint0–0.3014652.52%
0.31–0.609734.89%
0.61–0.90258.99%
0.91–1.00103.60%
Closeness Centrality10.00–15.006322.66%
15.01–20.0013950.00%
20.01–25.005720.50%
25.01–27.08196.83%
Table 3. Variable definitions and basic statistics.
Variable TypeNameDefinitionMeanStd. Dev.
Dependent variableLivestock production incomeLogarithm of mean annual household income from animal husbandry in the last three years (Yuan)9.7863.851
Mediation variablesFormal loanLogarithm of formal loan amount (Yuan)8.7715.252
Informal loanLogarithm of informal loan amount (Yuan)4.3475.338
Core independent variablesNetwork sizeNumber of directly connected linkages with a node5.6403.059
Effective sizeIndividual network size minus network redundancy4.7792.773
Degree of constraintDegree of dependence of a node on all other nodes, i.e., the constraint by other nodes0.4580.244
Closeness centralitySum of a node’s shortcut distances with all other nodes in the network19.0662.742
Control variablesGender1 = Male, 0 = Female0.9280.259
AgeAge of household heads47.349.988
Education level1 = illiterate, 2 = primary school, 3 = junior high school, 4 = senior high school, 5 = college or above1.9350.921
Proportion of labor force engaging in livestock productionProportion of labor force engaging in livestock production in total household labor force0.8190.322
Credit certificateWhether a household has a credit certificate; 1 = yes, 0 = no0.8450.362
Rangeland areaAcreage of household rangeland (Mu)1372.9601236.124
Breeding scale *Mean annual livestock number in the past three years (sheep unit, SU)337.158414.115
Note: * Please refer to the note of Table 1 for the conversion rule for the number of different species of animals.
Table 4. Results of the Kaiser-Meyer-Olkin (KMO) measure and Bartlett’s sphericity test.
KMO Measure of Sampling Adequacy0.710
Bartlett’s TestApprox. Chi-Square1281.781
df6
Sig.0.000
Table 5. Total variance contribution by components.
Principal ComponentsInitial EigenvalueExtract Sum of Squares Load
TotalVariance Contribution Rate/%Cumulative Contribution Rate/%TotalVariance Contribution Rate/%Cumulative Contribution Rate/%
F13.02575.62175.6213.02575.62175.621
F20.62115.51991.140.62115.51991.14
F30.348.4999.63
F40.0150.37100
Table 6. Common factor variance.
IndicatorsInitialExtract
X11.0000.953
X21.0000.968
X31.0000.745
X41.0000.980
Note: X1, X2, X3, and X4 represent the four ego social network indicators (network size, effective size, degree of constraint, and closeness centrality, respectively).
Table 7. Coefficient matrix of the extracted principal components.
X1X2X3X4
F10.9400.7060.8630.948
F2−0.2640.6950.007−0.262
Note: X1, X2, X3, and X4 represent the four ego social network indicators (network size, effective size, degree of constraint, and closeness centrality, respectively); F1 and F2 represent the two extracted principal components.
Table 8. Estimation results for the effects of the social network on household livestock production income.
Dependent Variable: Livestock Production Income
Independent VariablesCoefficients
Network0.218 ***
(0.053)
Gender0.158 ***
(0.050)
Age−0.003
(0.082)
Education level0.035
(0.068)
Proportion of labor force in livestock production0.396 ***
(0.046)
Credit certificate0.009
(0.039)
Rangeland area0.255 *
(0.133)
Breeding scale0.755 ***
(0.187)
Adjusted R20.482
Sample size278
Note: Figures in parentheses are robust standard errors; * and *** are significance levels at 1% and 10%, respectively.
Table 9. Estimation results: the influence of the social network on household livestock production income through fund borrowing.
Dependent VariableFormal LoanInformal LoanLivestock Production Income
Independent VariablesModel 1Model 2Model 3Model 4
Network0.168 *−0.3440.184 ***0.217 ***
(0.090) (0.220)(0.052)(0.054)
Formal loan 0.190 ***
(0.046)
Informal loan −0.021
(0.037)
Control variableControlledControlledControlledControlled
Adjusted R20.0440.0290.5090.480
Sample size278278278278
Note: Figures in parentheses are robust standard errors; * and *** are significance levels at 1% and 10%, respectively.
Publisher’s Note: MDPI stays neutral with regard to jurisdictional claims in published maps and institutional affiliations.

