Article

The Effect of Diet and Farm Management on N2O Emissions from Dairy Farms Estimated from Farm Data

1
Leibniz Institute for Agricultural Engineering and Bio-Economy e.V. (ATB), Max-Eyth-Allee 100, 14469 Potsdam, Germany
2
Physikalisch-Technische Bundesanstalt (PTB), Bundesallee 100, 38116 Braunschweig, Germany
*
Author to whom correspondence should be addressed.
Agriculture 2021, 11(7), 654; https://doi.org/10.3390/agriculture11070654
Submission received: 16 June 2021 / Revised: 3 July 2021 / Accepted: 8 July 2021 / Published: 11 July 2021

Abstract

:
The N2O emissions of 21 dairy farms in Germany were evaluated to determine the feasibility of an estimation of emissions from farm data and the effects of the farm management, along with possible mitigation strategies. Emissions due to the application of different fertilisers, manure storage and grazing were calculated based on equations from the IPCC (Intergovernmental Panel of Climate Change) and German emission inventory. The dependence of the N2O emissions on fertiliser type and quantity, cultivated crops and diet composition was assessed via correlation analysis and linear regression. The N2O emissions ranged between 0.11 and 0.29 kg CO2eq per kilogram energy-corrected milk, with on average 60% resulting from fertilisation and less than 30% from fertiliser storage and field applications. The total emissions had a high dependence on the diet composition; in particular, on the grass/maize ratio and the protein content of the animal diet, as well as from the manure management. A linear model for the prediction of the N2O emissions based on the diet composition and the fertilisation reached a predictive power of R2 = 0.89. As a possible mitigation strategy, the substitution of slurry for solid manure would reduce N2O emissions by 40%. Feeding cows maize-based diets instead of grass-based diets could reduce them by 14%.

1. Introduction

The agricultural sector (crops and livestock) is a substantial contributor to greenhouse gas (GHG) emissions; globally, it represents approximately 14% of the anthropogenic GHG emissions [1]. Livestock production systems contribute about 42% of total GHG production from agriculture, 28% of which is associated with direct emissions of enteric fermentation (CH4) and 14% (CH4 and N2O) related to manure handling, storage and its use as fertilizer [2]. In 2018, the German agricultural sector ranked second (after France) in total GHG emissions among the 28 EU countries; it produced about 63600 Gg CO2eq, which corresponds to 7.4% of the greenhouse gas emissions in Germany. German agriculture emissions have decreased significantly since 1990, mainly due to reduced livestock numbers, more efficient fertilizer application, and improved manure management. In 2017, the emissions of N2O were lower than those in 1990 by about 16.8% and the CH4 emissions by about 26.8% [3]. Nonetheless, these efforts have to be intensified to reach the German self-imposed goal to reduce GHG emissions by 55% by 2030.
As a major GHG, N2O is the most powerful ozone-depleting compound emitted by human activity [4]. In agricultural land-use systems, organic and inorganic nitrogen fertilizers are the overall main contributors to anthropogenic N2O emissions [5]. Many factors, like the animal diet and its protein content, the type of storage and the farming system, influence the production of N2O from manure. In order to determine which variables are the principal players affecting N2O emissions on milk producing commercial farms, several studies have been conducted and employed different systems of analysis [6,7,8,9]. Unfortunately, most published studies focus on just a part of the N2O emission sources in the dairy farm and rarely consider the entire dairy farm system. The effect of animal diet is often not included in the calculation and just the quantity of the manure is considered. This gives an incomplete view of the entire N2O emissions scenario on the farm, as the animal diet composition is a major deciding factor for GHG emissions from manure [10].
Furthermore, most of these studies were performed using data from the literature or models under standard conditions. However, such data are often gathered from very old research to amass a large database or selected with severe restrictions to achieve database homogeneity. These procedures can seriously affect the study results and do not reflect the typical variability of farm systems [11,12,13]. Very few studies have analysed all the N2O sources in the dairy farms and explored the connection between variable modification inside the system and its effect on N2O emissions [11], and even fewer have determined the emissions on the base of data coming from real farms. The complexity of collecting valid farm data and successively controlling and normalizing all farmer-retrieved information has resulted in few direct farm-based interview studies [9,14].
Against this background, we decided to investigate the power and the limits of an assessment of N2O emissions based on farm data. In particular, we aimed to reconstruct N2O emissions produced from the whole farm (milking cows, heifers and calves) during the entire milk production process (from the feedstuff production to the manure management) and consider also the animal diet, using all the information which is usually available and well-documented in a dairy farm. For this aim, we selected farms from three regions in Germany, different in terms of animal breed, farm dimensions, animal diets, manure management and the presence of pasture, and collected all the necessary data for the N2O emissions estimate. In the present study we analysed the data in order to address the following research questions:
  • How accurately can emissions be predicted from farm data?
  • Which parameters make the highest contribution to an N2O emissions estimate?
  • What mitigation strategies can be reasonably deduced from farm data?

2. Materials and Methods

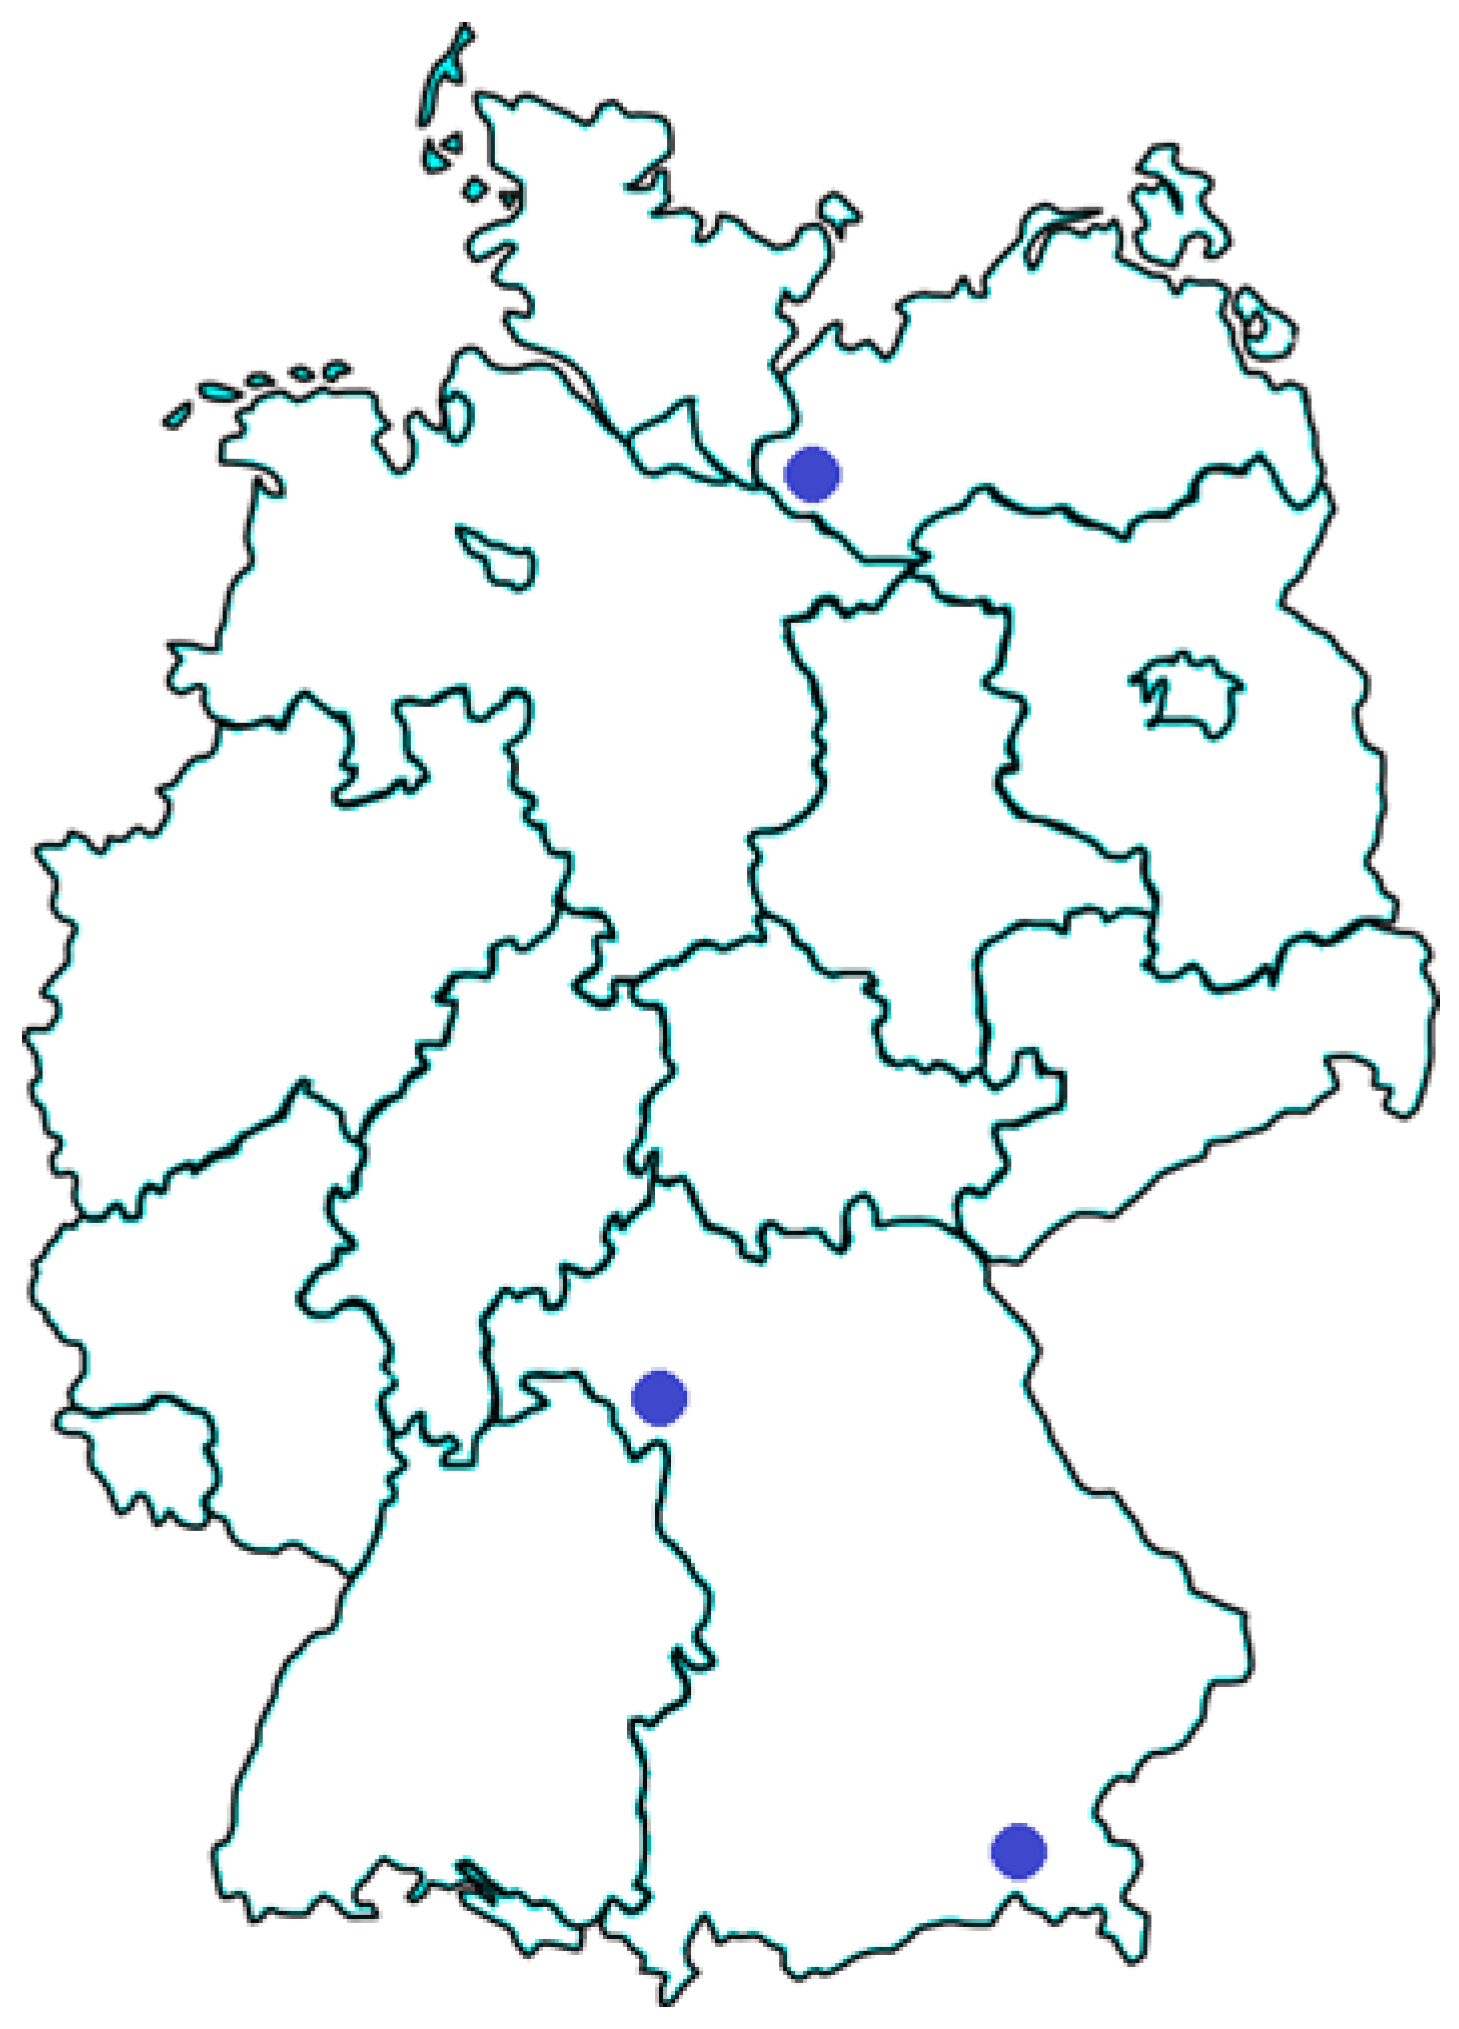
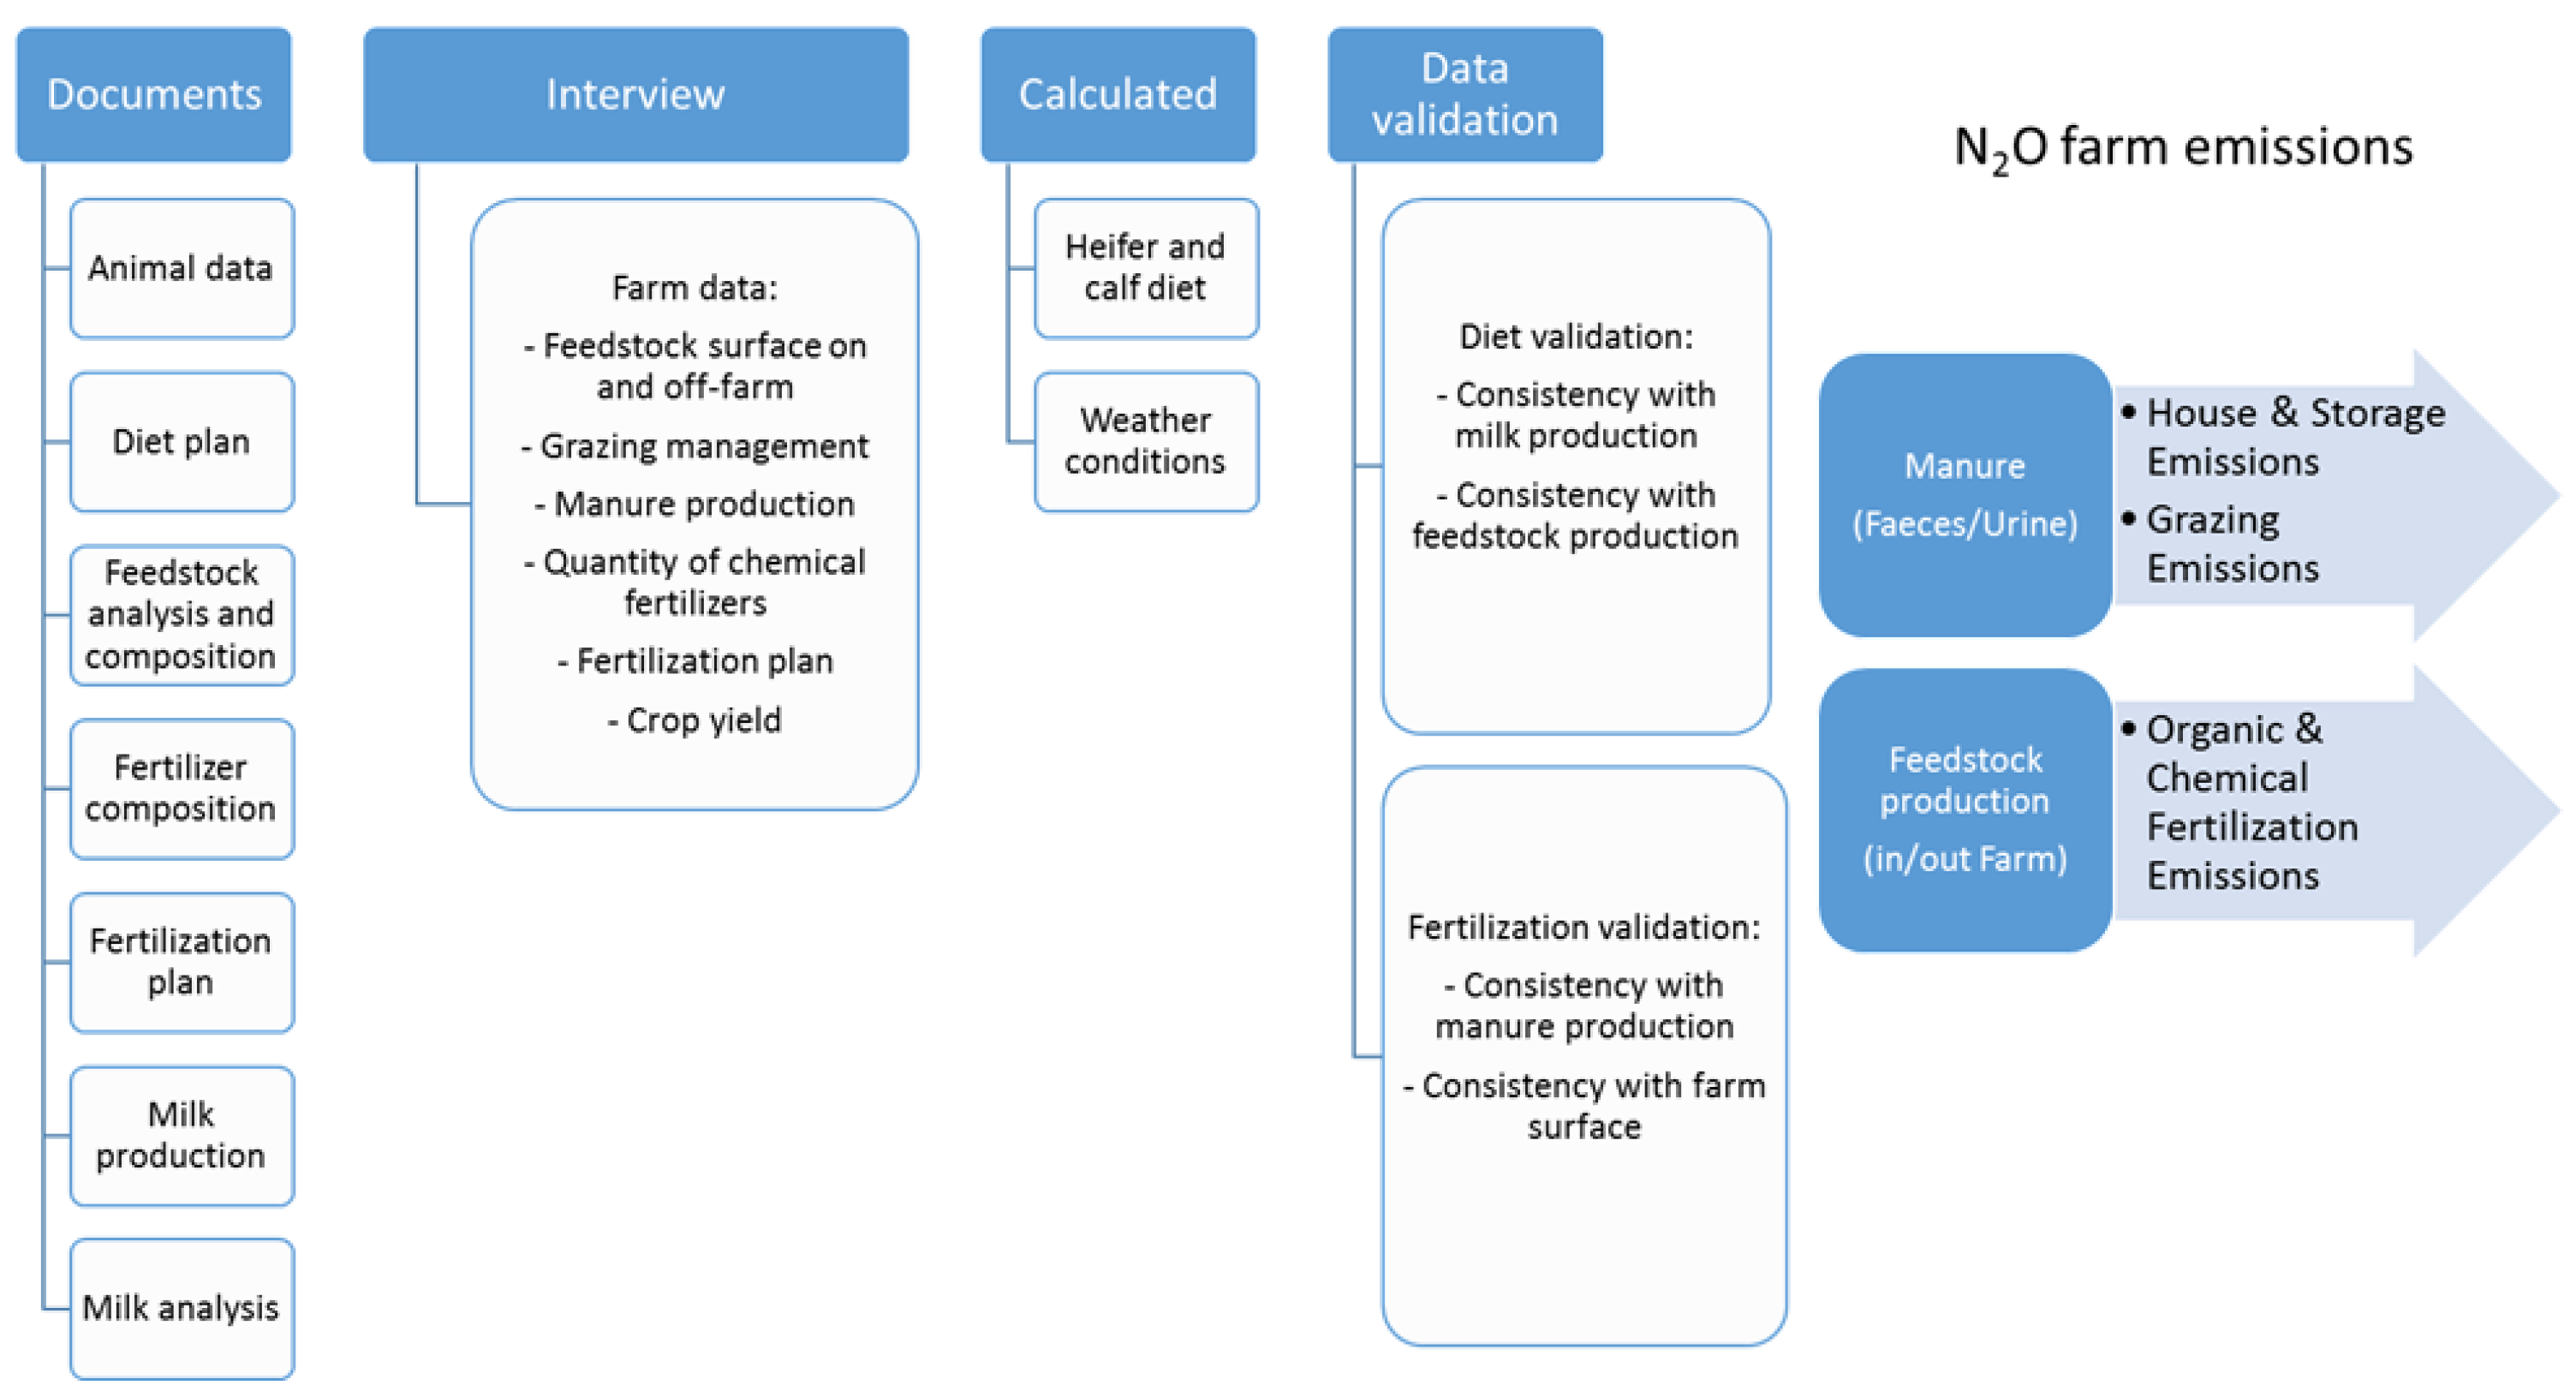
2.1. Data Collection

The farm data were collected over a period of 24 months from 21 dairy farms located in three German regions (north, central and south; see Figure 1), which can be considered to represent the dairy farm variability in these regions in terms of animal breed, farm dimensions, feed production and quality, fertilisation, manure management and climate. The data were collected in situ from the farms’ documentation and through personal interviews with the farmers, as reported in detail in Figure 2, in order to obtain all relevant information to estimate the total N2O emissions of the farms.
Information was collected on the following aspects of farm management: milking cow number and reproductive cycle, milking cow diets, feedstuff quantity and quality, grazing management, crop production and fertilisation, purchased inputs (off-farm feedstuffs and chemical fertilisers), manure management, milk production and quality, total farm surface (TFS; including both the surface used for the animal feedstuff production and the surface used for the production of crops for other purposes) and in-farm and off-farm feedstuff surface (FS; calculated as the sum of the total surface necessary for the production of all in-farm and off-farm feedstuffs used to feed the milking cows, the heifers and the calves in the farm). Monthly milk analyses and productions were collected from the farms delivering the milk. Weather condition data were obtained from the Deutscher Wetterdienst (www.dwd.de, accessed on 17 November 2020) archive. The N2O emissions from crop residues were not included in the calculation because of their minimal contribution to the total farm emissions [15]. Also, the indirect N2O emissions were not considered, they were not connected directly with the farms under study. In the following sections, we describe in detail how the farm data were collected, controlled and, when necessary, corrected.

2.2. Diet for Milking Cows

The milking cow diets during the lactating period and the dry period were determined on the basis of the diet plans of the farms, which record the feedstuff used in the diet, the quantity and the period. For all feedstuffs produced on the farm, chemical and nutritional analyses were available; for the commercial feedstuffs, the chemical composition was provided. Using this very detailed information, the diets were verified for each farm against the net energy lactation (NEL) and the digestible protein (nXP) values corresponding to reported milk yields and then consequently adjusted to account for actual feedstuff usage.
For the nutritional composition of the fresh grass during the grazing period, values from the literature were used [16,17]. For statistical analysis purposes, feedstuffs were classified as grass, leguminous grass, maize or other cereals.

2.3. Diets for Heifers and Calves

The younger animals were grouped as follows: calves up to 6 months of age, heifers up to 2 months prior to the first calving and heifers from 2 months prior to the first calving to the calving. No detailed heifer and calf diets were recorded on the farms, but the information about the farm organisation was sufficient to recreate and estimate the diets for these groups of animals on the dairy farms. The heifer diet was elaborated for each farm based on all the information obtained from and the feedstuff used on that specific farm. To estimate the final heifer body mass for each farm, we included both the milk production of the entire breeding herd (between 6000 and 10,000 kg milk produced per animal per year) and the age of the first calving. The data were then cross-referenced with heifer body mass gain per month, as reported by Hoffmann and Funk [18], to determine the intake of dry matter (DM), crude protein (XP) (both in kg an−1 y−1) and metabolizable energy (ME, in MJ an−1 y−1) needs for each heifer group according to the nutritional values reported by Weiß et al. [19] and Kirchgeßner et al. [20]. A different approach was employed for heifer diets during the final two months before first calving in order to maintain a direct link with actual farm situations [20]. Specifically, for this group of heifers the dry cow diet was used, except when farmers reported differently, such as when animals received a diet identical to the milking cows.

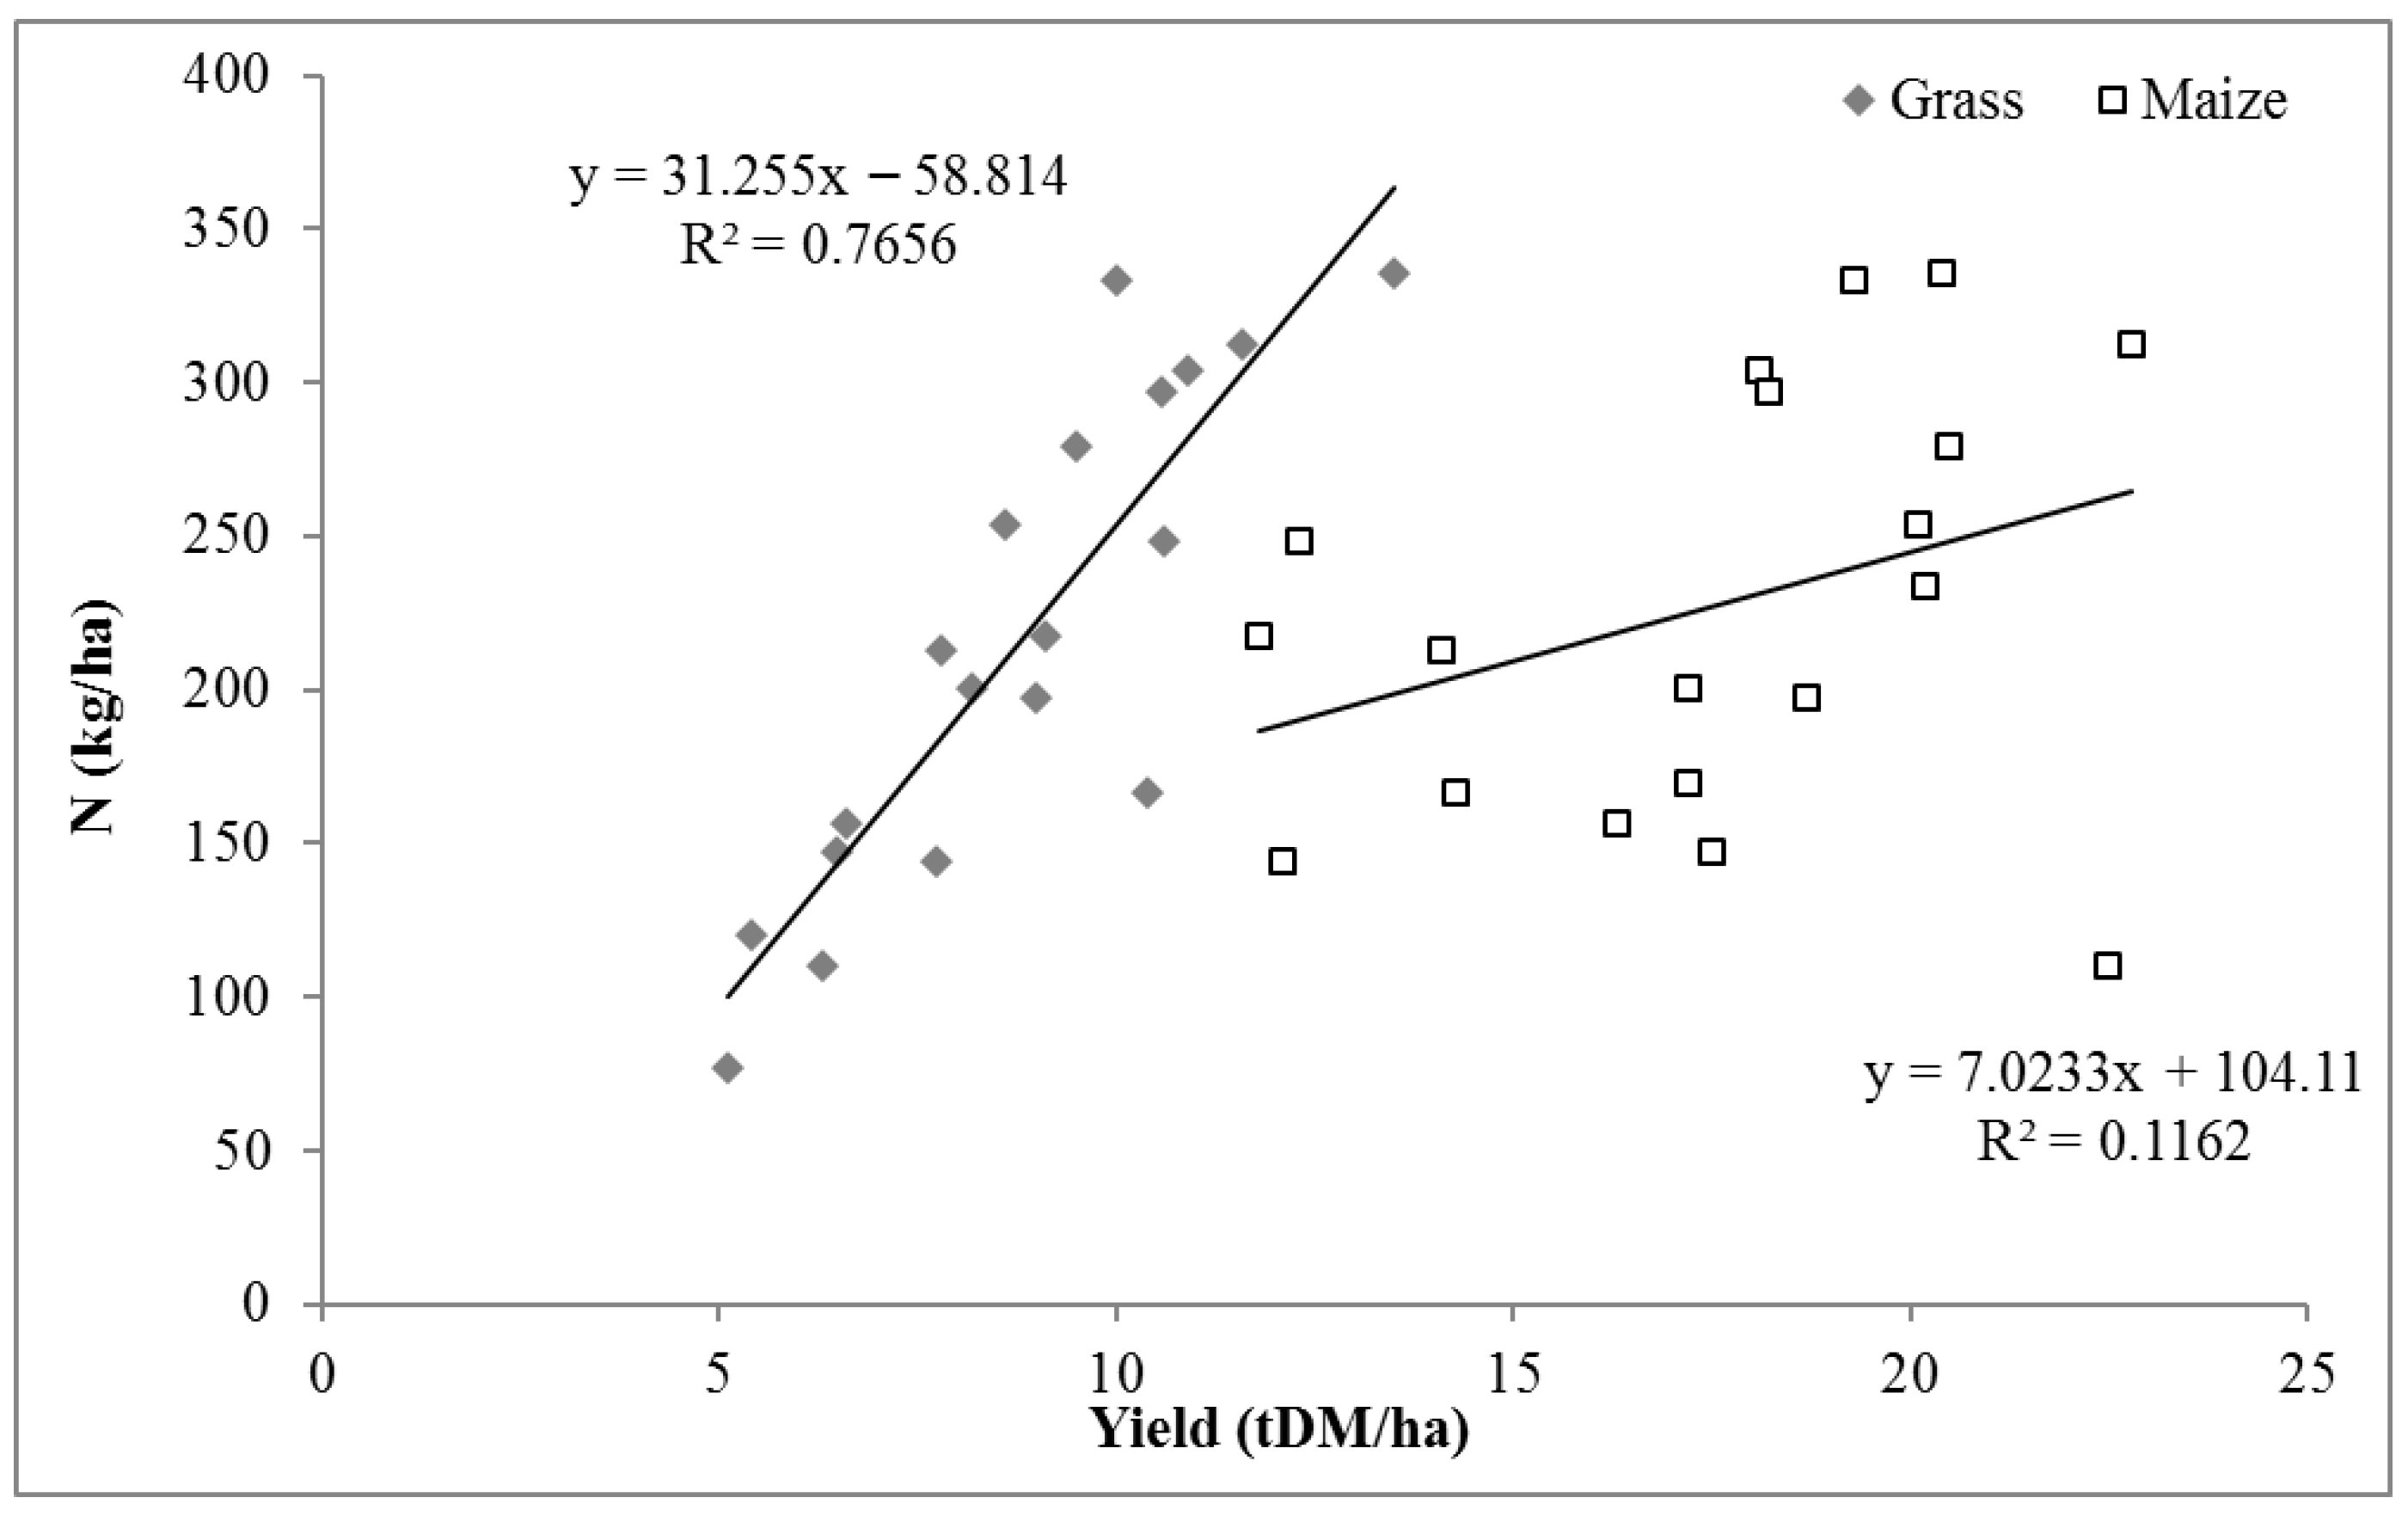
2.4. Crop Yields and Fertilisation

Cultivated feedstuff surface (expressed in ha) and yield data (expressed in t DM ha−1 y−1) collected during the interviews were verified for consistency with region-specific yield ranges [21,22]. Similarly, verifications were completed for climate conditions, including average losses during harvest and storage, which were reported as 10% for grains [23,24], 15% for maize silage [25,26] and 20% and 25%, respectively, for grass silage and hay [27]. Surfaces were delineated as total farm surface, which included the feed surface (with the accompanying surface to produce off-farm concentrate and feedstuff), feed surface per livestock unit (LSU, referred to 500 kg body mass and calculated for milking cows + heifers + calves) and feed surface per kg energy-corrected milk (ECM).
Nitrogen fertilisation (organic and chemical) necessary for cow feed cultivation, both on- and off-farm, was verified for regional agricultural practice variation, as well as crop N needs [21,22]. Corrections were made as necessary for out-of-range cases (such as fertiliser amounts below crop needs or over-fertilisation by more than 20%) [28]. In these cases, the nitrogen fertilisation was increased or reduced to the adequate quantity. Finally, organic fertilisation type (liquid as slurry or solid as manure) and amount were also checked against farm livestock units. Fertilisers were grouped according to the official IPCC guidelines [1] as: liquid organic (slurry), solid organic (manure), NP fertilisers, urea (46% N), calcium ammonium nitrate (CAN, 27% N) and NPK fertilisers (27% N).

2.5. N2O Emission Calculations

2.5.1. Excreta Calculations

The N2O emissions produced by chemical and organic fertilisation of the on-farm feedstuff crops and of the off-farm feedstuffs and concentrates were estimated for each farm as described by Haenel et al. [3]. Total emissions require inclusion of more than those applied for fertilisers; they include those released during grazing, animal housing and manure storage. For this reason, we first estimated the nitrogen excreted by the cows as the N balance in the living animal according to the following equation:
N excreted = N feed N milk N body   mass   gain N calf ,
where Nfeed is the nitrogen amount in the diet, Nmilk is the nitrogen amount in the produced milk, Nbody mass gain is the nitrogen amount in cow body mass gain and Ncalf is the nitrogen amount in calf body mass. Table 1 lists the values used for these calculations.
The milking cow body mass was collected during the interviews in the dairy farms. The body mass gain of the heifers was estimated according to Hoffman [29] for the breed Holstein and according to Andrýsek et al. [30] for the breed Fleckvieh. The body mass gain curves were adapted to the final heifer body mass, which was collected during the farm visits and double-checked with the age of the first calving and the milk production of the herd.
We calculated the fraction of N excreted in faeces using two procedures, one for milking cows and one for young cows (heifers and calves). In the case of the former, we used Equation (2), provided by Haenel et al. [3]:
m faeces = a · m feed + x N · [ b · D M + c · D M 2 ] ,
where mfaeces is the N excreted in faeces (kg N an−1 y−1), mfeed is the N intake with feed (kg N an−1 y−1), xN = 0.16 kg N kg−1 is the average N content in feedstuff crude protein and a = 40 g kg−1, b = 20 g kg−1 and c = 1.8 g kg−2 an d are empirical constants. For heifers and calves, mfaeces was calculated according to Equation (3), as presented by Dämmgen and Hutchings [33] and generally used for cattle:
m faeces = ( 1 X DE ) · m feed ,
where XDE is the ratio between the digestible energy (DE) and gross energy (GE) of the feedstuff. To complete the excreta calculation, nitrogen excreted in the urine was calculated as the difference between total N excreted (from Equation (1)) and N excreted in faeces (from Equation (2)).

2.5.2. Emission Factors

Emissions were then estimated using the same emission factors (EFs) as in the German emission inventory [3] (Table 2). We considered four main emission sources: (1) N in the chemical fertiliser (Nchem), (2) N in the organic fertiliser (Norg), (3) N in manure excreted in the animal house (Nstore) and (4) N released directly during grazing on the pasture (Ngraz).

2.5.3. Crop Fertilisation Emission Calculations

To estimate N2O emissions produced from crop fertilisation, it is necessary to subtract the other nitrogen-rich gaseous emissions from the total nitrogen pool, namely nitrogen monoxide (NO) and ammonia (NH3) [3]. The emission factors are dependent on the climate and on the distribution system used; the yearly mean temperatures for each location were considered as well as the fertiliser distribution systems employed in the farms. Ultimately, the conversion of the N source to N2O emissions is the total N minus the N fraction lost as ammonia and NO emissions. We relied on the following formulae for our determination:
  • Application of chemical fertiliser:
( N 2 O-N ) chem = N chem · ( 1 E F NH 3 chem E F NO chem ) · E F N 2 O chem ;
  • Application of organic fertiliser:
( N 2 O-N ) org = N org · ( 1 x TAN · E F NH 3 org E F NO org ) · E F N 2 O org ,
where xTAN is the fraction of total ammoniacal nitrogen within Norg.
Indirect N2O emissions, such as those from N fixation and deposition, were not included in the calculations because they are negligible and not significantly different among farms. The grassland renewal was not included as a source of N2O in the calculations because in all the analysed farms, wherever grassland was present, it was permanent grassland.

2.5.4. Housing-, Storage- and Grazing-Related Emissions Calculations

To estimate the N2O emissions produced from housing the animals and storing the manure prior to crop application, as well as N2O emissions released during pasture grazing, we employed the following equations:
  • Housing and storage prior to application:
( N 2 O-N ) store = N store · E F N 2 O store ;
  • Release during grazing:
( N 2 O-N ) graz = N graz · E F N 2 O graz

2.5.5. Farm Input Emission Calculations

The N2O emissions connected to the cultivation of the purchased feedstuff of the animal diets were also included in the calculations. For the purchased feedstuff, standard fertilisations were used for the calculations of N2O emissions, as reported in [21]. Furthermore, for each purchased feedstuff, an economic allocation value (LCA Archive) was also determined, as reported in Table 3, and introduced into the calculations in order to consider the contributions of each purchased feedstuff to the N2O emissions of the farm.

2.5.6. Emission Categories and CO2 Equivalents

Emissions were calculated for the following animal categories: lactating cows, non-lactating (dry) cows, heifers 2 months before calving, heifers up to 2 months before calving and calves up to 6 months old. For four of the five farms in the northern region, the lactating cows were divided into three sub-groups according to feeding: high milk production cows, low milk production cows and primiparous cows. Estimated N2O emissions were turned into CO2 equivalents with a conversion factor of 298 kg CO2eq kg−1 N2O [1] and scaled using as a functional unit of 1 kg ECM (energy-corrected milk, with 4% fat and 3.3% protein).

2.6. Statistical Anaylsis

Farm data related to breeding conditions, cow diets and cow feed cultivation were log-normalised when they were not of normal distribution. Regional mean values were compared by means of a one-way ANOVA analysis followed by a Tukey’s HSD test (α = 0.05).
Estimated N2O emissions were also compared within the three regions and further tested for dependence on pasture (with or without pasture) and cow breed (Holstein Frisian vs. Bavarian Fleckvieh) via a t-test (α = 0.05). In addition, the dependence of the estimated N2O emissions on the farm management conditions (diet composition, feed nutrient contents, crop yield, applied fertiliser type) was tested via a multiple linear model:
y   ~   β 0 + i β i · x i ,
where y = (N2O)tot (kg CO2eq kg−1 ECM) and the possible predictors xi included the diet protein content, the maize and grass amount in the diet and the maize and grass yield, as well as nominal variables describing manure quality (solid vs. liquid) and grazing habits (yes/no). Several models with different choices of predictors were fitted via ordinary least squares regression and the results were compared concerning the significance of the fitting parameters and the AIC coefficient. All the analyses were performed using the statistical program JMP version 14 (SAS Institute Inc., Cary, NC, USA).

3. Results and Discussion

3.1. Description of the Farms

The characteristics of the analysed farms are described in Table 4 and Table 5. The farms contained two different breeds that related to their region: Holstein Friesian in the north, Bavarian Fleckvieh in the other two regions. Farm size (animal numbers) was highly variable among the farms; the largest farms were situated in the northern region, while the central region was characterized by smaller farms with an average of around 30 milking cows. In the southern region, most of the farm had between 40 and 60 milking cows, with the exception of a very small farm (S8, with 16 milking cows) and a larger one (S4, with 102 milking cows).
Despite the large differences in farm herd size, some key parameters of the reproductive cycle management of the animals were quite similar across all analysed farms, such as the age of first calving (mean value 28.6 ± 0.8 months) and the dry period (50 ± 7 days). Animal lifespan (5.4 ± 0.9 years) also showed no significant differences among farms; only in the smallest farms in both the southern (S8) and northern regions (N3) did cows grow older (>7 years), but that did not lead to any strong overall correlation between cow lifespan and farm size. On the contrary, the productive cycle length was quite different among both farms and regions and was slightly (R2 = 0.35) correlated to the farm dimension.
Although the milking cow diet highly differed between the regions and within the regions, neither the dry matter intake (mean 18.3 ± 1.3 kg DM d−1) of the animals nor the dietary protein intake (mean 2.8 ± 0.3 kg XP an−1 d−1) nor the energy content (mean 6.6 ± 0.2 MJ NEL kg−1 DM−1) showed any significant difference. These dry matter intake (DMI) values are adequate for the animal body mass and the milk production [42].
A detailed analysis of the feedstuff comprising the diets was performed and made some variations clearly visible. Grass was the main feedstuff of the diets for the milking cows in the southern region, representing more than 40% of the diet, with a maximum of about 50% in one farm (S1); the typical source of the grass silage were permanent grasslands mainly characterised by gramineae. At four southern region farms, milking cows remained on the pasture most of the year (part of the spring, the entire summer and autumn), so that the fresh grass consumed during grazing represented about 25% of DMI on average. Small amounts of hay (5.4% of total DMI on average) and straw (1.1% of total DMI on average) were also present in the diet, of which the hay contribution varied most (0.8 to 14.2%). On average, maize represented nearly 21.4% of DMI.
The farm diet in the northern region was quite similar to that of the southern region; the only exception was the significantly lower hay content (less than 1%). Pastures were used for milking cows only in one farm, where they represented 30.4% of the dietary DM; the other northern farms had grazing available for heifers only.
In the central region, the milking cow diet differed from the other two regions, mainly because of the very low amount of grass as feedstuff in the diets and the complete absence of pasture. The grass also differed in quality, being mainly leguminosae (alfalfa) with a high N content. The main feedstuff in the animal diet was maize (42.8% on average).
Despite the high variation in dietary composition across the farms, the milk yield per animal and year did not differ. We attribute this to the homogeneity of the dietary intakes of protein, energy and DM among the farms, which are the major factors determining milk production [19].
Detailed information about the milking cow diet and the milk production is extremely important in order to elaborate the N2O estimation. In our study the two parameters DMI and milk production were well-correlated (R2 = 0.64). In order to also include the grazing in the diet, which for some farms can represent a large portion of the diet, the data collected on the farms had to be further supplemented with data from literature and cross-checked with the crop production and the milking cow diet. At the same time, the information about the heifers and the calves was also very sparse and had also to be reconstructed from literature data. The same difficulty has occurred in other similar studies, where information about grazing and younger animals had to be estimated in the same way [6,9,43].
The (absolute) feed surface was very variable among the farms but correlated well with the size of the herd (Table 6) and was correspondingly much larger in the northern region; on the other hand, the unitary surface, both per livestock unit (LSU) and per kg ECM, was very homogeneous among the farms, respectively 0.76 ± 0.1 ha LSU−1 and 1.68 ± 0.32 m2 kg−1 ECM.
The in-farm feedstuff surface corresponded to the total farm surface only in very few farms that had almost complete internal feedstuff production and very low concentrate use. On all other farms, only a portion of the farm surface was used for internal feedstuff production, and the remainder was cultivated with cereals for sale, either to the food industry, to other farms or to biogas plants (particularly in the north).
Permanent grassland amounted to more than 50% in the south and only 4.7% in the central region; in the central region, the surface was cultivated primarily with leguminosae (11.6%) and maize (19.6%). Pasture surface, reserved mainly for heifers, was present on half of the farms and only in the southern and northern regions. On three farms (S6, S7 and S8), some of the permanent grassland consisted of alpine pastures which were used for grazing and were not fertilised.
The crop yields did not demonstrate any region-specific differences, except for the grassland yield being higher in the south, since the weather conditions lengthen the harvest period and thus the number of cuttings is increased (between four and six cuttings per year in south Germany, no more than three in north Germany).

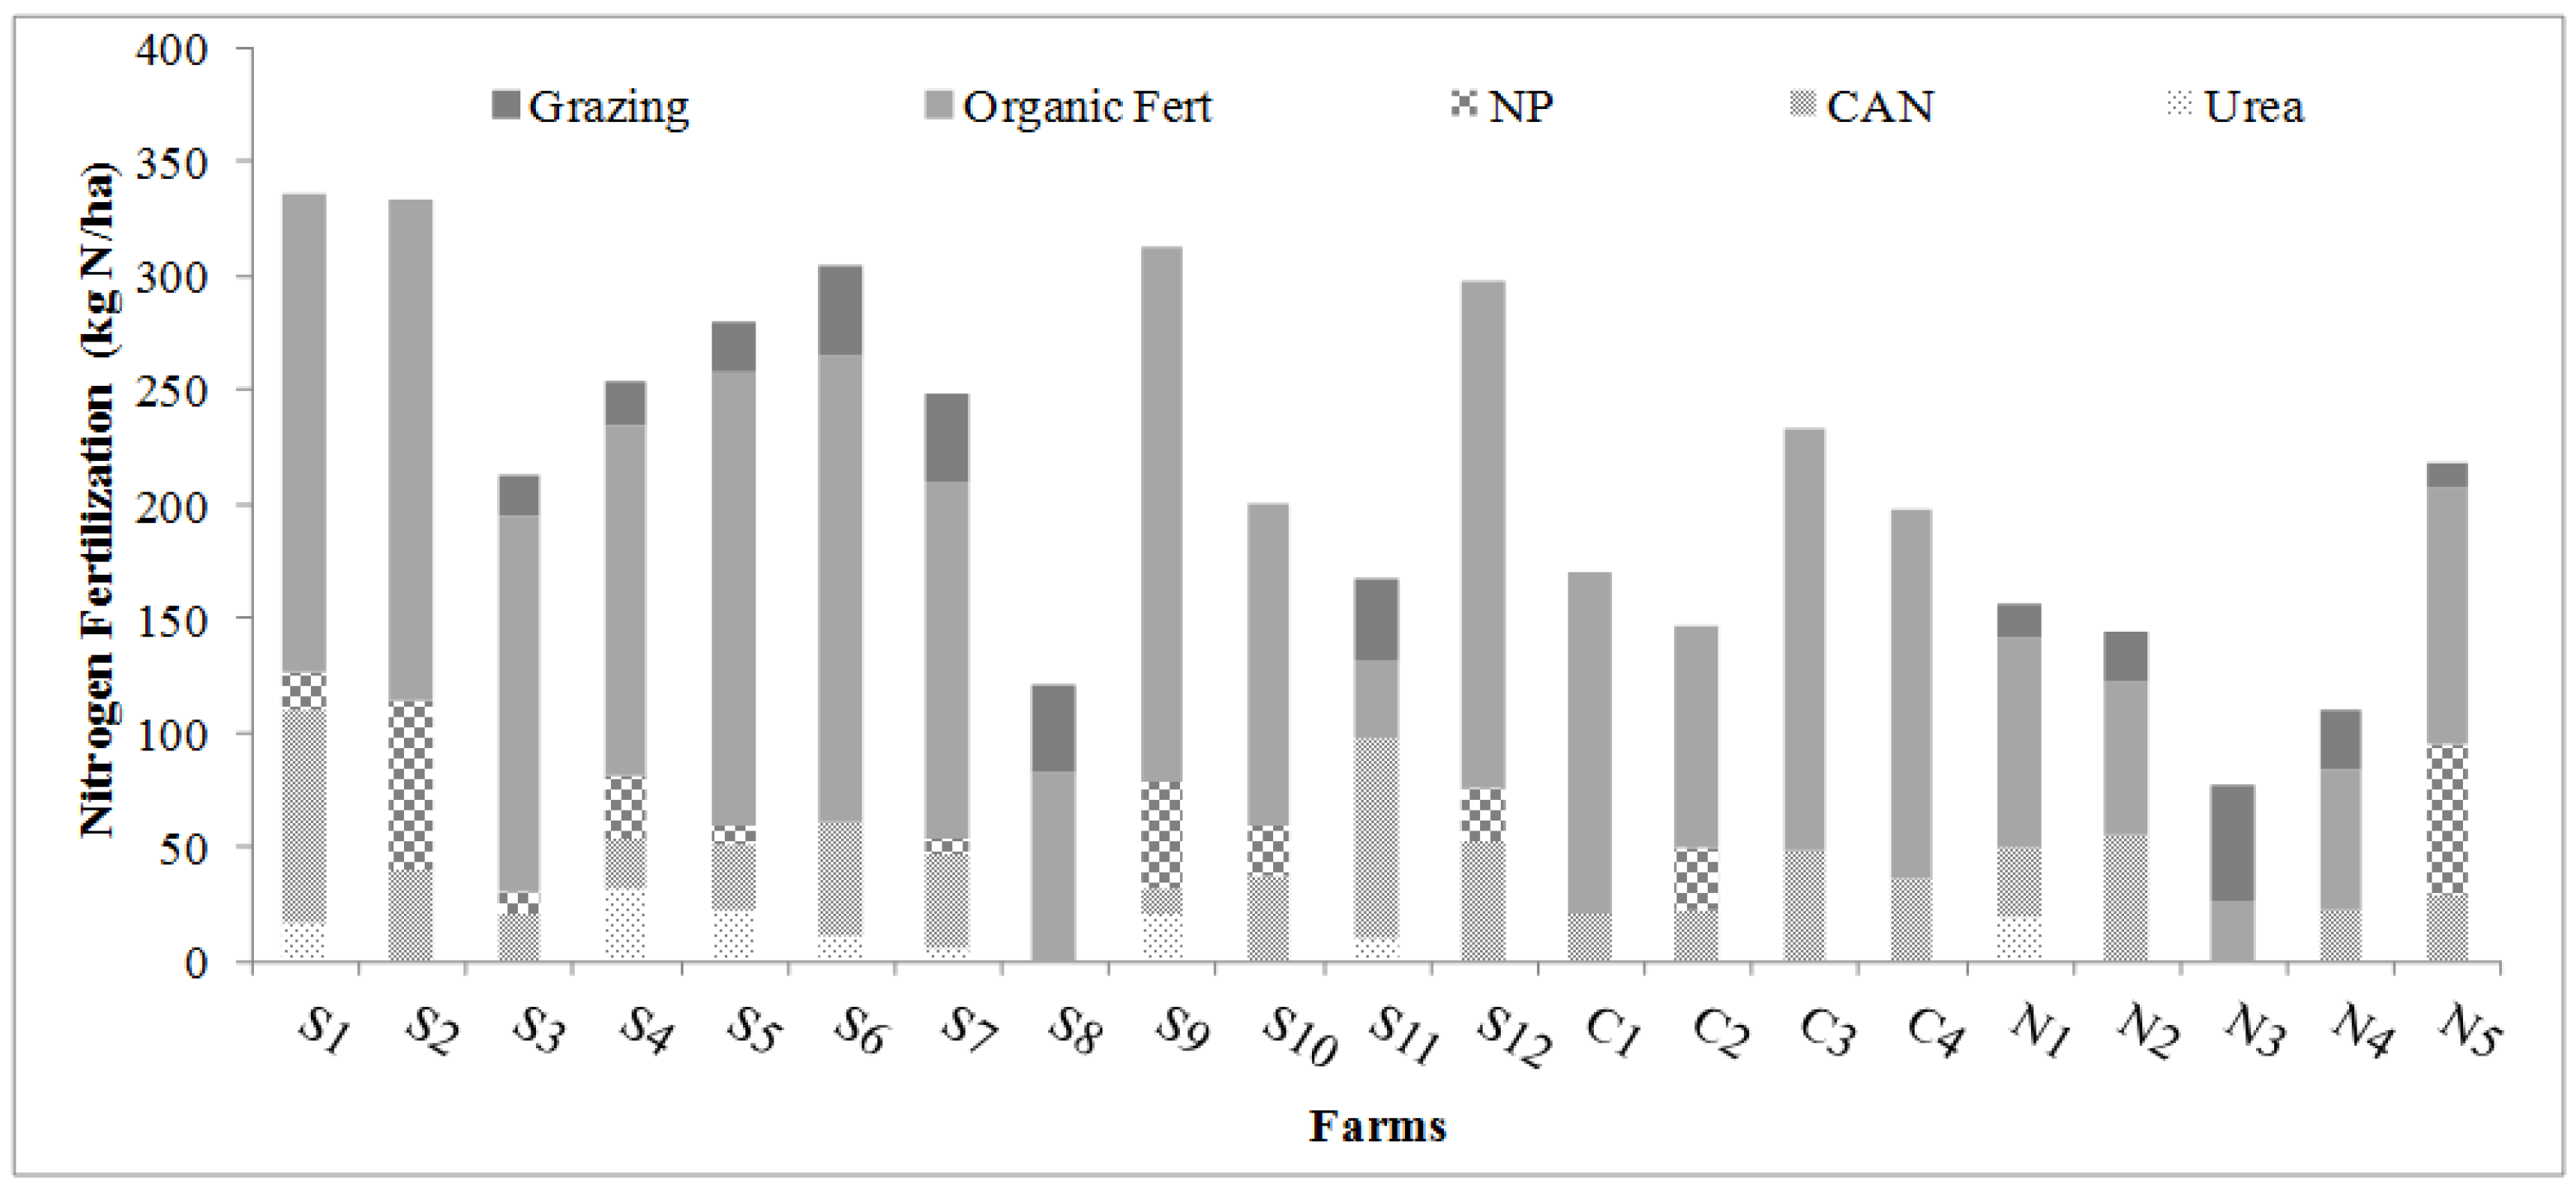
3.2. Nitrogen Fertilization

Nitrogen fertilisation is one of the largest sources of N2O emissions in a breeding farm. The ratio of organic to chemical fertilisers used on a farm is fundamental for a robust emissions calculation because of their differing emission factors (EFs). The chemical fertiliser type and the timing of its application affect its EF value and, consequently, its atmospheric N2O emissions [3].
The type of N fertilisation employed, treatment period, and dosage was assessed in detail for each farm. Figure 3 indicates the distribution of fertilisers used in each farm, expressed as kg N ha−1. In general, large differences in N fertilisation were not detected among the farms for the main cultivated crops (Table 7), except in the southern region, where the N amount for crop fertilisation for the permanent grassland (including the grazing surface) was significantly higher compared to the other two regions; this was particularly true for the N obtained from slurry organic fertilisation. As already explained, in the south the grass yield is higher than in the other German regions because of the weather, which means that more cuts can be made during the year. In the farms in the northern and central regions, the low N fertilisation is correlated respectively to the lower crop and grassland yields (with a few exceptions) and the large alfalfa cultivation.
Generally, about 75% of the total N distributed on fields was organic and provided by fertilisation or grazing. The organic N source was usually slurry, except for farms S8 and N2, where solid manure was employed. Solid manure has a higher emissions factor compared to slurry and its use as organic fertiliser can affect the total emissions coming from the field fertilisation [44]. Only two farms (S8 and N3) used organic fertiliser exclusively, which resulted in very low N quantities; these farms were the most extensive, as evidenced by feed-specific surfaces of 3.7 and 1.7 m2 kg−1 ECM, respectively. The most common N fertiliser was CAN, which is not surprising given its low price, ease of distribution and high N content; some farms also used NP fertiliser and a few used urea, but in low doses in order to limit the risk of its alkalinity burning crop tissues.
Maize and grass are the basic components of cow diets and could be expected to have a strong effect on farm N fertilisation amounts; surprisingly, only grass yield was correlated to mean total N fertilisation per hectare, but not maize yield (Figure 4). This was probably due to the lower N fertilisation of maize in comparison to grass N fertilisation and also because of the few farms with maize-based diets, just 4 out of 21 farms.
The largest areas of the considered farms were covered by permanent grassland, which also utilised the largest N fertilisation amounts in this study. Coherently with that, it so happens that detailed and precise information on grassland N fertilisation can provide a rough and ready estimate of the total N needed to produce the feedstuff for the full complement of milking cows.

3.3. N2O Soil Emissions from Individual Feedstuffs Versus Standard Fertilisation

The soil N2O emissions for all main diet feedstuffs were estimated for each single farm [28]. The estimated values (Table 8) were very close to standard fertilisation values presented by the KTBL (Kuratorium für Technik und Bauwesen in der Landwirtschaft e.V.) [21], with some slightly higher values that we ascribed to the N over-fertilisation described in our study. Grass silage was sub-grouped into gramineae-based grass silage (GRAM) and leguminosae-based grass silage (LEG), in accordance with their different required N fertilisation amounts.
The mean value of N2O emissions released directly into the atmosphere from GRAM using both organic and chemical N fertilisers was 0.277 kg N2O-N t−1 DM, which was slightly higher than the reference value of 0.247 kg N2O-N t−1 DM, which relied only on CAN as chemical fertiliser. Data on N2O soil emissions alone are present in the current literature; calculations usually consider total GHG emissions. A study by Larsson et al. [45] that experimentally estimated field GHG emissions from GRAM and LEG at different N fertiliser doses cited results very close to those obtained in the present study: in particular, 0.263 kg N2O-N t−1 DM for GRAM at the highest N dose (150 kg N ha−1) and 0.0132 kg N2O-N t−1 DM for unfertilised GRAM, which compare well with the value we obtained for the very low N fertilisation required for alfalfa silage. Maize silage direct N2O emissions were about 33% lower than those obtained for GRAM, which verified the previous results in terms of N2O emissions for the grass-based and maize- and grass-based milking cow diets.
Among the cereals, the lowest N2O emissions were from triticale, as can be expected due to its lower N needs. Barley and wheat were at values of 0.238 and 0.249 kg N2O-N t−1 DM, respectively, which closely approximated each other. According to the KTBL [21], standard fertilisation for wheat is very high, and the value they provide did not compare well with the value we calculated, as the KTBL considered N fertilisation specifically for wheat used for bread production.

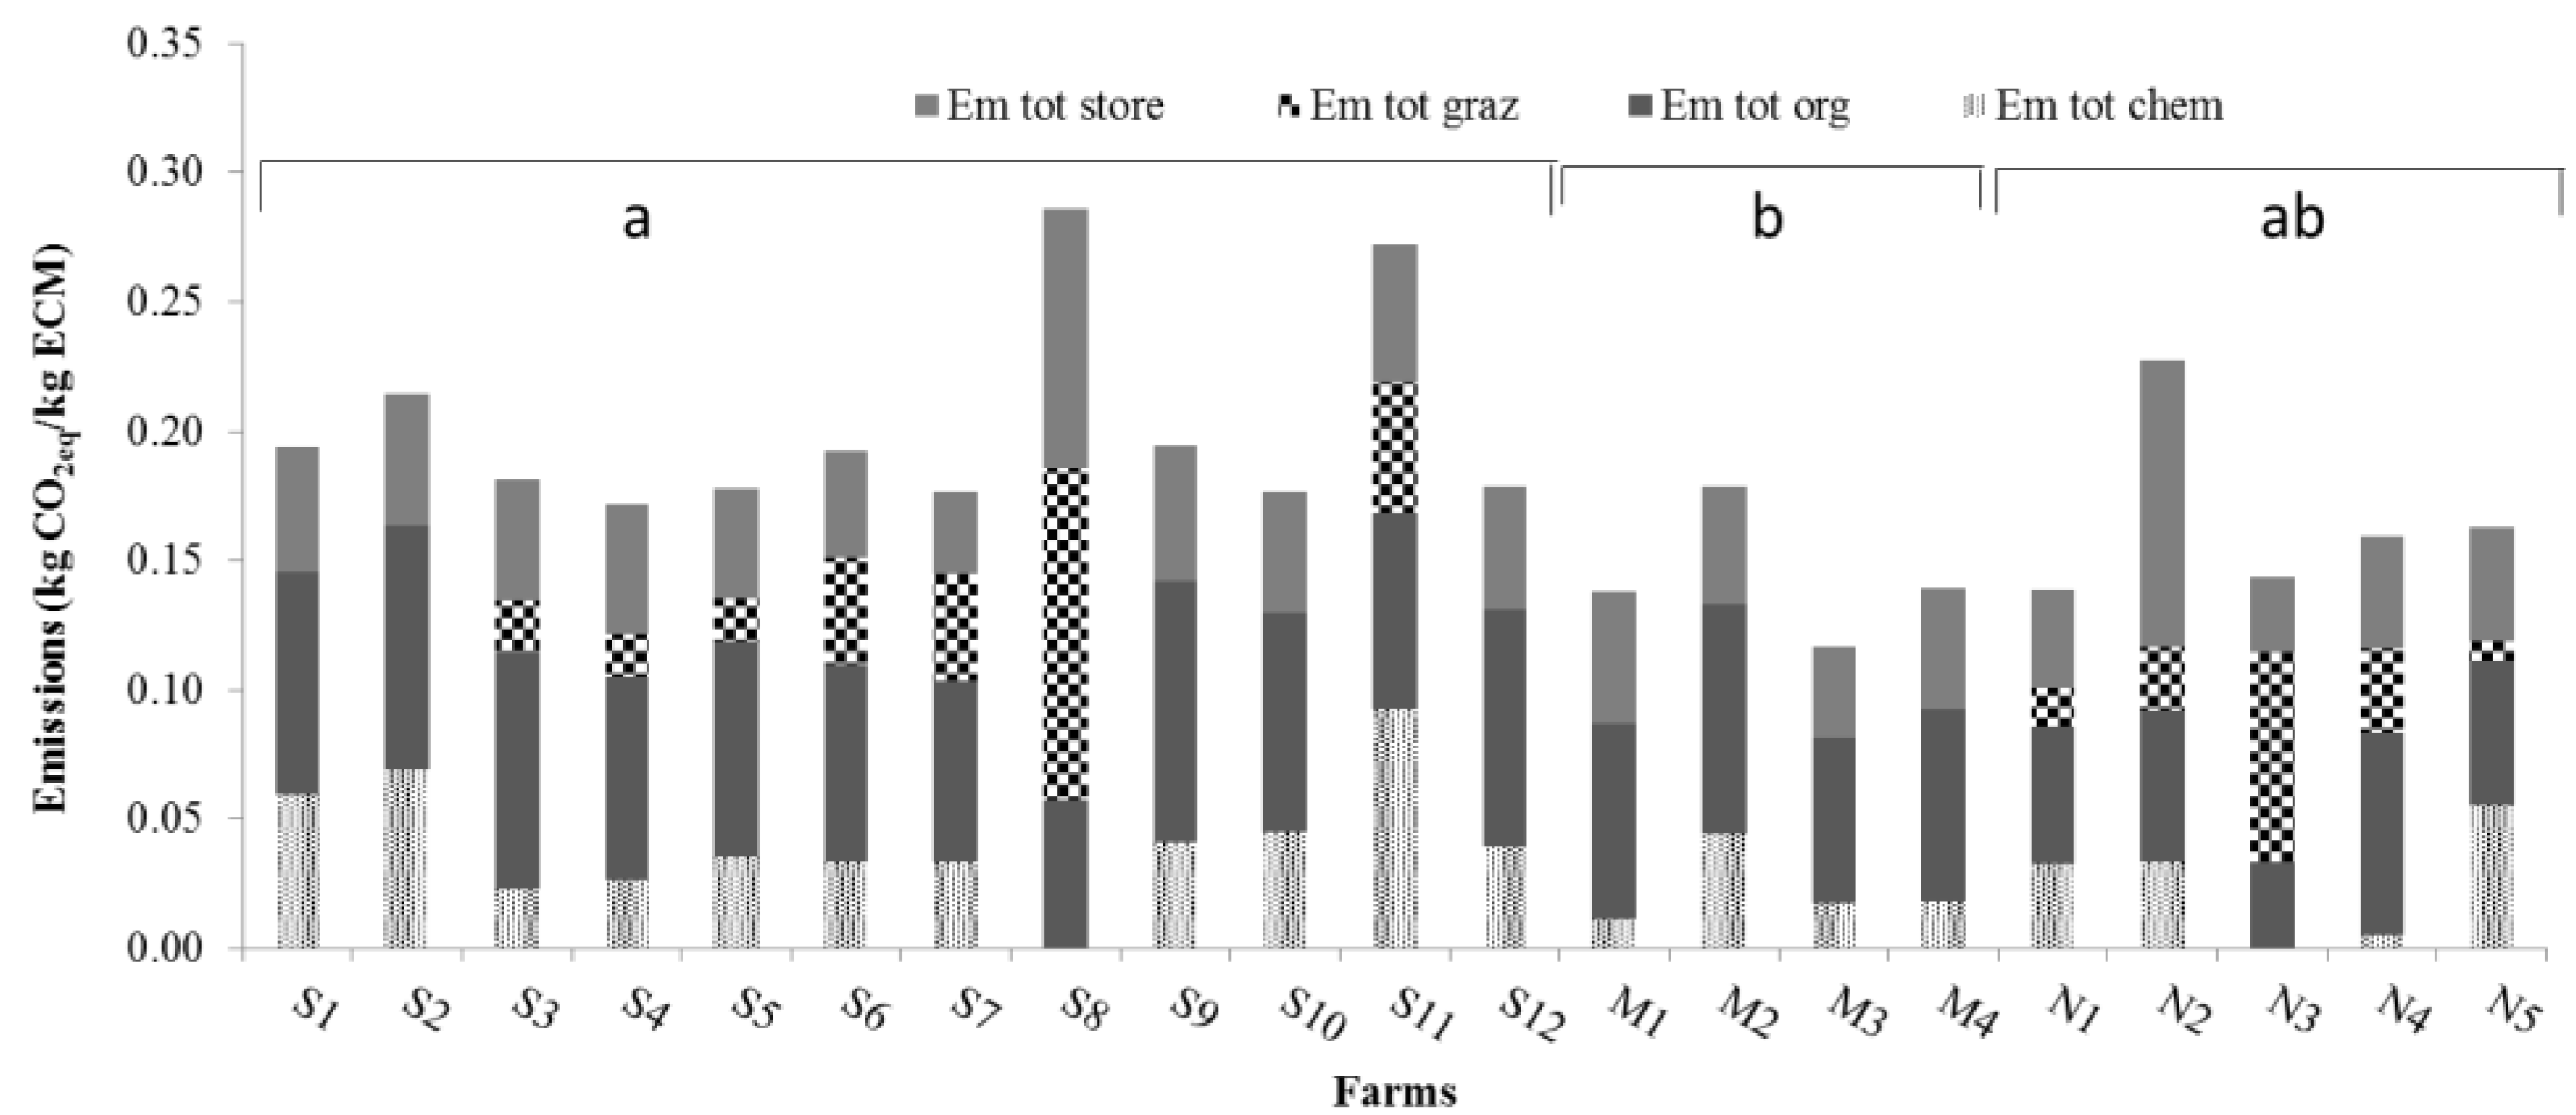
3.4. N2O Emission Estimation for the Analysed Farms

The N2O emissions for all analysed farms, expressed as kg CO2eq kg−1 ECM, are shown in Figure 5. Total emissions per farm included both milking cows’ and younger animals’ (heifers and calves) emissions, together with emissions associated with the off-farm concentrate production. The values for the single farms ranged between 0.11 and 0.29 kg CO2eq kg−1 ECM (mean value 0.18 ± 0.04 kg CO2eq kg−1 ECM), with the lowest values observed in the farms in the central region due to the substitution of permanent grassland with leguminosae crops, except for farm C2, which had a quite high amount of grass silage in the diet and high chemical fertilisation. The highest values were concentrated in the southern region, in particular farms S8 and S11, the two farms with the lowest milk production (16 kg ECM an−1 day−1); furthermore, farm S8 employed solid manure as organic fertiliser, which is characterised by higher N2O emissions compared to slurry [1].
Compared to other studies, these German farm results are in line with the usual range for dairy farms in northern Europe, as reported by Kristensen et al. [46] (between 0.1 and 0.4 kg CO2eq kg−1 ECM) and Bonesmo et al. [9] (0.11 to 0.41 kg CO2eq kg−1 ECM).
Nitrous oxide emissions from fertilisation averaged 60% of total N2O emissions and were as high as 70% in the farms without pasture. On the farms where cows and heifers grazed most of the year (S8 and S11), emissions expressed per kg ECM were particularly higher (0.19–0.27 kg CO2eq kg−1 ECM), due to the lower milk production (around 16.0–16.5 kg ECM an−1 d−1) [47]. However, a different scenario emerged when considering emissions per unit cultivated surface, which were significantly lower for all farms with large grazing surfaces and high pasture use.
The N2O emissions from fertiliser storage were at most 30% of total N2O emissions. Only two farms had higher values, S8 (35%) and N2 (49%), likely due to their use of solid manure as organic fertiliser, the EFstorage of which is nearly twofold that of the liquid slurry distributed on the other farms. Transitioning to a slurry-based management system would reduce the N2O emissions from storage in these instances by 40%.
The effect of concentrates was highly variable among the farms. Concentrates had a share in the milking cow diets between 15 and 30%; the emissions originated by the concentrates ranged between 9 and 19%. In just one farm, where the milking cow diets were based almost totally on grass silage and pasture (S6), the amount of concentrate in the milking cow diet was really low, about 4%, but this had no particular effect on the total N2O emissions of the farm.
An analysis of total farm N2O emissions per unit of milk demonstrated a significant difference between southern farms (0.20 kg CO2eq kg−1 ECM) and central ones (0.14 kg CO2eq kg−1 ECM). The same analysis failed to highlight any significant difference when only milking cow emissions were considered. This result is interesting because it highlights two different aspects of the analysis of the farm data. The first aspect is that despite the large non-uniformity of the selected farms in terms of dimensions, management systems, weather conditions, manure management and fertilisation, the N2O emissions remained very comparable, except for a few cases, such as S8 and S11, where the milk production was very low (less than 6000 kg ECM an−1 y−1). The second aspect is the relevance/importance of collecting detailed farm-scale data on the number of young animals—heifers in particular—and their management when estimating N2O emissions: milking cow characterisation alone is inadequate, not only for calculating total emissions, but also when other parameter effects need unmasking. The contribution of the heifers in terms of N2O emissions in the analysed dairy farms ranged between 12 and 32% and was correlated primarily with the length of the reproductive cycle (R2 = 0.61). The heifer management in the dairy farms was not as standardized as for the milking cows and was always strictly linked to pastures when they were present on the farm; for this reason, this contribution can make a large difference in the farm N2O emissions.

3.5. Effects of Management Conditions on N2O Emissions

3.5.1. Emission Sources

The principal N sources for dairy farms were organic fertilisers (slurry and solid manure), which together typically represented more than 70% of N supplied to crops.
Concerning chemical fertilisers, according to the reported gas emissions factors, the CAN-derived N2O emissions were slightly higher than those from NP because of the lower EFNH3 and the consequent higher amount of N as a source for the N2O emissions [3]. The substitution of NP or CAN with urea would reduce N2O emissions by 11.6% or 10.9%, respectively. For the same amount of N spread on the field, the use of NP or urea might thus be a way to mitigate the N2O emission to the atmosphere, as also reported in other studies [48,49]. A limitation of such a mitigation strategy would, however, be the higher NH3 emissions.

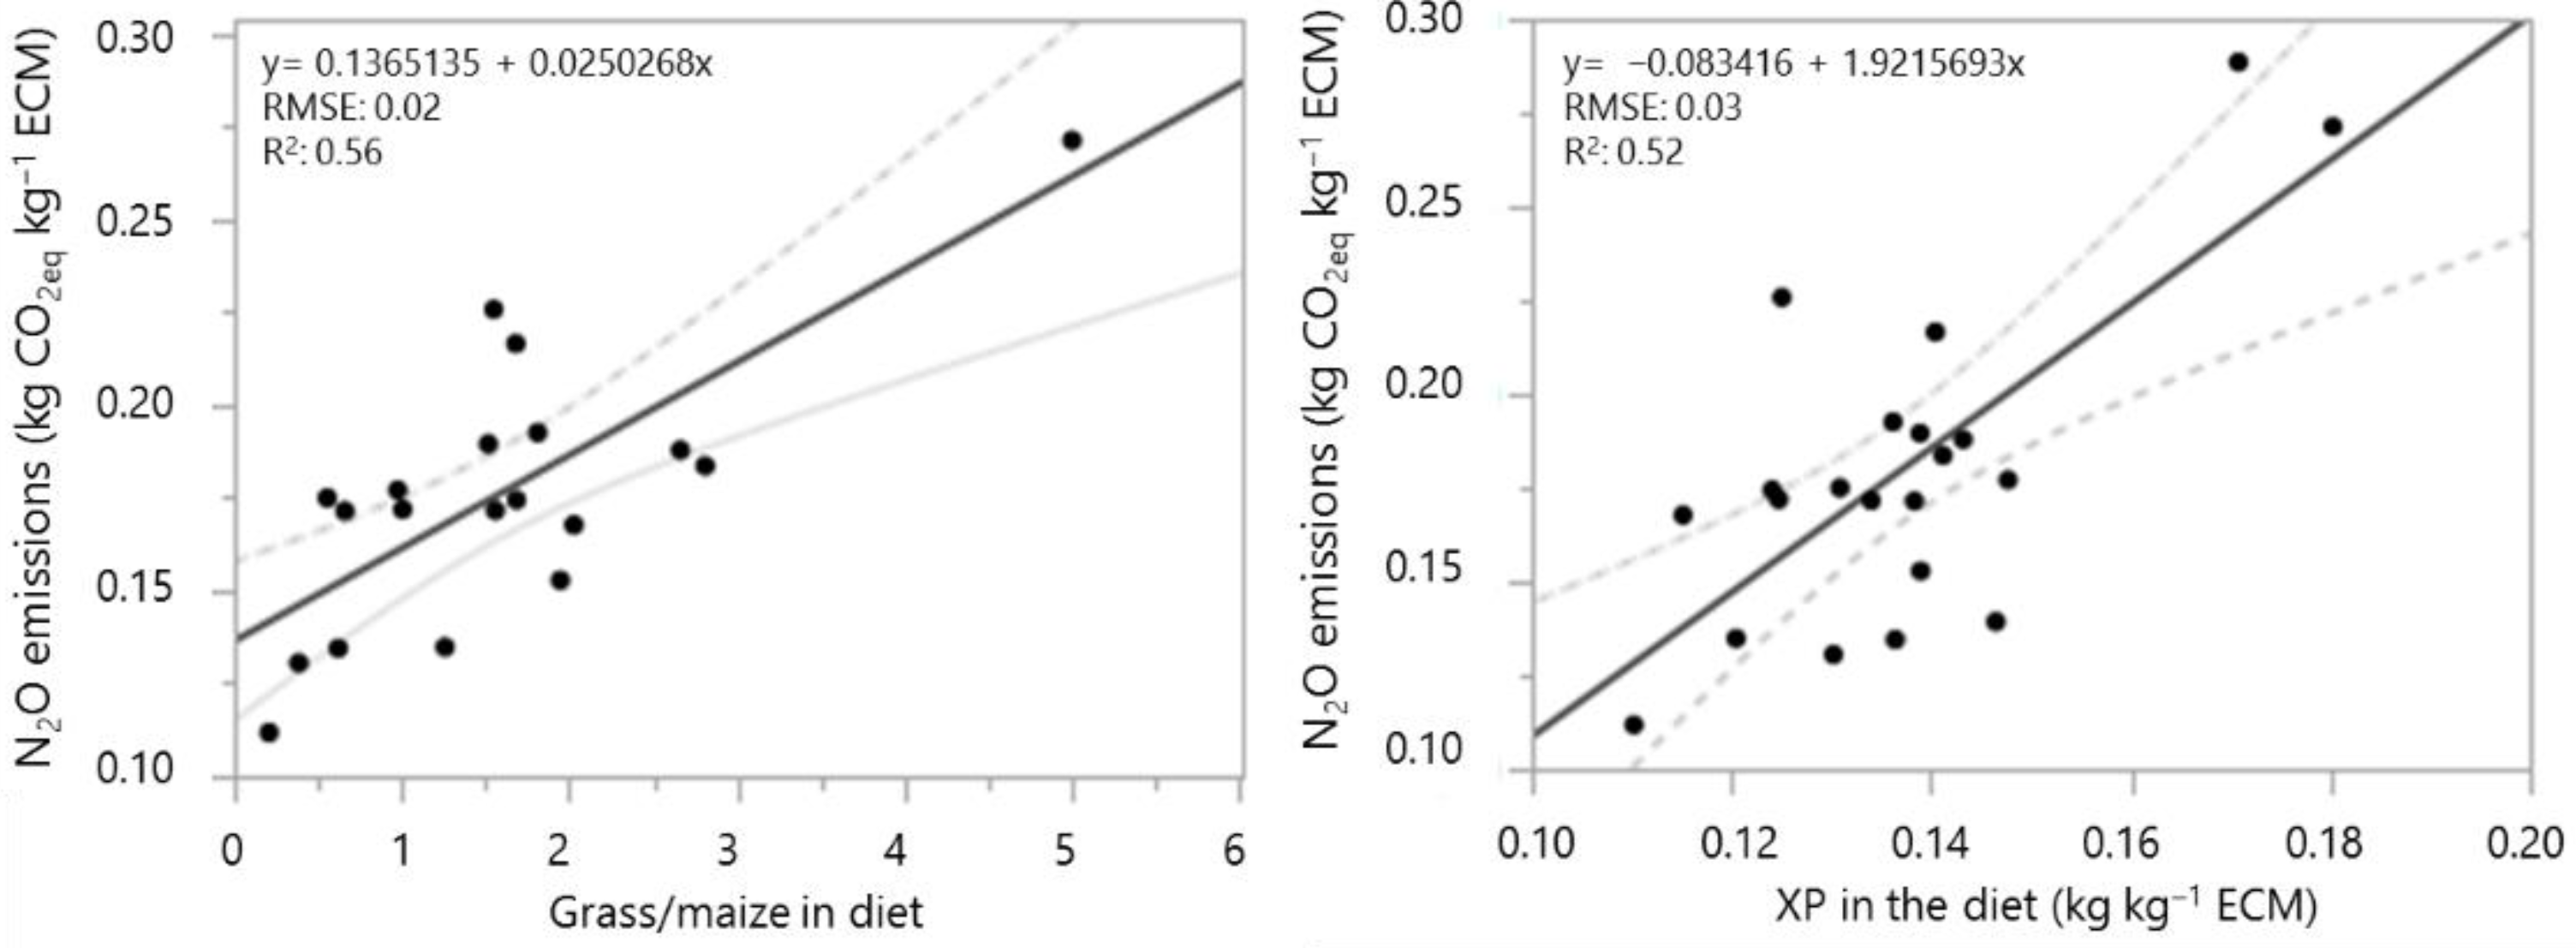
3.5.2. Effect of Single Parameters

The manure management was shown to differentiate N2O emissions. The use of solid manure, as opposed to liquid slurry, was clearly correlated to the total N2O emissions. In general, when solid manure was employed instead of slurry (farms S8 and N2), storage N2O emissions were more than doubled: as a consequence, even if N2O emissions after solid manure application were slightly lower due to higher ammonia losses, total N2O emissions from solid manure were definitely higher than from slurry.
The diet composition was found to strongly affect the total N2O emissions of dairy farms. Statistical model results indicated that the ratio between the percentage of grass and maize in the diets had the largest power to predict total N2O emissions on a farm (p = 0.0002, R2 = 0.56). Figure 6 shows that diets rich in grass increased N2O emissions on the dairy farms, whereas maize-based diets reduced N2O emissions, which is in agreement with previous results [9,46,50]. For instance, for a unitary decrease of the grass/maize ratio (e.g., from 2:1 to 1:1), the expected reduction in N2O emissions equals the slope of the regression line, i.e., −0.025 kg CO2eq kg−1 ECM, which, referenced to the grand mean of 0.18 kg CO2eq kg−1 ECM, means an average relative reduction of about 14% per unitary ratio change. The protein content of the diet was also well-correlated with the N2O emissions in the dairy farms (p = 0.0002, R2 = 0.52).
These two parameters, diet protein content and the grass/maize ratio of the diet, were also well-correlated with each other (R2 = 0.49) because of the high protein content of the grass (15–20% of DM). These results confirm those obtained in other studies [51,52], where the large contribution of the diet protein content of the cattle on the N2O emissions of the farms was reported.
The quantity of nitrogen fertiliser per hectare (kg N ha−1) used for the cultivation of the feedstuffs was found to not be correlated with the total N2O emissions in the analysed farms (total fertilisation per hectare, R2 = 0.0003; organic fertilisation per hectare, R2 = 0.0142). The absence of correlation between the fertiliser amount and the N2O emissions was probably due to the high contributions of the grazing and the manure management on the total farm N2O emissions [53]. In order to produce evidence of the effect of the fertiliser, it was necessary to create a prediction model, which also included these two parameters as nominal factors.

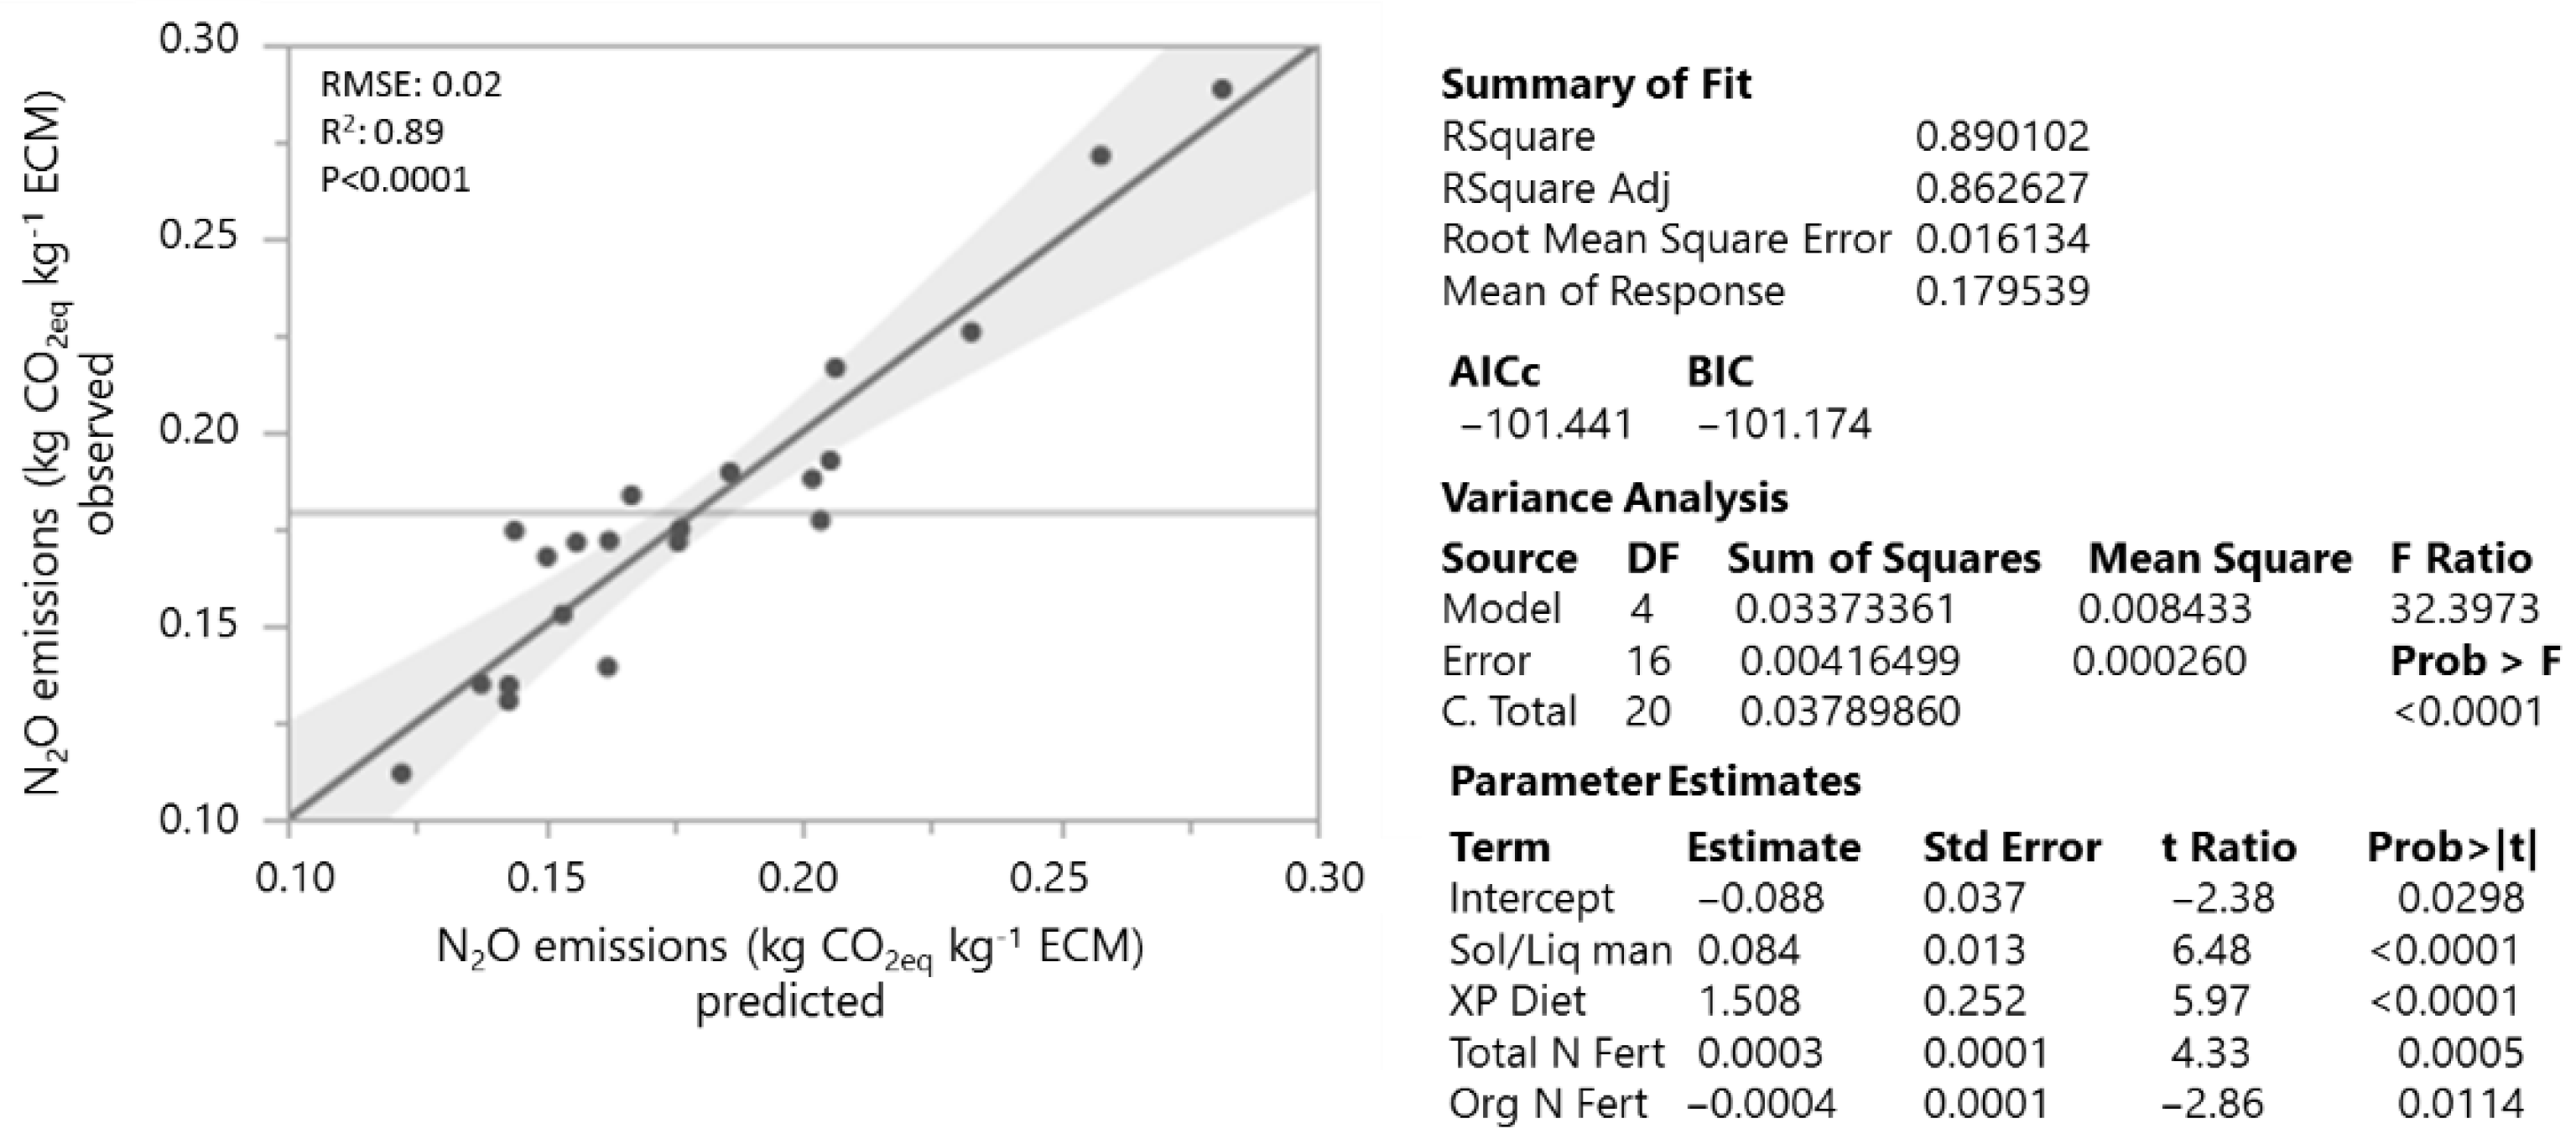
3.5.3. Linear Prediction Model

A higher predictive power can be obtained by composing a multilinear model with more predictors. Among all considered combinations of farm management parameters, the best choice was a model containing the manure type xman (0 = liquid, 1 = solid), the dietary crude protein content XP, the total nitrogen fertilisation (N2O-N)fert and the organic fertilisation (N2O-N)org as predictors. The regression results with only these variables are shown in Figure 7. This model offers a high coefficient of determination (p < 0.0001, R2 = 0.89) with a reduced set of parameters. The resulting prediction equation is then:
y ^ = β ^ 0 + β ^ man · x man + β ^ XP · XP + β ^ fert · ( N 2 O-N ) fert + β ^ org · ( N 2 O-N ) org
with the regression coefficients reported in Figure 7. Although the total and the organic nitrogen fertilisation were highly correlated (R2 = 0.91), they were both included in the model because their information content did not completely overlap; in that sense, the negative coefficient of the organic fertilisation should not be interpreted as a negative effect but as a correction factor of the total fertilisation in the linear model.
As discussed in Section 3.4, the analysis of the emissions calculated on the base of farm management data showed the importance of also collecting information about the younger animals in order to highlight in more detail the differences between the farms.

4. Conclusions

The estimation of the direct N2O emissions associated with milk production on the basis of farm management data yielded values between 0.11 kg and 0.29 kg CO2eq kg−1 ECM. Different dairy farm management systems can determine a quite large range of N2O emissions. Farms with animal diets mainly based on leguminosae and maize silage and a limited nitrogen fertilisation showed lower N2O emissions; on the contrary, farms with solid manure management and animal diets mainly based on grass showed higher N2O emissions.
A linear model that included the protein content of the animal diet, the amount and type of fertiliser, as well as the manure management (liquid or solid), enabled the prediction of about 89% of the direct N2O emissions. In the absence of detailed information on the animal diet, just the grass-to-maize ratio as a single parameter made it possible to estimate 56% of the farm N2O emissions. The data on the nitrogen fertilisation in the farm (total and organic fertiliser per hectare) alone could explain less than 2% of the N2O emissions. With the more sophisticated approach, an instrument can be offered to consultants, rapporteurs and decision makers for the analysis of the environmental impact of different dairy farms or different farm management strategies and the effects of emission mitigation strategies, based on farm data which are available or can be easily obtained.
The variability in heifer rearing was larger than in the management of the milking cows. Thus, the N2O emissions from heifer rearing ranged between 12 and 32% of the whole emissions. This underlines that heifer rearing has to be included in the estimation of the N2O emissions of dairy farms.
The present study showed that not just the type of chemical fertiliser and the manure management but also the diet composition can mitigate N2O emissions. Using urea instead of CAN and NP fertilisers could reduce the whole N2O emissions by 11%, but at the cost of higher ammonia emissions. By substituting solid manure with liquid slurry, an emission reduction of about 40% could be achieved. A reduction of the grass-to-maize ratio, from 2:1 to 1:1, could decrease the whole N2O emissions by 14%.
The findings of this study are based on data from the literature and 21 farms from three German regions investigated over a period of two years. This highlights a limitation of the performed tests and the linear models. The validity of the tests and models could be increased by the inclusion of data from more farms in further regions in the analyses.
Future research could be focused on further models for the calculation of N2O emissions, other cropping conditions (fertilisation, yields) and other farm types (e.g., cattle or pig fattening, poultry farms). In this way, knowledge about the most important data to estimate N2O emissions, e.g., for emission inventories, and about the mitigation potential in the different sectors of a dairy farm, especially in the diet composition and feed cropping sectors, can be expanded. In this way, farmers can obtain advice on how to reduce GHG emissions. Furthermore, the effects of changing cropping or climatic conditions on farm-related N2O emissions can be estimated better than before.

Author Contributions

Conceptualization, W.B.; Methodology, W.B., S.M., G.L.; Validation, S.M.; Formal Analysis, S.M., G.L.; Investigation, S.M., W.B.; Resources, S.M., W.B.; Data Curation, S.M.; Writing—Original Draft Preparation, S.M.; Writing—Review & Editing, W.B., G.L., S.M.; Visualization, S.M.; Supervision, S.M., G.L., W.B.; Project Administration, W.B.; Funding Acquisition, W.B. All authors have read and agreed to the published version of the manuscript.

Funding

This research was part of the project “Innovation potential to reduce greenhouse gas emissions in the dairy supply chain” (INNO Mil-CH4) and was funded by the Federal Ministry of Food, Agriculture and Consumer Protection (BMEL) in connection with a decision of the Parliament of the Federal Republic of Germany via the Federal Office for Agriculture and Food (BLE) under its innovation support program (grant no. 2817500711).

Institutional Review Board Statement

Not applicable.

Informed Consent Statement

Not applicable.

Data Availability Statement

Data are contained within the article. Restrictions apply to the availability of additional data. Data were obtained from farms and companies and are available from the authors with the permission of the farms and companies.

Acknowledgments

The authors thank DANONE GmbH, Haar, Germany, and the farms from which data were collected for their support. Special thanks go to B. Göschl, V. Krüger, K. Neckermann, and M. Rinser of DANONE GmbH for the assistance and support during the farm interviews and data collection. A special thanks also to Joan Leonard for her language editing.

Conflicts of Interest

The authors declare no conflict of interest.

References

  1. IPCC. Climate change 2013 the physical science basis. In Working Group I Contribution to the Fifth Assessment Report of the Intergovernmental Panel on Climate Change; Cambridge University Press: Cambridge, UK, 2013; p. 1552. [Google Scholar]
  2. Rendon-Huerta, J.A.; Pinos-Rodriguez, J.M.; Garcia-Lopez, J.C.; Yanez-Estrada, L.G.; Kebreab, E. Trends in greenhouse gas emissions from dairy cattle in mexico between 1970 and 2010. Anim. Prod. Sci. 2014, 54, 292–298. [Google Scholar] [CrossRef] [Green Version]
  3. Haenel, H.D.; Rösemann, C.; Dämmgen, U.; Poddey, E.; Freibauer, A.; Wulf, S.; Eurich-Menden, B.; Döhler, H.; Schreiner, C.; Bauer, B.; et al. Calculations of gaseous and particulate emissions from german agriculture 1990–2012. In Report on Methods and Data (RMD) Submissions 2014; Johann Heinrich von Thünen-Institut: Braunschweig, Germany, 2014; p. 348. [Google Scholar]
  4. Senbayram, M.; Chen, R.; Wienforth, B.; Herrmann, A.; Kage, H.; Muehling, K.H.; Dittert, K. Emission of N2O from biogas crop production systems in northern germany. Bioenerg. Res. 2014, 7, 1223–1236. [Google Scholar] [CrossRef]
  5. Mosier, A.; Kroeze, C.; Nevison, C.; Oenema, O.; Seitzinger, S.; van Cleemput, O. Closing the global N2O Budget: Nitrous oxide emissions through the agricultural nitrogen cycle—Oecd/ipcc/iea phase ii development of ipcc guidelines for national greenhouse gas inventory methodology. Nutr. Cycl. Agroecosyst. 1998, 52, 225–248. [Google Scholar] [CrossRef]
  6. Bell, M.J.; Rees, R.M.; Cloy, J.M.; Topp, C.F.E.; Bagnall, A.; Chadwick, D.R. Nitrous oxide emissions from cattle excreta applied to a scottish Grassland: Effects of soil and climatic conditions and a nitrification inhibitor. Sci. Total Environ. 2015, 508, 343–353. [Google Scholar] [CrossRef] [PubMed]
  7. Owen, J.J.; Silver, W.L. Greenhouse gas emissions from dairy manure Management: A review of field-based studies. Glob. Chang. Biol. 2015, 21, 550–565. [Google Scholar] [CrossRef] [Green Version]
  8. Guerci, M.; Bava, L.; Zucali, M.; Sandrucci, A.; Penati, C.; Tamburini, A. Effect of farming strategies on environmental impact of intensive dairy farms in italy. J. Dairy Res. 2013, 80, 300–308. [Google Scholar] [CrossRef]
  9. Bonesmo, H.; Beauchemin, K.A.; Harstad, O.M.; Skjelvag, A.O. Greenhouse gas emission intensities of grass silage based dairy and beef Production: A systems analysis of norwegian farms. Livest. Sci. 2013, 152, 239–252. [Google Scholar] [CrossRef] [Green Version]
  10. Nampoothiri, V.N.; Mohini, M.; Thakur, S.S.; Mondal, G. Influence of diet on methane and nitrous oxide emissions from cattle manure. Asian J. Atmos. Environ. 2015, 9, 187–193. [Google Scholar] [CrossRef] [Green Version]
  11. de Leis, C.M.; Cherubini, E.; Ruviaro, C.F.; da Silva, V.P.; Lampert, V.d.N.; Spies, A.; Soares, S.R. Carbon footprint of milk production in Brazil: A comparative case study. Int. J. Life Cycle Assess. 2015, 20, 46–60. [Google Scholar] [CrossRef] [Green Version]
  12. Christie, K.M.; Gourley, C.J.P.; Rawnsley, R.P.; Eckard, R.J.; Awty, I.M. Whole-farm systems analysis of australian dairy farm greenhouse gas emissions. Anim. Prod. Sci. 2012, 52, 998–1011. [Google Scholar] [CrossRef]
  13. Zehetmeier, M.; Gandorfer, M.; Hoffmann, H.; Mueller, U.K.; de Boer, I.J.M.; Heissenhuber, A. The impact of uncertainties on predicted greenhouse gas emissions of dairy cow production systems. J. Clean. Prod. 2014, 73, 116–124. [Google Scholar] [CrossRef]
  14. Paulsen, H.M.; Blank, B.; Schaub, D.; Aulrich, K.; Rahmann, G. Composition, storage and application of farmyard manure in organic and conventional german dairy farms and consequences for the green house gas emissions. Landbauforschung 2013, 63, 29–36. [Google Scholar]
  15. Velthof, G.L.; Kuikman, P.J.; Oenema, O. Nitrous oxide emission from soils amended with crop residues. Nutr. Cycl. Agroecosyst. 2002, 62, 249–261. [Google Scholar] [CrossRef]
  16. DLG-Verlag. Dlg-Futterwerttabellen Wiederkäuer; DLG-Verlag: Frankfurt, Germany, 1997. [Google Scholar]
  17. Spiekers, H.; Potthast, V. Erfolgreiche Milchvieh-Fütterung; DLG-Verlags-GmbH: Frankfurt am Main, Germany, 2004. [Google Scholar]
  18. Hoffman, P.C.; Funk, D.A. Applied dynamics of dairy replacement growth and management. J. Dairy Sci. 1992, 75, 2504–2516. [Google Scholar] [CrossRef]
  19. Weiß, J.; Pabst, W.; Granz, S. Tierproduktion; Enke Verlag: Stuttgart, Germany, 2011; p. 73. [Google Scholar]
  20. Kirchgebner, M.; Roth, F.X.; Schwarz, F.J.; Stangl, G.I. Tierernährung, Leitfaden für Studium, Beratung und Praxis, 13th ed.; DLG-Verlag GmbH: Frankfurt am Main, Germany, 2011. [Google Scholar]
  21. KTBL. Futterbau Produktionverfahren Planen und Kalkulieren KTBL Datensammlung; Kuratorium für Technik und Bauwesen in der Landwirtschaft e.V. (KTBL): Darmstadt, Germany, 2014. [Google Scholar]
  22. Over, R.; Köhler, M.; Krieg, K.; Nussbaum, H.; Wurth, W. Kalkulationsdaten Futterbau, Grünland / Ackerfutter / pflanzliche Substrate für Biogas. Landesanstalt für Entwicklung der Landwirtschaft und der ländlichen Räume (LEL): Schwäbisch Gmünd, Germany; Landwirtschaftliches Zentrum für Rinderhaltung, Grünlandwirtschaft, Milchwirtschaft, Wild und Fischerei Baden-Württemberg (LAZBW): Aulendorf, Germany, 2014. [Google Scholar]
  23. Spengel, A.; Mehne, S.; Feiffer, A.; Böse, S. Combine harvesting at large enterprises in Europe. In Proceedings of the International Conference on Crop Harvesting and Processing, Lousville, KY, USA, 9–11 February 2003; ASAE Publication: Lousville, KY, USA, 2003; pp. 1–16. [Google Scholar]
  24. Shamabadi, Z. Measurement the wheat losses in harvesting stage. Int. J. Agric. Crop. Sci. (IJACS) 2012, 4, 1797–1802. [Google Scholar]
  25. Barac, S.R.; Petrovic, D.V.; Radojevic, R.L.; Biberdzic, M.O.; Dikic, A.B. Comparison of self propelled forage harvesters in maize harvesting. In Proceedings of the 43rd International Symposium on Agricultural Engineering, Actual Tasks on Agricultural Engineering, Opatija, Croatia, 24–27 February 2015; pp. 377–385. [Google Scholar]
  26. Turhollow, A.F.; Sokhansanj, S. Costs of harvesting, storing in a large pile, and transporting corn stover in a wet form. Appl. Eng. Agric. 2007, 23, 439–448. [Google Scholar] [CrossRef]
  27. Rotz, C.A.; Muck, R.E. Changes in Forage Quality during Harvest and Storage. In Forage quality, evaluation and utilization; Fahey, G.C., Jr., Ed.; American Society of Agronomy: Madison, WI, USA, 1994; pp. 828–868. [Google Scholar]
  28. Good, A.G.; Beatty, P.H. Fertilizing Nature: A tragedy of excess in the commons. PLoS Biol. 2011, 9, 1–9. [Google Scholar] [CrossRef] [PubMed]
  29. Hoffman, P.C. Optimum body size of holstein replacement heifers. J. Anim. Sci. 1997, 75, 836–845. [Google Scholar] [CrossRef] [Green Version]
  30. Andrýsek, J.; Večeřa, M.; Javorová, J.; Velecká, M.; Falta, D.; Chládek, G. The effect of growth rate on some beef performance characteristics of czech fleckvieh heifers. Acta Univ. Agric. Silv. Mendel. Brun. 2015, 63, 1095–1100. [Google Scholar] [CrossRef] [Green Version]
  31. Brähmig, J.; jetzt Duisburg, H.; Scholz, A.M. Einfluss der Wechselkreuzung von Deutschen Holsteins und Deutschem Fleckvieh auf Milchleistung und Milchqualität in Einem Automatischen Melksystem; Ludwig-Maximilians-Universität München: München, Germany, 2011. [Google Scholar]
  32. Mihailescu, E.; Murphy, P.N.C.; Ryan, W.; Casey, I.A.; Humphreys, J. Nitrogen balance and use efficiency on twenty-one intensive grass-based dairy farms in the south of ireland. J. Agric. Sci. 2014, 152, 843–859. [Google Scholar] [CrossRef] [Green Version]
  33. Dämmgen, U.; Hutchings, N. Emissions of gaseous nitrogen species from manure Management: A new approach. Environ. Pollut. 2008, 154, 488–497. [Google Scholar] [CrossRef]
  34. van der Werf, H.M.G.; Nguyen, T.T.H. Construction cost of plant compounds provides a physical relationship for co-product allocation in life cycle assessment. Int. J. Life Cycle Assess. 2015, 20, 777–784. [Google Scholar] [CrossRef]
  35. Garcia-Launay, F.; van der Werf, H.M.G.; Nguyen, T.T.H.; Le Tutour, L.; Dourmad, J.Y. Evaluation of the environmental implications of the incorporation of feed-use amino acids in pig. Production using life cycle assessment. Livest. Sci. 2014, 161, 158–175. [Google Scholar] [CrossRef]
  36. van Middelaar, C.E. Milk Production & Greenhouse Gases: Integrated Modeling of Feeding and Breeding Strategies to Reduce Emissions; Wageningen University: Wageningen, The Netherlands, 2014. [Google Scholar]
  37. Narayanaswamy, V.; Van Berkel, R.; Altham, J.; McGregor, M. Application of life cycle assessment to enhance eco-efficiency of grains supply chains. In Proceedings of the 4th Australian LCA Conference, Sydney, Australia, 23–25 February 2005; pp. 1–17. [Google Scholar]
  38. Figueiredo, F.; Castanheira, E.; Freire, F. Lca of sunflower oil addressing alternative land use chang scenarios and practices. In Proceedings of the 8th International Convference on LCA in the Agri-Food Sector, Rennes, France, 2–4 October 2012; pp. 1–17. [Google Scholar]
  39. Kløverpris, J.; Elvig, N.; Nielsen, P.; Nielsen, A.; Ratzel, O.; Karl, A. Comparative Life Cycle Assessment of Malt-Based Beer and 100% Barley Beer; FORCE Technology: Lyngby, Denmark, 20 August 2009; p. 66. [Google Scholar]
  40. Ecoinvent, d.v. Inventories, S.C.f.L.C., Ed. 2010. Available online: https://www.ecoinvent.org/ (accessed on 12 April 2021).
  41. Van Zeist, W.; Marinussen, M.; Broekema, R.; Groen, E.; Kool, A.; Dolman, M.; Blonk, H. Lci Data for the Calculation Tool Feedprint for Greenhouse Gas Emissions of Feed Production and Utilization; Block Consultants: Gouda, The Netherlands, 2012. [Google Scholar]
  42. St- Pierre, N.R. Managing measures of feed Costs: Benchmarking physical and economic feed efficiency. In Proceedings of the Tri-State Dairy Nutrition Conference, Fort Wayne, IN, USA, 22–23 April 2008. [Google Scholar]
  43. Meul, M.; Van Middelaar, C.E.; de Boer, I.J.M.; Van Passel, S.; Fremaut, D.; Haesaert, G. Potential of life cycle assessment to support environmental decision making at commercial dairy farms. Agric. Syst. 2014, 131, 105–115. [Google Scholar] [CrossRef]
  44. Zhou, M.; Zhu, B.; Wang, S.; Zhu, X.; Vereecken, H.; Brüggemann, N. Stimulation of n2o emission by manure application to agricultural soils may largely offset carbon Benefits: A global meta-analysis. Glob. Chang. Biol. 2017, 23, 4068–4083. [Google Scholar] [CrossRef]
  45. Larsson, L.; Ferm, M.; Kasimir-Klemedtsson, A.; Klemedtsson, L. Ammonia and nitrous oxide emissions from grass and alfalfa mulches. Nutr. Cycl. Agroecosyst. 1998, 51, 41–46. [Google Scholar] [CrossRef]
  46. Kristensen, T.; Mogensen, L.; Knudsen, M.T.; Hermansen, J.E. Effect of production system and farming strategy on greenhouse gas emissions from commercial dairy farms in a life cycle approach. Livest. Sci. 2011, 140, 136–148. [Google Scholar] [CrossRef]
  47. Merino, V.M.; Balocchi, O.A.; Pulido, R.G. Pasture condition and milk production by grazing dairy cows as affected by daily herbage-allowance restriction. Anim. Prod. Sci. 2019, 59, 1510–1519. [Google Scholar] [CrossRef]
  48. Harty, M.A.; Forrestal, P.J.; Watson, C.J.; McGeough, K.L.; Carolan, R.; Elliot, C.; Krol, D.; Laughlin, R.J.; Richards, K.G.; Lanigan, G.J. Reducing nitrous oxide emissions by changing n fertiliser use from calcium ammonium nitrate (can) to urea based formulations. Sci. Total Environ. 2016, 563, 576–586. [Google Scholar] [CrossRef] [PubMed] [Green Version]
  49. van der Weerden, T.J.; Luo, J.; Di, H.J.; Podolyan, A.; Phillips, R.L.; Saggar, S.; de Klein, C.A.M.; Cox, N.; Ettema, P.; Rys, G. Nitrous oxide emissions from urea fertiliser and effluent with and without inhibitors applied to pasture. Agric. Ecosyst. Environ. 2016, 219, 58–70. [Google Scholar] [CrossRef]
  50. Vellinga, T.V.; de Haan, M.H.A.; Schils, R.L.M.; Evers, A.; van den Pol-van Dasselaar, A. Implementation of ghg mitigation on intensive dairy Farms: Farmers’ preferences and variation in cost effectiveness. Livest. Sci. 2011, 137, 185–195. [Google Scholar] [CrossRef]
  51. Arriaga, H.; Salcedo, G.; Martinez-Suller, L.; Calsamiglia, S.; Merino, P. Effect of dietary crude protein modification on ammonia and nitrous oxide concentration on a tie-stall dairy barn floor. J. Dairy Sci. 2010, 93, 3158–3165. [Google Scholar] [CrossRef] [PubMed]
  52. Lee, C.; Hristov, A.N.; Dell, C.J.; Feyereisen, G.W.; Kaye, J.; Beegle, D. Effect of dietary protein concentration on ammonia and greenhouse gas emitting potential of dairy manure. J. Dairy Sci. 2012, 95, 1930–1941. [Google Scholar] [CrossRef] [PubMed]
  53. Luo, J.; de Klein, C.A.M.; Ledgard, S.F.; Saggar, S. Management options to reduce nitrous oxide emissions from intensively grazed Pastures: A review. Agric. Ecosyst. Environ. 2010, 136, 282–291. [Google Scholar] [CrossRef]
Figure 1. Location of the production sites under investigation: north (farms N1–N5), central (farms C1–C4) and south (farms S1–S12); adapted from http://www.clker.com/clipart-germany-4.html# (accessed on 2 July 2021).
Agriculture 11 00654 g001
Figure 2. Scheme of the collection, calculation and control of the data from the 21 selected dairy farms analysed in the present study.
Agriculture 11 00654 g002
Figure 3. Amounts of organic and chemical fertilisers used on the 21 analysed dairy farms. The chemical fertilisers were nitrogen phosphorus (NP), calcium ammonium nitrate (CAN), and urea.
Agriculture 11 00654 g003
Figure 4. Linear regression between grass or maize yield and total amount of nitrogen distributed per hectare (mean values for all crops) on the farms.
Agriculture 11 00654 g004
Figure 5. Total N2O emissions, expressed as kg CO2eq kg−1 ECM, calculated per farm and grouped as storage, grazing and organic and chemical fertilisation. Regions are specified as south (S), central (C) or north (N). Letters at the top of the bars show significant differences among the mean values per region (α = 0.05).
Agriculture 11 00654 g005
Figure 6. Effects of the grass/maize ratio and of the diet protein content (XP) on N2O emissions from the analysed dairy farms, expressed as t CO2eq ha−1 per year.
Agriculture 11 00654 g006
Figure 7. Effects of the dairy farm parameters (manure type, solid or liquid manure (Sol/Liq man), crude protein content (XP Diet), total nitrogen fertilisation (Total N Fert) and organic nitrogen fertilisation (Org N Fert)) on the total N2O emissions, expressed as kg CO2eq kg−1 ECM.
Agriculture 11 00654 g007
Table 1. Biometric data used for N balance.
DetailsValueReference
Calf body massHolstein40 kg[18]
Fleckvieh45 kg[31]
N contentCalf0.029 kg N kg−1 BM[32]
Animal body mass gain0.024 kg N kg−1 BM[32]
Milk protein0.638 kg N kg−1 ECM[32]
BM = body mass; ECM = energy-corrected milk.
Table 2. Emission factors (EFs) used for calculations [3].
DetailsEFN2OEFNOEFNH3
(kg N2O-N kg−1 N)(kg NO-N kg−1 N)(kg NH3 kg−1 TAN)
Chemical fertiliserNP0.01250.0120.0107 + 0.0006·T
NPK and CAN0.01250.0120.0080 + 0.0001·T
urea0.01250.0120.1067 + 0.0035·T
Organic fertiliserslurry, natural crust0.0125=0.1·EFN2O0.15/0.54
solid manure0.0125=0.1·EFN2O0.45/0.90
Housing + storageslurry, natural crust0.005=0.1·EFN2O0.197 + 0.045
solid manure0.013=0.1·EFN2O0.066 + 0.600
Grazing 0.020.0070.10
TAN = total ammoniacal nitrogen; T = mean air temperature in spring, in °C.
Table 3. Allocation factors used for emission calculations.
Purchased FeedstuffEconomic Allocation ValueReference
Pressed sugar beet silage23.0%[34]
Soybean meal59.0%[35]
Rapeseed meal26.0%[36]
Rapeseed oil74.0%[36]
Molasses pulp5.0%[36]
Brewers’ spent grains11.0%[37]
Wheat straw7.5%[36]
Sunflower expeller23.0%[38]
Wheat bran3.8%[34]
Linseed meal42.5%[34]
Malt culms3.5%[39]
Maize gluten meal6.9%[34]
Palm expeller1.0%[40]
Wheat meal93.6%[34]
Pressed potato pulp1.0%[41]
Table 4. Analysed farm descriptions: breeding systems.
RegionNo. of FarmsBreedMilking CowFirst
Calving Age
Dry PeriodProductive
Cycle
Milk
Production
No.MonthsDaysDayskg ECM an−1 y−1
South12Fleckvieh
Average 54 b29.350.2377 b7555
Min 1626.438.23615900
Max 10333.262.43888805
St Dev 211.98.48934
Central4Fleckvieh
Average 28 b28.149.6373 b7463
Min 2228.041.03676068
Max 3828.355.73798751
St Dev 60.16.041118
North5Holstein
Average 266 a27.447.9430 a7972
Min 6727.035.44057256
Max 48628.260.24658915
St Dev 1550.58.023572
Means with different letters within columns are significantly different (α = 0.05).
Table 5. Analysed farm descriptions: milking cow diets.
RegionNo. of FarmsDM
Intake
XP
Intake
NEL
Content
GrassMaizeHayStrawPastureConcentrate
kg DM an−1 d−1kg XP an−1 d−1MJ kg−1 DM−1% DM% DM% DM% DM% DM% DM
South12
Average 18.32.896.640.8 a21.4 b5.4 a1.1 b8.420.6
Min 16.82.526.131.50.00.80.00.04.1
Max 20.43.387.151.736.014.23.130.029.7
St Dev 1.10.240.36.110.43.51.112.07.1
Central4
Average 18.02.626.619.0 b42.8 a7.9 a4.2 a--25.9
Min 15.32.176.310.631.93.00.4--18.2
Max 20.33.126.828.551.211.47.0--38.8
St Dev 1.90.340.26.46.93.12.6--8.3
North5
Average 18.52.906.536.6 a23.8 ab0.9 b1.9 ab7.229.3
Min 17.12.486.122.50.00.00.40.022.6
Max 20.43.276.843.540.52.73.830.438.5
St Dev 1.10.340.37.513.91.11.211.86.2
Means with different letters within columns are significantly different (α = 0.05). DM = dry matter; XP = crude protein; NEL = net energy of lactation; ECM = energy-corrected milk.
Table 6. Analysed farm data: surfaces and crop yields.
RegionTotal Farm
Surface (TFS)
In-Farm and Off-Farm Feedstuff Surface (FS) *SurfaceYield
CerMaiLegPer.
Gras **
CerMaiLegPer.
Gras **
hahaha LSU−1 #m2 kg−1 ECM% on FS% on FS% on FS% on FSt DM ha−1t DM ha−1t DM ha−1t DM ha−1
South
Average42.5 b59.4 b0.7 b1.61.711.9 b2.355.4 a6.417.910.09.8 a
Min28.023.30.51.10.00.00.041.65.512.310.05.4
Max60.01021.12.76.220.327.586.08.022.810.013.5
St Dev11.320.00.20.52.55.57.610.61.03.10.02.0
Central
Average50.0 b36.9 b0.8 ab1.75.621.0 a11.55.7 b7.018.411.07.8 ab
Min31.025.30.71.30.016.97.50.06.217.210.56.5
Max70.057.90.81.98.225.915.415.47.820.211.49.0
St Dev18.512.40.10.33.33.73.06.40.71.20.31.3
North
Average724 a418 a1.0 a1.93.412.0 b3.543.7 a4.815.74.807.0 b
Min1281210.71.60.00.00.023.23.511.84.805.1
Max19948631.32.29.821.517.457.86.022.54.809.1
St Dev6942860.20.24.17.97.011.31.04.30.01.4
Means with different letters within columns are significantly different (α = 0.05). * Feed surface (FS) includes not only the on-farm area used for the cows (including calves and heifers) but also the off-farm feedstuff and concentrates surface. ** Permanent grassland also includes pasture. # Cows, including calves and heifers. LSU = livestock unit; ECM = energy-corrected milk; Cer = cereals; Mai = maize; Leg = leguminosae; Per. Gras = permanent grassland.
Table 7. Analysed farm data: nitrogen fertilisation.
RegionChemical FertilisationOrganic FertilisationTotal Fertilisation
CerMaiLegPer.
Gras
CerMaiLegPer.
Gras
CerMaiLegPer.
Gras
kg N ha−1kg N ha−1kg N ha−1
South
Average41.3164 a--55.491.4127--209 a133291--264 a
Min27.073.7--0.045.00.0--120101200--120
Max55.7232--124176228--270209371--379
St Dev11.944.2--36.350.955.7--44.544.155.4--66.6
Central
Average28.864.8 b----11022820.7119 b13829320.7119 b
Min0.027.0----73.520419.457.412225319.457.4
Max48.681.0----15524921.918015533021.9180
St Dev20.822.3----33.616.20.961.513.228.20.961.5
North
Average34.260.3 b--38.371.51929.594.2 b1062529.5133 b
Min0.014.0--0.067.989.79.579.571.81839.579.5
Max75.693.2--13375.03549.51081443689.5238
St Dev31.330.2--49.62.999.5--12.129.474.20.055.4
Means with different letters within columns are significantly different (α = 0.05). Cer = cereals; Mai = maize; Leg = leguminosae; Per. Gras = permanent grassland.
Table 8. Comparison of N2O emissions from analysed farm fertilisation and from standard fertilisation according to the KTBL (Kuratorium für Technik und Bauwesen in der Landwirtschaft e.V.) [21].
UnitGRAM ***
Silage
LEG ***
Silage
Maize SilageBarleyTriticaleWheat
Emissions from
analysed farms
kg N2O-N t−1 DM0.2770.0190.1850.2380.1950.249
Reference values *kg N2O-N t−1 DM0.247 **0.0210.1670.2020.1820.383
* [21]. ** Standard fertilisation includes organic fertiliser. For other crops, it includes only chemical fertilisers. *** GRAM denotes gramineae-based grass silage and LEG denotes leguminosae-based grass silage.
Publisher’s Note: MDPI stays neutral with regard to jurisdictional claims in published maps and institutional affiliations.

