Article

Effects of Irrigation on N2O Emissions in a Maize Crop Grown on Different Soil Types in Two Contrasting Seasons

1
Department of Agronomy, University of Naples Federico II, Portici, 80055 Naples, Italy
2
National Research Council, Department of Biology, Agriculture and Food Sciences, Institute for Agricultural and Forestry Systems in the Mediterranean, P.le Enrico Fermi 1, Loc. Porto del Granatello, Portici, 80055 Naples, Italy
*
Authors to whom correspondence should be addressed.
Agriculture 2020, 10(12), 623; https://doi.org/10.3390/agriculture10120623
Submission received: 30 October 2020 / Revised: 3 December 2020 / Accepted: 8 December 2020 / Published: 11 December 2020
(This article belongs to the Special Issue Cropping Systems: Implications on Climate and Environment)

Abstract

:
Crop management and soil properties affect greenhouse gas (GHG) emissions from cropping systems. Irrigation is one of the agronomical management practices that deeply affects soil nitrous oxide (N2O) emissions. Careful management of irrigation, also concerning to soil type, might mitigate the emissions of this powerful GHG from agricultural soils. In the Mediterranean area, despite the relevance of the agricultural sector to the overall economy and sustainable development, the topic of N2O emissions does not have the same importance as N2O fluxes in temperate agricultural areas. Only some research has discussed N2O emissions from Mediterranean cropping systems. Therefore, in this study, N2O emissions from different soil types (sandy-loam and clay soils) were analyzed in relation to the irrigation of a maize crop grown in two contrasting seasons (2009–2010). The irrigation was done using a center pivot irrigation system about twice a week. The N2O emissions were monitored throughout the two-years of maize crop growth. The emissions were measured with the accumulation technique using eight static chambers (four chambers per site). Nitrogen fertilizer was applied in the form of ammonium sulphate and urea with 3,4 dimethylpyrazole phosphate (DMPP) nitrification inhibitors. In 2009, the N2O emissions and crop biomass measured in both soil types were lower than those measured in 2010. This situation was a lower amount of water and nitrogen (N) available to the crop. In 2010, the N2O fluxes were higher in the clay site than those in the sandy-loam site after the first fertilization, whereas an opposite trend was found after the second fertilization. The soil temperature, N content, and soil humidity were the main drivers for N2O emission during 2009, whereas during 2010, only the N content and soil humidity affected the nitrous oxide emissions. The research has demonstrated that crop water management deeply affects soil N2O emissions, acting differently for denitrification and nitrification. The soil properties affect N2O emission by influencing the microclimate conditions in the root zone, conditioning the N2O production.

1. Introduction

Agriculture suffers from climate change (CC) while also contributing to CC by emitting large amounts of greenhouse gases (GHGs) into the atmosphere, about 14% of which is linked to soil management and livestock. Nitrous oxide (N2O) is one of the most powerful climate-altering gases, and its concentration has significantly increased from the 270 ppb pre-industrial levels to the current levels of 340 ppb [1]. N2O is characterized by its 100-year global warming potential, which is 298 times greater than of carbon dioxide [2]. It is the main GHG emitted by agriculture, estimated to contribute more than 60% of the total anthropogenic N2O [3].
Although cultivated soils contribute largely to GHG emissions, little attention is given to N2O emissions from agricultural soils in the Mediterranean region, as compared with other regions. This makes it difficult to devise mitigating strategies targeting the impact of Mediterranean cropping systems on the climate [4].
N2O emissions from agricultural soils are closely related to microbial nitrification and denitrification. These two processes are influenced by several factors, including soil temperature, moisture content, soil pH, aeration, and nitrogen (N) availability and organic carbon contents [5,6]. N availability in the soil is the major driver for N2O emissions, and chemical fertilizers are the main source of N contents in the agricultural soils [6,7,8,9]. Soil moisture is another driver of N2O emissions as it regulates oxygen availability to soil microorganisms [10]. Soil temperature also plays an important role in regulating N2O emission from agricultural soils, and N2O emissions increase as the soil temperature increases [11]. Soil pH regulates both nitrification and denitrification. [12] Nitrification, under oxygen conditions, involves the microbial conversion of ammonium to nitrate. It generally increases with an increase in soil pH, but reaches an optimum level at pH 6–8 [13,14]. Denitrification, under limited oxygen conditions, is the microbiological process in which oxidized N species, such as nitrate (NO3) and nitrite (NO2), are reduced to gaseous nitric oxide (NO), nitrous oxide (N2O), and molecular nitrogen (N2). Soil pH affects the denitrification rate, in fact at pH values below 7, N2O is the main denitrification product, whereas N2 prevails at pH values above 8 [15]. Agricultural management practices, such as the type and quantity of fertilization, tillage or ploughing, and irrigation, have an effect on GHG production, in particular on N2O [16]. Irrigation controls the soil water content in agricultural soils that directly affects oxygen availability to the soil microbes, which alternatively influences N2O emissions [17,18]. Nitrification prevails on denitrification as a source of N2O production in soils with greater oxygen availability, whereas denitrification overcomes nitrification under limited oxygen availability [19,20,21]. A threshold of 60% has been defined for the water filled pore space—above this level denitrification prevails, and below it nitrification prevails [22]. Soil texture also controls soil moisture; soil with a coarse texture retains less water than soil with a fine texture: as consequence, more oxygen penetrates into the soil matrix, favoring nitrification over denitrification [23,24]. It should be considered that different soil patches are often present in the same cropped field, making spatially and highly variable N2O emissions, so that it is difficult to devise a mitigating strategy applicable at a large scale [25].
As only a few research works have discussed N2O emissions from Mediterranean cropping systems [26,27], the aim of this study was to evaluate the N2O emissions of two different soils (sandy-loam, and clay) cultivated with maize crops, in two contrasting years, regarding irrigation management. Soil patches with different physical–chemical properties provide the opportunity to compare the effect of irrigation management and the role of soil properties on N2O emissions under the same environmental and management conditions.

2. Materials and Methods

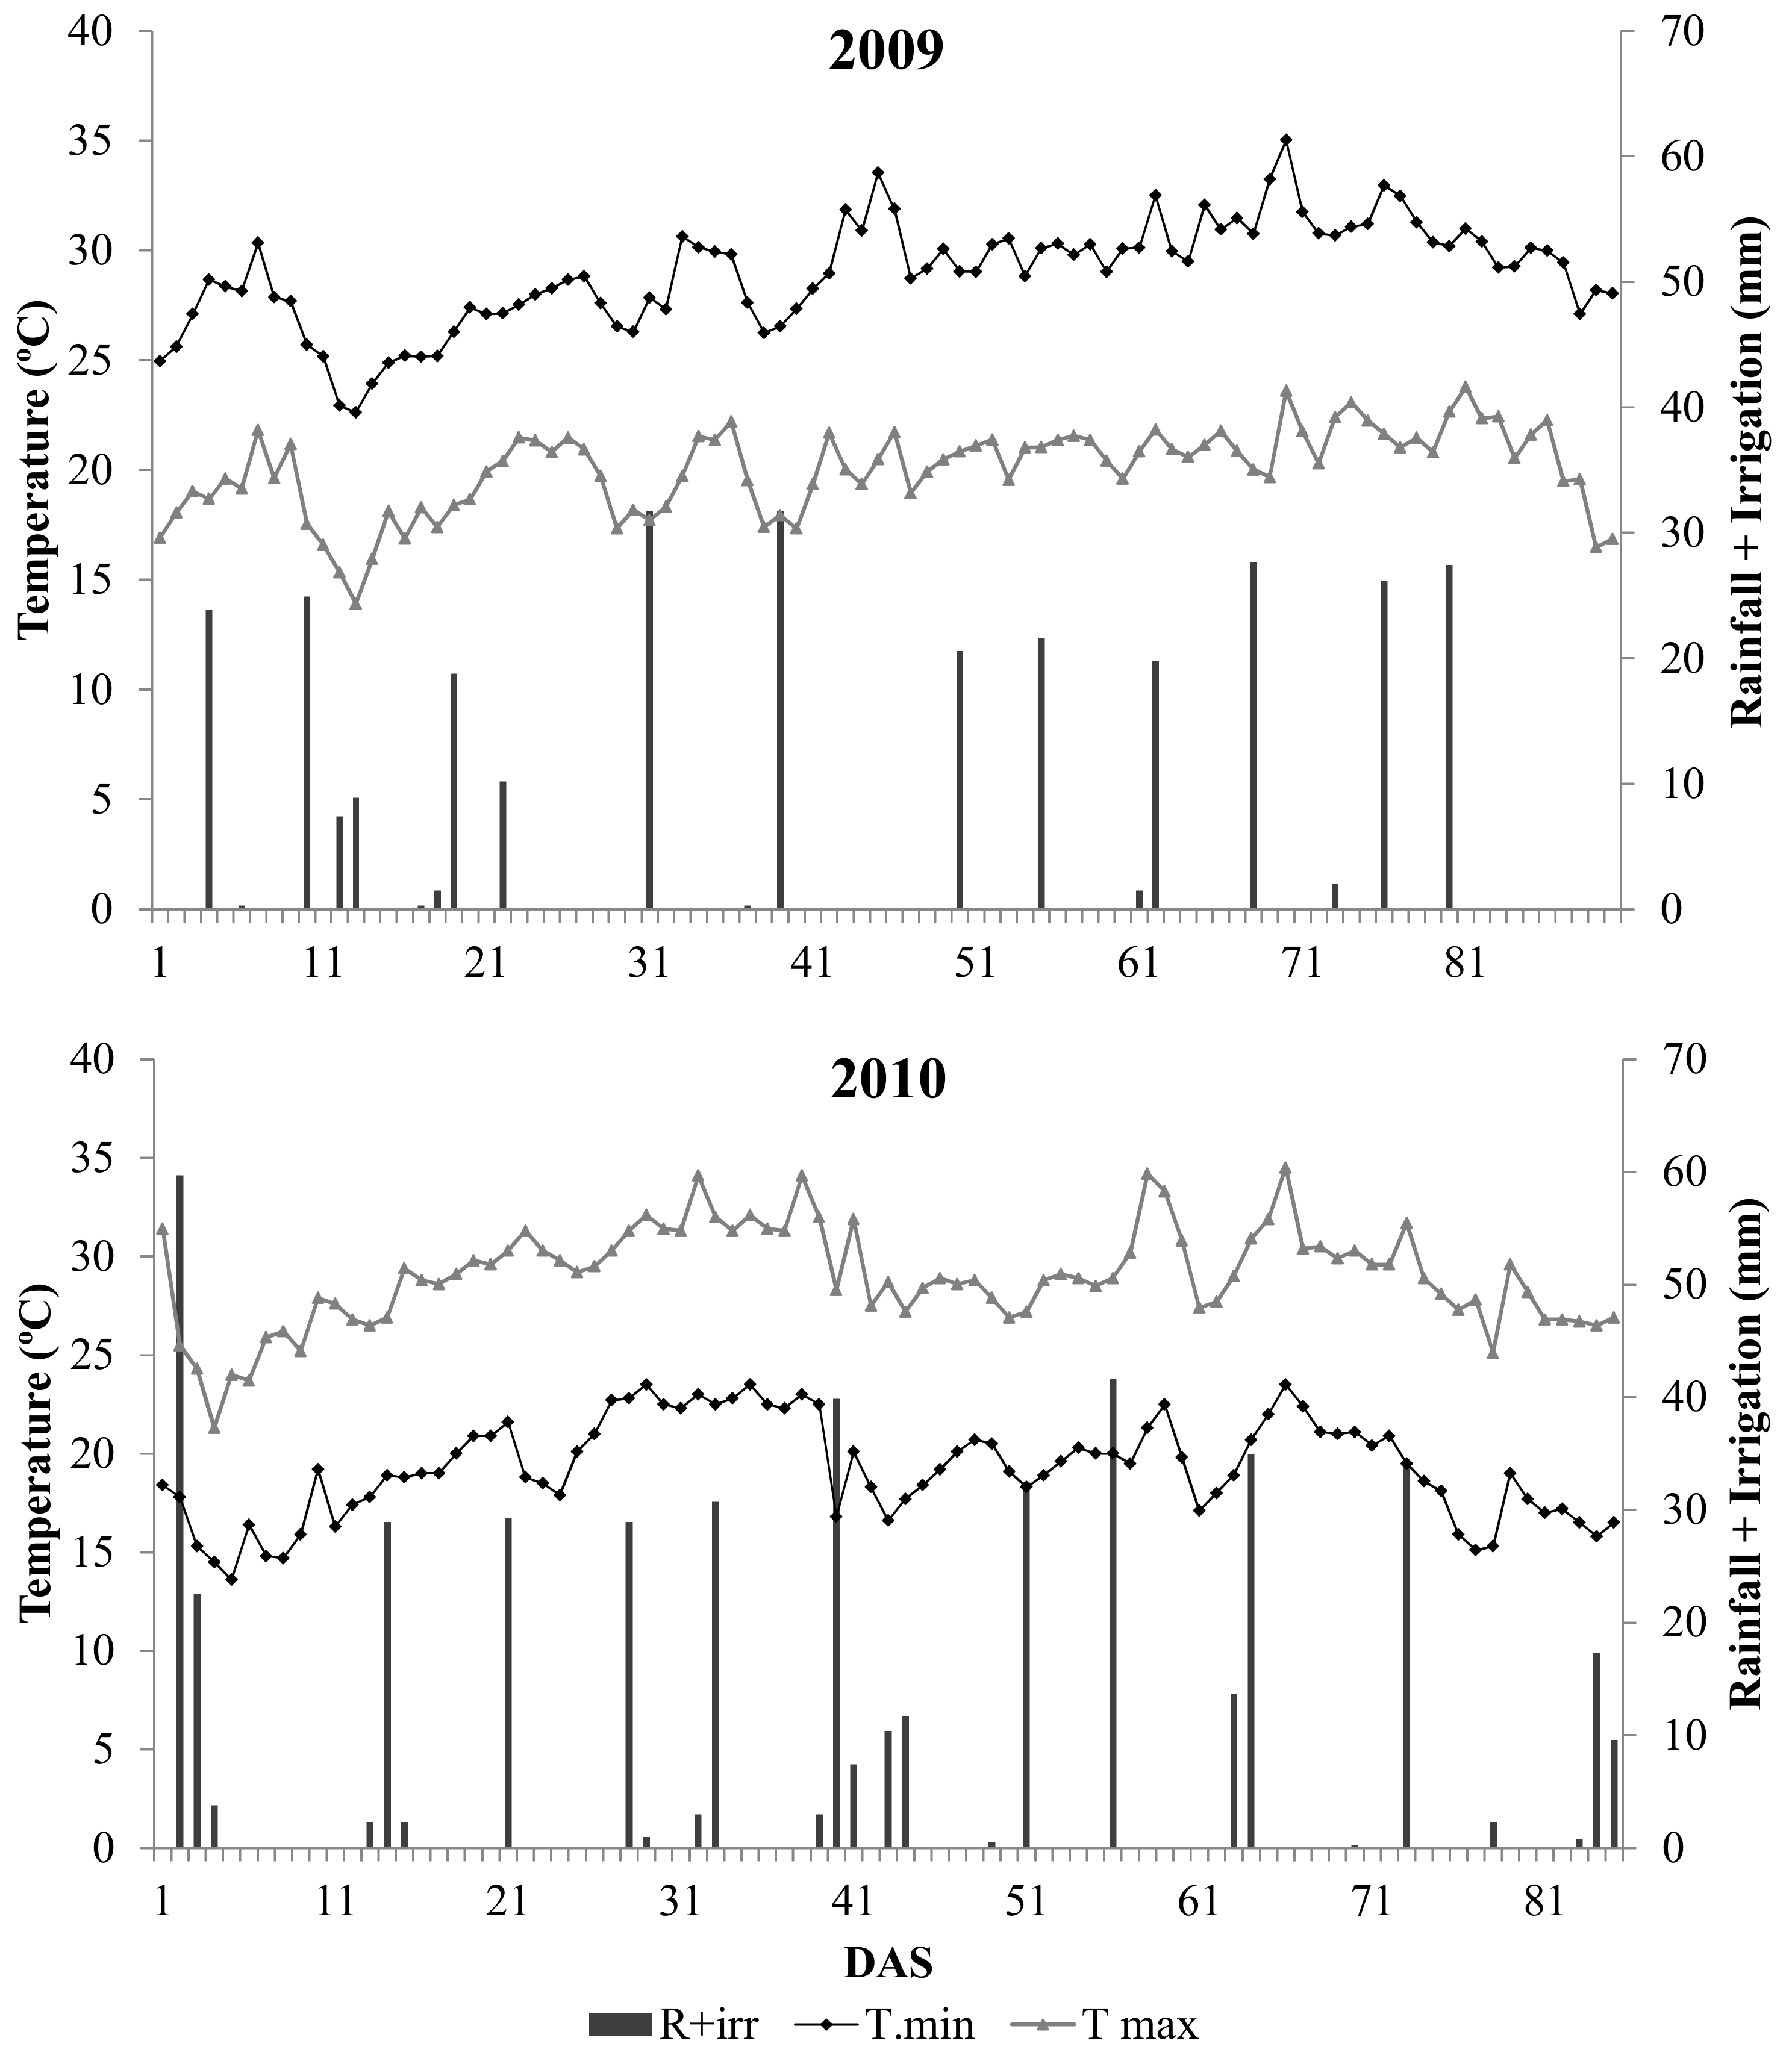
2.1. Experimental Site, Cropping System, and Management

This study was carried out on a farm located in Southern Italy (latitude 40°31′25.5″, longitude 14°57′26.8″, and mean altitude 15 m a.s.l.) during 2009 and 2010. The field was irrigated with a center pivot irrigation system. The area under study is characterized by the typical Mediterranean climate, with an annual mean temperature of 15.5 °C and annual rainfall of 908 mm (private weather station). More details can be found in Vitale et al. [28]. The field is characterized by two pedosoils—the soil to the east has a clay texture, whereas the west has a sandy-loam texture (Table 1).
Maize (Zea mays L.) seeds were sown in spring on rows spaced 0.75 m apart, to a nominal density of about 8.0 pt m2. At the same time, an ammonia nitrogen (0.8% 3,4 dimethylpyrazole phosphate (DMPP)) complex was applied as Entec 25 (Entec®, EuroChemAgro, Cesano Maderno, MB, Italy). Then, 30 days after sowing (DAS), fertilizer was applied as urea (0.5% DMPP; Entec 46, Entec®, EuroChemAgro, Cesano Maderno, MB, Italy). Both fertilizers contained the 3,4 dimethylpyrazole phosphate (DMPP) nitrification inhibitor. Crop management was ordinary and managed by the farm. More information about crop management is reported in Table 2.
Maize crops received different amounts of water during the two contrasting growing seasons (Table 2 and Figure 1). During the 2009 growing season, about 116 mm of rainfall was recorded, and to cover the water deficit, 273 mm of water was applied through irrigation. During the 2010 growing season, a reduced amount of rainfall was recorded (76 mm) compared with the 2009 season, and so about 400 mm of water by irrigation was applied.

2.2. Soil N2O Flux Measurement, Nitrogen Content, and Above-Ground Biomass

Soil N2O fluxes were measured with the accumulation technique using eight static chambers [29,30]; four chambers were located on the sandy-loam site and four on the clay site. Chambers (0.20 m diameter, 0.15 m height, and 4.7 L) were inserted at a 0.03 m depth into the soil and were left there for the entire measurement period. Air samples were collected between 11:00 a.m. and 13:00 p.m. solar time using a PVC syringe, and were stored in 0.20 L evacuated vials until analysis; samplings were taken before and after chamber closure within 30 min. These measurements were carried out weekly. The N2O concentration was determined using a gas chromatograph (Series 800 Fisons, Milan, Italy) and the fluxes, expressed as μg N2O-N m−2 h−1, were calculated as follows:
fN2O = k(A/S)
where A is the slope of the line interpolating N2O concentrations in time, S is the soil surface area, and k is the coefficient used to convert measure units. The cumulative flux (fc) was determined as reported in Ranucci et al., 2001 [31], and used to calculate the CO2 equivalent.
The soil temperature was measured at a 0–0.20 m depth by means of two TCAV thermocouple probes (TCAV, Campbell SkiSci. Ltd., Shepshed, UK), whereas the soil moisture was also measured at a 0–0.20 m depth by means of two soil moisture sensors (Theta Probe, Delta-T devices Ltd., Cambridge, UK), which were used to determine the water filled pore space (WFPS), as follows:
WFPS = VSWC/[1 − (BD/2.65)]
where 2.65 represents the average density calculated on the basis of the relative content of the different mineral constituents [32,33], BD is the bulk density, and VSWC the volumetric soil water content.
The soil NO3 content was determined based on the samples collected at a 0–0.20 m depth by using an auger. An integrated soil sample per chamber was obtained by collecting different soil samples near each autochamber and putting them together. The soil was air-dried and sieved (2 mm), and the soil nitrate (NO3) content was determined colorimetrically using a spectrophotometer (DR 2000 HACH Co., Loveland, CO, USA).
At harvest, for both soils on a 1 m2 sampling area, the plants were collected, weighed, and oven-dried at 60 °C up to a constant weight.

2.3. Statistical Analysis

Statistical analysis of the data was performed by means of the Sigma-Plot package (Sigma-Plot 12.2, Systat Software, Inc., San Jose, CA, USA). Differences in the parameters between the two soil types were checked by one-way analysis of variance (ANOVA) repeated measurements, followed by Duncan’s test (p ≤ 0.05). The dependence of N2O flux on temperature, water filled pore space, and NO3-N was investigated by means of an analysis of variance (ANOVA) model. The regression analyses were performed using all of the data collected during the monitoring activities. The soil NO3 concentration, WFPS, and T soil were limited to a different extent and at different times in the field, and the whole set of data was divided into more restricted homogeneous groups.

3. Results and Discussion

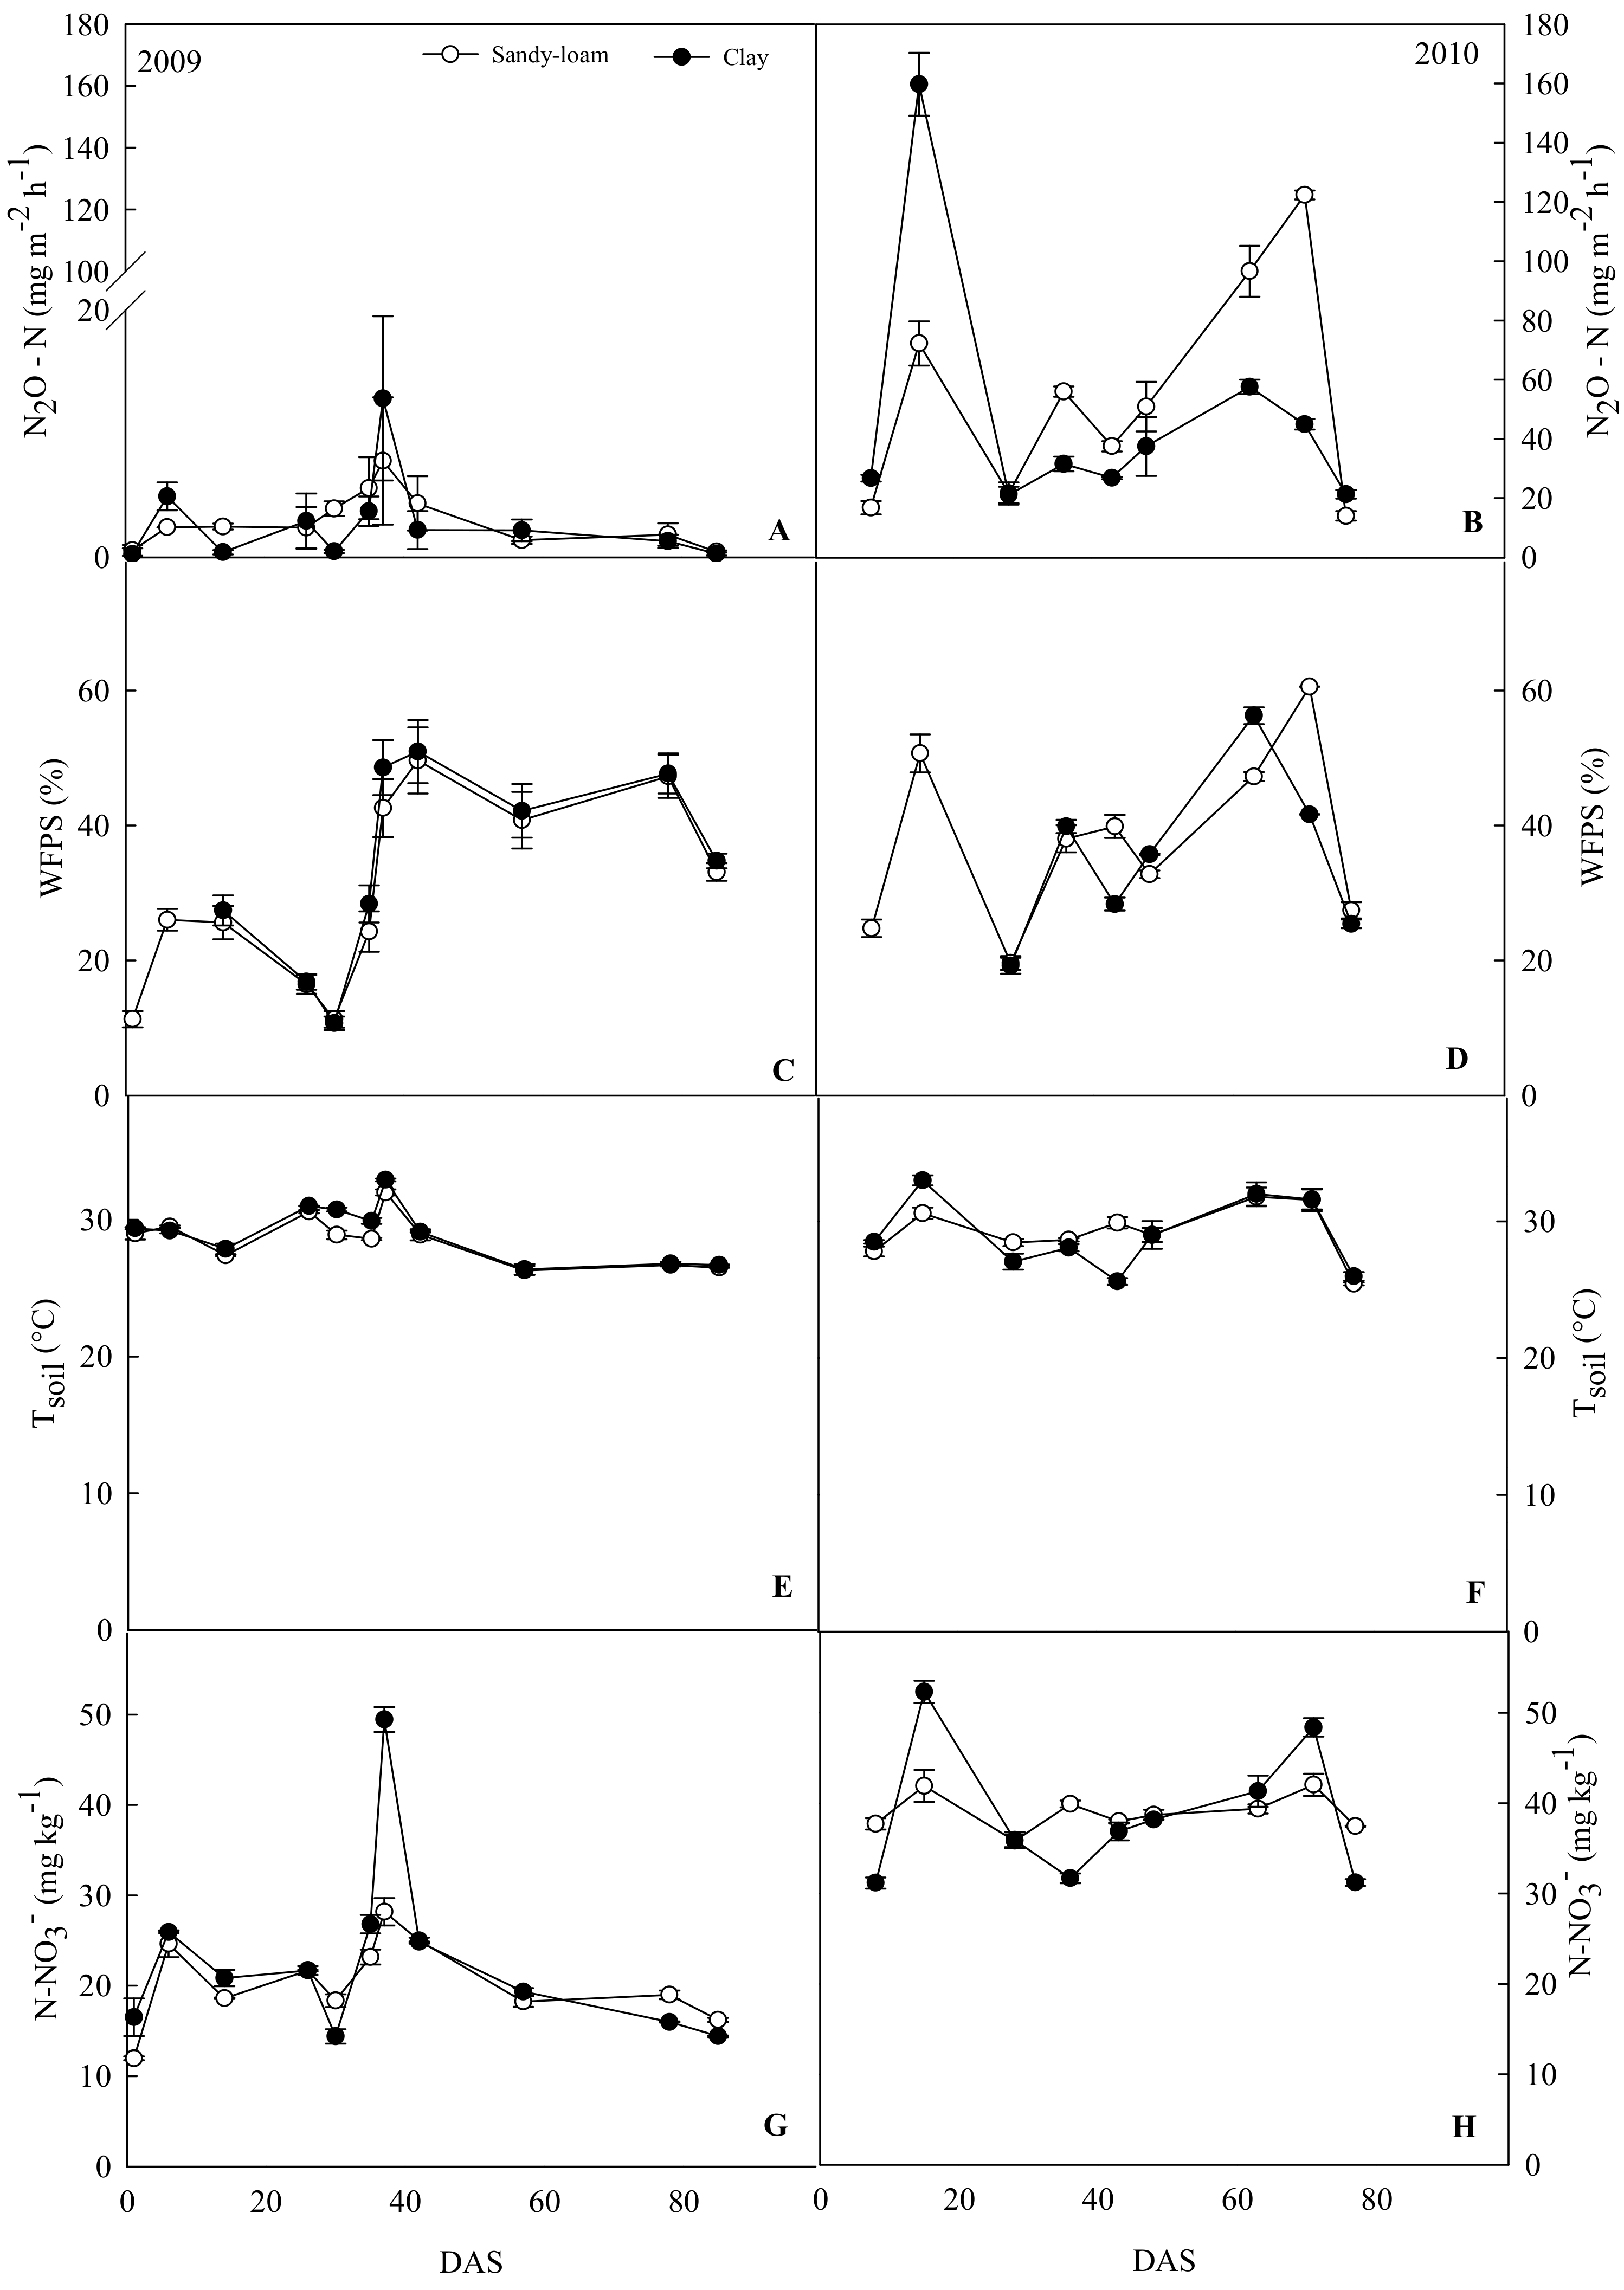
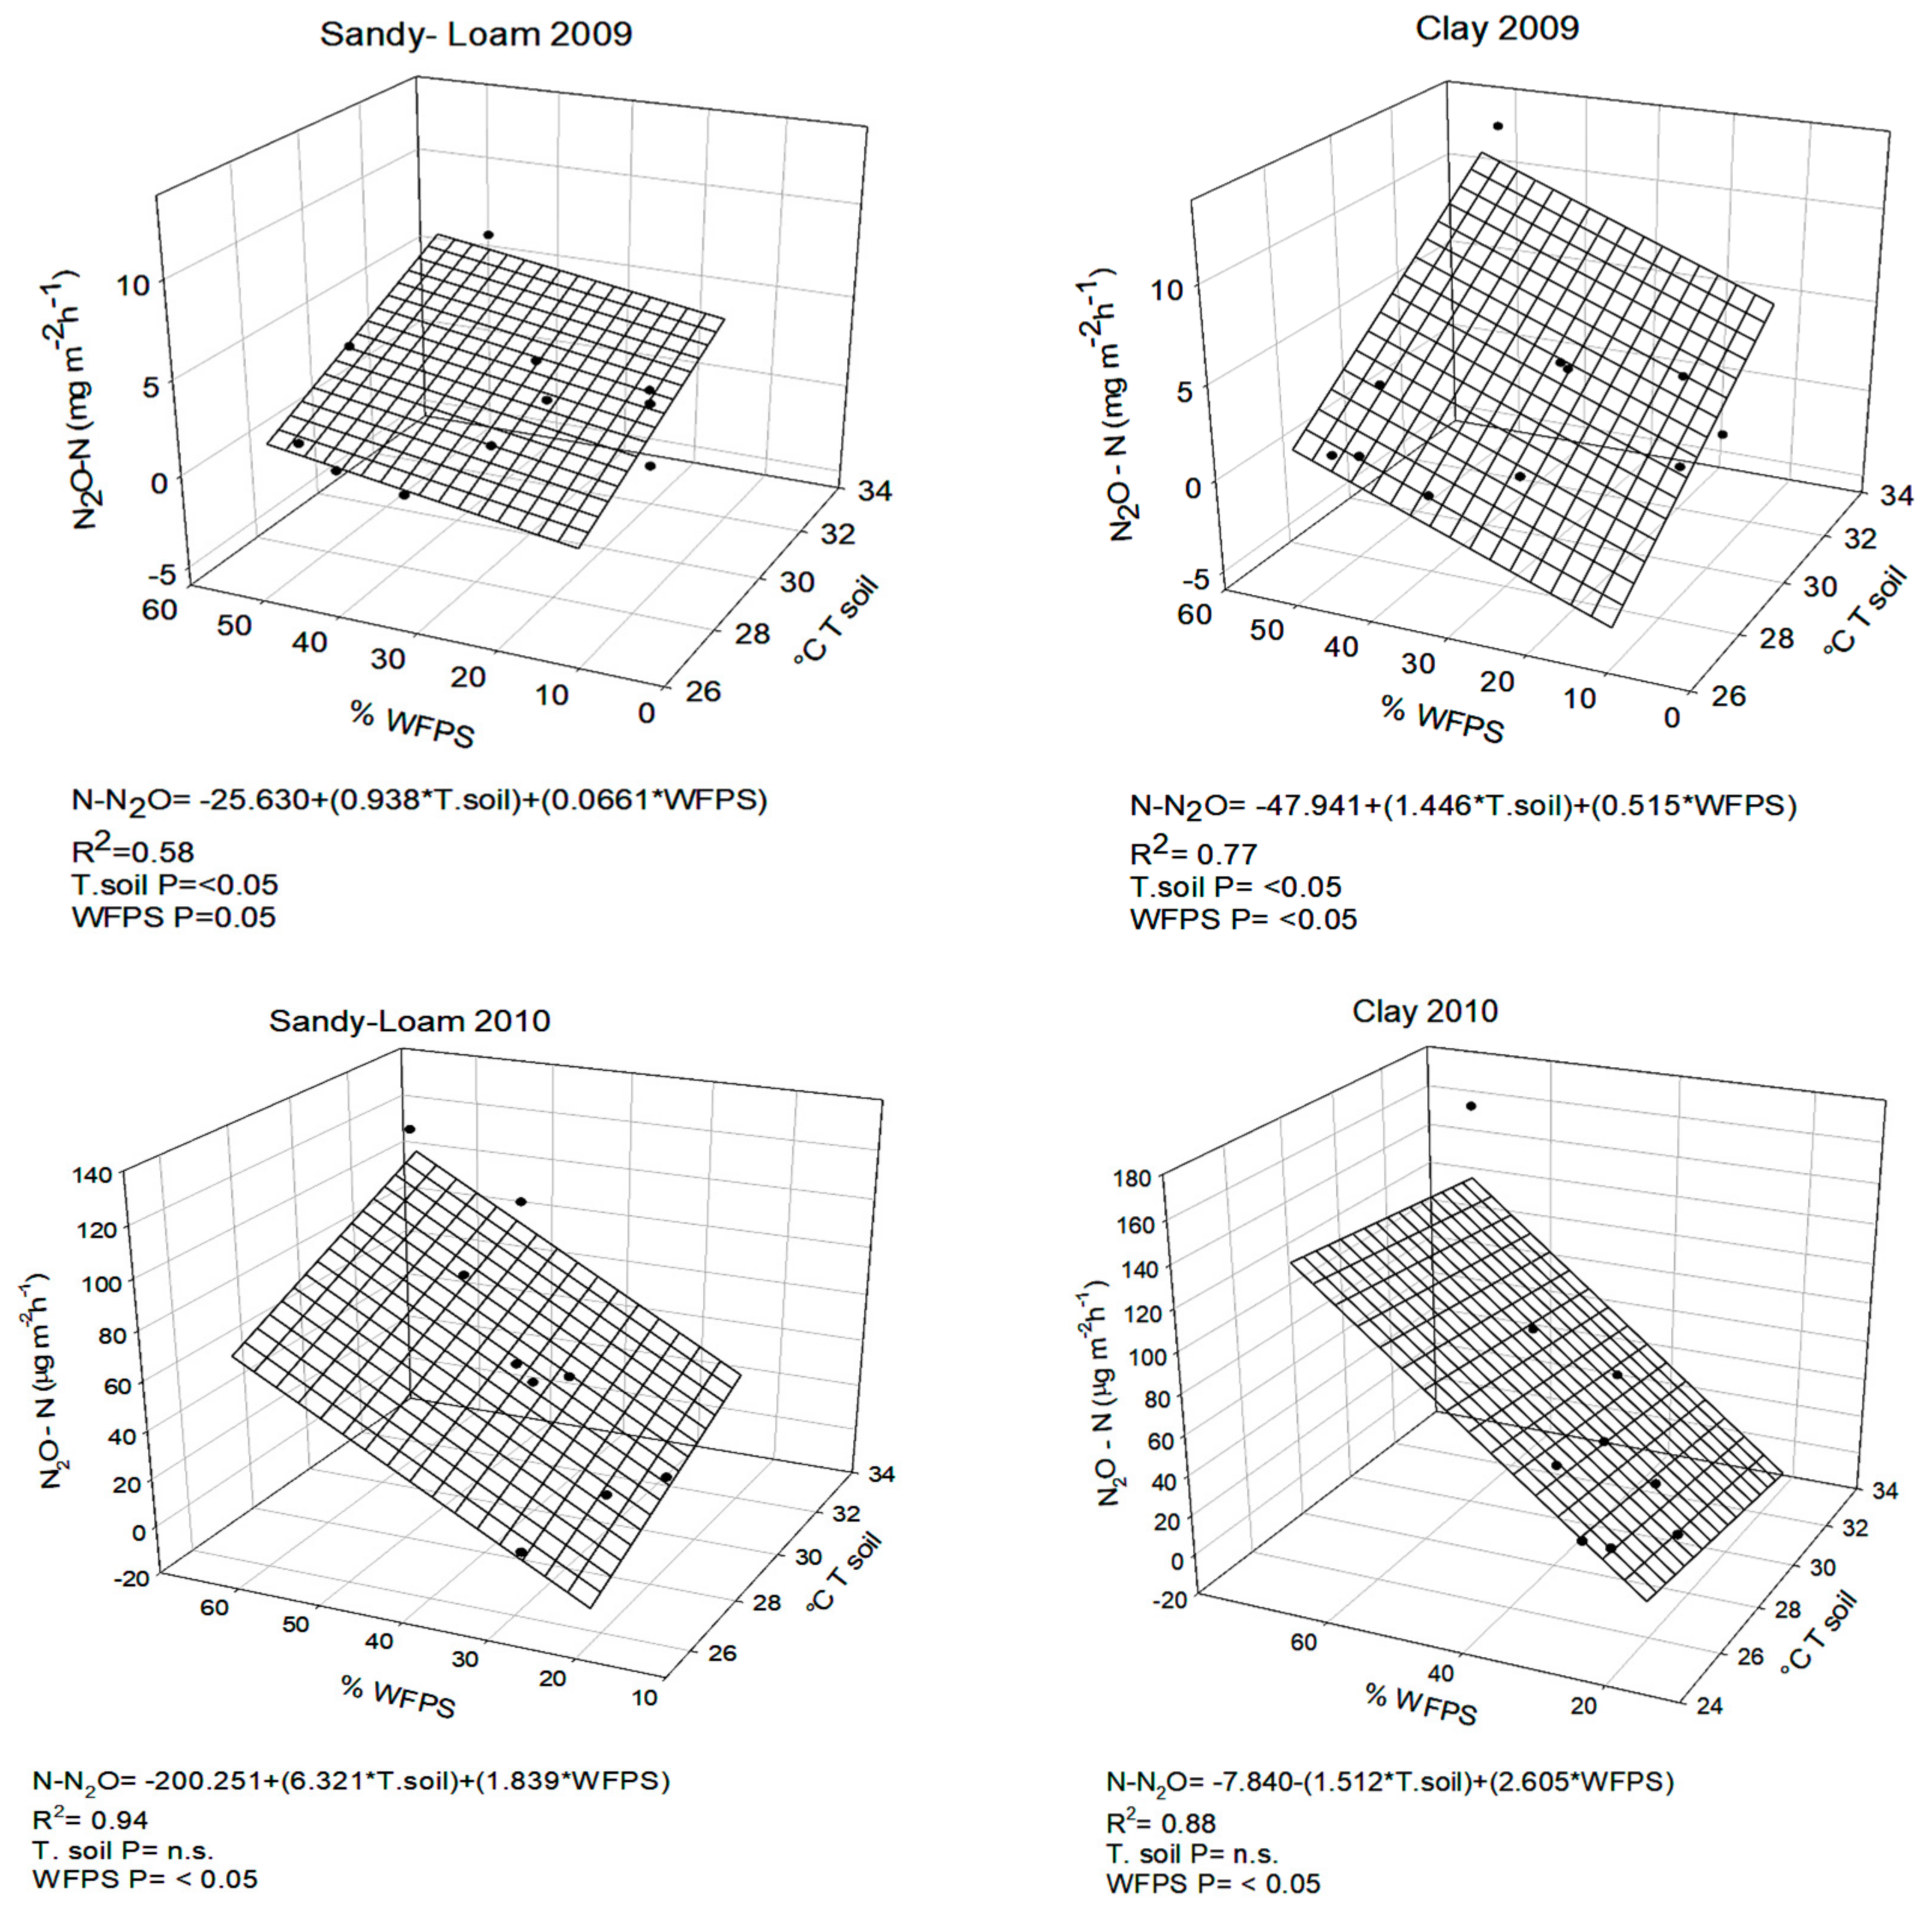
3.1. Soil Related Measurements and N2O Fluxes in Clay and Sandy-Loam Sites

The N2O emissions showed different trends during the two years studied (Figure 2A,B). Lower N2O fluxes were measured during 2009 (0.57–7.8 mg m−2 h−1) compared with 2010 (4.9–160 mg m–2 h−1). This was due to different crop management the farmer executed in the two years, in terms of water supply, which likely also influenced the N availability in the soil. The lowest NO3 content in the soil found in 2009 seems to indicate a reduced dissolution of fertilizer in the soil, whereas microorganisms need nitrogen in the soil solution for their growth. It is likely that the N availability for the microbes was reduced, limiting the N2O emissions.
Irrigation controls soil water content, which in turn controls N2O emissions. The low water supply by irrigation that occurred soon after sowing in 2009 was inadequate to elevate the WFPS to appropriate levels so as to trigger significant N2O fluxes in both soil types. With the second fertilization, the farmer supplied more water, and this was sufficient to elevate the WFPS up to about 50% in both sites (Figure 2C,D).
On average, the temperature of the sandy-loam soil was 28.6 °C and 29.3 °C in 2009 and 2010, respectively; in the clay soil, the temperature was an average of 29 °C for both years. These temperatures are optimal for the activity of soil microorganisms (Figure 2E,F).
As a result, a peak in N2O fluxes occurred at about 37 DAS, and was greater in the clay soil than in the sandy-loam soil (Figure 2A,B). This was likely because the DMPP nitrification inhibitor might have a low effectiveness in inhibiting ammonium oxidation in clay soil, as previously demonstrated by Bart et al. [34]. More studies have reported that greater soil moisture is a promoter of anaerobic conditions in the soil and, therefore, plays a more important role than denitrification, which is not affected by the inhibitory effect of DMPP [35,36]. The water amount supplied after sowing in 2010 determined greater N2O peaks than those measured during 2009, and as a consequence, increased WFPS up to about 60% and had a greater N availability in the soil (Figure 2G,H); these peaks were greater in the clay soil compared with sandy-loam soil, proving again the role of clay particles in influencing the effectiveness of DMPP. As reported by Dobbie and Smith [37], WFPS is the main conditioning factor of N2O emissions when the NO3 concentration in the soil and the temperature are not limited. Following the second fertilization, the sandy-loam soil was leaking more nitrogen as N2O than the clay soil. In the latter, the N2O emissions peaked at about 63 DAS, whereas in the sandy-loam soil, the emission peak occurred eight days later (72 DAS). Forte et al. [38] reported lower N2O emissions from sandy-loam soil compared with clay soil in a study performed in previous years on the same field, whereas Vitale et al. [28] found a reduced leaf area in maize plants grown on a sandy-loam site compared with plants grown on a clay site. We speculate that the reduced canopy leaf area allowed for greater penetration of radiation into the deeper layers of the canopy, causing higher soil temperatures at the topmost soil layer where the fertilizer was applied, reducing the effectiveness of DMPP in inhibiting nitrification. The greater oxygen availability in the sandy-loam soil, due to a low WFPS (20–25%), promoted higher N2O emissions than in the clay soil.
Although N availability in the soil is the major driver for N2O emissions, soil moisture and temperature affect N2O emissions by regulating oxygen availability to the soil microorganisms and the microbial metabolism, respectively [39]. The different crop management that occurred between the two studied years determined differences in N2O fluxes, depending on the soil-related variables. In both years, we found a dependence of soil N2O emissions on nitrate and WFPS (Figure 3), and a positive relationship with soil temperature only in 2009. It could be stated that under well-watered conditions, the effect of temperature on N2O emissions could be masked by soil moisture. In fact, under a reduced water supply, the soil temperature had more weight than WFPS in driving N2O emissions (higher regression coefficients; Figure 3). In the present study, we also found a different trend of fluxes in relation to the soil type, which is reflected in the different dependence on soil-related variables (Figure 3). The latter seem to have more of an influence on nitrous oxide emissions in clay than in sandy-loam soil, highlighting the influence of the soil physical–chemical properties on the soil variables that drive GHGs fluxes. This result was confirmed by Tan et al. [39], who reported higher N2O emissions in clay soil than in sandy-loam soil. Other authors have also reported this information, concluding that soil texture is a critical characteristic for estimating future N2O emissions from agricultural fields [40].
WFPS is the parameter that influences the contributions of the nitrification and denitrification processes in N2O production [41].
Soil moisture controls N2O production by nitrification and denitrification, because O2 availability is closely linked to soil water status. Nitrification is an aerobic process, and O2 is an important substrate for nitrification, whereas denitrification is an anaerobic process. WFPS drives both processes, which are characterized by different optimal WFPS. It is well known that nitrification dominates over denitrification with between 20–60% WFPS, with the optimal WFPS being within the range of 45–60%, depending on the soil texture, whereas denitrification dominates over nitrification with a WFPS higher than 70–80%, depending on the soil texture [42]. In the present study, we recorded that WFPS was always lower than 60% over the entire growing seasons. Moreover, we also found a positive relationship between N2O fluxes and nitrate. We hypothesize that nitrification was likely the main process contributing to N2O emission in both soil types. However, the significant contribution of denitrification at a high WFPS due to local anoxia in micro-sites, especially in clay soil, characterized by a higher capacity to retain water, is not to be excluded. These results have also been observed by Dobbie et al. [43] and Ruser et al. [44], who reported a strong increase in N2O emissions for WFPS above 60–70%, suggesting that it was denitrification and not nitrification that was the main process involved in the emissions.
The data reported in the present study show that crop management impacts not only crop productivity, but also on the environment and climate in terms of GHGs emissions. Cropping systems need an adequate water supply by irrigation in order to achieve optimal production, and this inevitably promotes conditions into the soil triggering GHG production, as it occurred during 2010, when the system had a massive source of N2O, on average 20 times more than in 2009 (Table 3). The careful management of irrigation could mitigate GHG emissions, allowing for adequate crop productivity and making cropping systems less impactful on the climate and environment. The use of fertilizers with an added nitrification inhibitor could represent a further strategy to mitigate GHG emissions from arable soils. In this study, fertilizer with a DMPP nitrification inhibitor was used, and during the well-watered season (2010), lower amounts than other Mediterranean cropping systems with conventional management were used [26,45].

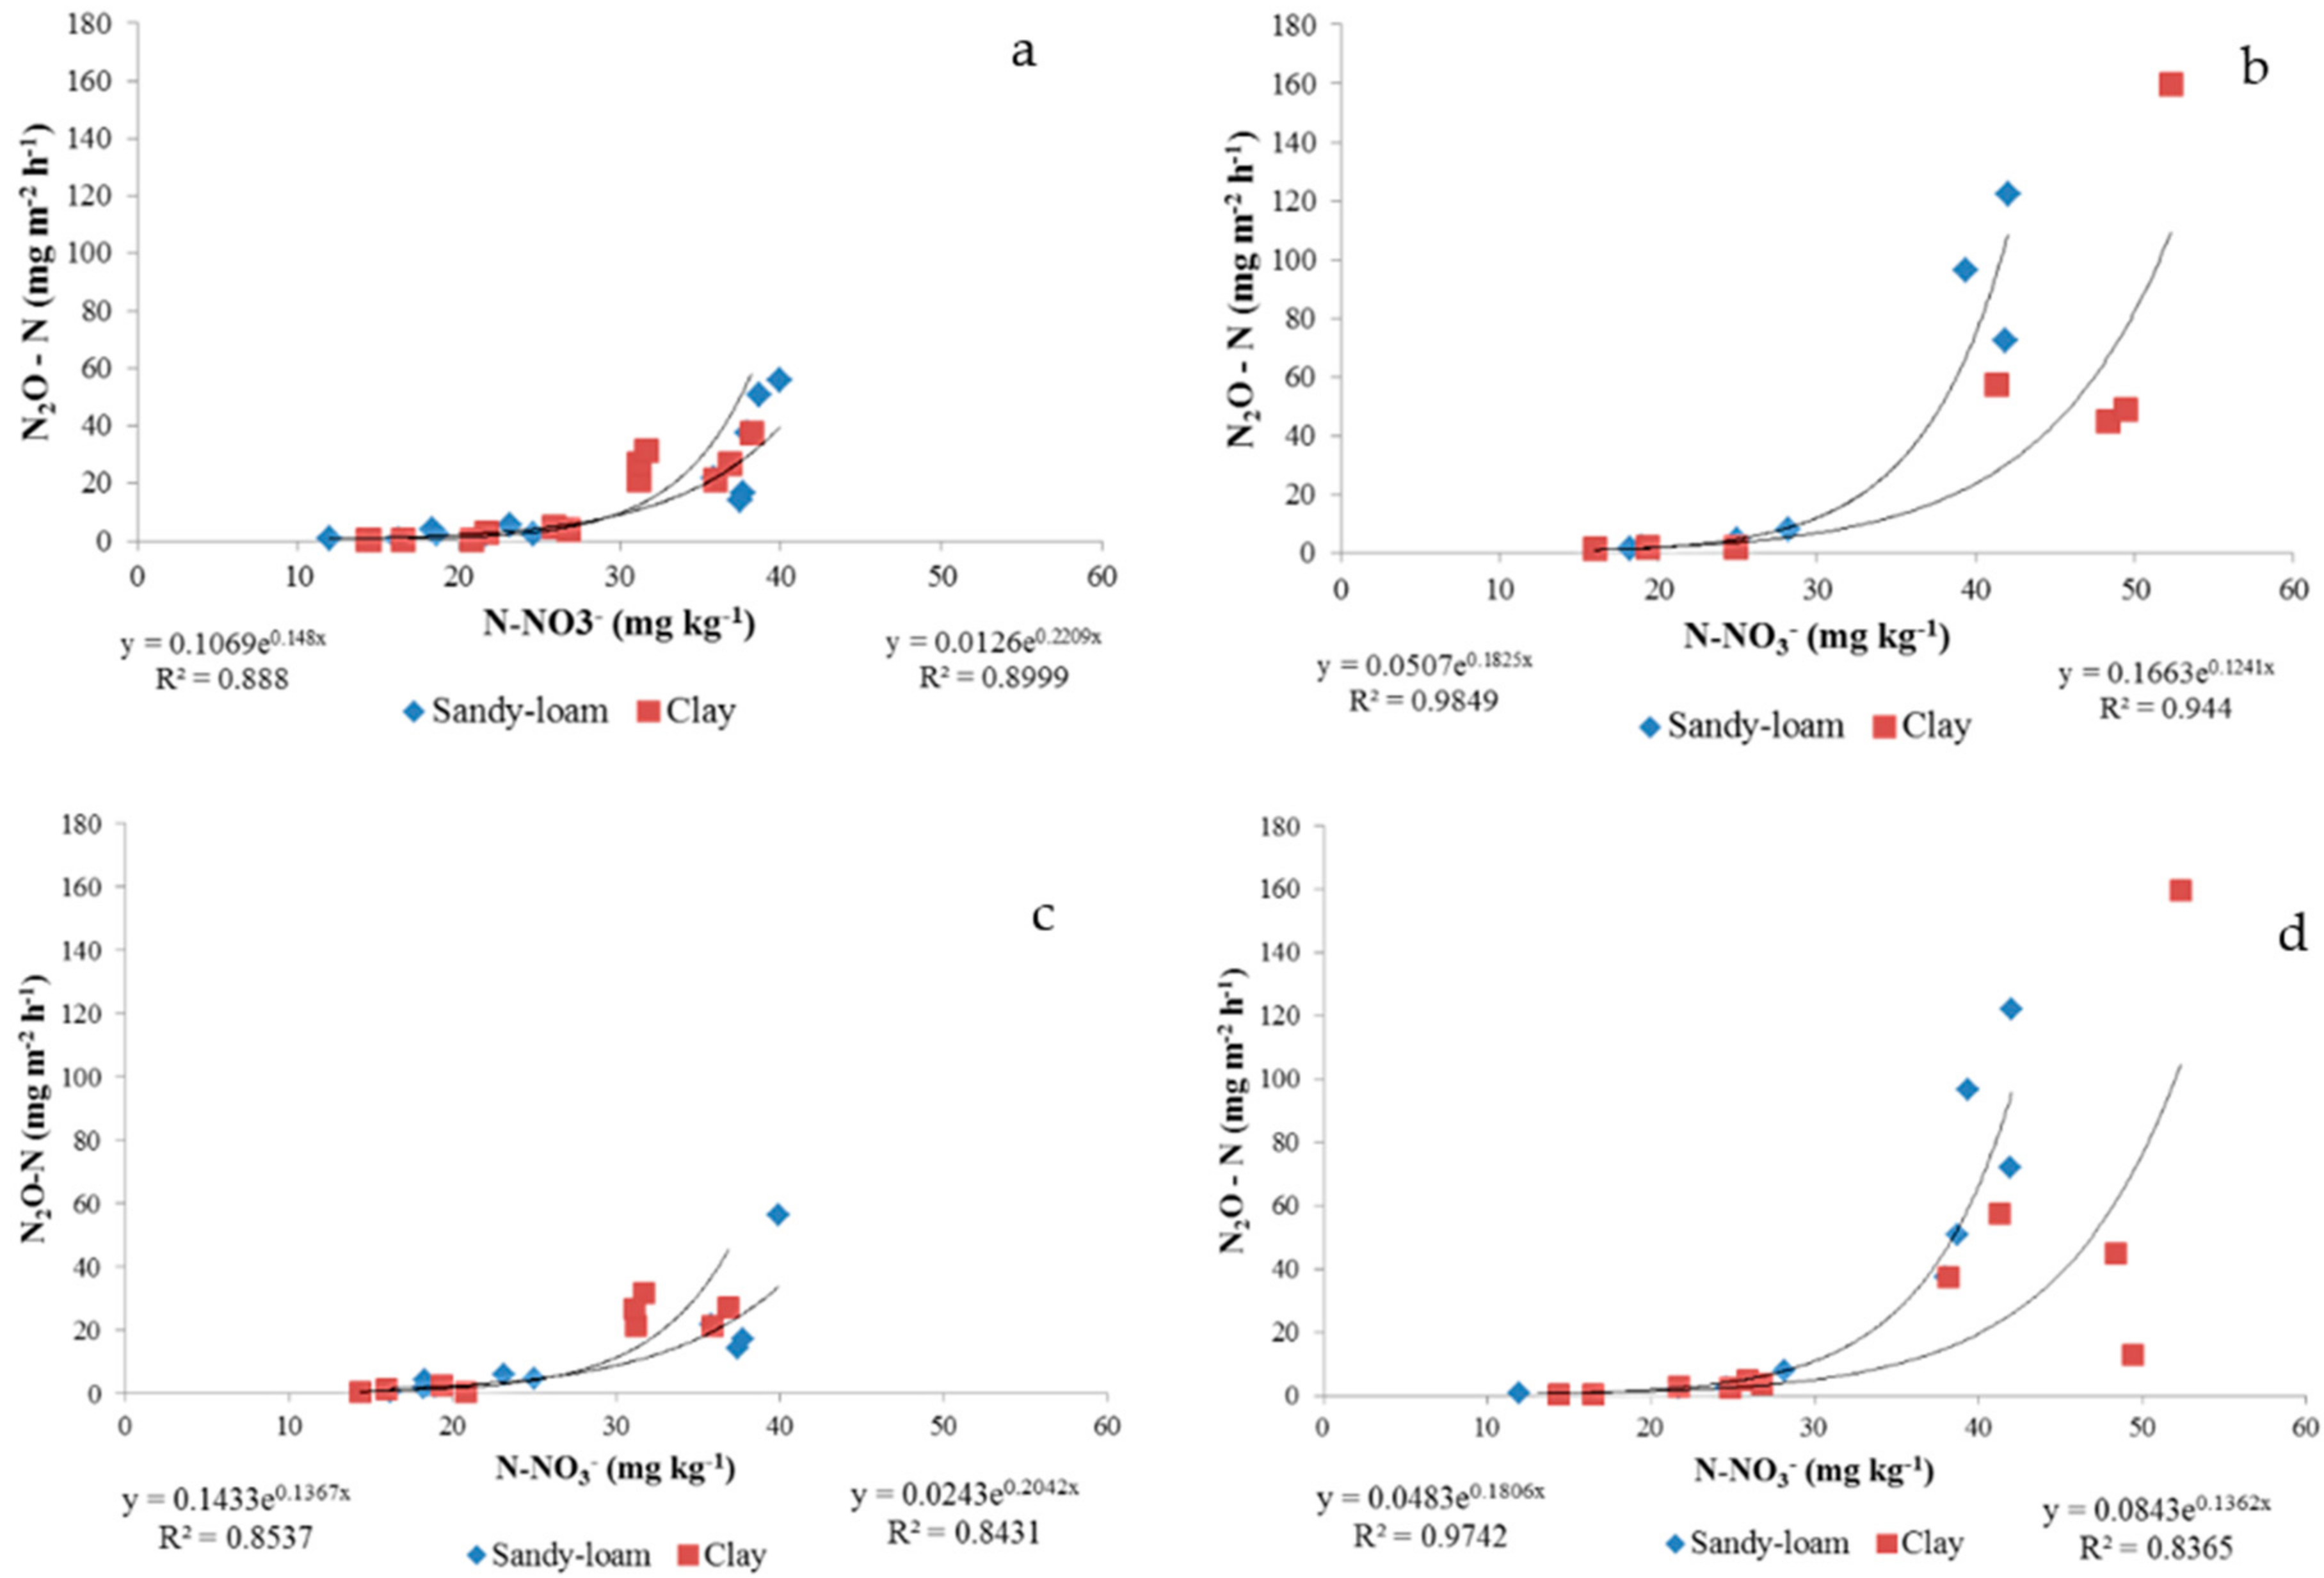
3.2. Regression Analysis on the Whole Dataset

The whole dataset has been divided into SL and C soils, and the response functions of N2O flux to soil nitrate concentration, WFPS, and soil have been modelled according to simple exponential and linear functions (Figure 4).
In these regressions, it was observed that for both soils at soil nitrate concentrations below 30 mg NO3-N kg−1, N2O emissions remained basal. Forte et al. [46] also observed that the rate of nitrate in the soil under which the flux N2O emissions remained basal is 15 mg NO3-N kg−1.
The N2O flows showed an exponential correlation with the soil nitrate concentration for both WFPS ranges (Figure 4), but the slope of the N2O flux curve was higher in the sandy-loam soil than clay soil (Figure 4b). Similar trends were also observed at both temperature ranges (25–28 °C Tsoil and 29–32 °C Tsoil; Figure 4c,d). The different curve slope could be related to the NH4+ adsorption by soil colloids [47] and the higher maize production. Moreover, considering that soil porosity and water content are key parameters influencing gas diffusion in clay soils with a high WFPS, N2O diffusion out of the soil can become restricted, and a significant amount of N2O can be reduced to N2 before it can escape from the soil [48].

3.3. Above-Ground Biomass on Clay and Sandy-Loam Sites

The above-ground biomass (AGB) was different between the two years (Table 4). The AGB was lower in 2009 than in 2010 because of the lower amount of water the crops received. Differences in AGB between the two sites were found only in 2010; plants grown on the clay site had a greater dry matter than the plants grown on the sand site. These data are in contrast with data previously reported by Vitale et al. [28], who found, in a study performed in 2006, no differences in plant growth and biomass between the two sites. A possible explanation of this difference could be the higher frequency of irrigation events during 2006.

4. Conclusions

In our research, the different soil textures affected N2O emissions in different manners; the highest peaks of N2O were recorded in clay soils. However, soil moisture and temperature, as well as nitrogen availability, strongly influence N2O emissions. Under reduced moisture, soil temperature plays a significant role in driving N2O emissions, whereas in well-wetting soils, the effect of temperature on N2O emission could be masked by soil moisture. At a high soil moisture, the sandy-loam soil releases N2O emissions more fast than the clay soil. Careful management of the irrigation would mitigate GHG emissions, allowing for adequate crop productivity and making cropping systems less impactful on the climate and environment. The use of fertilizers with added nitrification inhibitors could represent a further strategy to mitigate GHG emissions from arable soils.

Author Contributions

Conceptualization, M.M. and V.M.; methodology, L.O. and L.V.; software, I.D.M. and L.O.; validation, I.D.M., L.O., and L.V.; formal analysis, L.O.; investigation, P.D.T., I.D.M., and L.O.; resources, M.M.; data curation, L.O. and L.V.; writing—original draft preparation, L.O. and L.V.; writing—review and editing, V.M., M.M., and L.V. All authors have read and agreed to the published version of the manuscript.

Funding

This research received no external funding.

Conflicts of Interest

The authors declare no conflict of interest.

References

  1. Netz, B.; Davidson, O.R.; Bosch, P.R.; Dave, R.; Meyer, L.A. Climate Change 2007: Mitigation. Contribution of Working Group III to the Fourth Assessment Report of the Intergovernmental Panel on Climate Change. Summary for Policymakers; Netz, B., Davidson, O.R., Bosch, P.R., Dave, R., Meyer, L.A., Eds.; Intergovernmental Panel on Climate Change (IPCC): Geneva, Switzerland, 2007. [Google Scholar]
  2. Xu, X.F.; Tian, H.Q.; Chen, G.S.; Liu, M.L.; Ren, W.; Lu, C.Q.; Zhang, C. Multifactor controls on terrestrial N2O flux over North America from 1979 through 2010. Biogeosciences 2012, 9, 1351–1366. [Google Scholar] [CrossRef] [Green Version]
  3. Ciais, P.; Sabine, C.; Bala, G.; Bopp, L.; Brovkin, V.; Canadell, J.; Chhabra, A.; DeFries, R.; Galloway, J.; Heimann, M.; et al. Carbon and Other Biogeochemical Cycles. In Climate Change 2013: The Physical Science Basis. Contribution of Working Group I to the Fifth Assessment Report of the Intergovernmental Panel on Climate Change; Cambridge University Press: Cambridge, UK, 2013. [Google Scholar]
  4. Cayuela, M.; Aguilera, E.; Sanz-Cobena, A.; Adams, D.; Abalos, D.; Barton, L.; Ryals, R.; Silver, W.L.; Alfaro, M.A.; Pappa, V.A.; et al. Direct nitrous oxide emissions in Mediterranean climate cropping systems: Emission factors based on a meta-analysis of available measurement data. Agric. Ecosyst. Environ. 2017, 238, 25–35. [Google Scholar] [CrossRef] [Green Version]
  5. Syakila, A.; Kroeze, C. The global nitrous oxide budget revisited. Greenh. Gas Meas. Manag. 2011, 1, 17–26. [Google Scholar] [CrossRef]
  6. Wrage, N.; Velthof, G.L.; Van Beusichem, M.L.; Oenema, O. Role of nitrifier denitrification in the production of nitrous oxide. Soil Biol. Biochem. 2001, 33, 1723–1732. [Google Scholar] [CrossRef]
  7. Shakoor, A.; Xu, Y.; Wang, Q.; Chen, N.; He, F.; Zuo, H.; Yin, H.; Yan, X.; Ma, Y.; Yang, S. Effects of fertilizer application schemes and soil environmental factors on nitrous oxide emission fluxes in a rice-wheat cropping system, east China. PLoS ONE 2018, 13, e0202016. [Google Scholar] [CrossRef] [PubMed]
  8. Kumar, A.; Medhi, K.; Fagodiya, R.K.; Subrahmanyam, G.; Mondal, R.; Raja, P.; Malyan, S.K.; Gupta, D.K.; Gupta, C.K.; Pathak, H. Molecular and ecological perspectives of nitrous oxide producing microbial communities in agro-ecosystems. Rev. Environ. Sci. Biotechnol. 2020, 19, 717–750. [Google Scholar] [CrossRef]
  9. Fagodiya, R.K.; Pathak, H.; Bhatia, A.; Jain, N.; Gupta, D.K.; Kumar, A.; Tomer, R. Nitrous oxide emission and mitigation from maize–wheat rotation in the upper Indo-Gangetic Plains. Carbon Manag. 2019, 10, 489–499. [Google Scholar] [CrossRef]
  10. Davidson, E.A.; Keller, M.; Erickson, H.E.; Verchot, L.V.; Veldkamp, E. Testing a conceptual model of soil emissions of nitrous and nitric oxides: Using two functions based on soil nitrogen availability and soil water content, the hole-in-the-pipe model characterizes a large fraction of the observed variation of nitric oxide and nitrous oxide emissions from soils. Bioscience 2000, 50, 667–680. [Google Scholar]
  11. Schindlbacher, A.; Zechmeister-Boltenstern, S.; Butterbach-Bahl, K. Effects of soil moisture and temperature on NO, NO2, and N2O emissions from European forest soils. J. Geophys. Res. Atmos. 2004, 109. [Google Scholar] [CrossRef]
  12. Ranjan, R.; Yadav, R. Targeting nitrogen use efficiency for sustained production of cereal crops. J. Plant Nutr. 2019, 42, 1086–1113. [Google Scholar] [CrossRef]
  13. Khalil, M.I.; Hossain, M.B.; Schmidhalter, U. Carbon andnitrogen mineralization in different upland soils of the sub-tropics treated with organic materials. Soil Biol. Biochem. 2005, 37, 1507–1518. [Google Scholar] [CrossRef]
  14. Zebarth, B.J.; Forge, T.A.; Goyer, C.; Brin, L.D. Effect ofsoil acidification on nitrification in soil. Can. J. Soil Sci. 2015, 95, 359–363. [Google Scholar] [CrossRef]
  15. Šimek, M.; Jíšová, L.; Hopkins, D.W. What is the so-called optimum pH for denitrification in soil? Soil Biol. Biochem. 2002, 34, 1227–1234. [Google Scholar] [CrossRef]
  16. Eichner, M.J. Nitrous oxide emissions from fertilized soils: Summary of available data. J. Environ. Qual. 1990, 19, 272–280. [Google Scholar] [CrossRef]
  17. Gebremichael, A.W.; Osborne, B.; Orr, P. Flooding-related increases in CO2 and N2O emissions from a temperate coastal grassland ecosystem. Biogeosciences 2017, 14, 2611–2626. [Google Scholar] [CrossRef] [Green Version]
  18. Shakoor, A.; Shahbaz, M.; Hassan, T.; Sahar, N.E.; Muhammad, S.; Mohsin, M.; Ashraf, M. A global meta-analysis of greenhouse gases emission and crop yield under no-tillage as compared to conventional tillage. Sci. Total Environ. 2021, 750, 142299. [Google Scholar] [CrossRef]
  19. Liu, H.S.; Li, L.H.; Han, X.G.; Huang, J.H.; Sun, J.X.; Wang, H.Y. Respiratory substrate availability plays a crucial role in the response of soil respiration to environmental factors. Appl. Soil Ecol. 2006, 29, 284–293. [Google Scholar] [CrossRef]
  20. Merbold, L.; Eugster, W.; Stieger, J.; Zahniser, M.; Nelson, D.; Buchmann, N. Greenhouse gas budget (CO2, CH4 and N2O) of intensively managed grassland following restoration. Glob. Chang. Biol. 2014, 20, 1913–1928. [Google Scholar] [CrossRef]
  21. Tian, Y.; Luo, C.; Lu, Y.; Tang, C.; Ouyang, Q. Cell cycle synchronization by nutrient modulation. Integr. Biol. 2012, 4, 328–334. [Google Scholar] [CrossRef]
  22. Davidson, E.A.; Hart, S.C.; Shanks, C.A.; Firestone, M.K. Measuring gross nitrogen mineralization, immobilization, and nitrifi cation by 15 N isotopic pool dilution intact soil cores. J. Soil Sci. 1991, 42, 335–349. [Google Scholar] [CrossRef]
  23. Bollmann, A.; Conrad, R. Influence of O2 availability on NO and N2O release by nitrification and denitrification in soils. Glob. Chang. Biol. 1998, 4, 387–396. [Google Scholar] [CrossRef]
  24. Saxton, K.E.; Rawls, W.; Romberger, J.S.; Papendick, R.I. Estimating generalized soil-water characteristics from texture. Soil Sci. Soc. Am. J. 1986, 50, 1031–1036. [Google Scholar] [CrossRef]
  25. Smith, K.A. Changing views of nitrous oxide emissions from agricultural soil: Key controlling processes and assessment at different spatial scales. Eur. J. Soil Sci. 2017, 68, 137–155. [Google Scholar] [CrossRef]
  26. Aguilera, E.; Lassaletta, L.; Sanz-Cobena, A.; Garniere, J.; Vallejo, A. The potential of organic fertilizers and water management to reduce N2O emissions in Mediterranean climate cropping systems. A review. Agric. Ecosyst. Environ. 2013, 164, 32–52. [Google Scholar] [CrossRef] [Green Version]
  27. Castaldi, S.; Alberti, G.; Bertolini, T.; Forte, A.; Miglietta, F.; Valentini, R.; Fierro, A. N2O Emission Factors for Italian Crops. In The Greenhouse Gas Balance of Italy; Environmental Science and Engineering; Valentini, R., Miglietta, E.F., Eds.; Springer: Berlin, Germany, 2015; Chapter 9; pp. 135–144. [Google Scholar]
  28. Vitale, L.; Di Tommasi, P.; Arena, C.; Riondino, M.; Forte, A.; Verlotta, A.; Fierro, A.; Virzo De Santo, A.; Fuggi, A.; Magliulo, V. Growth and gas exchange response to water shortage of a maize crop on different soil types. Acta Physiol. Plant. 2009, 31, 331–341. [Google Scholar] [CrossRef] [Green Version]
  29. Hutchinson, G.L.; Mosier, A.R. Improved soil cover method for field measurement of nitrous oxide fluxes. Soil Sci. Soc. Am. J. 1981, 45, 311–316. [Google Scholar] [CrossRef]
  30. Smith, K.A.; Clayton, H.; McTaggart, I.P.; Thomson, P.E.; Arah, J.R.M.; Scott, A. The measurement of nitrous oxide emissions from soil by using chambers. Philos. Trans. R. Soc. 1995, 351, 27–38. [Google Scholar]
  31. Ranucci, S.; Bertolini, T.; Vitale, L.; Di Tommasi, P.; Ottaiano, L.; Oliva, M.; Magliulo, V. The influence of management and environmental variables on soil N2O emissions in a crop system in Southern Italy. Plant Soil 2001, 343, 83–96. [Google Scholar] [CrossRef]
  32. Rowell, D.L. Soil Science: Methods and Applications; Longman Ltd.: Harlow, UK, 1994; p. 61. [Google Scholar]
  33. Castaldi, S. Microbial Processes Contributing to N2O Production in Two Sandy Scottish Soils. Ph.D. Thesis, University of Edinburgh, Edinburgh, UK, 1997. [Google Scholar]
  34. Bart, G.; von Tucher, S.; Schmidhalter, U. Effectiveness of 3,4-dimethylpyrazole phosphate as nitrification inhibitor in soil as influenced by inhibitor concentration, application form, and soil matric potential. Pedosphere 2008, 18, 378–385. [Google Scholar] [CrossRef]
  35. Duan, Y.F.; Kong, X.W.; Schramm, A.; Labouriau, R.; Eriksen, J.; Petersen, S.O. Microbial N Transformations and N2O Emission after Simulated Grassland Cultivation: Effects of the Nitrification Inhibitor3,4-Dimethylpyrazole Phosphate (DMPP). Appl. Environ. Microbiol. 2017. [Google Scholar] [CrossRef] [Green Version]
  36. Vinzent, B.; Fuß, R.; Maidl, F.-X.; Hülsbergen, K.-J. N2O emissions and nitrogen dynamics of winter rapeseed fertilized with different N forms and a nitrification inhibitor. Agric. Ecosyst. Environ. 2018, 259, 86–97. [Google Scholar] [CrossRef]
  37. Dobbie, K.E.; Smith, K.A. Nitrous oxide emission factors for agricultural soils in Great Britain: The impact of soil water-filled pore space and other controlling variables. Glob. Chang. Biol. 2003, 9, 204–218. [Google Scholar] [CrossRef]
  38. Forte, A. Denitrification and Nitrification Activities and N2O Emissions of Fine and Coarse Texture Soils of a Mediterranean Irrigated Cropland in Southern Italy. Ph.D. Thesis, University of Naples Federico II, Naples, Italy, 2006. [Google Scholar]
  39. Tan, I.Y.S.; Van Es, H.M.; Duxbury, J.M.; Melkonian, J.J.; Schindelbeck, R.R.; Geohring, L.D.; Hively, W.D.; Moebius, B.N. Single-eventnitrous oxide losses under maize production as affected by soil type, tillage, rotation, and fertilization. Soil Tillage 2009, 102, 19–26. [Google Scholar] [CrossRef]
  40. Gaillard, R.; Duval, B.D.; Osterholz, W.R.; Kucharik, C.J. Simulated effects of soil texture on nitrous oxide emissionfactors from corn and soybean agroecosystems in Wis-consin. J. Environ. Qual. 2016, 45, 1540–1548. [Google Scholar] [CrossRef]
  41. Phan, T.; Farrell, R.; Kate, C. The effect of soil moisture onnitrous oxide flux and production pathway in different soiltypes. In Soils and Crops Workshop; University of Saskatchewan Canada: Saskatoon, SK, Canada, 2019. [Google Scholar]
  42. Bateman, E.J.; Baggs, E.M. Contributions of nitrification and denitrification to N2O emissions from soils at different water-filled pore space. Biol. Fertil. Soils 2005, 41, 379–388. [Google Scholar] [CrossRef]
  43. Dobbie, K.E.; McTaggart, I.P.; Smith, K.A. Nitrous oxide emissions from intensive agricultural systems: Variations between crops and seasons, key driving variables, and mean emission factors. J. Geophys. Res. Atmos. 1999, 104, 26891–26899. [Google Scholar] [CrossRef]
  44. Ruser, R.; Flessa, H.; Russow, R.; Schmidt, G.; Buegger, F.; Munch, J.C. Emission of N2O, N2 and CO2fromsoil fertilized with nitrate: Effect of compaction, soil moisture and rewetting. Soil Biol. Biochem. 2006, 38, 263–274. [Google Scholar] [CrossRef]
  45. Yuttitham, M.; Chidthaisong, A.; Ruangchu, U. N2O fluxes and direct N2O emission factors from maize cultivation on Oxisols in Thailand. Geoderma Reg. 2020, 20, e00244. [Google Scholar] [CrossRef]
  46. Forte, A.; Fierro, A. Denitrification Rate and Its Potential to Predict Biogenic N2O Field Emissions in a Mediterranean Maize-Cropped Soil in Southern Italy. Land 2019, 8, 97. [Google Scholar] [CrossRef] [Green Version]
  47. Li, D.; Watson, C.J.; Yan, M.J.; Lalor, S.; Rafique, R.; Hyde, B.; Humphreys, J. A review of nitrous oxide mitigation by farm nitrogen management in temperate grassland-based agriculture. J. Environ. Manag. 2013, 128, 893–903. [Google Scholar] [CrossRef] [Green Version]
  48. Arah, J.R.M.; Smith, K.A.; Cricthon, I.J.; Li, H.S. Nitrous oxide production and denitrification in Scottish arable soils. J. Soil Sci. 1991, 42, 351–367. [Google Scholar] [CrossRef]
Figure 1. Monthly averages minimum (black diamonds) and maximum (gray triangles) air temperature and rainfall plus irrigation (bars) during the two contrasting grown seasons.
Agriculture 10 00623 g001
Figure 2. (A,B) N2O-N fluxes, (C,D) WFPS, (E,F) soil temperature, and (G,H) nitrate content, measured on clay and sandy-loam sites during 2009 and 2010 years, respectively. DAS—days after sowing. Data are means (n = 3) ± Standard Error.
Agriculture 10 00623 g002
Figure 3. Multiple linear regression for the relationship between N2O fluxes and soil-related measurements.
Agriculture 10 00623 g003
Figure 4. (a) N2O fluxes vs. soil nitrate concentration in the 10–39% WFPS range and (b) 40–60% WFPS range; (c) N2O fluxes vs. soil nitrate concentration in the 25–28 °C Tsoil range and in the (d) 29–32 °C Tsoil range.
Agriculture 10 00623 g004
Table 1. Physical and chemical soil properties. OM—organic matter; FC—water field capacity; WFPS—water filled pore space at field capacity.
ProfileSandy
(%)
Silt
(%)
Clay
(%)
pHOM (%)Bulk Density
(g cm−3)
FC
(gwater g−1 dw)
WFPS at FC
(%)
USDA
Est29.822.148.17.633.71.150.20645.4Clay
West75.011.014.07.657.81.010.39178.3Sandy-Loam
Data are means (n = 3).
Table 2. The crop management.
YearSowing1° Fertilization2° FertilizationHarvestingTotal Water Supplied (mm)
200912–13 June12–13 June
68 kg N ha−1
10 July
190 kg N ha−1
8–9 September389
201018–19 June18–19 June
65 kg N ha−1
20 July
187 kg N ha−1
21–22 September476
Table 3. Cumulative N2O fluxes expressed as the CO2 equivalent.
YearsSoil TextureN2O
Kg CO2 Equiv
2009SL23.15 ± 0.44
C25.32 ± 0.45
2010SL461.18 ± 14.31
C520.39 ± 17.88
Table 4. Dry matter yield (t ha−1) of the corn grown on clay and sandy-loam sites in 2009 and 2010.
Soil Type20092010
Clay19.72 ± 2.75 c28.70 ± 1.83 a
Sandy–Loam18.59 ± 1.15 c24.00 ± 1.58 b
Data are mean (n = 3) ± Standard Error. Different letters denote significant differences between years and sites (p ≤ 0.05).
Publisher’s Note: MDPI stays neutral with regard to jurisdictional claims in published maps and institutional affiliations.

