Article

Pyrenophora teres and Rhynchosporium secalis Establishment in a Mediterranean Malt Barley Field: Assessing Spatial, Temporal and Management Effects

by
Petros Vahamidis
1,
Angeliki Stefopoulou
2,
Christina S. Lagogianni
3,
Garyfalia Economou
1,
Nicholas Dercas
2,
Vassilis Kotoulas
4,
Dionissios Kalivas
5 and
Dimitrios I. Tsitsigiannis
3,*
1
Laboratory of Agronomy, Department of Crop Science, Agricultural University of Athens, 75 Iera Odos, 11855 Athens, Greece
2
Laboratory of Agricultural Hydraulics, Department of Natural Resources Management & Agricultural Engineering, Agricultural University of Athens, 75 Iera Odos, 11855 Athens, Greece
3
Laboratory of Plant Pathology, Department of Crop Science, Agricultural University of Athens, 75 Iera Odos, 11855 Athens, Greece
4
Athenian Brewery S.A, 102 Kifissos Avenue, Aegaleo, 12241 Athens, Greece
5
Laboratory of Soil Science and Agricultural Chemistry, Department of Natural Resources Management & Agricultural Engineering, Agricultural University of Athens, 75 Iera Odos, 11855 Athens, Greece
*
Author to whom correspondence should be addressed.
Agriculture 2020, 10(11), 553; https://doi.org/10.3390/agriculture10110553
Submission received: 7 October 2020 / Revised: 8 November 2020 / Accepted: 16 November 2020 / Published: 18 November 2020
(This article belongs to the Special Issue Integrated Pest Management of Field Crops)

Abstract

:
Malt barley is one of the promising crops in Greece, mainly due to high yields and contract farming, which have led to an increase in malt barley acreage. Net form net blotch (NFNB), caused by Pyrenophora teres f. teres, and barley leaf scald, caused by Rhynchosporium secalis, are among the most important barley diseases worldwide and particularly in Greece. Their occurrence in malt barley can exert a significant negative effect on malt barley grain yield and quality. An experimental trial across two growing seasons was implemented in Greece in order (i) to estimate the epidemiology of NFNB and leaf scald in a barley disease-free area when the initial inoculation of the field occurs through infected seeds, (ii) to explore the spatial dynamics of disease spread under the interaction of the nitrogen rate and genotype when there are limited sources of infected host residues in the soil and (iii) to assess the relationship among the nitrogen rate, grain yield, quality variables (i.e., grain protein content and grain size) and disease severity. It was confirmed that both NFNB and leaf scald can be carried over from one season to the next on infected seed under Mediterranean conditions. However, the disease severity was more pronounced after the barley tillering phase when the soil had been successfully inoculated, which supports the hypothesis that the most important source of primary inoculum for NFNB comes from infected host residue. Increasing the rate of nitrogen application, when malt barley was cultivated in the same field for a second year in a row, caused a non-significant increase in disease severity for both pathogens from anthesis onwards. However, hotspot and commonality analyses revealed that spatial and genotypic effects were mainly responsible for hiding this effect. In addition, it was found that the effect of disease infections on yield, grain size and grain protein content varied in relation to the genotype, pathogen and stage of crop development. The importance of crop residues in the evolution of both diseases was also highlighted.

1. Introduction

Barley (Hordeum vulgare L.) is one of the leading cereal crops of the world, and it is clearly number two in Europe in terms of cultivated acreage, next to bread wheat (Triticum aestivum L.) [1]. According to Meussdoerffer and Zarnkow [2], barley is a major source of brewing malts and constitute the single most important raw material for beer production. Pyrenophora teres f. teres, an ascomycete that causes the foliar disease net form net blotch (NFNB), and Rhynchosporium secalis, the causal agent of barley leaf scald, are among the most important barley diseases worldwide [3,4,5]. It is estimated that both these diseases can decrease barley grain yield by up to 30–40% [5,6,7,8,9,10,11]. In addition, there are indications that these diseases can also have a negative effect on malt barley quality [5].
Understanding the temporal and spatial dynamics of disease epidemics is crucial for the development of more efficient, integrated disease-management systems [12]. For example, Gibson [13,14] developed a novel approach involving the spatio-temporal analysis of spatially referenced diseased plants when a sequence of disease maps is available. Recently, several authors addressed the spatial and spatiotemporal structures of epidemics [15,16]. According to Luo et al. [17], geostatistics have been proposed in plant pathology to analyze the spatial patterns of epidemics. However, although they have several advantages in characterizing the disease pattern, they do not explicitly account for the epidemiological mechanisms that determine disease spread. Despite the increasing importance of NFNB and leaf scald in Greece, only a few epidemiological studies have been conducted worldwide and, especially, under similar climatic conditions [18].
Compared to other cultural practice factors (e.g., the seeding rate, tillage practice, etc.), nitrogen management presents the highest variability in the Greek cropping belt of malt barley. The nitrogen fertilizer rate plays a major role in malt barley by affecting to a great extent the final yields and grain protein content (which has to be maintained below a threshold of 11.5–12.0% depending on the brewing industry), as well as the susceptibility to leaf diseases. More nitrogen can increase the yield of malt barley [19,20,21,22] but can also exert an adverse effect on quality by increasing grain protein content [23,24,25,26]. In addition, high nitrogen rates can also increase the susceptibility of barley to leaf diseases [27,28,29,30]. Therefore, understanding the degree of the relationship among the nitrogen rate, grain yield, quality variables and leaf disease infections can be very useful for further raising yield and maintaining the quality at a level that meets the requirements of the malt industry.
As far as we are aware, only a few studies have addressed, to date, the impact of NFNB and leaf scald on malt barley quality [30,31], and their results have been restricted to northern climates. However, there is a lack of evidence of what really happens under Mediterranean conditions, where the occurrence of malt barley diseases coincides with terminal drought. Malt barley has to meet certain specific quality requirements according to malt industry demands. The grain size and grain protein content are among the most important quality factors for malting barley [24]. Although the average grain weight and size is primarily determined during the post-anthesis period [32,33], the grain protein content can also be affected during the pre-anthesis period. For example, pre-anthesis drought stress can cause a low nitrogen uptake during the vegetative period, thus reducing the yield potential. Then, more nitrogen is available during grain filling due to the low number of seeds, and the grain protein content is increased [34].
In this study we aimed (i) to estimate the epidemiology of NFNB and leaf scald in a barley disease-free area when the initial inoculation of the field occurred through infected seeds, (ii) to explore the spatial dynamics of disease spread under the interaction of the nitrogen rate and genotype when there were limited sources of infected host residues in the soil and (iii) to assess the relationship among the nitrogen rate, grain yield, quality variables (i.e., grain protein content and grain size) and disease severity.

2. Materials and Methods

2.1. Study Site and Experimental Design

The experiment was divided into three different phases, namely, (a) the selection of malt barley seeds from infected crops (i.e., with NFNB and leaf scald) grown in the main productive areas for malt barley in Greece (growing season 2013–2014), (b) the inoculation year (Exp 1; growing season 2014–2015) when the seeds from the infected malt barley varieties (i.e., Grace, Charles, Fortuna, KWS Asta and Zhana) were grown in a barley disease-free area (Spata is mainly a wine-producing and olive oil-producing region due to the occurrence of dry conditions; the nearest region with cereal crops is located more than 40 km away) and (c) the application in the same location (i.e., inoculated soil with infected crop residues from Exp 1) of nitrogen treatments on the most important (in terms of harvested areas) malt barley varieties in Greece, namely, Zhana, Grace, Traveler and RGT Planet (Exp 2; growing season 2015–2016). A conceptual diagram of the methodological approach is presented in Figure 1.
The experiments (Exp 1 and Exp 2) were conducted in Spata, Greece (37°58′44.34″ N, 23°54′47.87″ E and 118 m above sea level), at the experimental station of the Agricultural University of Athens, during the growing seasons 2014–2015 and 2015–2016, respectively. The soil was clay loam. The physical and chemical characteristics of the soil at the beginning of the experiments (November 2013) were a pH of 7.7 (1:1 soil/water extract), organic matter at 2.02%, CaCO3 at 27.80%, an electrical conductivity (Ec) of 0.29 mmhos cm−1, available P (Olsen) at 52.84 ppm and 452 ppm of exchangeable K.
In Exp 1, the treatments consisted of five malt barley varieties as stated above. The experimental design was a randomized complete block design with 9 replications (in order to have a better spatial distribution of the selected genotypes) per genotype. During the second year (Exp 2) the experiment was arranged in a two-factorial randomized complete block design with three replications. The treatments were completely randomized within each block and included four two-rowed malt barley (H. vulgare L.) varieties (i.e., Zhana, Grace, Traveler and RGT Planet) and four nitrogen fertilization rates. The four N application rates were 0 (N0), 60 (N1), 100 (N2) and 140 (N3) kg N ha−1. In order to achieve a more efficient use of the N, half of its application was applied to the experimental plots at the onset of tillering phase (stages 20–22 according to Zadoks et al.’s [35] scale), and the remaining, at the end of the tillering phase (stages 25–29 according to Zadoks et al.’s [35] scale), as ammonium nitrate.
In both experimental years, the plot size was 9 m2, including 15 rows with a row space of 20 cm, and the crops were planted at a seed rate of approximately 350 seeds m−2. The plots in Exp 2 were established in the same location where the plots of Exp 1 had been seeded. In Exp 1, sowing was carried out following conventional soil tillage (i.e., ploughing and then disc cultivation), whereas only a rotary cultivator was used in Exp 2 in order to simulate the conditions of increased soil-borne disease pressure. Only certified malt barley seeds were used in Exp 2; therefore, the only source for disease dispersal was the crop residues from Exp 1.
The soil water content was frequently determined during each cultivation season. EC-5 sensors of Decagon Devices, Inc. were installed at a 25 cm depth in four different plots for the monitoring of the soil water content (SWC).

2.2. Disease Assessment

A slight modification (i.e., we integrated the percentage of diseased plants in each plot; D1) of the widely used [36,37,38] equation proposed by Saari and Prescott [39] was adopted to estimate disease severity (DS) during the phenological stages of tillering, stem elongation and milk development:
DS (%) = (D1/100) × (D2/9) × (D3/9) × 100
where D1 is the percentage of diseased plants in each plot, D2 is the height of infection (i.e., 1 = the lowest leaf; 2 = the second leaf from base; 3–4 = the second leaf up to below the middle of the plant; 5 = up to the middle of the plant; 6–8 = from the center of the plant to below the flag leaf; and 9 = up to the flag leaf) and D3 is the extent of leaf area affected by disease (i.e., 1 = 10% coverage to 9 = 90% coverage).
The area under disease progress curve (AUDPC) was calculated by following the formula given by Shaner and Finney [40]:
A U D P C = i   =   1 n 1 [ { ( Y i + Y ( i + 1 ) ) / 2 } × ( t ( i + 1 ) t i ) ]
where Yi = the disease level at time ti, (t(i+1)ti) is the interval between two consecutive assessments and n is the total number of assessments.
Barley varieties were naturally infected by both diseases. The pathogens were further identified in the lab [4].

2.3. Yield and Malt Character Measurements

At maturity, grain yield estimation was based on an area of 1 m2 per plot. The grain size was determined by size fractionation using a Sortimat (Pfeuffer GmbH, Kitzingen, Germany) machine, according to the 3.11.1 Analytica EBC “Sieving Test for Barley” method (Analytica EBC, 1998). The nitrogen content was determined by the Kjeldhal method, and the protein content was calculated by multiplying the N content by a factor of 6.25, as described by Vahamidis et al. [41].

2.4. Spatial Statistical Analysis

Using the geographical coordinates of the experimental plots, ArcGIS 10 was used to explore the spatial associations, based on autocorrelation indices, of the disease severity among the experimental plots during the different developmental stages. Global autocorrelation indices, such as Moran’s I, assess the overall pattern of the data and sometimes fail to examine patterns at a more local scale [42]. Thus, aiming at deepening our knowledge on spatial associations, local autocorrelation indices were used to compare local to global conditions. In this framework, hotspot analysis was used to identify statistically significant clusters of high values (hotspots) and low values (cold spots) using the Getis–Ord Gi statistic. Anselin Local Moran’s I was used to identify spatial clusters with attribute values similar in magnitude and specify spatial outliers.
In order to further explore the relationship between crop residues and disease severity, the distance from the crop residues of the previous season (2014/2015) to the location of the experimental plots of the investigated growing season (2015/2016) were calculated (concerning Zhana, it was the only cultivar that was infected by Rhynchosporium secalis, and Grace was the cultivar with the highest infection by Pyrenophora teres f. teres).

2.4.1. Hotspot Analysis

Moran’s I is a popular index for globally assessing spatial autocorrelation; however, it does not efficiently recognize the grouping of spatial patterns [43]. Hotspot analysis was used to assess whether experimental plots with either high or low values clustered spatially. Hotspot analysis uses the Getis–Ord local statistic, given as:
G i * = j   =   1 n w i , j x j X ¯ j   = 1 n w i , j S [ n j   = 1 n w i , j 2 ( j = 1 n w i , j ) 2 ] n 1
where xj is the disease severity value for an experimental plot j, wi,j is the spatial weight between the experimental plot i and j, n is the total number of experimental plots and
X ¯ = j = 1 n x j n
    S = j = 1 n x j 2 n ( X ¯ ) 2    
The Getis–Ord Gi statistic assesses whether the neighborhood of each experimental plot is significantly different from the study area and can distinguish high-value clusters (hotspots) and low-value clusters (cold spots).
The Gi* statistic returns a z-score, which is a standard deviation. For statistically significantly positive z-scores, higher values of the z-score indicate the clustering of high values (hotspot). For statistically significantly negative z-scores, lower values indicate the clustering of low values (cold spot).

2.4.2. Cluster and Outlier Analysis

Anselin Local Moran’s I was used to identify clusters and spatial outliers. The index identifies statistically significant (95%, p < 0.05) clusters of high or low disease severity and outliers. A high positive local Moran’s I value implies that the experimental plot under study has values similarly high or low to its neighbors’; thus, the locations are spatial clusters. The spatial clusters include high–high clusters (high values in a high-value neighborhood) and low–low clusters (low values in a low-value neighborhood). A high negative local Moran’s I value means that the experimental plot under study is a spatial outlier [44]. Spatial outliers are those values that are obviously different from the values of their surrounding locations [45]. Anselin Local Moran’s I enables us to distinguish outliers within hotspots, because it excludes the value of the experimental plot under study, contrary to the hotspot analysis, which takes it into account.
The local Moran’s I is given as:
Ι i = x i X ¯ S i 2 j = 1 ,   j i n w i , j ( x i X ¯ )
where xi is an attribute for feature I, X ¯ is the mean of the corresponding attribute, wi,j is the spatial weight between feature I and j, and:
S i 2 = j = 1 , j i n w i j n 1 X ¯ 2

2.5. Statistical Analysis

Analyses of variance were performed using the Statgraphics Centurion ver. XVI software package (Statpoint Technologies, Inc., Warrenton, VA, USA). Prior to ANOVA, the residuals (standardized) of the data were visually tested with qq-plots, as well as with Shapiro–Wilk tests, using SPSS (IBM SPSS Statistics for Windows, Version 22.0, IBM Corp. Armonk, New York, NY, USA). Percentage values concerning disease severity were arcsine transformed prior to ANOVA. Significant differences between treatment means were compared by the protected least significant difference (LSD) procedure at p < 0.05. Commonality analysis was performed in the R environment (version 3.4.3) using the “yhat” package (version 2.0–0) as described by Nimon et al. [46]. For a number k of predictors, CA returns a table of (2k-1) commonality coefficients (or commonalities), including both unique and common effects [47]. In the case where the dependent variable y is explained by two predictors i and j, the unique effects are:
U ( i ) =   R y . i j 2   R y . j 2 U ( j ) =   R y . i j 2   R y . i 2
and the common contribution I is:
C ( i j ) =   R y . i j 2   U ( i ) U ( j )

3. Results

3.1. Weather Conditions

The weather regime, in terms of the maximum (Tmax) and minimum air temperature (Tmin) and rainfall, during both experiments, is presented in Figure 2. The maximum and minimum temperatures increased from February to May, as typically occurs in Mediterranean environments. The environmental conditions differed between the two experimental years, with differences in the amount and distribution of precipitation during the growing season, as well as differences in temperature. In general, 2015–2016 (Exp 2) was considered to be a drier growing season compared to 2014–2015 (Exp 1).

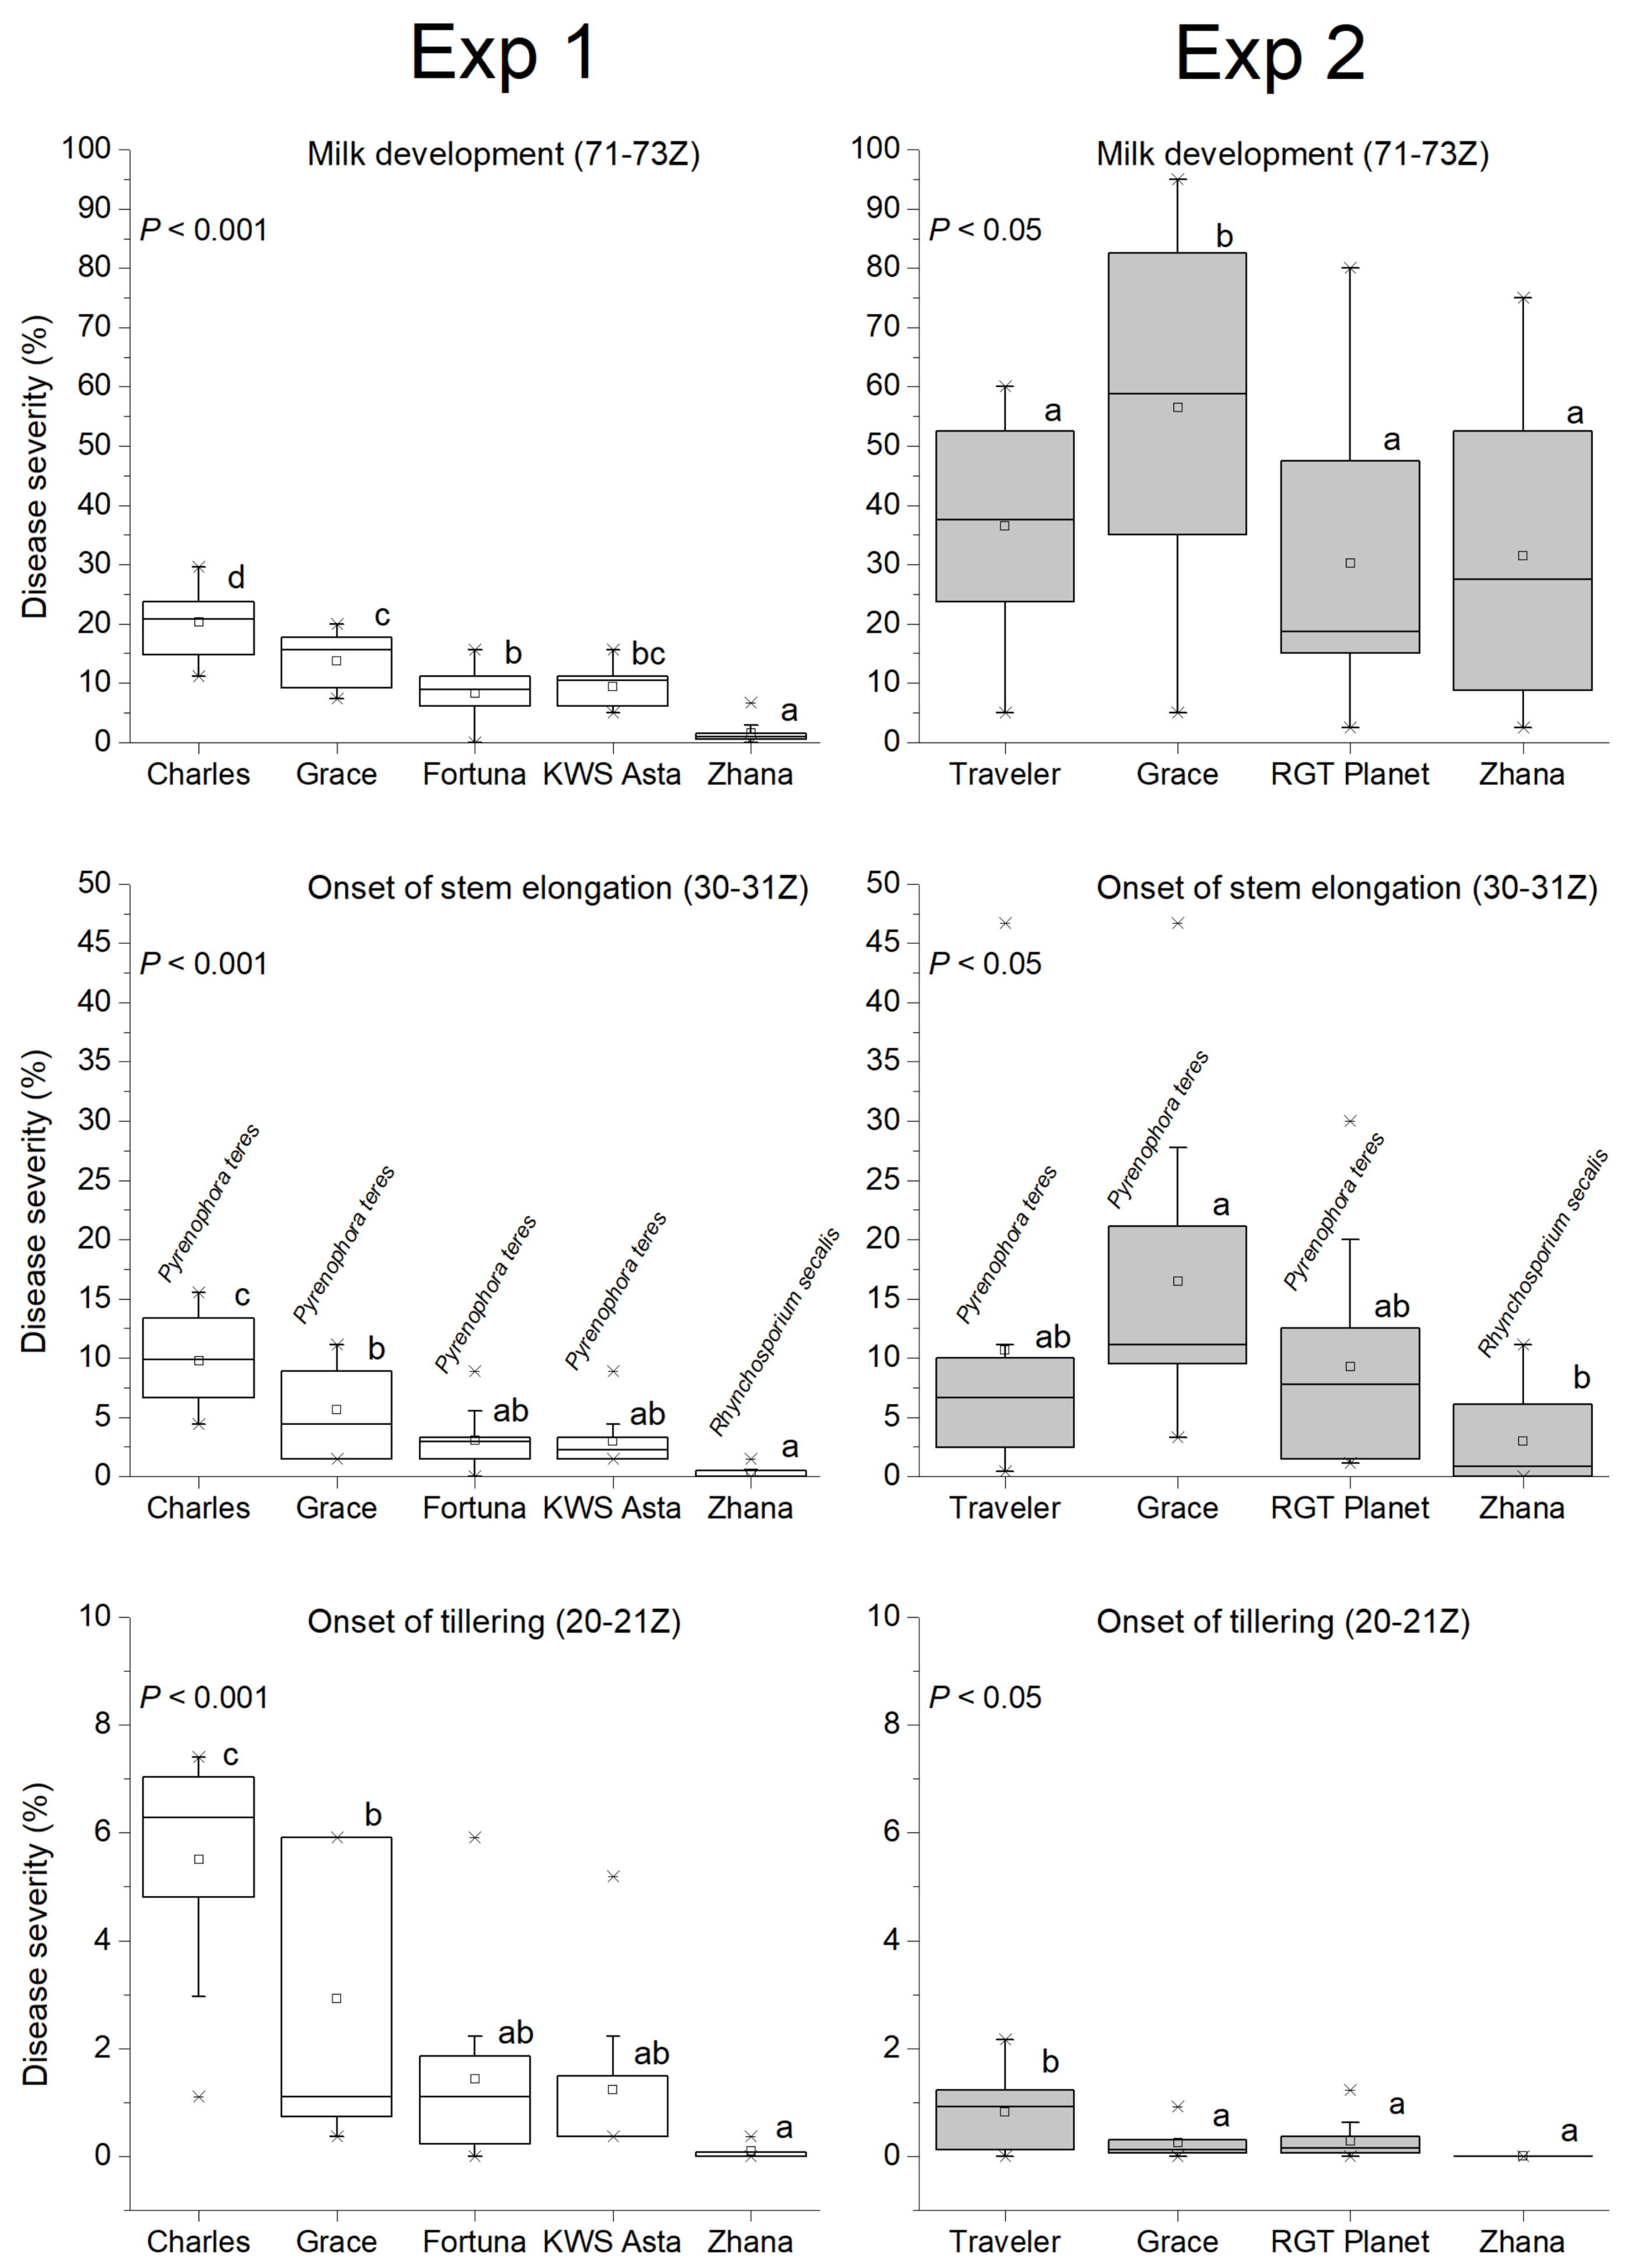
3.2. Temporal and Genotypic Effects

Charles, Grace, Traveler, Fortuna, KWS Asta and RGT Planet were exclusively infected with Pyrenophora teres f. teres (net form net blotch—NFNB), whereas the cultivar Zhana was exclusively infected with Rhynchosporium secalis (leaf scald). NFNB occurred at all developmental stages and in both experiments, whereas leaf scald was consistently observed after the onset of the stem elongation phase (Figure 3). Although the disease severity tended to be higher in Exp 1 (disease dispersal from the infected barley seed) compared to Exp 2 (disease dispersal from the infected barley debris left after harvest) during the tillering phase for the malt barley, after the onset of the stem elongation stage, it was more pronounced in Exp 2. The same trend was also observed concerning leaf scald. The initial seeds from the malt barley varieties studied in Exp 1 presented different infection levels due to the occurrence of different disease severities in the collection sites (i.e., Charles DS = 33%, Grace DS = 26.5%, Fortuna DS = 17.8%, KWS Asta DS = 18.6% and Zhana = 6.7%). Interestingly, the disease severity in Exp 1 followed to a great extent the differences in the initial seed infection levels (Figure 3).
In general, infections by NFNB were more severe compared to leaf scald during all the tested developmental phases for the malt barley (Figure 3).

3.3. The Area under Disease Progress Curve (AUDPC)

The area under disease progress curve (AUDPC) in Exp 2 was not significantly affected either by the nitrogen rate or the interaction cultivar x nitrogen (Table 1). However, the analysis of variance for AUDPC indicated that a significant degree of genotypic variation existed among the studied malt barley cultivars in both experiments. The AUDPC values were lower in Exp 1 compared to Exp 2. Charles and Grace presented the highest values in Exp 1 and Exp 2, respectively (Figure 4).

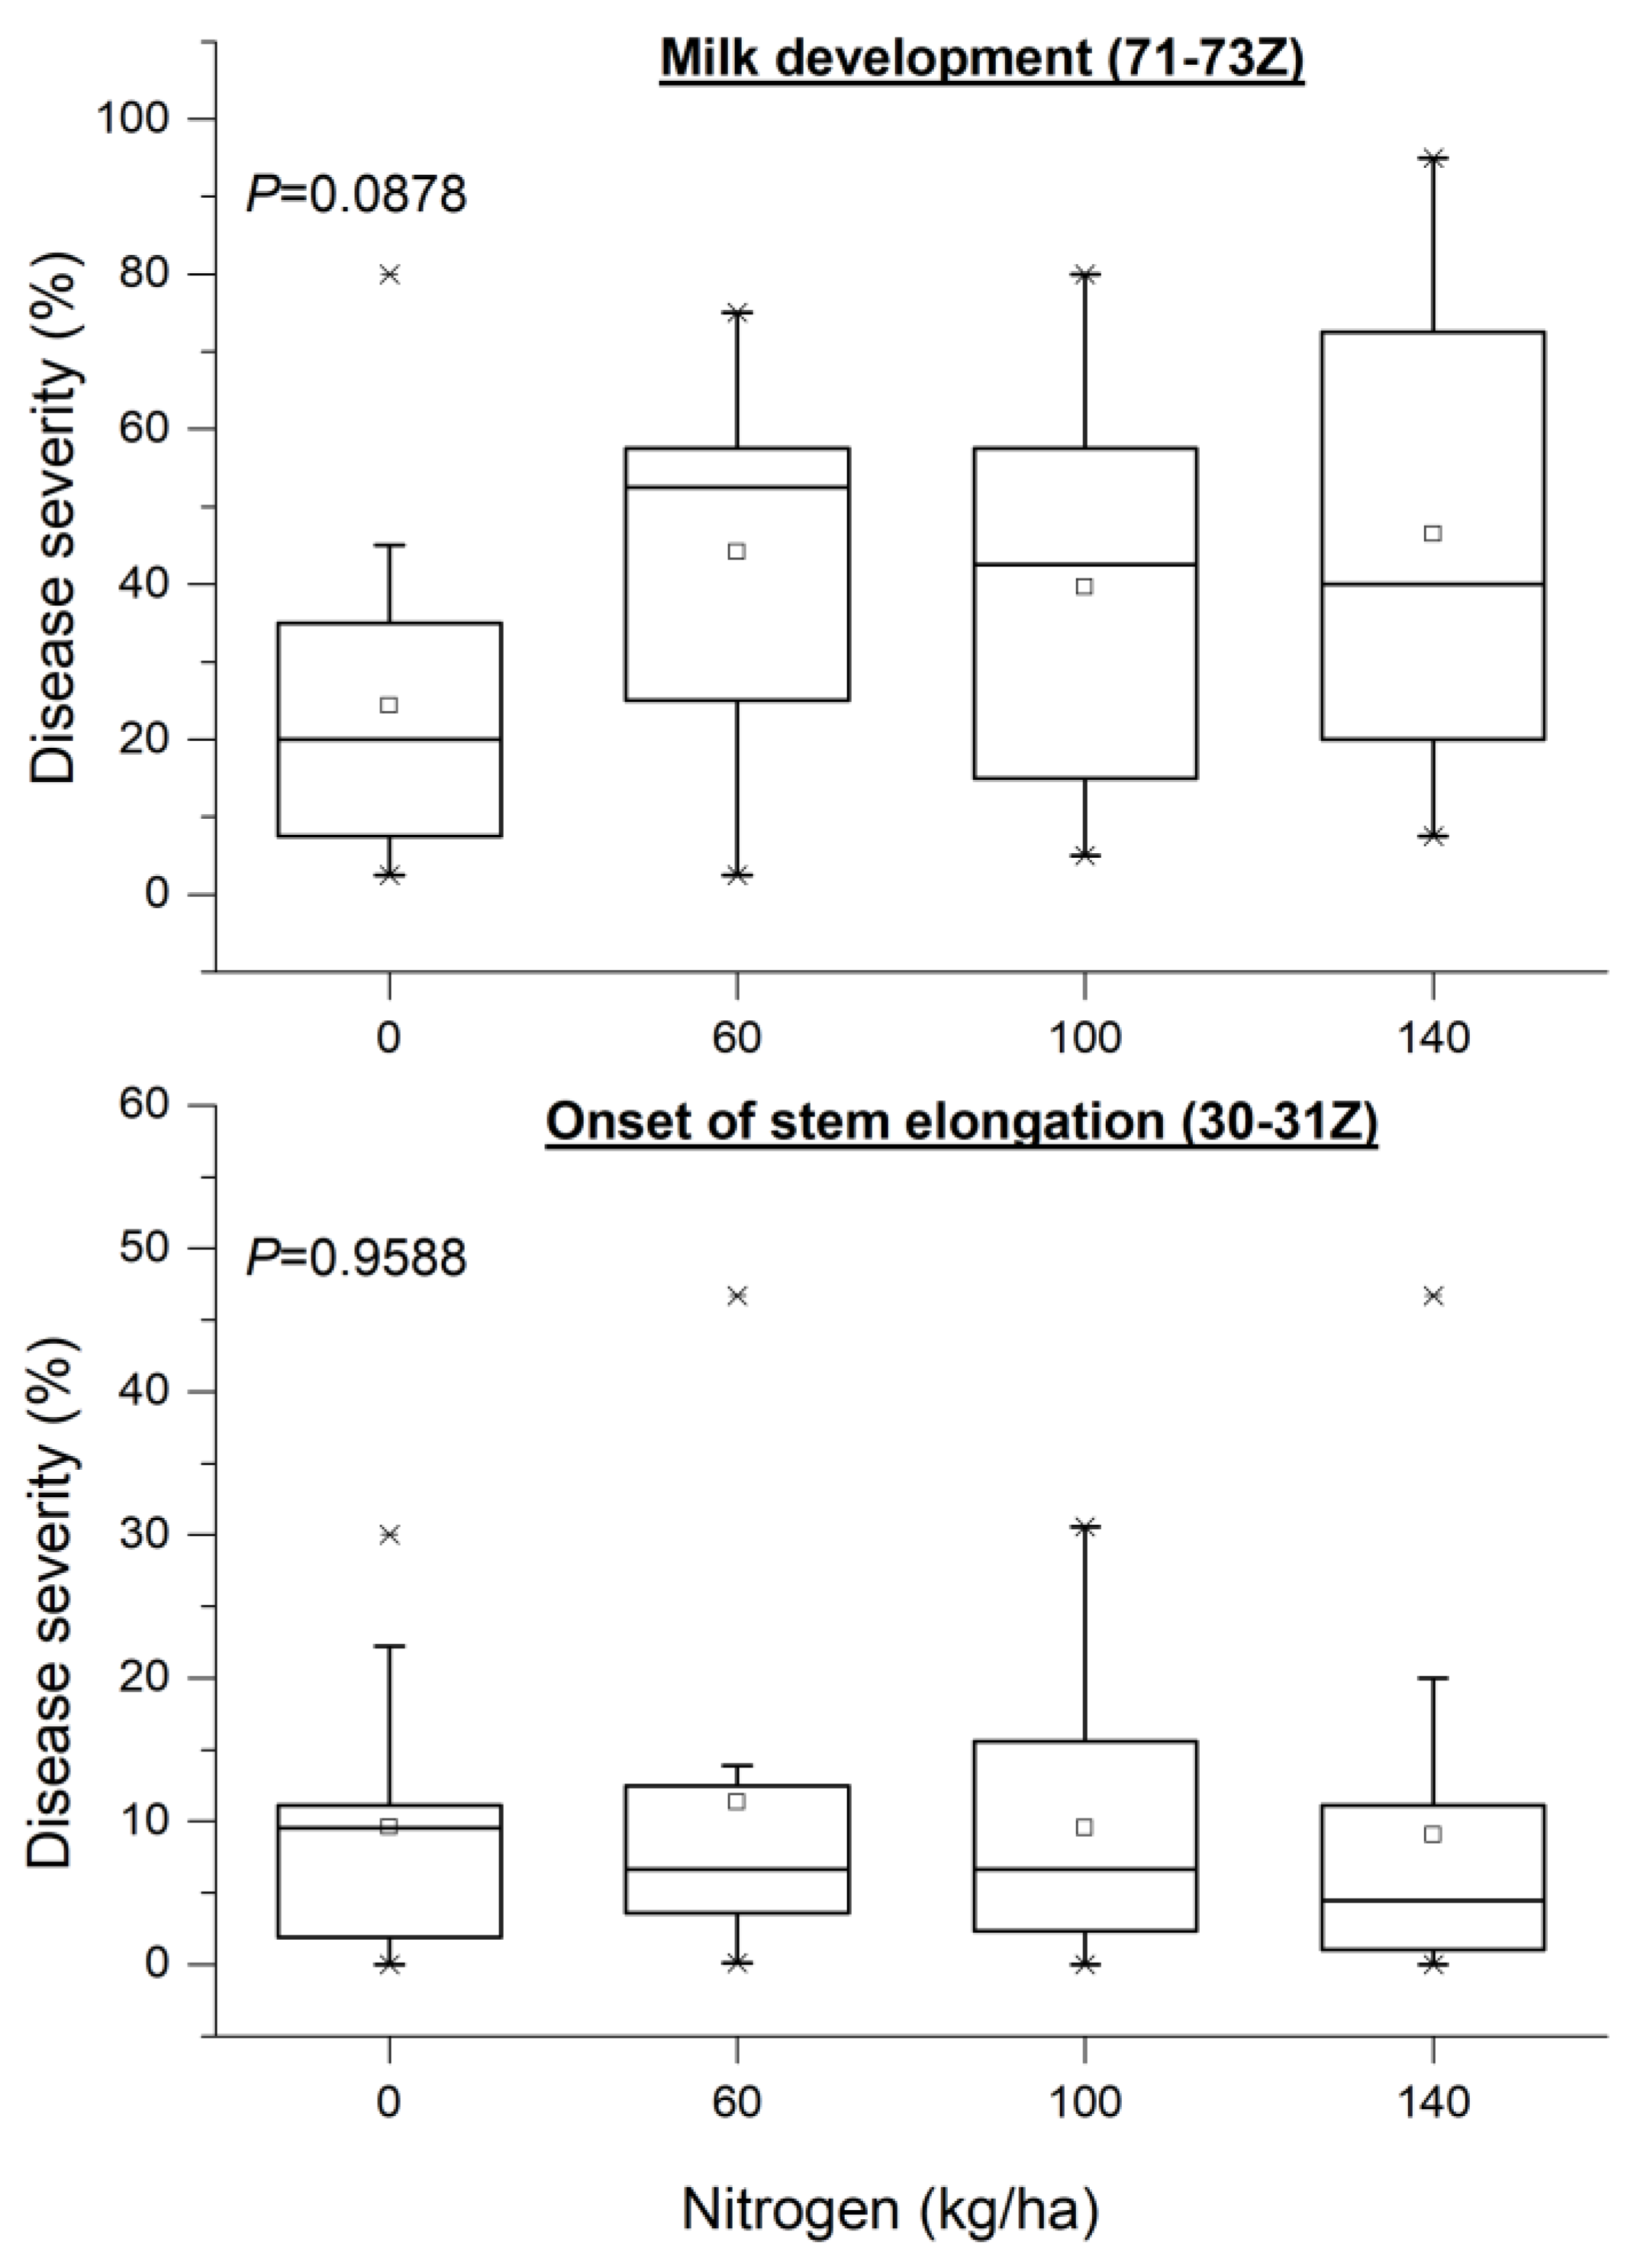
3.4. Epidemiology Assessment When Nitrogen Rate and Genotype Are the Main Sources of Variation

The distribution patterns of disease severity were analyzed by using hotspot and cluster and outlier analysis in ArcGIS 10x for three different crop developmental periods: (1) tillering (20–21Z), (2) stem elongation (30–31Z) and (3) milk development (71–73Z). Cluster and outlier analysis was used to identify clusters of disease-infected areas with the cluster types of HH, HL, LL and LH. LH represents a cluster of low values surrounded by high values, while HL is a cluster of high values surrounded by low values. In addition, LL and HH were statistically significant (p < 0.05) clusters of low and high disease severity values, respectively.
During the onset of the tillering phase, two experimental plots presented significant positive z scores, demonstrating significant clusters of intense disease severity. They were located on the western part of the field, and both of them included Traveler with nitrogen rates of 100 and 140 kg/ha, respectively (Figure 5). RGT Planet with a nitrogen rate of 100 kg/ha was also marked as a hotspot but less intense, though presenting a lower z-score (Figure 5). Note that lower z-scores indicate less intense clustering. The local Moran’s I spatial analysis indicated only one High–Low outlier in the western part of the field. Indeed, Traveler with a rate of 100 kg N/ha was considered as an outlier since it presented high values of disease severity surrounded by lower surrounding values.
During the stem elongation phase, hotspots increased in number and continued to be present in the western part of the field. The analysis identified three hotspots with very high z-scores (Grace with 60 kg N/ha; Traveler with 100 kg N/ha; and Traveler with 140 kg N/ha, one with a high (RGT Planet with 0 kg N/ha) and one with a moderate z-score (Grace with 60 kg N/ha). Although Zhana with 60 and 100 kg N/ha was surrounded by hotspots, it presented low values of disease severity. The local Moran’s I spatial analysis confirmed the abovementioned results by characterizing these plots as Low–High outliers, indicating low values of disease severity compared to the surrounding plots. The analysis also identified a statistically significant (p < 0.05) cluster of increased disease severity, which coincided with two of the hotspots (Traveler and Planet in the western side) determined with the Getis–Ord G* statistic (Figure 4).
Two Grace plots with 140 kg of N/ha were identified as hotspots of the highest z-scores during milk development and were followed by RGT Planet without nitrogen application. The local Moran’s I spatial analysis again identified two Zhana plots (i.e., with nitrogen rates of 0 and 100 kg/ha) as spatial outliers, since they presented low disease severity in a neighborhood of high values (Figure 5).

3.5. Quantifying the Effects of the Rate of Nitrogen Application and the Distance from the Nearest Hotspot on Crop Disease Severity

Commonality analysis (CA) served to quantify the relative contributions of the rate of nitrogen application (kg/ha) and the distance from the nearest hotspot to crop disease severity. It is a method of partitioning variance that can discriminate the synergistic or antagonistic processes operating among predictors. Commonalities represent the percentage of variance in the dependent variable that is uniquely explained by each predictor (unique effect) or by all possible combinations of predictors (common effect), and their sum is always equal to the R2 of the multiple linear regression. The distance from the nearest hotspot (m) and the quantity of applied nitrogen (kg/ha) explained 10 to 74% of the variance in disease severity (Table 2).
Examining the unique effects, it was found that for the period of the stem elongation phase, the distance from the nearest hotspot (m) was the best predictor of disease severity for all the study cultivars, uniquely explaining 16.8 to 45.5% of its variation. This amount of variance represented 38.76 to 97.65% of the R2 effect (Table 2). On the contrary, during the onset of the grain filling phase the variation in disease severity was best explained by either the nitrogen rate (i.e., Traveler and Grace) or the distance from the nearest hotspot (m) (i.e., RGT Planet and Zhana) (Table 2).

3.6. Effect of N and Genotype on Grain Yield and Quality Characters

Disease severity was clearly not influenced by the N rate during the vegetative phase (i.e., stem elongation phase) of the malt barley. On the contrary, during the grain filling phase, the experimental data demonstrated a tendency for a positive relationship between the disease severity and the rate of nitrogen application (Figure 6); however, this tendency was not expressed in a statistically significant way according to ANOVA (Table 1).
The grain yield was significantly affected by the cultivar and by the interaction cultivar x nitrogen (Table 1), and varied from 0.84 to 4.26 t ha−1. Grace and Traveler were the only cultivars that presented significant relationships between the grain yield and disease severity (Figure 7). In particular, Traveler showed a marginal, statistically significant negative relationship between the grain yield and disease severity, only for the period of tillering (Figure 7). Concerning Grace, the grain yield showed a negative, significant direct relationship with disease severity for the period of grain filling (milk development) and, on the contrary, presented a moderate, positive association with disease severity for the period of the tillering phase (Figure 7).
Although the grain protein content was significantly affected by the N rate, the proportion of the maltable grain size fraction (% grains > 2.2 mm) seemed to be unaffected (Table 1). The relationship among the disease severity, maltable grain size fraction and grain protein content is shown in Figure 8.

4. Discussion

Although our approach provides a further insight into the factors (i.e., Integrated Pest Management-IPM, spatial and temporal) determining disease severity and crop performance, it could be argued that our experimentation was not adequate to provide solid evidence about the effect of the nitrogen rate. Indeed, we intentionally tested the nitrogen rate effect for only one year. Our main objective was to explore the introduction and spread of net form net blotch and barley leaf scald under the combined effect of nitrogen fertilization and genotype in a field with limited sources of infected host residues in the soil. Therefore, repeating Exp 2 for a second year, which means 3 years of barley cultivation in the same field, would inevitably lead to a wide spread of infected host residues and, in turn, to a poor estimation of the spatial dynamics of disease epidemics. Furthermore, it is quite clear that both experiments (Exp 1 and Exp 2) are interrelated, and this was essential for exploring a continuous process such as the entry, establishment and spread of a disease in a new area.
Despite the possible constraints and also by taking into consideration the fact that the tested experimental field was inside a disease-free area (cereals are not cultivated in this region), this study supports the hypothesis [3,18,48,49] that both NFNB and leaf scald could be carried over from one season to the next on infected seed. Furthermore, it was shown that the disease severity, concerning both diseases, differed between the two experimental years (Figure 3). However, the question is whether this difference can be attributed to the initial source of the inoculum or just to the meteorological conditions that occurred during the tested years. On the one hand, our results revealed a higher disease severity in Exp 1 during the early development of the barley, and on the other hand, there was a higher disease severity in Exp 2 from the onset of stem elongation onwards (Figure 3). What we actually know is that rain episodes and moist conditions are essential for the dissemination and the infections of conidia concerning both pathogens [5,50,51]. Therefore, the higher disease severity in Exp 2 could not be explained by favorable meteorological conditions due to the occurrence of drier conditions in Exp 2 compared to Exp 1 (Figure 2). In addition, it is widely accepted that the most important source of primary inoculum for NFNB comes from infected host residue [5], an argument that supports the hypothesis that the higher disease severity in Exp 2 could presumably be attributed to a greater quantity of infected host residue during Exp 2.
As far as we are aware, our study, for the first time, demonstrates a spatial epidemiology assessment of both diseases under a Mediterranean environment and also sheds more light on the role of crop residues concerning their establishment in a new barley field. The epidemiology assessment of both diseases, when the nitrogen rate and genotype were the main sources of variation (Exp 2), was implemented with hotspot and Anselin Local Moran’s I analysis. We found that the location of the hotspots changed during the growing season (Figure 5). This can be explained either by soil heterogeneity or by the spatial presence of the pathogens in the soil (i.e., as infected host residue) and genotype susceptibility. Soil heterogeneity was considered negligible because (i) the acreage of the experimental field was small (approximately 0.1 ha), (ii) there was no land inclination and (iii) the differentiation of the field soil moisture was rather small (Figure 9). Commonality analysis during Exp 2 revealed that the most important factor concerning NFNB disease severity was the distance of the plots from the hotspots, concerning the period of the onset of stem elongation (Table 2). According to Liu et al. [4], NFNB is classified as stubble-borne disease because the fungus usually produces the ascocarp as an over-seasoning structure on infected barley debris left after harvest. The primary inoculum early in the growing season is made by mature ascospores, which are dispersed by the wind. After initial colonization, the pathogen produces a large number of conidia, which serve as secondary inocula. These asexually produced spores can be dispersed by either the wind or rain to cause new infections on plants locally or at longer distances [4]. On the other hand, Zhana was the only cultivar that was not infected in both seasons by NFNB (i.e., it was infected only by Rhynchosporium secalis). However, it was found that the distance of the Zhana experimental plots from the previous season crop residues (i.e., the sites with Zhana) explained 58% of the variation in the disease severity (Figure 10). This result is also supported by the Anselin Local Moran’s I spatial statistical analysis. Zhana was considered an outlier due to having lower disease severity values while being surrounded by plots with high values from stem elongation onwards (Figure 5).
The late occurrence of Rhynchosporium secalis symptoms on Zhana compared to NFNB (Figure 3) during both experiments could possibly be attributed to its specific life cycle. According to Zhan et al. [3], R. secalis grows symptomlessly under the cuticle, especially where the walls of adjacent cells are joined before producing new conidia and, finally, visual symptoms. Further investigations concerning the infection process of R. secalis in barley were conducted by Linsell et al. [52]. In general, NFNB was more prevalent compared to leaf scald during all the tested developmental phases of malt barley (Figure 3 and Figure 4). According to Robinson and Jalli [53], this could be a result of net blotch being comparatively less demanding of environmental conditions (mostly wind dispersed) than scald (mostly splash dispersed) for effective spore dispersal and epidemic development.
The effect of N on plant disease severity is quite variable in the literature [29]. Both increases [27,30] and decreases [28] in disease severity are reported from increasing N in plants. In addition, Turkington et al. [31] found that the total leaf disease severity caused by NFNB in barley was not significantly affected by the N rate. Our results showed that the disease severity for both pathogens during the second year for the malt barley in the same field (Exp 2) tended to increase from anthesis onwards upon increasing the rate of nitrogen application (Figure 6). The lack of a significant relationship between the disease severity and N rate could presumably be hidden behind spatial and genotypic effects. Indeed, according to commonality analysis, the effect of the distance from the locations with the highest disease infections was a better predictor of disease severity (for both diseases) compared to the nitrogen rate during the pre-anthesis period. However, after anthesis, the disease severity was best explained by the nitrogen rate, concerning only the cultivars most susceptible to NFNB (Table 2).
The typical yield losses due to NFNB (Pyrenophora teres f. teres) and leaf scald (Rhynchosporium secalis) outbreaks can be up to 30–40% [3,6,8,9,10,11]. However, we did not detect any consistent relationship between the disease severity and grain yield when the main source of variation was the nitrogen rate (Figure 7). Jalakas et al. [54] also found a weak relationship between malt barley grain yield and net blotch (Pyrenophora teres) disease severity. This can be attributed to the time of disease occurrence and to the extent of the disease severity in relation to the barley developmental stage. It is widely accepted that grain yield determination in barley is mainly explained by the variation in the grain number per unit of land area [21,41,55,56]. According to Bingham et al. [57], the grain number in barley is a function of the production and survival of tillers and spikelets and the success of the fertilization of florets. Tiller production and spikelet initiation occur before the stem elongation phase, while the survival and further growth of tillers and spikelets are largely determined from stem elongation onwards. Accordingly, our results showed that the highest disease severity, which was recorded in Traveler during the tillering phase (Figure 3), exerted a more pronounced negative effect on the grain yield (Figure 7). In line with this, Jordan [48] demonstrated that the inoculation of spring barley before tillering can cause 30–40% yield loss, whereas inoculation from tillering to flowering decreased the grain yield by only 10%.
The higher disease severity in Grace compared to the rest of the studied cultivars during the onset of the grain filling phase (Figure 3) led to a significant reduction in grain yield, mainly through a decrease in the mean grain weight. Indeed, an increase in disease severity by 32.5% during the grain filling phase caused a reduction in the thousand grain weight by 18.3% in Grace. In line with this, Agostinetto et al. [58] demonstrated that the strongest relationship between grain yield reduction and barley spot blotch severity occurred after the booting stage of barley. Furthermore, Khan [9] observed a reduction in barley grain yield by 25–35% from net blotch, mainly due to a significant decrease in thousand grain weight.
The grain protein content is one of the most important factors in marketing malting barley. The primary objective, particularly in Mediterranean environments, is to maintain the grain protein content below a threshold of 11.5–12.0% depending on the brewing industry [41]. Although there is some evidence from northern climates suggesting that NFNB infections are not exerting any significant effect on grain protein content [30,31], our results revealed for the first time a positive relationship between NFNB disease severity and the grain protein content under Mediterranean conditions. Additionally, it was shown that the magnitude of this relationship was genotype dependent (Figure 8). It seems that the effect of NFNB disease severity on the grain protein content increases under terminal drought stress conditions in April–May (Figure 2A,B). According to Bertholdsson [34], drought stress during late grain filling limits carbohydrate incorporation in the grain and causes the pre-maturation and less dilution of the protein in the grain.

5. Conclusions

Despite possible constraints, the results of the present study provide further insight into the epidemiology of the most important foliar diseases of malt barley in Greece and can help farmers to improve their IPM practices in order to create higher profits while improving the environment’s sustainability. It was shown that both NFNB and leaf scald can be carried over from one season to the next on infected seed under Mediterranean conditions. However, the disease severity was more pronounced after the barley tillering phase when the soil had been successfully inoculated first, which supports the hypothesis that the most important source of primary inoculum for NFNB comes from infected host residue.
Our results show that the disease severity for both pathogens, when the malt barley was cultivated in the same field for a second year, presented a non-significant increase from anthesis onwards upon increasing the rate of nitrogen application. However, it was demonstrated that the lack of a significant effect of the N rate on disease severity was mainly hidden behind spatial and genotypic effects. In addition, it was revealed that the effect of disease infections on the yield, grain size and grain protein content varied in relation to the genotype, pathogen and stage of crop development. These data can help in the development of long-term strategies for the minimization of net form net blotch and barley leaf scald occurrence.

Author Contributions

Conceptualization, P.V., A.S. and D.I.T.; methodology, P.V. and D.I.T.; software, P.V. and A.S.; formal analysis, P.V.; investigation, P.V. and V.K.; resources, N.D. and G.E.; data curation, P.V.; writing—original draft preparation, P.V., A.S., C.S.L. and D.I.T.; writing—review and editing, P.V., D.I.T., N.D. and D.K.; visualization, P.V. and A.S.; supervision, N.D., G.E. and D.I.T.; project administration, V.K.; funding acquisition, N.D. and G.E. All authors have read and agreed to the published version of the manuscript.

Funding

This research was funded by Athenian Brewery S.A.

Conflicts of Interest

The authors declare no conflict of interest.

References

  1. Friedt, W. Barley breeding history, progress, objectives, and technology. In Barley Production, Improvement, and Uses, 1st ed.; Ullrich, S.E., Ed.; Wiley: Hoboken, NJ, USA, 2011; pp. 160–220. [Google Scholar]
  2. Meussdoerffer, F.; Zarnkow, M. Starchy Raw Materials. In Handbook of Brewing: Processes, Technology, Markets, 1st ed; Eßlinger, H.M., Ed.; Wiley: Weinheim, Germany, 2009; pp. 43–83. [Google Scholar]
  3. Zhan, J.; Fitt, B.D.L.; Pinnschmidt, H.O.; Oxley, S.J.P.; Newton, A.C. Resistance, epidemiology and sustainable management of Rhynchosporium secalis populations on barley. Plant Pathol. 2008, 57, 1–14. [Google Scholar] [CrossRef]
  4. Liu, Z.; Ellwood, S.R.; Oliver, R.P.; Friesen, T.L. Pyrenophora teres: Profile of an increasingly damaging barley pathogen. Mol. Plant Pathol. 2011, 12, 1–19. [Google Scholar] [CrossRef] [PubMed] [Green Version]
  5. Paulitz, T.C.; Steffenson, B.J. Biotic stress in barley: Disease problems and solutions. In Barley Production, Improvement, and Uses, 1st ed.; Ullrich, S.E., Ed.; Wiley: Hoboken, NJ, USA, 2011; pp. 307–354. [Google Scholar]
  6. Shipton, W.A. Effect of net blotch infection of barley on grain yield and quality. Aust. J. Exp. Agric. Anim. Husb. 1966, 6, 437–440. [Google Scholar] [CrossRef]
  7. Shipton, W.A.; Boyd, W.J.R.; Ali, S.M. Scald of barley. Rev. Plant. Pathol. 1974, 53, 839–861. [Google Scholar]
  8. Martin, R.A. Disease progression and yield loss in barley associated with net blotch, as influenced by fungicide seed treatment. Can. J. Plant Pathol. 1985, 7, 83–90. [Google Scholar] [CrossRef]
  9. Khan, T.N. Relationship between net blotch (Drechslera teres) and losses in grain yield of barley in Western Australia. Aust. J. Agric. Res. 1987, 38, 671–679. [Google Scholar] [CrossRef]
  10. El Yousfi, B.; Ezzahiri, B. Net blotch in semi-arid regions of Marocco II: Yield and yield-loss modeling. Field Crops Res. 2002, 73, 81–93. [Google Scholar] [CrossRef]
  11. Murray, G.M.; Brennan, J.P. Estimating disease losses to the Australian barley industry. Australas. Plant Pathol. 2010, 39, 85–96. [Google Scholar] [CrossRef]
  12. McCartney, H.A.; Fitt, B.D.L. Dispersal of foliar fungal plant pathogens: Mechanisms, gradients and spatial patterns. In The Epidemiology of Plant Diseases, 1st ed.; Jones, D.G., Ed.; Springer: Dordrecht, The Netherlands, 1998; pp. 138–160. [Google Scholar]
  13. Gibson, G.J. Investigating mechanisms of spatiotemporal epidemic spread using stochastic models. Phytopathology 1997, 87, 139–146. [Google Scholar] [CrossRef] [Green Version]
  14. Gibson, G.J. Markov chain Monte Carlo methods for fitting spatiotemporal epidemic stochastic models in plant epidemiology. J. R. Stat. Soc. Ser. C 1997, 46, 215–233. [Google Scholar] [CrossRef]
  15. Madden, L.V. Botanical epidemiology: Some key advances and its continuing role in disease management. Eur. J. Plant Pathol. 2006, 115, 3–23. [Google Scholar] [CrossRef]
  16. Scherm, H.; Ngugi, H.K.; Ojiambo, P.S. Trends in theoretical plant epidemiology. Eur. J. Plant Pathol. 2006, 115, 61–73. [Google Scholar] [CrossRef]
  17. Luo, W.; Pietravalle, S.; Parnell, S.; van den Bosch, F.; Gottwald, T.R.; Irey, M.S.; Parke, S.R. An improved regulatory sampling method for mapping and representing plant disease from a limited number of samples. Epidemics 2012, 4, 68–77. [Google Scholar] [CrossRef]
  18. El Yousfi, B.; Ezzahiri, B. Net blotch in semi arid regions of Morocco. I Epidemiology. Field Crops Res. 2001, 73, 35–46. [Google Scholar] [CrossRef]
  19. Baethgen, W.E.; Christianson, C.B.; Lamothe, A.G. Nitrogen fertilizer effects on growth, grain yield, and yield components of malting barley. Field Crops Res. 1995, 43, 87–99. [Google Scholar] [CrossRef]
  20. Abeledo, L.G.; Calderini, D.F.; Slafer, G.A. Nitrogen economy in old and modern malting barleys. Field Crops Res. 2008, 106, 171–178. [Google Scholar] [CrossRef]
  21. Albrizio, R.; Todorovic, M.; Matic, T.; Stellacci, A.M. Comparing the interactive effects of water and nitrogen on durum wheat and barley grown in a Mediterranean environment. Field Crops Res. 2010, 115, 179–190. [Google Scholar] [CrossRef]
  22. Dordas, C. Variation in dry matter and nitrogen accumulation and remobilization in barley as affected by fertilization, cultivar, and source–sink relations. Eur. J. Agron. 2012, 37, 31–42. [Google Scholar] [CrossRef]
  23. Grant, C.A.; Gauer, L.E.; Gehl, D.T.; Bailey, L.D. Protein production and nitrogen utilization by barley cultivars in response to nitrogen fertilizer under varying moisture conditions. Can. J. Plant Sci. 1991, 7l, 997–1009. [Google Scholar] [CrossRef] [Green Version]
  24. Grashoff, C.; D’Antuono, L.F. Effect of shading and nitrogen application on yield, grain size distribution and concentrations of nitrogen and water soluble carbohydrates in malting spring barley (Hordeum vulgare L.). Eur. J. Agron. 1997, 6, 275–293. [Google Scholar] [CrossRef]
  25. Boonchoo, S.; Fukai, S.; Hetherington, S.E. Barley yield and grain protein concentration as affected by assimilate and nitrogen availability. Aust. J. Agric. Res. 1998, 49, 695–706. [Google Scholar] [CrossRef]
  26. Agegnehu, G.; Nelson, P.N.; Bird, M.I. The effects of biochar, compost and their mixture and nitrogen fertilizer on yield and nitrogen use efficiency of barley grown on a Nitisol in the highlands of Ethiopia. Sci. Total Environ. 2016, 569–570, 869–879. [Google Scholar] [CrossRef] [PubMed]
  27. Jenkyn, J.F.; Griffiths, E. Relationships between the severity of leaf blotch (Rhynchosporium secalis) and the water-soluble carbohydrate and nitrogen contents of barley plants. Ann. Appl. Biol. 1978, 90, 35–44. [Google Scholar] [CrossRef]
  28. Krupinsky, J.M.; Halvorson, A.D.; Tanaka, D.L.; Merrill, S.D. Nitrogen and tillage effects on wheat leaf spot diseases in the northern great plains. Agron. J. 2007, 99, 562–569. [Google Scholar] [CrossRef]
  29. Dordas, C. Role of nutrients in controlling plant diseases in sustainable agriculture. A review. Agron. Sustain. Dev. 2008, 28, 33–46. [Google Scholar] [CrossRef] [Green Version]
  30. Kangor, T.; Sooväli, P.; Tamm, Y.; Tamm, I.; Koppel, M. Malting barley diseases, yield and quality—Responses to using various agro-technology regimes. Proc. Latv. Acad. Sci. Sect. B 2017, 71, 57–62. [Google Scholar] [CrossRef]
  31. Turkington, T.K.; O’Donovan, J.T.; Edney, M.J.; Juskiw, P.E.; McKenzie, R.H.; Harker, K.N.; Clayton, G.W.; Xi, K.; Lafond, G.P.; Irvine, R.B.; et al. Effect of crop residue, nitrogen rate and fungicide application on malting barley productivity, quality, and foliar disease severity. Can. J. Plant Sci. 2012, 92, 577–588. [Google Scholar] [CrossRef] [Green Version]
  32. Bingham, I.J.; Blake, J.; Foulkes, M.J.; Spink, J. Is barley yield in the UK sink limited? II. Factors affecting potential grain size. Field Crops Res. 2007, 101, 212–220. [Google Scholar] [CrossRef]
  33. Ugarte, C.; Calderini, D.F.; Slafer, G.A. Grain weight and grain number responsiveness to pre-anthesis temperature in wheat barley and triticale. Field Crops Res. 2007, 100, 240–248. [Google Scholar] [CrossRef]
  34. Bertholdsson, N.O. Characterization of malting barley cultivars with more or less stable grain protein content under varying environmental conditions. Eur. J. Agron. 1999, 10, 1–8. [Google Scholar] [CrossRef]
  35. Zadoks, J.C.; Chang, T.T.; Konzak, C.F. A decimal code for the growth stages of cereals. Weed Res. 1974, 14, 415–421. [Google Scholar] [CrossRef]
  36. Eyal, Z.; Scharen, A.L.; Prescott, J.M.; van Ginkel, M. The Septoria Disease of Wheat: Concepts and Methods of Disease Management; CIMMYT: Mexico City, Mexico, 1987; Available online: https://repository.cimmyt.org/xmlui/bitstream/handle/10883/1113/13508.pdf?sequence=1&isAllowed=y (accessed on 17 November 2020).
  37. Sharma, P.; Duveiller, E.; Sharma, R.C. Effect of mineral nutrient on spot blotch severity in wheat and associated increases in grain yield. Field Crops Res. 2006, 95, 426–430. [Google Scholar] [CrossRef]
  38. Saxesena, R.R.; Mishra, V.K.; Chand, R.; Chowdhury, A.K.; Bhattacharya, P.M.; Joshi, A.K. Pooling together spot blotch resistance, high yield with earliness in wheat for eastern Gangetic plains of south Asia. Field Crop. Res. 2017, 214, 291–300. [Google Scholar] [CrossRef]
  39. Saari, E.E.; Prescott, J.M. Scale for appraising the foliar intensity of wheat diseases. Plant Dis. Rep. 1975, 59, 377–380. [Google Scholar]
  40. Shaner, G.; Finney, R. The effect of nitrogen fertilization on the expression of slow-mildewing resistance in knox wheat. Phytopathology 1977, 67, 1051–1056. [Google Scholar] [CrossRef] [Green Version]
  41. Vahamidis, P.; Stefopoulou, A.; Kotoulas, V.; Lyra, D.; Dercas, N.; Economou, G. Yield, grain size, protein content and water use efficiency of null-LOX malt barley in a semiarid Mediterranean agroecosystem. Field Crops Res. 2017, 206, 115–127. [Google Scholar] [CrossRef]
  42. Getis, A.; Ord, J.K. The analysis of spatial association by use of distance statistics. Geogr. Anal. 1992, 24, 189–206. [Google Scholar] [CrossRef]
  43. Zhang, H.; Tripathi, N.K. Geospatial hotspot analysis of lung cancer patients correlated to fine particulate matter (PM2.5) and industrial wind in Eastern Thailand. J. Clean. Prod. 2018, 170, 407–424. [Google Scholar] [CrossRef]
  44. Zhang, C.; Luo, L.; Xu, W.; Ledwith, V. Use of local Moran’s I and GIS to identify pollution hotspots of Pb in urban soils of Galway, Ireland. Sci. Total Environ. 2008, 398, 212–221. [Google Scholar] [CrossRef]
  45. Lalor, G.C.; Zhang, C. Multivariate outlier detection and remediation in geochemical databases. Sci. Total Environ. 2001, 281, 99–109. [Google Scholar] [CrossRef]
  46. Nimon, K.; Lewis, M.; Kane, R.; Haynes, R.M. An R package to compute commonality coefficients in the multiple regression case: An introduction to the package and a practical example. Behav. Res. Methods 2008, 40, 457–466. [Google Scholar] [CrossRef] [PubMed] [Green Version]
  47. Ray-Mukherjee, J.; Nimon, K.; Mukherjee, S.; Morris, D.W.; Slotow, R.; Hamer, M. Using commonality analysis in multiple regressions: A tool to decompose regression effects in the face of multicollinearity. Methods Ecol. Evol. 2014, 5, 320–328. [Google Scholar] [CrossRef]
  48. Jordan, V.W.L. Aetiology of barley net blotch caused by Pyrenophora teres and some effects on yield. Plant. Pathol. 1981, 30, 77–87. [Google Scholar] [CrossRef]
  49. McLean, M.S.; Howlett, B.J.; Hollaway, G.J. Epidemiology and control of spot form of net blotch (Pyrenophora teres f. maculata) of barley: A review. Crop. Pasture Sci. 2009, 60, 303–315. [Google Scholar] [CrossRef]
  50. Fitt, B.D.L.; Creighton, N.F.; Lacey, M.E.; McCartney, H.A. Effects of rainfall intensity and duration on dispersal of Rhynchosporium secalis conidia from infected barley leaves. Trans. Br. Mycol. Soc. 1986, 86, 611–618. [Google Scholar] [CrossRef]
  51. Shjerve, R.A.; Faris, J.D.; Brueggeman, R.S.; Yan, C.; Zhu, Y.; Koladia, V.; Friesen, T.L. Evaluation of a Pyrenophora teres f. teres mapping population reveals multiple independent interactions with the barley 6H chromosome region. Fungal Genet. Biol. 2014, 70, 104–112. [Google Scholar] [CrossRef] [PubMed]
  52. Linsell, K.J.; Keiper, F.J.; Forgan, A.; Oldach, K.H. New insights into the infection process of Rhynchosporium secalis in barley using GFP. Fungal Genet. Biol. 2011, 48, 124–131. [Google Scholar] [CrossRef] [PubMed]
  53. Robinson, J.; Jalli, M. Grain yield, net blotch and scald of barley in Finnish official variety trials. Agric. Food Sci. 1997, 6, 399–408. [Google Scholar] [CrossRef]
  54. Jalakas, P.; Tulva, I.; Kangor, T.; Sooväli, P.; Rasulov, B.; Tamm, Ü.; Koppel, M.; Kollist, H.; Merilo, E. Gas exchange-yield relationships of malting barley genotypes treated with fungicides and biostimulants. Eur. J. Agron. 2018, 99, 129–137. [Google Scholar] [CrossRef]
  55. Cossani, C.M.; Savin, R.; Slafer, G.A. Contrasting performance of barley and wheat in a wide range of conditions in Mediterranean Catalonia (Spain). Ann. Appl. Biol. 2007, 151, 167–173. [Google Scholar] [CrossRef]
  56. Cossani, C.M.; Slafer, G.A.; Savin, R. Yield and biomass in wheat and barley under a range of conditions in a Mediterranean site. Field Crops Res. 2009, 112, 205–213. [Google Scholar] [CrossRef]
  57. Bingham, I.J.; Hoad, S.P.; Thomas, W.T.B.; Newton, A.C. Yield response to fungicide of spring barley genotypes differing in disease susceptibility and canopy structure. Field Crops Res. 2012, 139, 9–19. [Google Scholar] [CrossRef]
  58. Agostinetto, L.; Casa, R.T.; Bogo, A.; Sachs, C.; Souza, C.A.; Reis, E.M.; da Cunha, I.C. Barley spot blotch intensity, damage, and control response to foliar fungicide application in southern Brazil. Crop. Prot. 2015, 67, 7–12. [Google Scholar] [CrossRef]
Figure 1. Conceptual diagram of the methodological approach.
Agriculture 10 00553 g001
Figure 2. Precipitation and air temperature (Tmin and Tmax) during Exp 1 ((A), 2014–2015) and Exp 2 ((B), 2015–2016). The arrows indicate the main phenological stages: S = sowing; A = anthesis.
Agriculture 10 00553 g002
Figure 3. Malt barley cultivars’ susceptibility to Pyrenophora teres f. teres (net form net blotch—NFNB) and Rhynchosporium secalis (leaf blotch and scald) at different developmental phases during both experiments. The numbers in the brackets refer to the Zadoks scale. Broad lines are medians, square open dots are means, boxes show the interquartile ranges, and whiskers extend to the last data points within 1.5 times the interquartile ranges. p-values of ANOVA and permutation tests are given. Groups not sharing the same letter are significantly different according to least significant difference (LSD) test (p < 0.05).
Agriculture 10 00553 g003
Figure 4. Malt barley cultivars’ susceptibility to Pyrenophora teres f. teres (net form net blotch—NFNB) and Rhynchosporium secalis (leaf blotch and scald) based on the area under disease progress curve (AUDPC). Broad lines are medians, square open dots are means, boxes show the interquartile ranges, and whiskers extend to the last data points within 1.5 times the interquartile ranges. p-values of ANOVA and permutation tests are given. Groups not sharing the same letter are significantly different according to LSD test (p < 0.05).
Agriculture 10 00553 g004
Figure 5. Composite hotspot analysis (Gi z-score) and cluster pattern analysis (local Moran’s I) of disease severity (caused by Pyrenophora teres f. teres and Rhynchosporium secalis) assessed at different developmental stages of malt barley. A georeferenced arrangement of the experimental area showing the distribution of the cultivar and N-fertilizer treatments is also presented. The abbreviations stand for Gr = Grace, Zh = Zhana, Tr = Traveler and Pl = Planet.
Agriculture 10 00553 g005
Figure 6. The effect of nitrogen rate on disease severity (caused by Pyrenophora teres f. teres and Rhynchosporium secalis) assessed at different developmental stages of the studied malt barley varieties (Zhana, Grace, Traveler and RGT Planet). Broad lines are medians, square open dots are means, boxes show the interquartile ranges, and whiskers extend to the last data points within 1.5 times the interquartile ranges. p-values of ANOVA and permutation tests are given.
Agriculture 10 00553 g006
Figure 7. Relationship between grain yield and disease severity (caused by Pyrenophora teres f. teres and Rhynchosporium secalis) assessed at different developmental stages of malt barley, when the main source of variation is the nitrogen rate. The numbers in the brackets refer to the Zadoks scale. * At p ≤ 0.05; ** at p ≤ 0.01; ns = non-significant.
Agriculture 10 00553 g007
Figure 8. Relationship of disease severity (caused by Pyrenophora teres f. teres and Rhynchosporium secalis) with grain protein content and maltable grain size fraction (>2.2 mm) at grain filling phase when the main source of variation is the nitrogen rate. ** At P ≤ 0.01; ns = non-significant.
Agriculture 10 00553 g008
Figure 9. The variation in soil water content from anthesis until the end of grain filling (during Exp 2). Broad lines are medians, square open dots are means, boxes show the interquartile ranges, and whiskers extend to the last data points within 1.5 times the interquartile ranges.
Agriculture 10 00553 g009
Figure 10. Relationship between disease severity and the distance of the Zhana plots from the previous season’s Zhana crop.
Agriculture 10 00553 g010
Table 1. ANOVA summary for grain yield (GY), grain protein content (GPC), maltable (% grains > 2.2 mm), AUDPC and disease severity during the onset of stem elongation (DSSE) and grain filling (DSGF) phases.
Source of VariationGY GPC MaltableAUDPC aDSSEDSGF
Cultivar**ns*******
Nitrogenns***nsnsnsns
Cultivar x Nitrogen*nsnsnsnsns
*, ** and ***: F values significant at the p < 0.05, p < 0.01 and p < 0.001 probability levels, respectively. ns stands for non-significant effect. a AUDPC: Area under disease progress curve.
Table 2. Commonality coefficients including both unique and common effects, along with % total contribution of each predictor variable or sets of predictor variables to the regression effect.
CultivarUnique and Common EffectsOnset of Stem ElongationOnset of Grain Filling (Milk Development)
Coefficient% TotalCoefficient% Total
TravelerUnique to Distance a0.454772.510.00080.22
Unique to Nitrogen b0.00040.070.349393.17
Common to Distance and Nitrogen 0.172027.420.02486.61
Total0.6271100.000.3748100.00
ZhanaUnique to Distance0.167867.810.081979.91
Unique to Nitrogen0.00893.590.024123.51
Common to Distance and Nitrogen 0.070828.61−0.0035−3.42
Total0.2475100.000.1025100.00
GraceUnique to Distance0.383797.650.164122.26
Unique to Nitrogen0.01052.660.285038.66
Common to Distance and Nitrogen −0.0012−0.310.288139.08
Total0.3930100.000.7373100.00
RGT PlanetUnique to Distance0.191238.760.367283.26
Unique to Nitrogen0.092518.750.00200.46
Common to Distance and Nitrogen 0.209642.490.071816.29
Total0.4933100.000.4411100.00
a Refers to the distance from the nearest hotspot (m); b Refers to the rate of nitrogen application (kg/ha).
Publisher’s Note: MDPI stays neutral with regard to jurisdictional claims in published maps and institutional affiliations.

