Article

Native Perennial Plants Colonizing Abandoned Arable Fields in a Desert Area: Population Structure and Community Assembly

by
Saud L. Al-Rowaily
1,
Dekhil H. Al-Dosari
1,
Abdulaziz M. Assaeed
1,
Ahmed M. Abd-ElGawad
1,2,*,
Mohamed A. El-Sheikh
3,
Magdy I. El-Bana
4 and
Wafa’a A. Al-Taisan
5
1
Department of Plant Production, College of Food & Agric. Sciences, King Saud University, P.O. Box 2460, Riyadh 11451, Saudi Arabia
2
Department of Botany, Faculty of Science, Mansoura University, Mansoura 35516, Egypt
3
Botany and Microbiology Department, College of Science, King Saud University, P.O. Box 2455, Riyadh 11451, Saudi Arabia
4
Botany Department, Faculty of Science, Port Said University, Port Said 42511, Egypt
5
Department of Biology, College of Science, Imam Abdulrahman Bin Faisal University, P.O. Box 1982, Dammam 31441, Saudi Arabia
*
Author to whom correspondence should be addressed.
Agriculture 2020, 10(11), 550; https://doi.org/10.3390/agriculture10110550
Submission received: 11 October 2020 / Revised: 13 November 2020 / Accepted: 13 November 2020 / Published: 15 November 2020
(This article belongs to the Special Issue Conservation Agriculture for Ecosystem Services)

Abstract

:
In recent years, the phenomenon of abandonment of arable fields has increased in Saudi Arabia due to low soil fertility, drought, low rainfall, high levels of evapotranspiration, soil salinization, and low level of groundwater. We evaluated the effect of agricultural land abandonment on soil properties, perennial vegetation composition, and population structure in the Al-Kharj region, Saudi Arabia. A total of 11 perennial plant species belonging to 9 families and 11 genera were detected in the different abandoned fields of the study area. Four plant communities were identified after the application of the detrended correspondence analysis (DCA) ordination. The indicator species were (1) Seidlitzia rosmarinusZygophyllum hamiense, (2) Traganum nudatumSeidlitzia rosmarinus, (3) Traganum nudatumProsopis farcta, and (4) Calligonum comosum—Pulicaria undulata. Results of the soil analysis showed significant differences in soil texture, pH, salinity, and nutrient content among the four recognized plant communities. Demographic analysis indicated that populations of Zygophyllum hamiense and Calligonum comosum tended to be either inverse J-shaped or positively skewed which may have indicated rapidly-growing populations with high reproductive capacity. Conversely, the size–frequency distribution of Traganum nudatum, S. Rosmarinus, and Prosopis farcta was approximately symmetrical (i.e., bell-shaped). The present study sheds light on the necessity of managing abandoned agricultural fields for restoring and improving rangelands with native species that are adapted to the local conditions such as low water demand.

1. Introduction

The abandonment of agricultural fields is a common occurrence worldwide due to changes in economic circumstances, water resource shortage, and climate change [1,2,3]. Many non-crop plant species spontaneously colonize arable fields and compete with crops for nutrients, light, and space [4]. These species are considered as weeds from an agronomic perspective (segetals), but they can play a vital ecological role by contributing significantly to supporting biodiversity [4,5,6]. Farmland abandonment leads to a mixture of social, economic, and ecological effects, especially in arid areas [7,8,9]. Despite the negative impacts of land abandonment on the environment, there are also some positive consequences, including opportunities for revegetation [10,11].
Abandoned farmlands undergo natural succession or passive restoration [12] toward their original vegetation. Passive means of restoration is an important way to rehabilitate abandoned fields and improve biodiversity and ecosystem services. Several examples have shown that active restoration does not always surpass passive restoration [13]. However, passive restoration is a slow process. For example, it was found that some abandoned farmlands in the USA had only 75% of plant diversity relative to surrounding natural vegetation nearly a century after abandonment [14]. Managing for plant diversity by means of active restoration has not been widely practiced in restorations, as evidenced in the dominant use of monocultures in global revegetation efforts [15,16].
Changes in land use over a long time affect vegetation structure and habitat in many regions [17,18,19,20]. The abandoned farmlands are open to colonization by the previously-shrubby vegetation, which is often of high biological and environmental value [17,21,22]. The abandoned fields are considered as semi-natural habitats, where some plant species, such as grasses and woody species, are dependent on the land-use disturbance regimes [23,24]. Plant diversity can be more strongly affected by many factors such as the soil seed bank or the biogeographic species pool, land-use history, and type of management [23,25].
In the late-1970s, many fields in the Al-Kharj region, southeast of Riyadh, Saudi Arabia were cultivated with diverse agricultural crops, and thus the area was considered a first-class agricultural region. However, many of the arable fields were abandoned due to a shortage of water sources and government instructions to reduce cultivation in the area. Therefore, we monitored the changes in the plant communities 40 years after post-cultivation abandonment and addressed the following questions: (i) What are the main changes in the vegetation composition after abandonment? (ii) What is the status of the population structure of the dominant plant species?

2. Materials and Methods

2.1. Study Area

The study area is located in the Al-Kharj region, southeast of Riyadh, Saudi Arabia, between 24°00′ N–47°00′ E, 24°00′ N–48°00′ E and 24°50′ N–47°00′ E–24°50 N–48°00′ E, and lying at about 400–500 m.a.s.l. (Figure 1). The study area is surrounded by rangelands that were usually grazed by domestic livestock. Many crops were cultivated in this area, such as wheat, alfalfa, and Rhodes grass, but these croplands were abandoned 40 years ago. The soil of the central region, in general, can be considered as “aridisols”, with no accumulation of clays or organic matter [26]. On the contrary, the deposits in the wadies or valley basins are deep and fine-textured with a firm, flat vegetation-covered mud surface, supported by occasional rocky, sandy, or phytogenic mounds [27].
Summers are usually very hot and winters are relatively cold. The average annual temperature is 20.1 °C. January is the coldest month with an average low of 10 °C, while August is the hottest month with an average high of 45 °C. Rainfall is scanty and unpredictable. The average annual precipitation is 81 mm/year, mostly falling during the winter months [28].

2.2. Vegetation Sampling

A total of 20 sampled stands were selected in the abandoned fields from February to April, at least one km from each other (Figure 1). Four quadrats (5 × 5 m) were placed in each stand, with the consideration given to representing a wide range of physiographic and environmental variation within each stand [29]. The vegetation sampling involved a listing of all plant species at the sample stands. The plant species density was estimated as the number of individuals of each species per unit area, and the plant cover of each species was estimated according to ordinal cover classification systems by Braun-Blanquet [29]. The importance value of each species was calculated as a summation of its relative density and relative cover. The plant species were identified according to Collenette [30] and Chaudhary [31].

2.3. Soil Analysis

Soil samples were collected from a depth of 0–50 cm at three random sites at each stand and mixed as a composite sample. The samples were air-dried and sieved through a 2 mm sieve. The organic matter was determined based on loss-on-ignition at 450 °C [32]. Soil texture was determined by the hydrometer method [32]. Soil water extract was prepared (1:5) using distilled water, and the pH and electrical conductivity (EC) were immediately measured. Soil CaCO3 was estimated according to Loeppert and Suarez [33]. Soil HCO3, Cl, and SO42− were estimated by titration methods. The contents of K and Na were determined by flame photometry (Jenway PFP7 Flame Photometer, Chelmsford, Essex, England), while Ca+2 and Mg+2 were estimated using an atomic absorption spectrometer (A Perkin-Elmer, Model 2380, Waltham, MA, USA) according to Allen, et al. [34]. The contents of P and N were determined spectrophotometrically using a spectrophotometer (Thermo Scientific, model ICP MSEOS 6000 Series, Cambridge CB5 8BZ, United Kingdom). All procedures are outlined by Allen, et al. [34].

2.4. Vegetation Data Analysis

The data were arranged in an 80 quadrat × 11 species matrix, using cover values. The matrix was subjected to cluster analysis (two-way indicator species analysis, TWINSPAN) for determination of the vegetation groups. Detrended correspondence analysis (DCA) was applied to the matrix data set in order to obtain an efficient graphical representation of the ecological structure of the identified vegetation groups [35]. DCA was performed using the PC-ORD software program, version 5.5 [36]. The variation in soil variables in relation to the plant community was assessed via a one-way analysis of variance (ANOVA). To determine the relationships between the four determined plant communities and soil variables, Spearman rank correlation coefficient was used, based on density, cover, and richness. Both ANOVA and correlation were performed using the SPSS software program, version 24.0 (IBM Corp. Released 2016. IBM SPSS Statistics for Windows, Version 24.0. Armonk, NY, USA: IBM Corp).

2.5. Species Size Structure Analysis

In the 20 sampled stands, the height (H) and mean crown diameter (CD) of each individual of the dominant plants (with high frequency and abundance) were measured within the studied quadrats. The diameter was measured for three crown diameters depending on the uniformity of the individual. The plant size index was calculated according to the modified form of Crisp and Lange [37] as (H+CD)/2. The size index value of plant per each species was used to determine the frequency distribution of the different age (size) cohorts. Size index values were used to classify the plant populations into ten size classes. The first and second classes were considered as seedlings and the third class was assigned to the juvenile stage. In order to evaluate the characteristics of each size class, the total density of the plant species was also calculated. The mean density, height, crown diameter, volume, size index, and the correlation between height and diameter of each population were also calculated.

3. Results

3.1. Vegetation Composition

A total of 11 perennial plant species, belonging to 9 families and 11 genera, were recorded in the different abandoned fields of the study area (Table 1). Chenopodiaceae was the most represented family with 27.3%, while the other 8 families (Mimosaceae, Zygophyllaceae, Polygonaceae, Asteraceae, Asclepiadaceae, Papilionaceae, Ephederaceae, and Convolvulaceae) were represented by 9.09% for each. Among the recorded species, Prosopis farcta had the highest mean density (28.34 individuals/25 m2), followed by Zygophyllum hamiense (18.57 individuals/25 m2). On the contrary, Convolvulus cephalopodus recorded the lowest mean density and cover (1.18 individuals/25 m2, 1.53%). The succulent Seidlitzia rosmarinus attained the highest mean cover (55.38%).
The classification of stands by cluster analysis led to recognition of four vegetation groups that ordinated on DCA with the following indicator species: vegetation group-I (VG-I), Seidlitzia Rosmarinus—Zygophyllum hamiense; VG-II, Traganum nudatum—Seidlitzia rosmarinus; VG-III, Traganum nudatum—Prosopis farcta; and VG-IV, Calligonum comosum—Pulicaria undulata (Figure 2).

3.2. Vegetation–Soil Relationship

Analysis of variance revealed that all the measured soil variables were significantly different among the four recognized communities (Table 2). Sand content was highest (90.12%) in the VG-IV (Calligonum comosum—Pulicaria undulata) community, where it attained the lowest clay content (5.89%). The soil of the VG-I (Seidlitzia rosmarinusZygophyllum hamiense) community had the highest pH (8.64) and salinity (6.36 dS/m) and the highest CaCO3 (17.38%), Mg2+ (7.28 meq/L), Na+ (46.4 meq/L), K+ (5.16 meq/L), chloride (9.88 meq/L), sulphate (37.8 meq/L), and bicarbonate (12.5 meq/L) concentrations, while the lowest values of these variables were recorded in the VG-IV (Calligonum comosum—Pulicaria undulata) community.
Plant density and species richness were positively related to sand and organic matter content, while they were negatively correlated with pH, EC, and cation and anions concentrations (Table 3). On the other hand, the plant cover had a significant negative correlation to plant density, sand percentage, and organic matter content, while it showed a significant positive correlation with pH, EC and Cl and SO42, cation and anion concentrations.

3.3. Demographic Analysis of the Dominant Plant Species

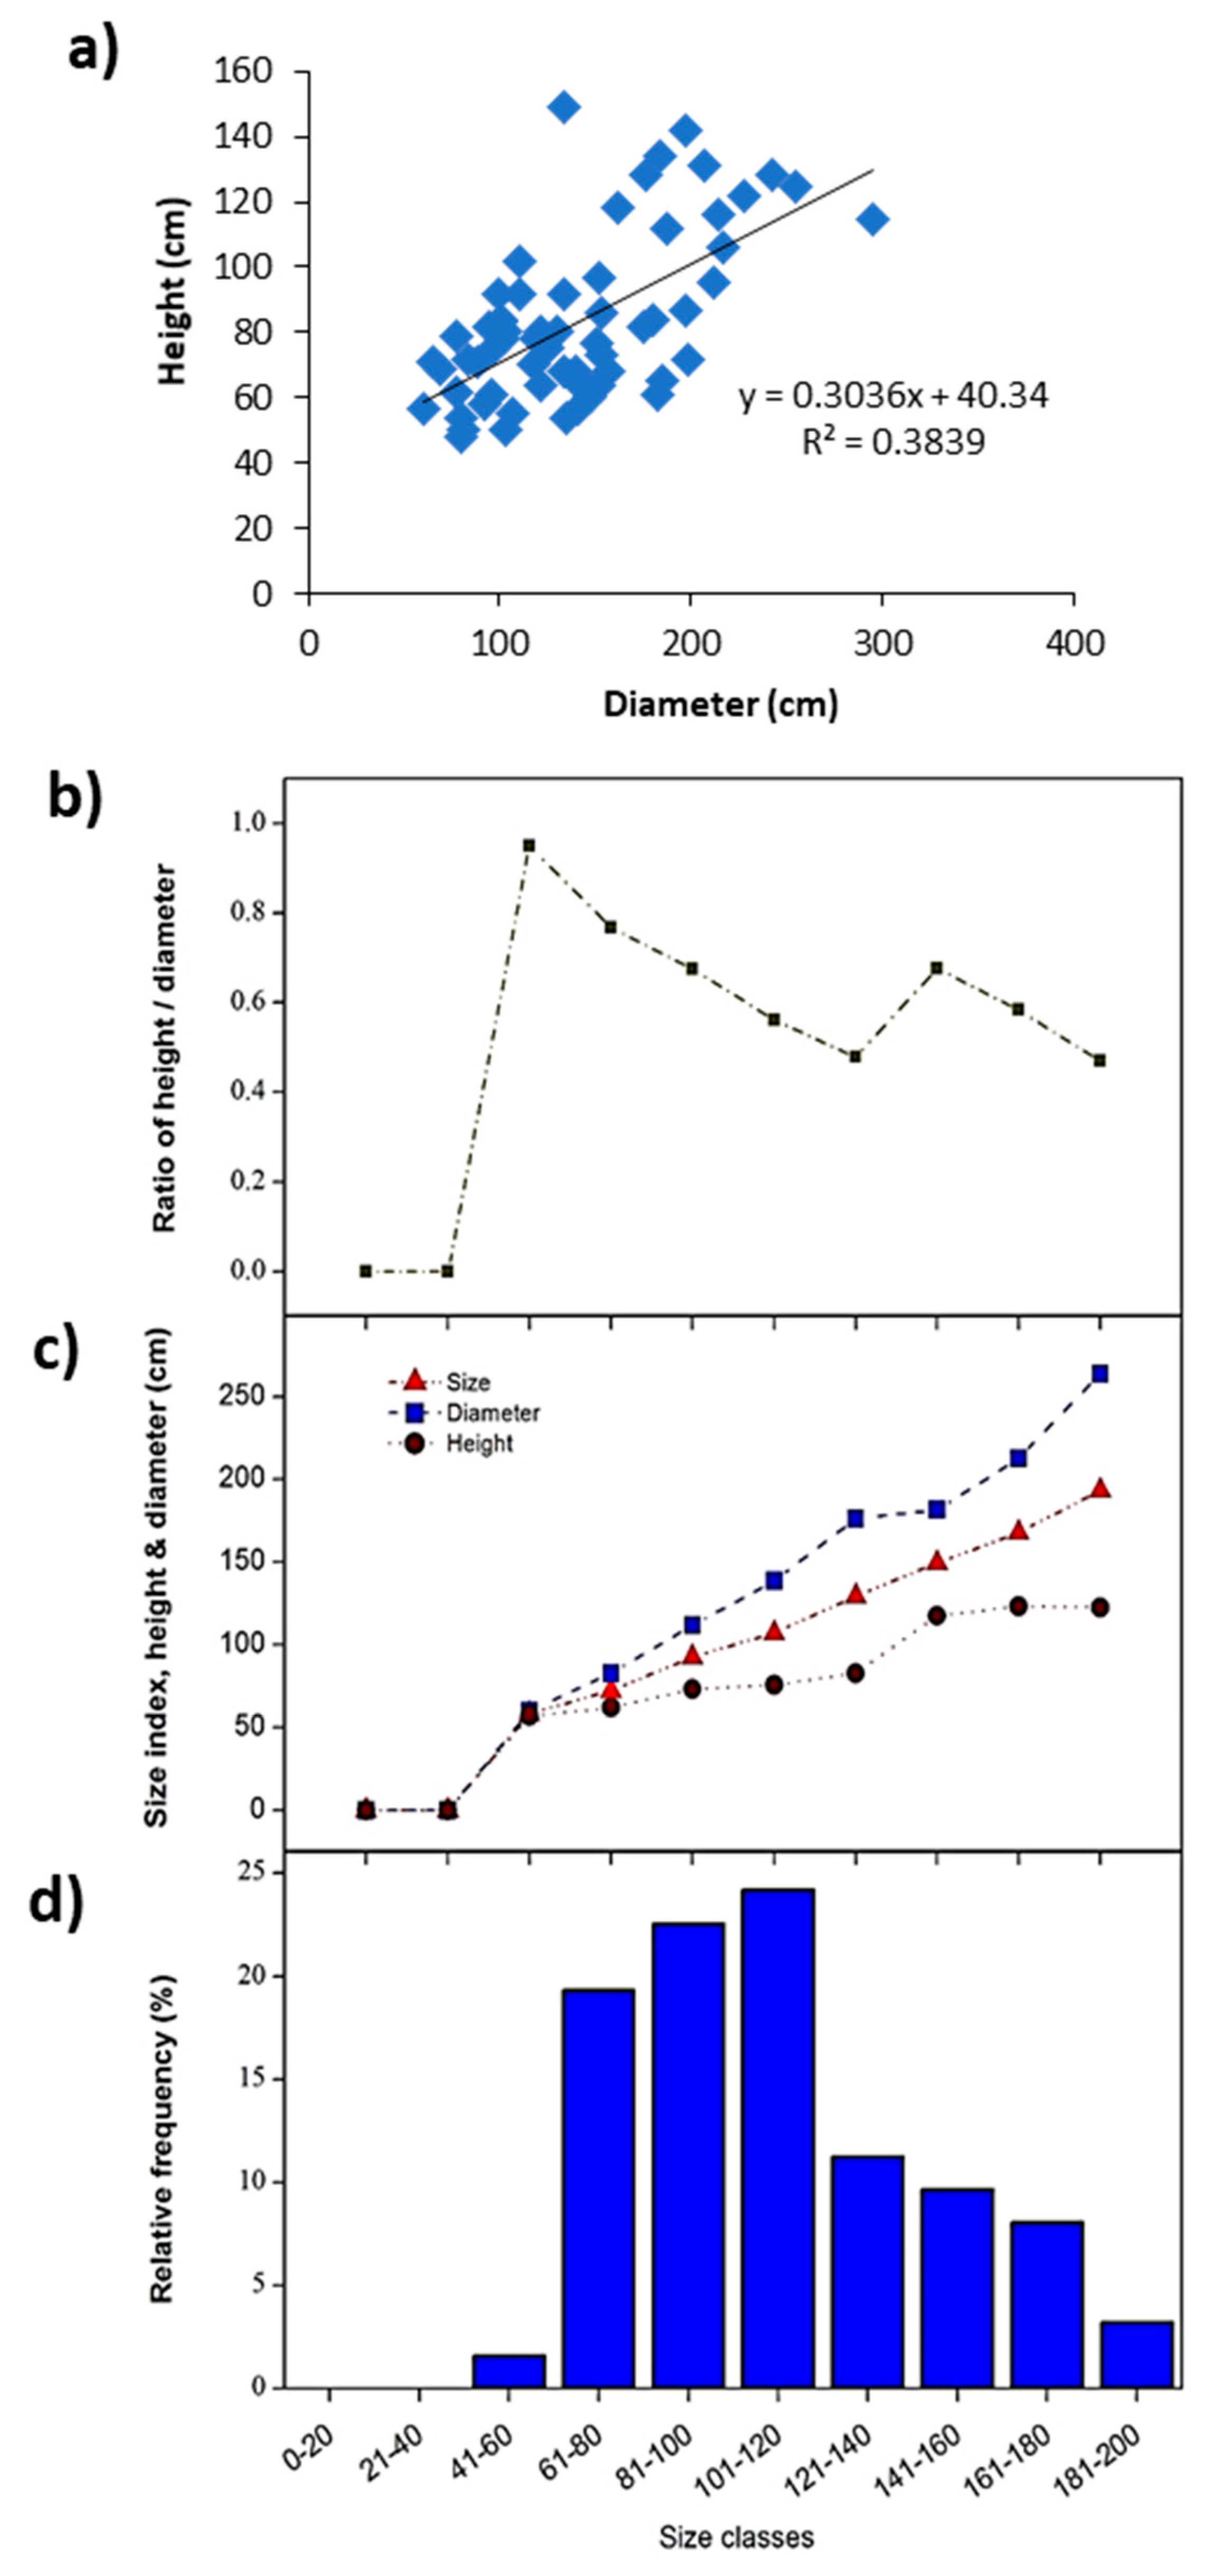
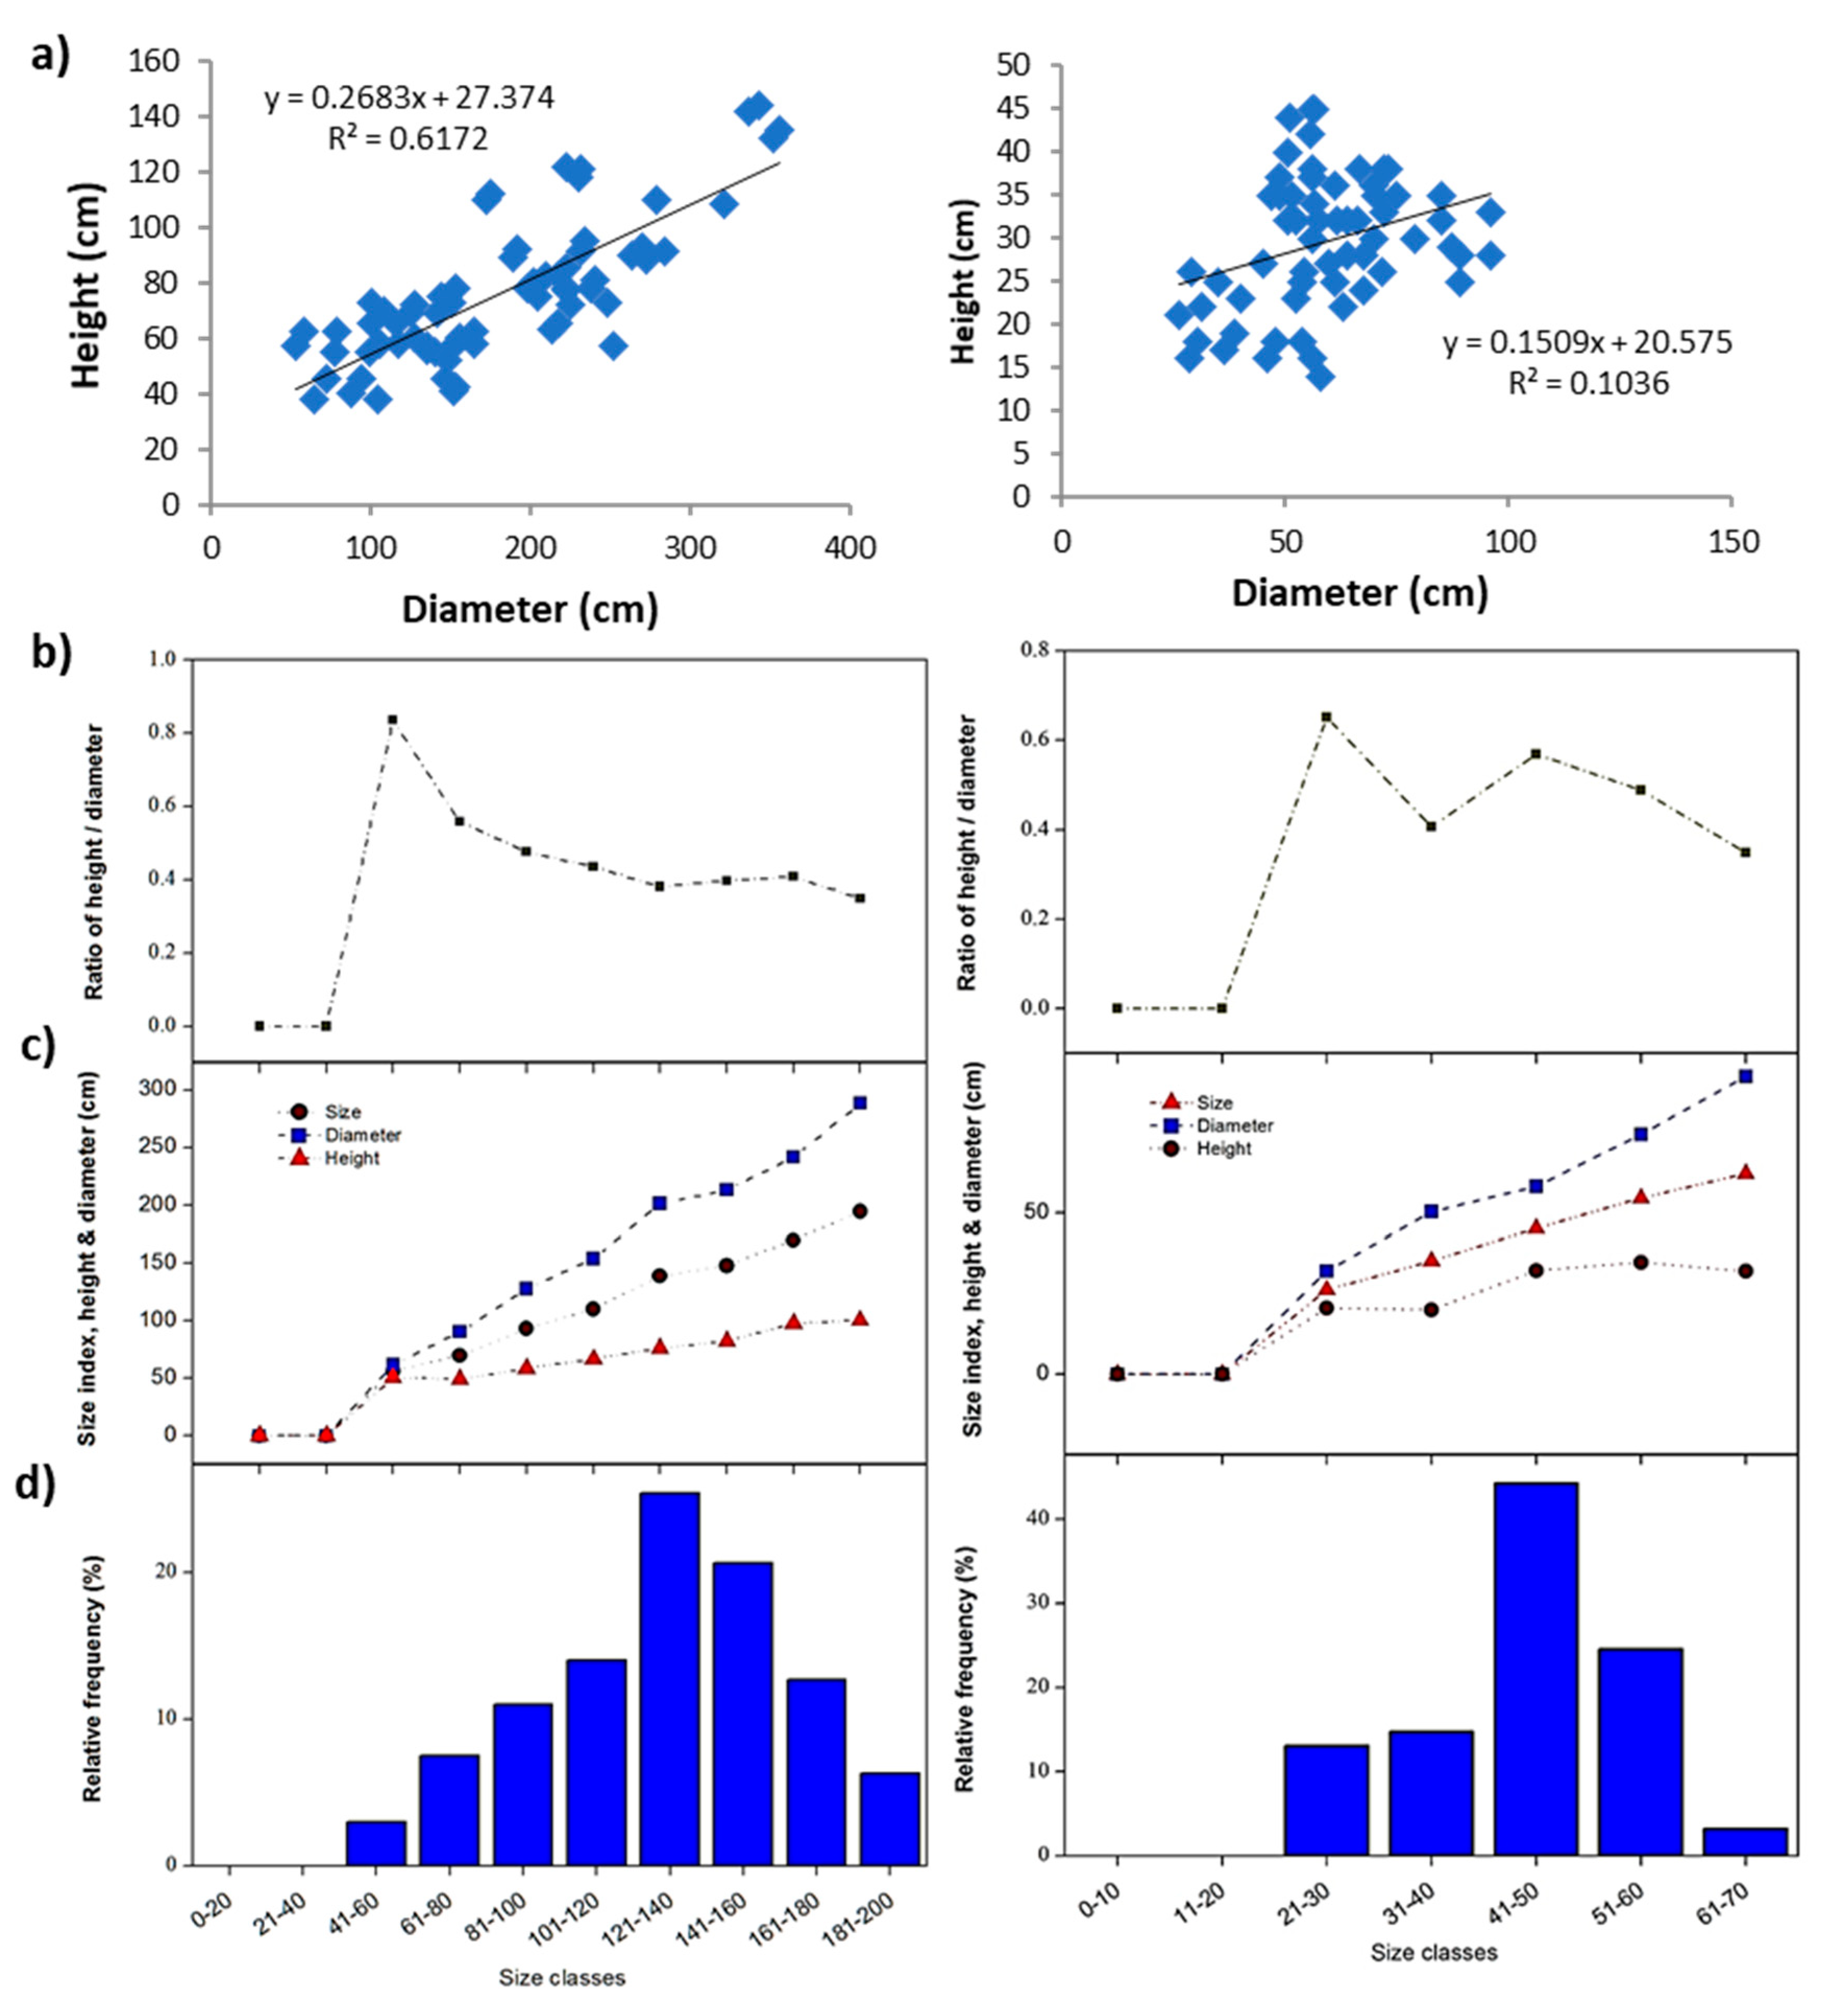
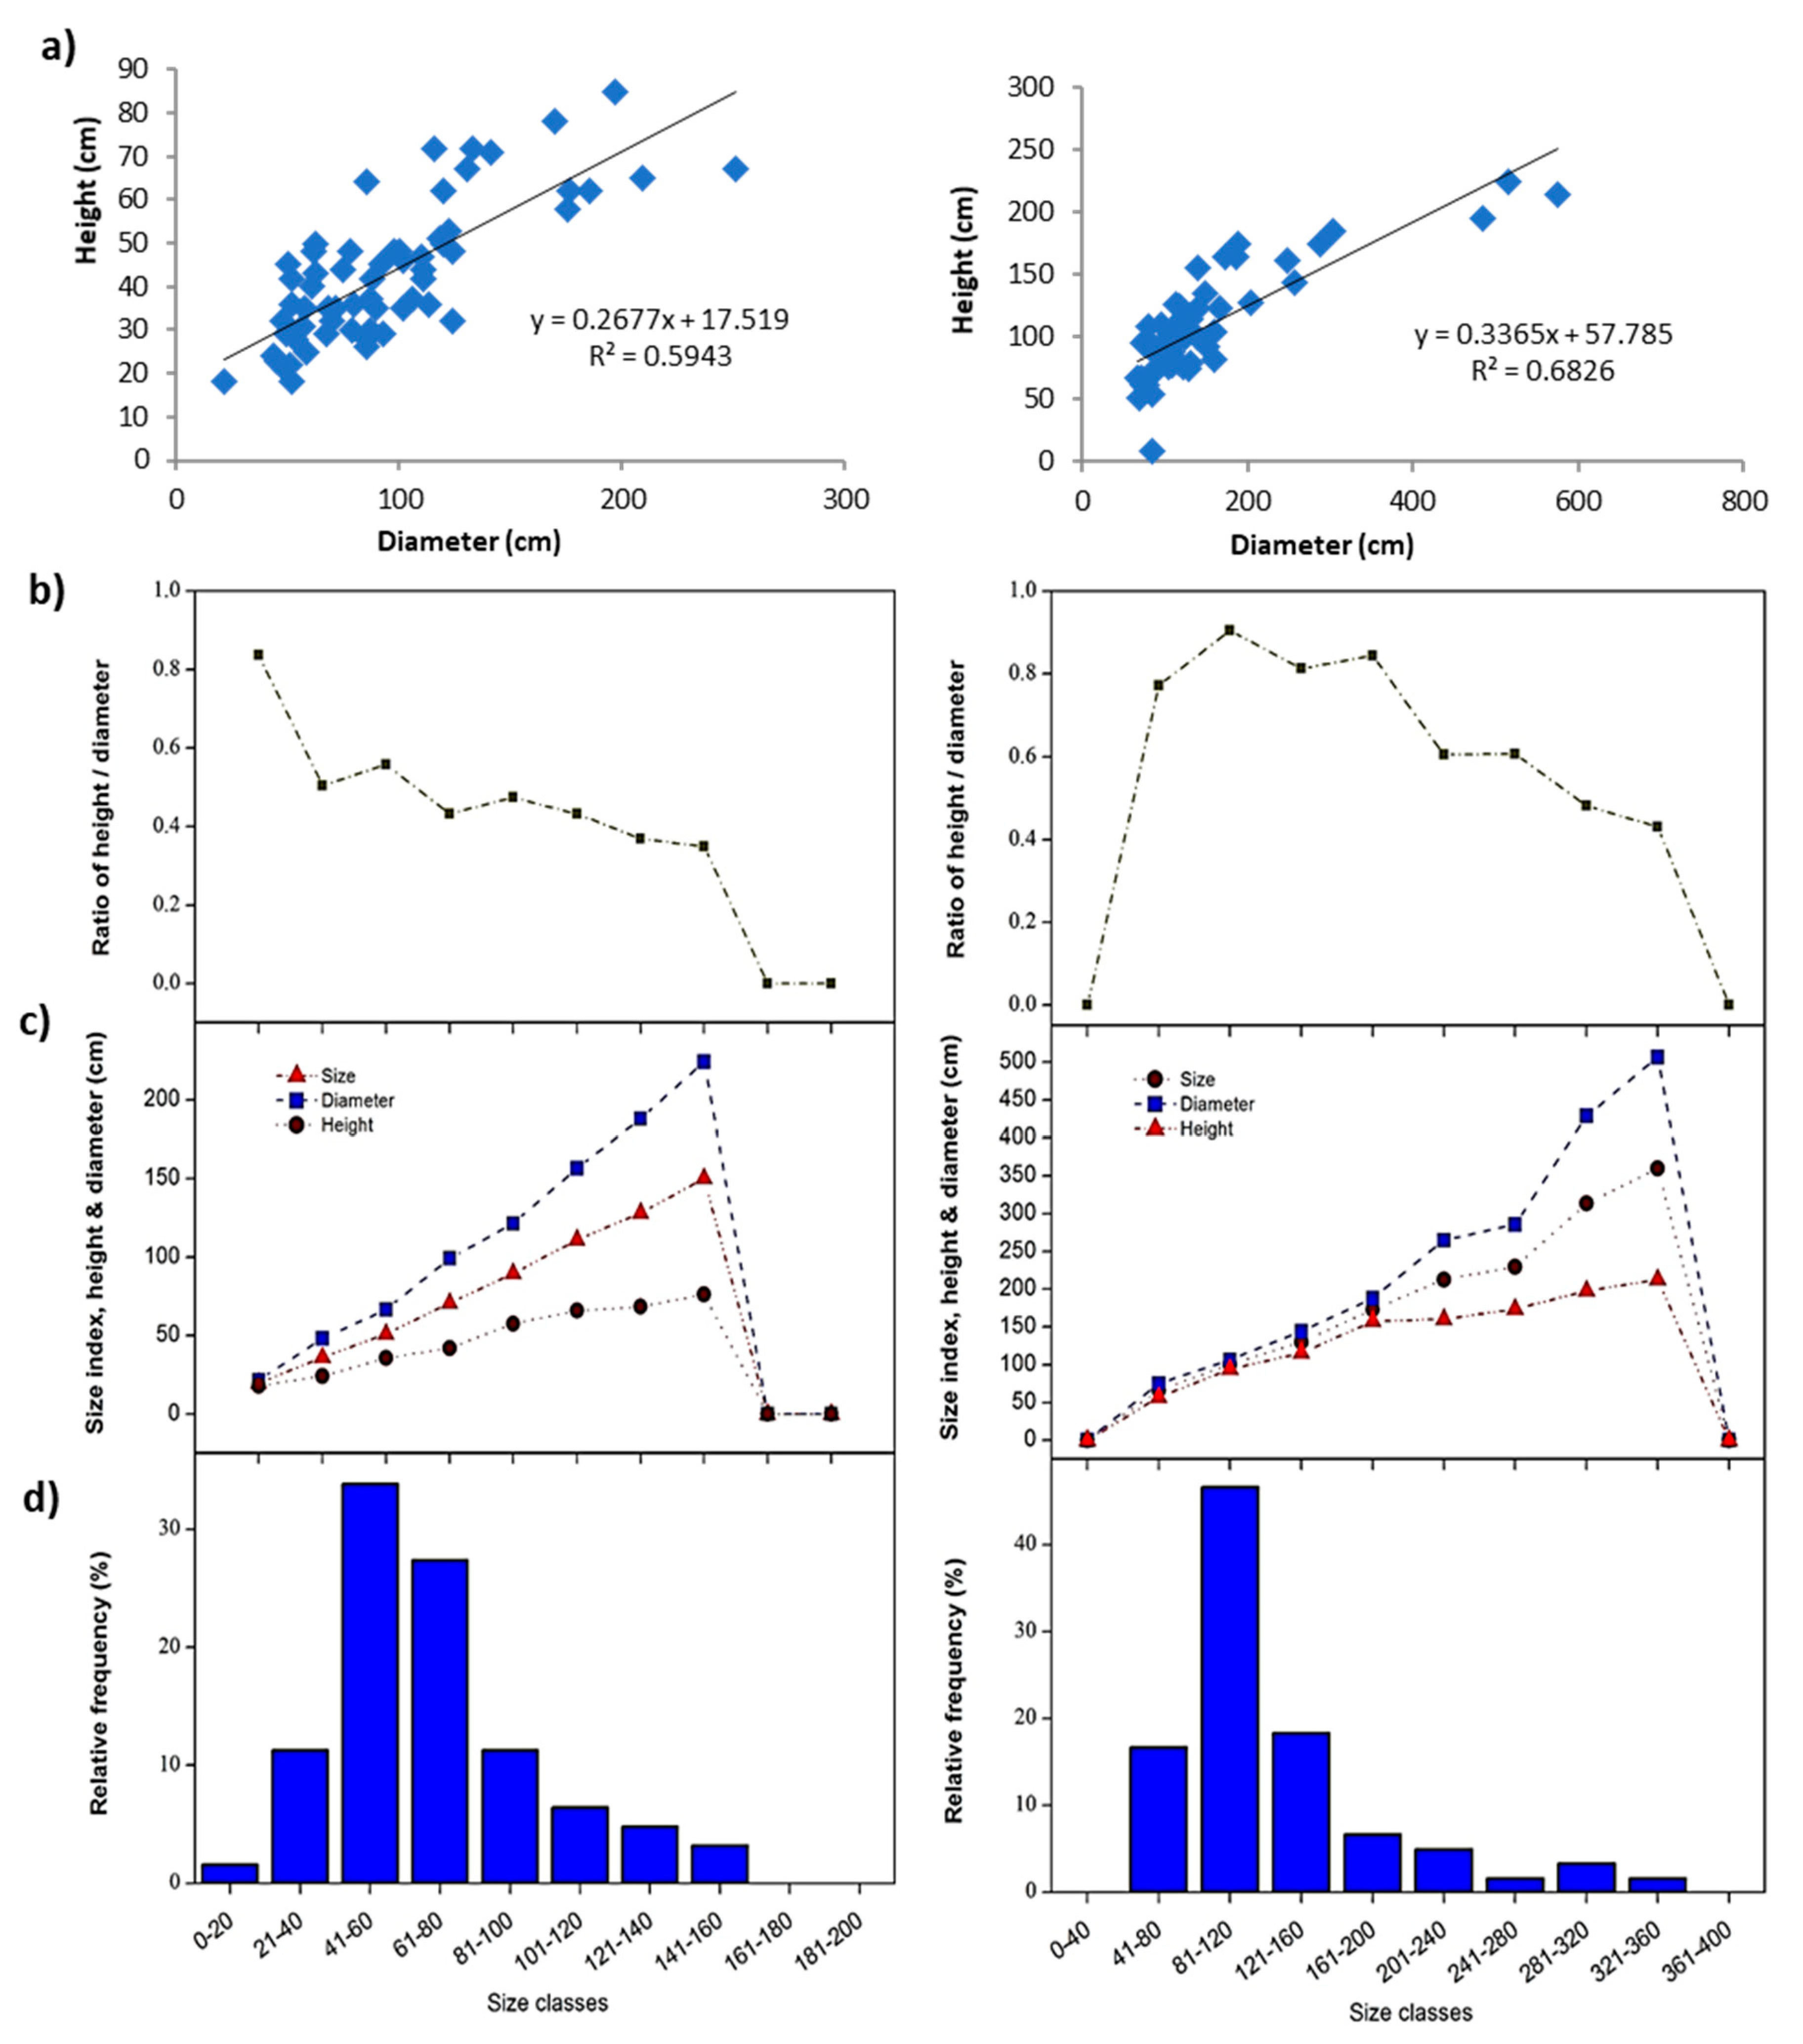
Demographic analysis indicated that the populations of Seidlitzia rosmarinus had a largest mean diameter (181.73 cm) and size index (128.93 cm), and the lowest height/diameter ratio (0.46 cm) (Table 4). The population of Calligonum comosum had the highest average height (106.88 cm), height/diameter ratio (0.82) and volume (4.06 m3). The population of Prosopis farcta had lowest mean values of most size-structure characteristics. The relationship between height and diameter for most species was significantly positive except for the population of Prosopis farcta, for which it was not significant.
The populations of Traganum nudatum, Seidlitzia rosmarinus, and Prosopis farcta had approximately symmetrical (i.e., bell shaped) size distribution across all sizes (Figure 3 and Figure 4). Contrary to this, the size–frequency distribution of Zygophyllum hamiense and Calligonum comosum tended to be either inverse J-shaped or positively skewed which may suggest the presence of rapidly-growing populations with high reproductive capacity (Figure 5).

4. Discussion

The dominance of the succulent shrubs of the Chenopodiaceae family in the study area reflects the nature of the arid salinized soil of the abandoned field habitats in the Arabian desert, as these species are morphologically and physiologically adapted to dry and saline habitats [38,39]. The absence of annual species in the surveyed vegetation could be due to low rainfall during the sampling season. These results are comparable with some previous studies [17,40]. Castellanos, et al. [40] observed the dominance of succulent shrubs in the abandoned fields of the Sonoran Desert of Mexico. Moreover, El-Sheikh [17] pointed out that in late succession stages, the abandoned fields in Egypt were dominated by shrubs and trees. However, Bonet [41] showed that annuals attained higher values of abundance in the abandoned fields in south-eastern Spain.
The classification of vegetation stands resulted in the identification of four plant communities. The floristic composition of these communities is hamiense, which is comparable to that of plant communities found in the neighboring natural areas of Al-Kharj such as wadis (ephemeral watercourses), raudhas (meadows), and sand dunes [42,43]. However, xerophytic and succulent halophytes are much more represented in the study area [44]. This is due to the ingression of species from surrounding areas in former arable fields [17,45]. The separation of the four communities was good evidence that the first axis of the DCA diagram represented the succulent halophytes shrubs (VG-I, II).
On right side of the DCA, the community of Calligonum comosum—Pulicaria undulata was separated. This represented the old succession at abandoned sandy dry fields, where Calligonum comosum shrubs growing on dry sandy soils and sand dunes. This shrub is very resistant to adverse soil and moisture conditions. It produces root suckers and is easily propagated by cutting and layering. The soil of the succulent halophyte communities (VG-I: Seidlitzia rosmarinus—Zygophyllum hamiense) had high silt and clay content, high salinity and pH, and high SO42−, chloride, and mineral concentrations. These results are consistent with findings by Knops and Tilman [46] in the Minnesota sandplain, USA, Zeller, et al. [47] in the Passeier Valley in northern Italy, Dunjó, et al. [48] in the Serra de Rodes catchment, Spain, and Zhang, et al. [49] in the Qinling Mountains, China. Conversely, McLauchlan [50], Knops and Tilman [46], and Du, et al. [51] pointed out that after a long time of the field abandonment, total nitrogen and organic carbon increased and accumulated in the soil. This could explain the assemblage of VG III: Traganum nudatum—Prosopis farcta, where the roots of Prosopis farcta shrub have the ability to increase the fertility of the soil by fixation of nitrogen [52,53].
The relationship between plant density and total nitrogen and organic carbon content was negative as communities with low density have high values of plant cover due to the interspecific and intraspecific competition between species [54]. Likely, plant cover was positively correlated with the presence of soil minerals because most halophytic species such as Seidlitzia rosmarinus, Zygophyllum hamiense, and Traganum nudatum are well-adapted to salinized habitats [55].
The plant communities in the abandoned fields of the study area were characterized by a higher diameter than height. This is a strategy of many desert shrubs to reduce the high temperature [17,56,57]. The size structure of the Zygophyllum hamiense and Calligonum comosum populations was inverse J-shaped or positively skewed, which may represent rapidly-growing populations with high reproductive capacity. This may not be surprising, as small plants usually have higher reproduction rates and colonization ability. On the other hand, the populations of Seidlitzia rosmarinus, Prosopis farcta, and Traganum nudatum had approximately symmetrical (i.e., bell-shaped) size structure distribution, meaning that the percentage of small and old individuals was comparable with a high percentage of the medium-size individuals.

5. Conclusions

Agricultural land abandonment allows the regeneration of wild native perennial plants in the Al-Kharj region. Four plant communities were recognized in the study area, where soil salinity and nutrients were the main effective soil parameters determining species composition. Also, the population structure of the indicator species of these communities showed substantial differences. Prosopis farcta was the most dominant species after the abandonment of the arable lands. Therefore, we expect that this plant could colonize and dominate the abandoned fields in the future. The current study highlights the requirement for monitoring the abandoned agricultural fields and for restoring and improving rangelands with native species that are adapted to the local conditions such as low water demand. Therefore, governmental policy should be directed to take benefits and services from this habitat/ecosystem, using their resources without altering their natural characteristics.

Author Contributions

Conceptualization, S.L.A.-R., A.M.A., and M.I.E.-B.; formal analysis, S.L.A.-R., M.I.E.-B., and D.H.A.-D.; investigation, S.L.A.-R., D.H.A.-D., A.M.A., A.M.A.-E., M.I.E.-B., M.A.E.-S., and W.A.A.-T.; writing—original draft preparation, S.L.A.-R., A.M.A., A.M.A.-E., and M.A.E.-S. writing—review and editing, S.L.A.-R., D.H.A.-D., A.M.A., A.M.A.-E., M.I.E.-B., M.A.E.-S., and W.A.A.-T. All authors have read and agreed to the published version of the manuscript.

Funding

This research was supported by the Deanship of Scientific Research at King Saud University through research group No (RG-1440-113) and the APC was funded also by the Deanship of Scientific Research at King Saud University.

Acknowledgments

The authors extend their appreciation to the Deanship of Scientific Research at King Saud University, Saudi Arabia for funding this work through research group No (RG-1440-113).

Conflicts of Interest

The authors declare no conflict of interest.

References

  1. Vitousek, P.M. Beyond global warming: Ecology and global change. Ecology 1994, 75, 1861–1876. [Google Scholar] [CrossRef]
  2. Sala, O.E.; Chapin, F.S.; Armesto, J.J.; Berlow, E.; Bloomfield, J.; Dirzo, R.; Huber-Sanwald, E.; Huenneke, L.F.; Jackson, R.B.; Kinzig, A. Global biodiversity scenarios for the year 2100. Science 2000, 287, 1770–1774. [Google Scholar] [CrossRef]
  3. Wong, N.K.; Morgan, J.W.; Dorrough, J. A conceptual model of plant community changes following cessation of cultivation in semi-arid grassland. Appl. Veg. Sci. 2010, 13, 389–402. [Google Scholar] [CrossRef]
  4. Fanfarillo, E.; Latini, M.; Iberite, M.; Bonari, G.; Nicolella, G.; Rosati, L.; Salerno, G.; Abbate, G. The segetal flora of winter cereals and allied crops in Italy: Species inventory with chorological, structural and ecological features. Plant Biosyst. 2020, 154, 1–12. [Google Scholar] [CrossRef]
  5. Nowak, A.; Nowak, S.; Nobis, M.; Nobis, A. A report on the conservation status of segetal weeds in Tajikistan. Weed Res. 2014, 54, 635–648. [Google Scholar] [CrossRef]
  6. Storkey, J.; Neve, P. What good is weed diversity? Weed Res. 2018, 58, 239–243. [Google Scholar] [CrossRef]
  7. Fredh, E.D.; Lagerås, P.; Mazier, F.; Björkman, L.; Lindbladh, M.; Broström, A. Farm establishment, abandonment and agricultural practices during the last 1,300 years: A case study from southern Sweden based on pollen records and the LOVE model. Veg. Hist. Archaeobot. 2019, 28, 529–544. [Google Scholar] [CrossRef]
  8. Verstraete, M.M.; Scholes, R.J.; Smith, M.S. Climate and desertification: Looking at an old problem through new lenses. Front. Ecol. Environ. 2009, 7, 421–428. [Google Scholar] [CrossRef]
  9. Cramer, V.A.; Hobbs, R.J.; Standish, R.J. What’s new about old fields? Land abandonment and ecosystem assembly. Trends Ecol. Evol. 2008, 23, 104–112. [Google Scholar] [CrossRef]
  10. Benayas, J.R.; Martins, A.; Nicolau, J.M.; Schulz, J.J. Abandonment of agricultural land: An overview of drivers and consequences. CAB Rev. 2007, 2, 1–14. [Google Scholar] [CrossRef] [Green Version]
  11. Benayas, J.M.R.; Newton, A.C.; Diaz, A.; Bullock, J.M. Enhancement of biodiversity and ecosystem services by ecological restoration: A meta-analysis. Science 2009, 325, 1121–1124. [Google Scholar] [CrossRef]
  12. Hernandez, R.R.; Armstrong, A.; Burney, J.; Ryan, G.; Moore-O’Leary, K.; Diédhiou, I.; Grodsky, S.M.; Saul-Gershenz, L.; Davis, R.; Macknick, J. Techno–ecological synergies of solar energy for global sustainability. Nat. Sustain. 2019, 2, 560–568. [Google Scholar] [CrossRef]
  13. Yang, Y.; Hobbie, S.E.; Hernandez, R.R.; Fargione, J.; Grodsky, S.M.; Tilman, D.; Zhu, Y.-G.; Luo, Y.; Smith, T.M.; Jungers, J.M. Restoring abandoned farmland to mitigate climate change on a full earth. One Earth 2020, 3, 176–186. [Google Scholar] [CrossRef]
  14. Isbell, F.; Tilman, D.; Reich, P.B.; Clark, A.T. Deficits of biodiversity and productivity linger a century after agricultural abandonment. Nat. Ecol. Evol. 2019, 3, 1533–1538. [Google Scholar] [CrossRef]
  15. Klopf, R.P.; Baer, S.G.; Bach, E.M.; Six, J. Restoration and management for plant diversity enhances the rate of belowground ecosystem recovery. Ecol. Appl. 2017, 27, 355–362. [Google Scholar] [CrossRef] [Green Version]
  16. Porensky, L.M.; Perryman, B.L.; Williamson, M.A.; Madsen, M.D.; Leger, E.A. Combining active restoration and targeted grazing to establish native plants and reduce fuel loads in invaded ecosystems. Ecol. Evol. 2018, 8, 12533–12546. [Google Scholar] [CrossRef]
  17. El-Sheikh, M.A. Plant succession on abandoned fields after 25 years of shifting cultivation in Assuit, Egypt. J. Arid Environ. 2005, 61, 461–481. [Google Scholar] [CrossRef]
  18. Ng, K.; Barton, P.S.; Blanchard, W.; Evans, M.J.; Lindenmayer, D.B.; Macfadyen, S.; McIntyre, S.; Driscoll, D.A. Disentangling the effects of farmland use, habitat edges, and vegetation structure on ground beetle morphological traits. Oecologia 2018, 188, 645–657. [Google Scholar] [CrossRef]
  19. Stoate, C.; Báldi, A.; Beja, P.; Boatman, N.; Herzon, I.; Van Doorn, A.; De Snoo, G.; Rakosy, L.; Ramwell, C. Ecological impacts of early 21st century agricultural change in Europe—A review. J. Environ. Manag. 2009, 91, 22–46. [Google Scholar] [CrossRef]
  20. Meyer, S.T.; Heuss, L.; Feldhaar, H.; Weisser, W.W.; Gossner, M.M. Land-use components, abundance of predatory arthropods, and vegetation height affect predation rates in grasslands. Agric. Ecosyst. Environ. 2019, 270, 84–92. [Google Scholar] [CrossRef]
  21. Li, W.; Li, J.; Liu, S.; Zhang, R.; Qi, W.; Zhang, R.; Knops, J.M.; Lu, J. Magnitude of species diversity effect on aboveground plant biomass increases through successional time of abandoned farmlands on the eastern Tibetan Plateau of China. Land Degrad. Dev. 2017, 28, 370–378. [Google Scholar] [CrossRef] [Green Version]
  22. Shiferaw, W.; Demissew, S.; Bekele, T. Ecology of soil seed banks: Implications for conservation and restoration of natural vegetation: A review. Int. J. Biodiv. Conserv. 2018, 10, 380–393. [Google Scholar]
  23. Gustavsson, E.; Lennartsson, T.; Emanuelsson, M. Land use more than 200 years ago explains current grassland plant diversity in a Swedish agricultural landscape. Biol. Conserv. 2007, 138, 47–59. [Google Scholar] [CrossRef]
  24. Römermann, C.; Bernhardt-Römermann, M.; Kleyer, M.; Poschlod, P. Substitutes for grazing in semi-natural grasslands—Do mowing or mulching represent valuable alternatives to maintain vegetation structure? J. Veg. Sci. 2009, 20, 1086–1098. [Google Scholar] [CrossRef]
  25. Stadler, J.; Trefflich, A.; Brandl, R.; Klotz, S. Spontaneous regeneration of dry grasslands on set-aside fields. Biodiv. Conserv. 2007, 16, 621–630. [Google Scholar] [CrossRef]
  26. Modaihsh, A.S.; Mahjoub, M.O.; Sallam, A.S.; Ghoneim, A.M. Evaluation of soil degradation in Al-kharj Centre, Saudi Arabia using remote sensing. Int. J. Remote Sens. Geosci. 2015, 4, 1–7. [Google Scholar]
  27. Chaudhary, S.A.; Le Houérou, H.N. The rangelands of the Arabian Peninsula. Sci. Chang. Planétaires Sécher. 2006, 17, 179–194. [Google Scholar]
  28. Vincent, P. Saudi Arabia: An Environmental Overview; Taylor & Francis: London, UK, 2008. [Google Scholar]
  29. Kent, M. Vegetation Description and Data Analysis: A Practical Approach; John Wiley & Sons: New York, NY, USA, 2011. [Google Scholar]
  30. Collenette, S. Wildflowers of Saudi Arabia; National Commission for Wildlife Conservation and Development (NCWCD): Riyadh, Saudi Arabia, 1999. [Google Scholar]
  31. Chaudhary, S.A. Flora of the Kingdom of Saudi Arabia; Ministry of Agriculture and Water: Riyadh, Saudi Arabia, 1999–2011. [Google Scholar]
  32. Piper, C.S. Soil and Plant Analysis; Interscience Publishers, Inc.: New York, NY, USA, 1947. [Google Scholar]
  33. Loeppert, R.H.; Suarez, D.L. Carbonate and gypsum. In Methods of Soil Analysis: Chemical Methods; Bigham, J.M., Ed.; Soil Science Society of America: Madison, WI, USA, 1996; pp. 437–474. [Google Scholar]
  34. Allen, S.; Grimshaw, H.M.; Parkinson, J.A.; Quarmby, C. Chemical Analysis of Ecological Materials; Blackwell: London, UK, 1989. [Google Scholar]
  35. Hill, M.O. DECORANA—A FORTRAN Program from Detrended Correspondence Analysis and Reciprocal Averaging; Cornell University: Ithaca, NY, USA, 1979. [Google Scholar]
  36. McCune, B.; Mefford, M.J. PC-ORD. In Multivariate Analysis of Ecological Data; Version 6; MjM Software: Gleneden Beach, OR, USA, 2010. [Google Scholar]
  37. Crisp, M.D.; Lange, T.T. Age structure, distribution and survival under grazing of the arid zone shrub Acacia burkii. Oikos 1976, 27, 86–92. [Google Scholar] [CrossRef]
  38. El-Bana, M.I. Floristic composition of a threatened Mediterranean sabkhat of Sinai. In Sabkha Ecosystems; Khan, M.A., Böer, B., Kust, G.S., Barth, H., Eds.; Springer: Dordrecht, Germany, 2006; pp. 155–162. [Google Scholar]
  39. Allbed, A.; Kumar, L.; Sinha, P. Soil salinity and vegetation cover change detection from multi-temporal remotely sensed imagery in Al Hassa Oasis in Saudi Arabia. Geocarto Int. 2018, 33, 830–846. [Google Scholar] [CrossRef]
  40. Castellanos, A.; Martinez, M.; Llano, J.; Halvorson, W.; Espiricueta, M.; Espejel, I. Successional trends in Sonoran Desert abandoned agricultural fields in northern Mexico. J. Arid Environ. 2005, 60, 437–455. [Google Scholar] [CrossRef]
  41. Bonet, A. Secondary succession of semi-arid Mediterranean old-fields in south-eastern Spain: Insights for conservation and restoration of degraded lands. J. Arid Environ. 2004, 56, 213–233. [Google Scholar] [CrossRef]
  42. Alyemeni, N. Ecological studies on sand dunes vegetation in AI-Kharj region, Saudi Arabia. Saudi J. Biol. Sci. 2000, 7, 64–87. [Google Scholar]
  43. Hayati, A.A.; Al-shammary, F.H. Abiotic soil factors affecting plant distribution at Jubail Wildlife Sanctuary in the Eastern Region of Saudi Arabia. Sacha J. Environ. Stud. 2011, 1, 101–115. [Google Scholar]
  44. Beauchamp, V.B.; Shafroth, P.B. Floristic composition, beta diversity, and nestedness of reference sites for restoration of xeroriparian areas. Ecol. Appl. 2011, 21, 465–476. [Google Scholar] [CrossRef] [PubMed]
  45. An, H.; Zhang, B.; Thomas, B.W.; Beck, R.; Willms, W.D.; Li, Y.; Hao, X. Short term recovery of vegetation and soil after abandoning cultivated mixedgrass prairies in Alberta, Canada. Catena 2019, 173, 321–329. [Google Scholar] [CrossRef]
  46. Knops, J.M.; Tilman, D. Dynamics of soil nitrogen and carbon accumulation for 61 years after agricultural abandonment. Ecology 2000, 81, 88–98. [Google Scholar] [CrossRef]
  47. Zeller, V.; Bahn, M.; Aichner, M.; Tappeiner, U. Impact of land-use change on nitrogen mineralization in subalpine grasslands in the Southern Alps. Biol. Fertil. Soils 2000, 31, 441–448. [Google Scholar] [CrossRef]
  48. Dunjó, G.; Pardini, G.; Gispert, M. Land use change effects on abandoned terraced soils in a Mediterranean catchment, NE Spain. Catena 2003, 52, 23–37. [Google Scholar] [CrossRef]
  49. Zhang, K.; Dang, H.; Tan, S.; Wang, Z.; Zhang, Q. Vegetation community and soil characteristics of abandoned agricultural land and pine plantation in the Qinling Mountains, China. For. Ecol. Manag. 2010, 259, 2036–2047. [Google Scholar] [CrossRef]
  50. McLauchlan, K.K. Effects of soil texture on soil carbon and nitrogen dynamics after cessation of agriculture. Geoderma 2006, 136, 289–299. [Google Scholar] [CrossRef]
  51. Du, F.; Shao, H.-B.; Shan, L.; Liang, Z.-S.; Shao, M.-A. Secondary succession and its effects on soil moisture and nutrition in abandoned old-fields of hilly region of Loess Plateau, China. Colloids Surf. B Biointerfaces 2007, 58, 278–285. [Google Scholar] [CrossRef] [PubMed]
  52. Davies, K.W.; Pokorny, M.L.; Sheley, R.L.; James, J.J. Influence of plant functional group removal on inorganic soil nitrogen concentrations in native grasslands. Rangel. Ecol. Manag. 2007, 60, 304–310. [Google Scholar] [CrossRef]
  53. Carrera, A.L.; Mazzarino, M.J.; Bertiller, M.B.; del Valle, H.F.; Carretero, E.M. Plant impacts on nitrogen and carbon cycling in the Monte Phytogeographical Province, Argentina. J. Arid Environ. 2009, 73, 192–201. [Google Scholar] [CrossRef]
  54. Lesschen, J.; Cammeraat, L.; Kooijman, A.; van Wesemael, B. Development of spatial heterogeneity in vegetation and soil properties after land abandonment in a semi-arid ecosystem. J. Arid Environ. 2008, 72, 2082–2092. [Google Scholar] [CrossRef]
  55. Al-Jaloud, A.A.; Hussain, G. Sabkha ecosystem and halophyte plant communities in Saudi Arabia. In Sabkha Ecosystems; Khan, M., Böer, B., Kust, G., Barth, H., Eds.; Springer: Dordrecht, The Netherlands, 2006; pp. 1–7. [Google Scholar]
  56. El-Bana, M.; Shaltout, K.; Khalafallah, A.; Mosallam, H. Ecological status of the Mediterranean Juniperus phoenicea L. relicts in the desert mountains of North Sinai, Egypt. Flora 2010, 205, 171–178. [Google Scholar] [CrossRef]
  57. Shaltout, K.; Sheded, M.; El-Kady, H.; Al-Sodany, Y. Phytosociology and size structure of Nitraria retusa along the Egyptian Red Sea coast. J. Arid Environ. 2003, 53, 331–345. [Google Scholar] [CrossRef]
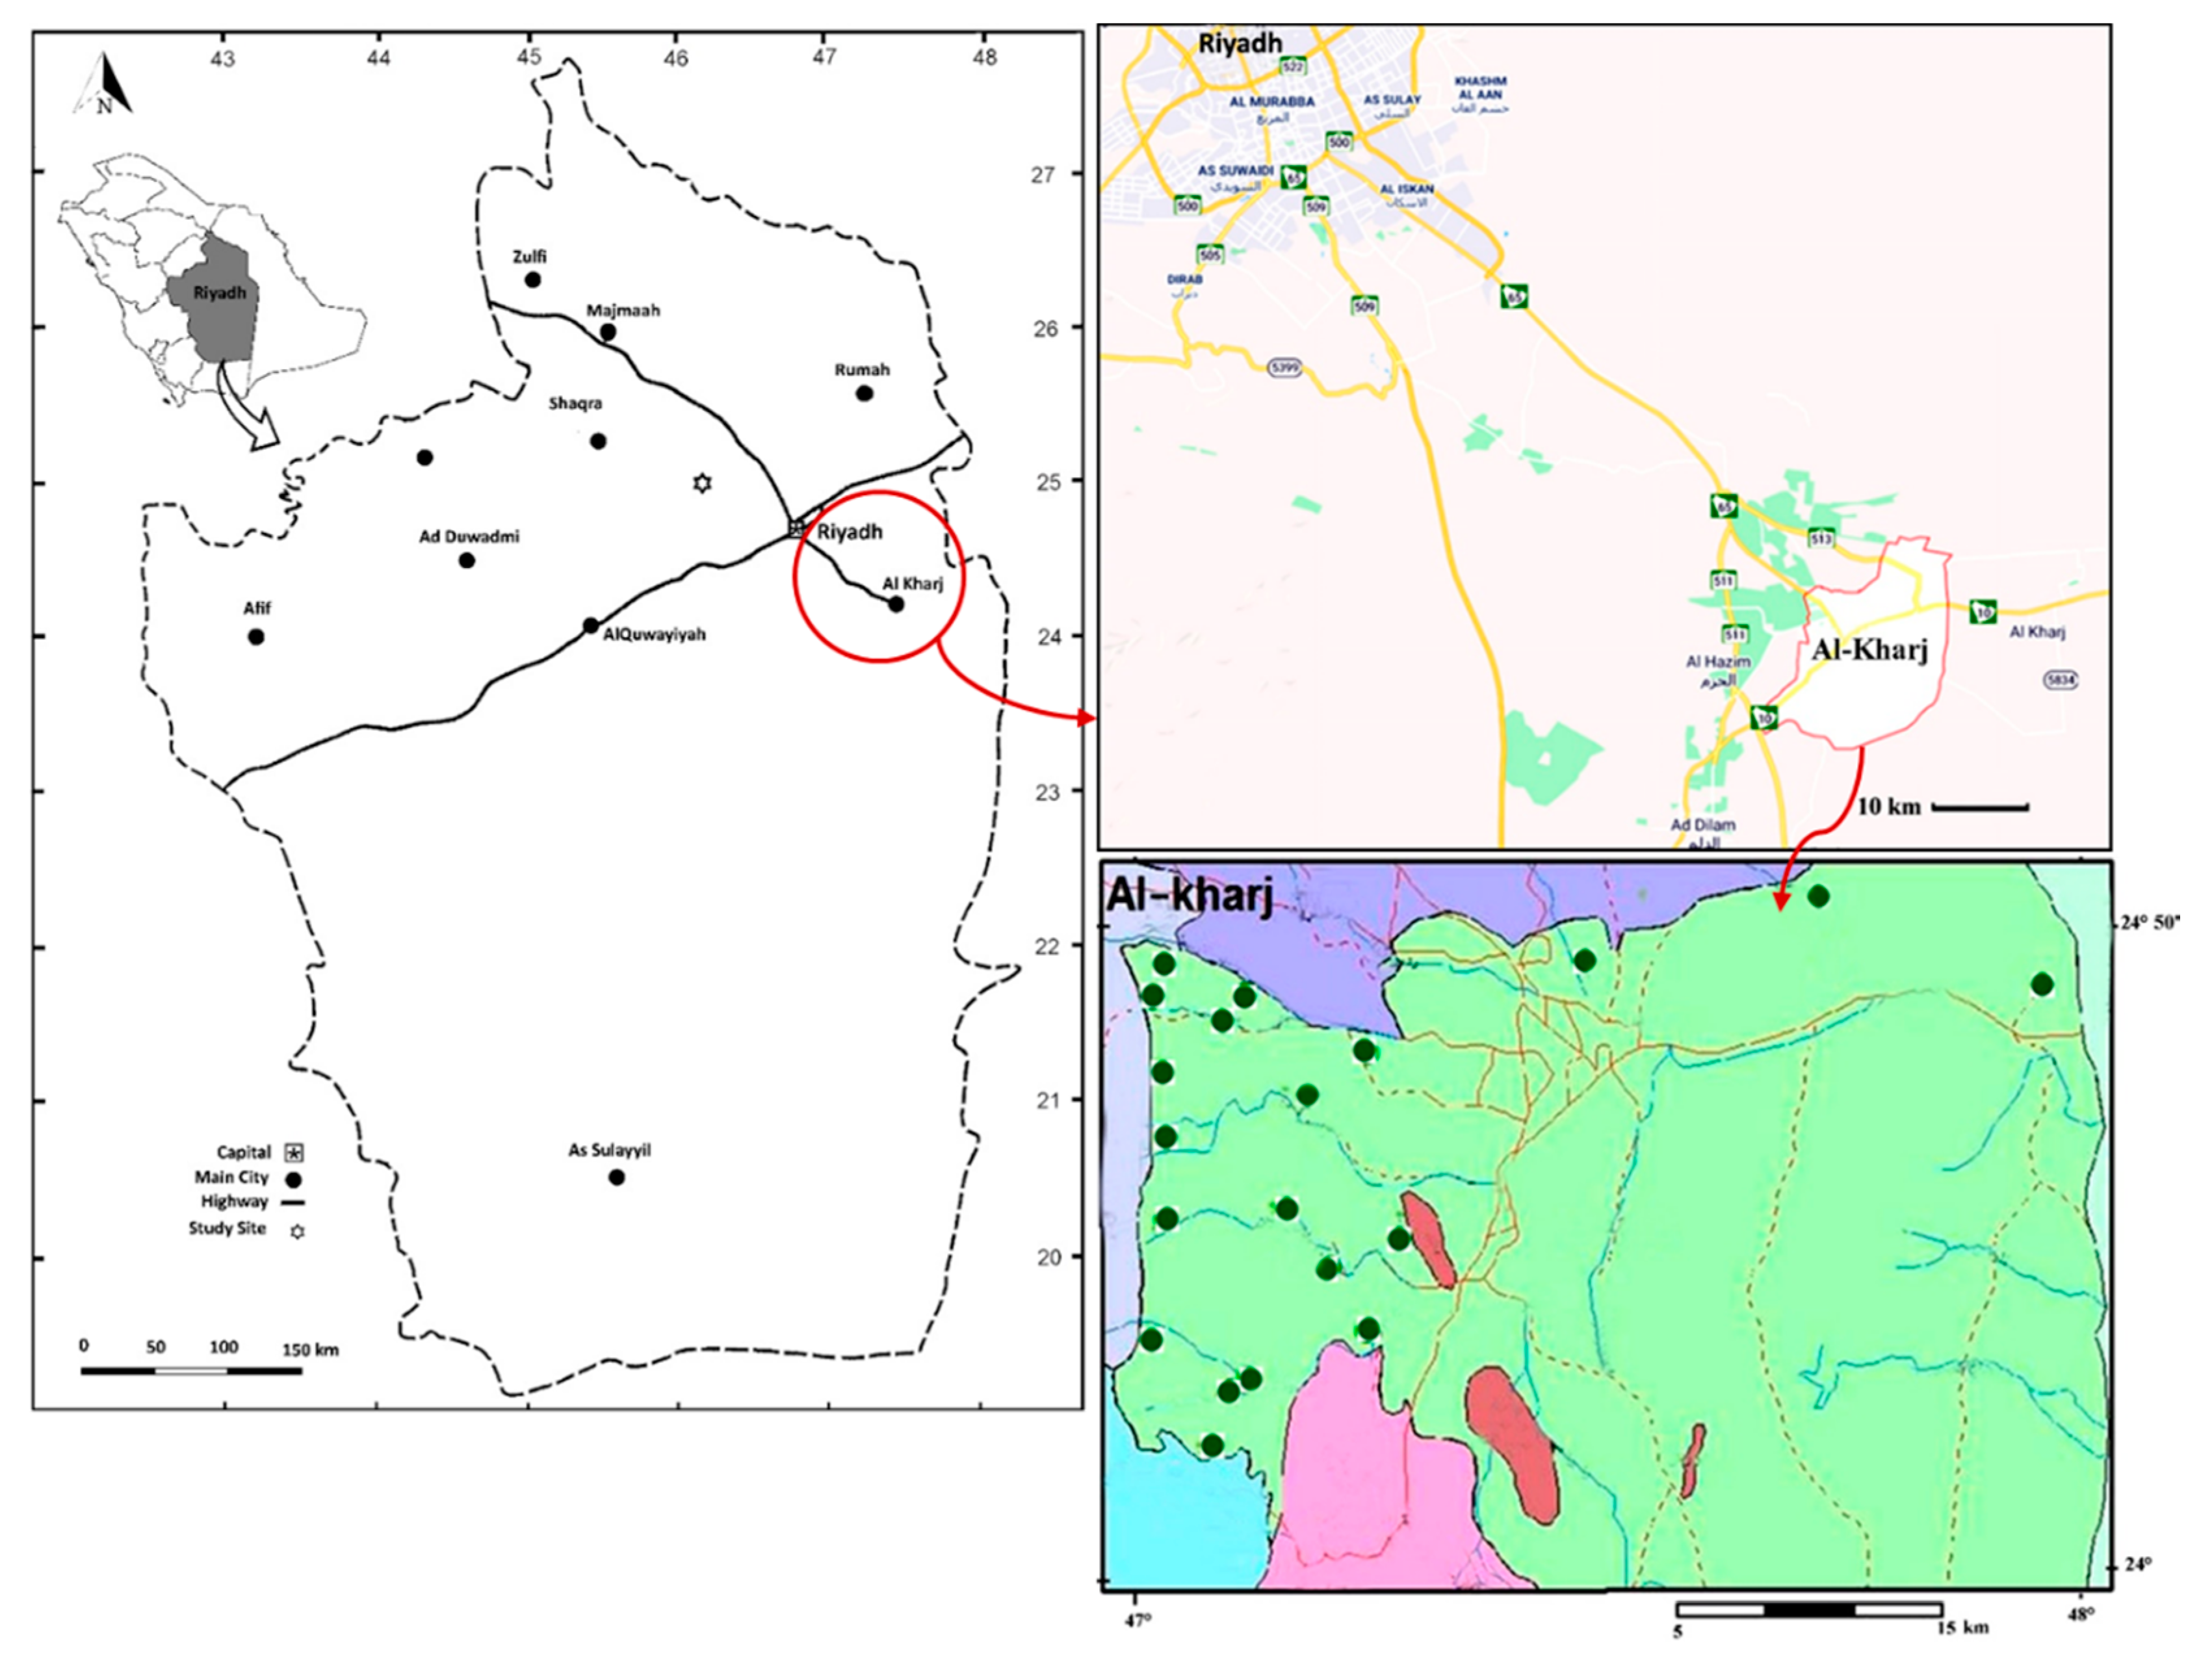
Figure 1. Map of Saudi Arabia showing the study area (Al-Kharj). The studied sites are shown with green circles (●).
Agriculture 10 00550 g001
Figure 2. Distribution of four identified plant communities in the study area derived by DCA.
Agriculture 10 00550 g002
Figure 3. Size structure of Traganum nudatum. (a) Linear regression between diameter and height, (b) height/diameter ratio, (c) size index, and (d) relative frequency.
Agriculture 10 00550 g003
Figure 4. Size structure of Seidlitzia rosmarinus (left side) and Prosopis farcta (right side). (a) linear regression between diameter and height, (b) height/diameter ratio, (c) size index, and (d) relative frequency.
Agriculture 10 00550 g004
Figure 5. Size structure of Zygophyllum hamiense (left side) and Calligonum comosum (right side). (a) linear regression between diameter and height, (b) height/diameter ratio, (c) size index, and (d) relative frequency.
Agriculture 10 00550 g005
Table 1. Cover and density (mean ± SD) of the common perennial plants recorded in the study area.
Plant SpeciesFamilyDensity
(Indiv./25 m2)
Cover
(%)
Alhagi graecorumPapilionaceae2.22 ± 0.864.44 ± 2.18
Calligonum comosumPolygonaceae11.64 ± 5.6428.53 ± 18.5
Convolvulus cephalopodsConvolvulaceae1.14 ± 0.731.53 ± 0.53
Ephedra alataEphederaceae1.58 ± 0.642.12 ± 0.65
Halothamnus lancifoliusChenopodiaceae4.54 ± 1.7311.45 ± 3.21
Leptadenia pyrotechnicaAsclepiadaceae2.73 ± 1.044.21 ± 1.34
Prosopis farctaMimosaceae28.34 ± 10.2335.84 ± 12.3
Pulicaria undulataAsteraceae7.65 ± 2.319.68 ± 5.72
Seidlitzia rosmarinusChenopodiaceae9.54 ± 3.4355.38 ± 23.2
Traganum nudatumChenopodiaceae12.73 ± 7.5448.75 ± 13.3
Zygophyllum hamienseZygophyllaceae18.57 ± 6.7840.52 ± 9.87
Table 2. Soil characteristics (mean ± SD) of the four communities identified by the DCA. VG-I, Seidlitzia rosmarinus—Zygophyllum hamiense; VG-II, Seidlitzia rosmarinus—Traganum nudatum; VG-III, Traganum nudatum—Prosopis farcta; and VG-IV, Calligonum comosum—Pulicaria undulata.
Soil FactorsPlant CommunitiesF-Value
VG-IVG-IIVG-IIIVG-IV
Sand (%)80.12 ± 1.4185.12 ± 8.4989.12 ± 2.8390.12 ± 4.2412.6 **
Silt (%)9.00 ± 1.416.00 ± 5.663.00 ± 1.414.05 ± 2.765.78 **
Clay (%)10.64 ± 0.348.55 ± 2.627.75 ± 1.485.89 ± 1.403.43 *
CaCO3 (%)17.83 ± 1.4115.67 ± 3.1816.50 ± 2.3614.24 ± 4.532.52 *
Organic matter (%)0.45 ± 0.110.34 ± 0.260.48 ± 0.470.16 ± 0.0213.21 *
pH8.64 ± 0.378.32 ± 0.837.52 ± 0.307.85 ± 0.112.09 *
EC (dSm−1)6.36 ± 1.272.91 ± 1.612.52 ± 1.062.45 ± 0.4013.23 **
Nitrogen (mg/kg)4.20 ± 1.196.44 ± 1.9811.20 ± 4.759.61 ± 0.136.32 **
Phosphorus (mg/kg)10.80 ± 0.719.14 ± 3.066.90 ± 0.117.24 ± 0.629.18 *
Cations (meq/L)
Ca2+15.15 ± 2.999.25 ± 0.356.50 ± 3.5416.80 ± 3.3618.12 **
Mg2+7.28 ± 4.993.63 ± 0.183.65 ± 0.211.84 ± 0.2312.34 **
Na+46.40 ± 2.4218.04 ± 8.694.20 ± 0.884.45 ± 2.7116.54 **
K+5.16 ± 3.941.96 ± 0.591.94 ± 0.561.53 ± 0.079.76 *
Anions(meq/L)
HCO312.50 ± 3.899.73 ± 7.815.03 ± 1.173.60 ± 0.217.54 **
Cl9.88 ± 3.543.90 ± 1.913.40 ± 1.202.88 ± 0.8810.21 **
SO42−37.80 ± 3.8313.88 ± 3.0117.90 ± 3.6017.13 ± 4.2414.31 **
*: significant at p ≤ 0.05, **: significant at p ≤ 0.01.
Table 3. Spearman rank correlation coefficient between the identified plant communities’ characteristics and soil variables. Bold values indicate significant differences at p < 0.05.
VariableDensityCoverRichness
Cover−0.6260.00−0.394
Density0.00−0.6260.534
Sand0.482−0.3220.473
Silt−0.2430.342−0.032
Clay−0.2680.253−0.432
CaCO3−0.465−0.238−0.282
Organic matter0.534−0.3210.473
pH−0.4850.427−0.315
EC−0.5870.461−0.482
Nitrogen0.1630.2530.334
Phosphorus0.134−0.2820.134
Ca2+−0.5320.474−0.458
Mg2+−0.4520.473−0.323
Na+−0.5710.562−0.532
K+−0.3850.421−0.243
HCO3−0.3510.434−0.254
Cl−0.6470.546−0.446
SO42−−0.3550.454−0.312
Table 4. Size structure characteristics of the dominant perennial plants in abandoned fields.
Species Diameter (cm)Height (cm)Height/DiameterSize Index (cm)Volume
(m3)
Seidlitzia rosmarinusMean181.7376.130.46128.932.79
Min.53.5038.000.2351.250.12
Max.355.50144.001.07245.2513.41
±SD75.1825.670.1648.333.16
Zygophyllum hamienseMean95.6243.110.4969.370.48
Min.21.5018.000.2619.750.01
Max.251.0085.000.90159.003.32
±SD45.5315.810.1529.290.66
Traganum nudatumMean140.9383.130.63112.031.66
Min.60.0048.000.3358.500.16
Max.295.00149.001.11205.007.86
±SD51.3225.140.1934.871.66
Prosopis farctaMean58.9829.480.5344.230.09
Min.26.5014.000.2422.250.01
Max.96.0045.000.9064.500.24
±SD16.537.750.1610.200.05
Calligonum comosumMean145.91106.880.82126.404.06
Min.66.5068.000.1076.001.04
Max.575.00225.001.33395.0055.85
±SD102.0041.540.2369.1610.26
Publisher’s Note: MDPI stays neutral with regard to jurisdictional claims in published maps and institutional affiliations.