Article

Genotype and Sowing Time Effects on Soybean Yield and Quality

1
Institute for Animal Husbandry, Autoput 16, 11080 Belgrade-Zemun, Serbia
2
Agrounik d.o.o., Milana Uzelca 11, 11080 Belgrade-Zemun, Serbia
3
Biounik d.o.o., Milana Uzelca 11, 11080 Belgrade-Zemun, Serbia
4
Maize Research Institute “Zemun Polje”, Slobodana Bajića 1, 11185 Belgrade-Zemun, Serbia
*
Author to whom correspondence should be addressed.
Agriculture 2020, 10(11), 502; https://doi.org/10.3390/agriculture10110502
Submission received: 22 September 2020 / Revised: 20 October 2020 / Accepted: 23 October 2020 / Published: 27 October 2020
(This article belongs to the Section Crop Production)

Abstract

:
The successful production of soybeans is largely dependent on the sowing time, because every sowing outside the optimal time contributes significantly to yield losses. This field study aimed to evaluate the effects of sowing time (optimal—April 5; late—April 27) on the quantitative and quality traits of three soybean genotypes (Galina—0 maturity group; Sava—I maturity group; and Rubin—II maturity group) under dryland conditions in Vojvodina Province (Serbia) during 2017 and 2018. The genotype Sava had higher yield in climatic-unfavorable 2017, while Rubin had a higher yield in climatic-favorable 2018. The yields significantly decreased when the soybeans were sown in late April due to reductions in the number of pods per plant, seed weight per plant, and 1000-seed weight. The reduction in yield components was likely due to the accelerated senescence of plants and the negative effect of high temperature and low precipitation during the seed filling stage. Accordingly, the various sowing times and properly chosen genotypes provide a better utilization of soil and water resources. A proper genotype selection and sowing time can contribute to a high yield. At the same time, the protein and oil contents can be altered by the sowing time, especially under water stress during the reproductive stage.

1. Introduction

Soybean (Glycine max [L.] Merr.) is a multipurpose crop suitable for human and animal nutrition and industry processing due to its high protein content, with a balance of essential amino acids, oil, and soluble sugar contents in the seeds [1]. It can maintain the fertility of soil [2] and it is the most widely planted legume. Across the world, in 2018 soybean was planted on about 125 million ha, with a production of 348.7 million tones and an average yield of 2.8 t ha−1 [3]. In Serbia, in the same year the soybean occupied 7.6% of the arable land (about 200.000 ha) with an average yield of 3.3 t ha−1 [3]. The potential yield of Serbian domestic genotypes is about 6 t ha−1. However, unfavorable climatic conditions during plant growth and development are one of the leading causes of soybean yield loss [4]. That is the reason why is it necessary to choose the best soybean genotypes adapted to the local and regional conditions [5]. Additionally, the exploitation of the genetic potential of soybeans depends on applying agricultural practices and technologies, where the proper sowing time plays an essential role in soybean production and does not make it more expensive. Sowing time affects the phenological phase of the plant due to the variation in the environmental factors (precipitation, temperature, relative humidity, the moisture of soil, and photoperiod) and thus influences the growth, development, and production of soybean [6]. In Serbia, the soybean is sown at the beginning of April and harvested in September. Thus, the flowering (R1–R2), pod development (R3–R4), seed development (R5–R6), and plant maturity (R7–R8) stages of soybean coincide most often with higher summer temperatures and low precipitation amounts during July and August [4]. These unfavorable climatic conditions at the soybean reproductive stage can reduce the seed yield by even 74% compared to unstressed conditions [7]. Essentially, late sowing is thought to decrease soybean seed yield because of summer drought stress, which occurs during reproductive development and reduces yield components [8,9,10]. According to Kawasaki et al. [11], late sowing is justified only if irrigation is applied and the sowing density is increased. Additionally, the physiological and sanitary quality of soybean seeds decline with delaying the sowing time [12,13]. Likewise, the chemical traits of soybean seeds change with a sowing time delay. The seed protein content significantly decreases, while the oil content increases with the delayed sowing [13,14]. However, several studies have suggested that late planting may increase the protein content of soybean seeds [15] because high temperatures tend to increase the protein content with little or no effect on the oil content [16].
The aims of this study were to determine the effects of sowing time in two consecutive years on the morphological, productive, and quality traits of three soybean genotypes belonging to different maturity groups. We hypothesized that a delayed sowing time causes the yield to decrease due to the accelerated senescence of plants and the negative effect of high temperature and low precipitation during the seed filling stage, especially in unfavorable weather conditions. Appropriate agronomic management, including the best choice of genotypes and an optimum sowing time, could substantially improve crop performance in regions with different climatic conditions.

2. Materials and Methods

2.1. Details of the Field Trial

The field experiments were carried out under dryland conditions at an experimental station in northwestern Serbia at Stara Pazova, Vojvodina Province, Serbia (latitude: 44°98′ N; longitude: 20°16′ E; elevation: 82 m) during 2017 and 2018. Three genotypes of soybeans belonging to three different maturity groups were tested: Galina (0 maturity group), Sava (I maturity group), and Rubin (II maturity group). The tested genotypes have an indeterminate plant growth with habit erect. The tested genotypes are highly adaptive to a wide range of climate and soil conditions. In Serbia, they are very widespread in production. Two sowing times were examined: an optimum (5 April) and late sowing time (27 April). Before sowing, the seed was treated with the inoculant Rizol (200 ml 100 kg–1 of seeds, Agrounik doo, Belgrade-Zemun, Serbia), which contains Bradyrhizobium japonicum (min 107 CFU mL–1) and Azotobacter spp. (min 108 CFU mL–1). The maize ((Zea mays L.) hybrid NS 6010) was a preceding crop. The soybean genotypes were planted in 4 rows that were 5 m long, with a distance between rows of 0.5 m. Two additional rows on both sides of the elemental plot were included as a protection and to provide the optimal conditions for plant growth. A total of 500,000 plants ha−1, 450,000 plants ha−1, and 400,000 plants ha−1 were sown for Galina, Sava, and Rubin, respectively. Weeds were controlled with the herbicide Corum (1.8 L ha−1, active substance: 480 g L−1 bentazone and 22.4 g L−1 imazamox; BASF, Ludwigshafen, Germany) with the addition of Dash adjuvant (1 L ha−1, BASF, Ludwigshafen, Germany) applied between the first and third trifoliate leaf stages. The herbicide was applied as a split with an interval of 10 days. The harvest was carried out in the beginning of September each year, at the full maturity stage (R8) when the 95% of the pods turned a mature pod color and when the seed had a low moisture content (≤15%).

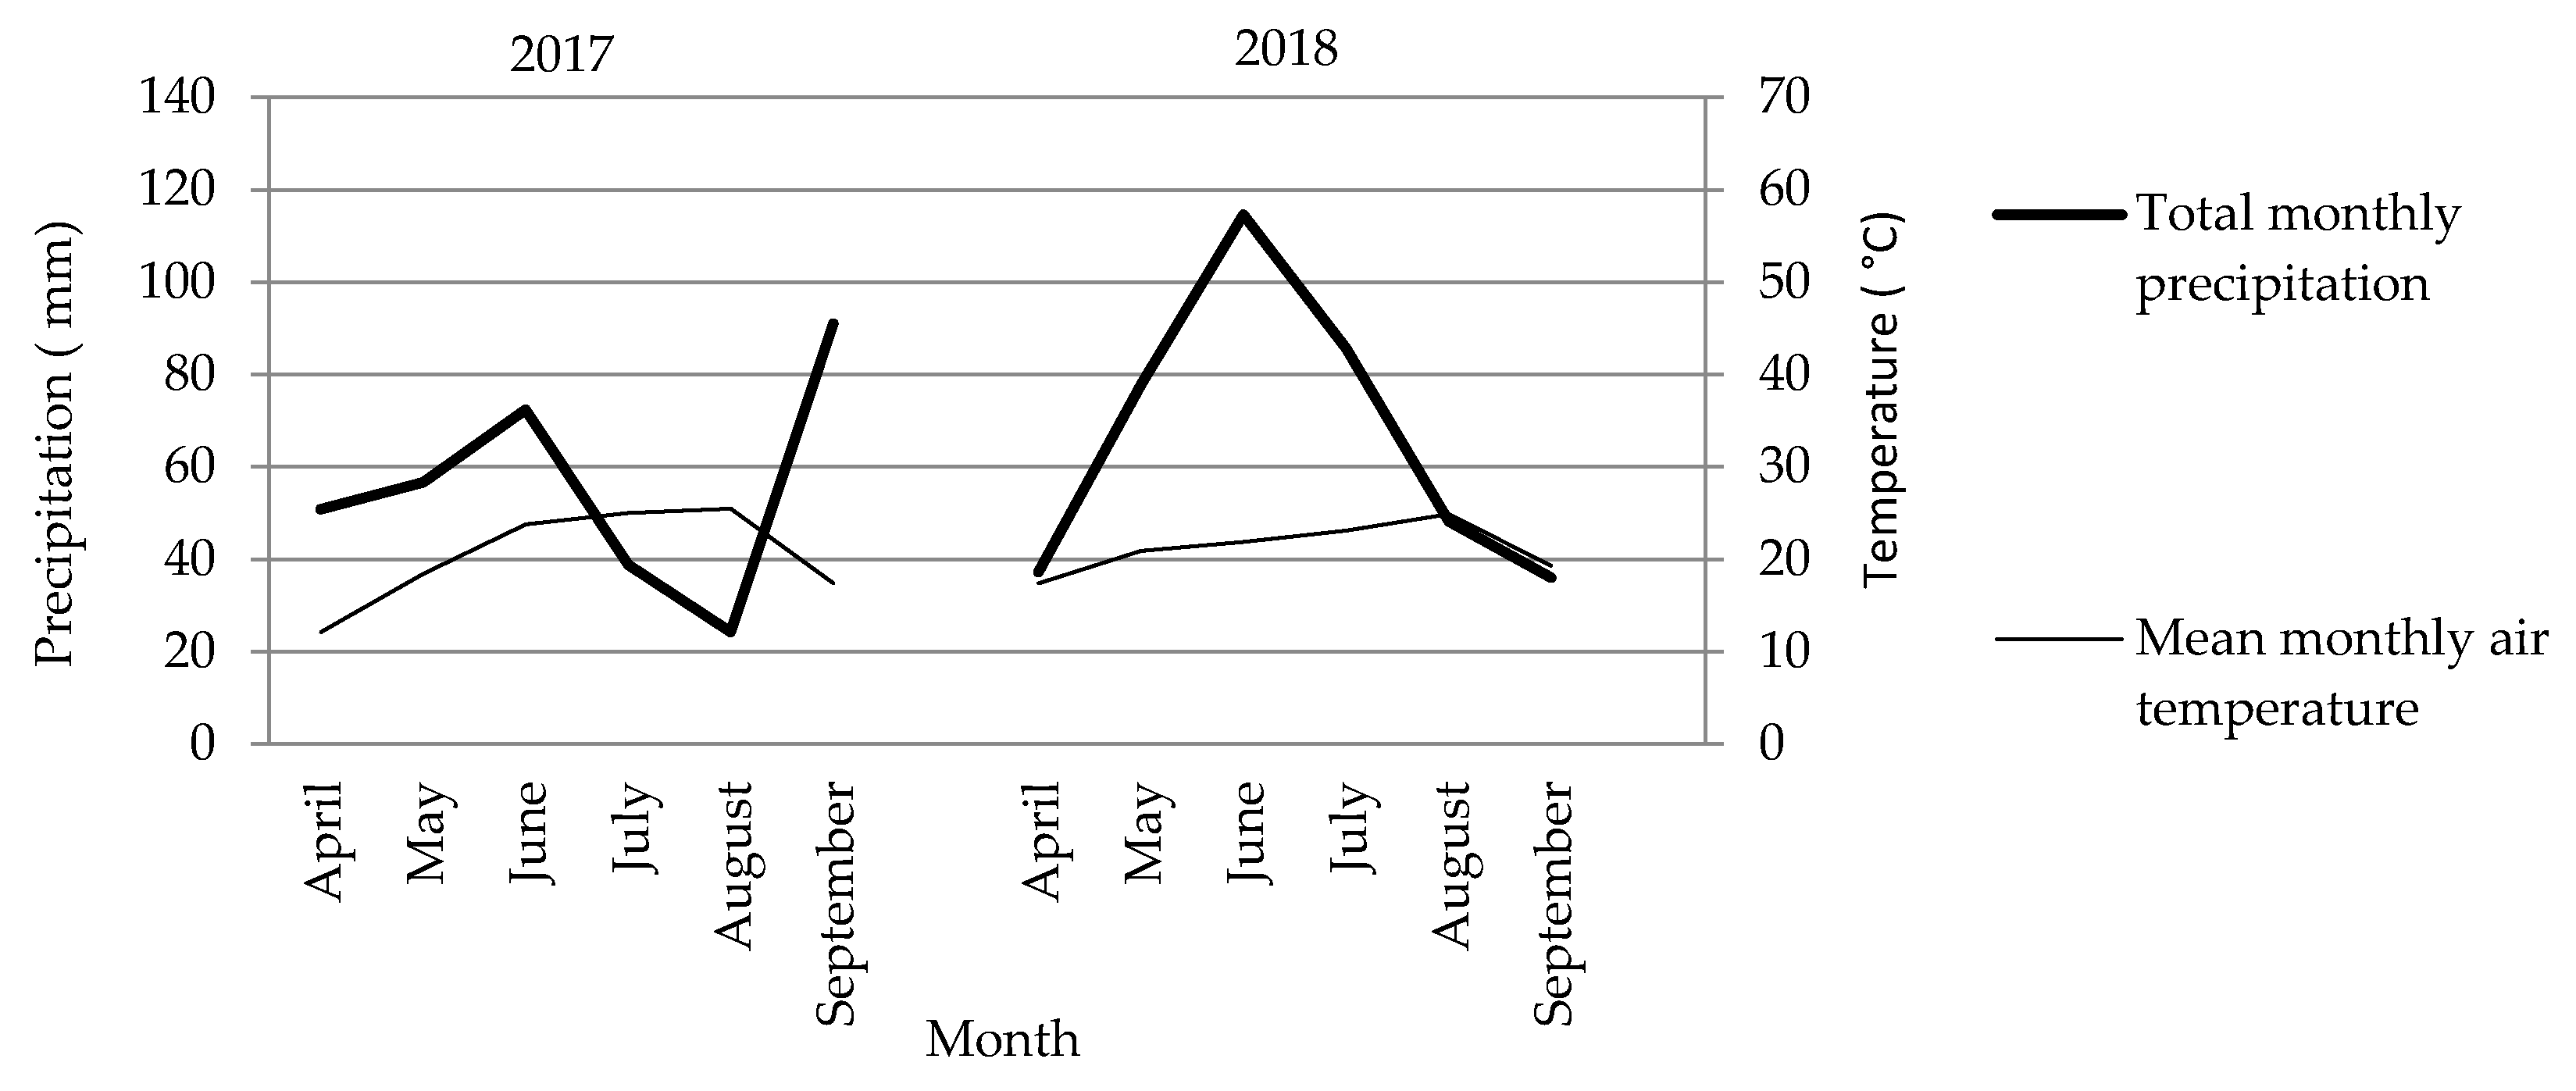
2.2. Soil Properties and Meteorological Conditions

Field trials in 2017 and 2018 were conducted on a chernozem soil with the following parameters at the 0–30 cm depth: pH in KCl = 6.5 and 6.5, CaCO3 = 7.1, and 6.9%; organic matter = 4.02% and 3.88%; total N = 0.20 and 0.19%; P = 10.13 and 7.55 mg 100 g−1 soil; and K = 21.5 and 22.0 mg 100 g−1 soil, respectively.
Soil pH was determined in a suspension of soil with a 1.0 M KCl solution using a potentiometer with a glass electrode. The Scheibler calcimeter method was used for the determination of CaCO3. Kotzmann’s method was used for the determination of the organic matter content. Kjeldahl’s method was used for the determination of the total N. The Al–method, according to Egner–Riehm, was used for the determination of the phosphorus and potassium content.
Precipitation and temperature are important factors limiting the growth, development, and yield of soybean. A climate diagram by Walter and Lieth [17] across study periods showed that, in 2017, dry periods were present in July and August, while in 2018 they were present in September—i.e., at harvest time (Figure 1). The vegetation period of 2018 saw more precipitation (65.5 mm) and a lower mean temperature (0.9 °C) than 2017, with 399.5 mm and 21.2 °C, respectively.

2.3. Data Collection

The soybeans were harvested in September at the full maturity stage. The seed yield (SY, kg ha−1) was determined for each plot and converted into kg per hectare at the standard 13% moisture content. Morphological traits (plant height (PH, cm), first pod height (FPH, cm), number of nodes per plant (NN), number of pods per plant (NP), seed weight per plant (SW, g), and 1000-seed weight (TSW, g)) were recorded from ten plants in the central part of each subplot. The quality traits of seeds, including the oil content (OC, %), was determined using the Soxhlet extraction method, while the protein content (PC, %) was determined with the Kjeldahl method.

2.4. Statistical Data Analysis

The experiment included three factors, two years, genotypes at three levels, sowing time at two levels, and four replicates arranged by a completely randomized block system design. An analysis of variance (ANOVA) was used for the analysis of the data using the STATISTICA software version 10.0 (StatSoft, Tulsa, OK, USA). The p < 0.05 and p < 0.01 significance levels were used. Tukey’s test at p < 0.05 detected the difference between the parameter means. Pearson’s correlation coefficients were used for the relationship between the obtained traits.

3. Results

3.1. Analyses of Variance for Effects of Year, Genotype, and Sowing Time, and their Interactions on Quantitative and Quality Soybean Traits

According to the analyses of variance, the effect of year had a significant effect on the morphological and productive traits (Table 1). The genotypes significantly differed in all traits except NN and TSW. The sowing time affected all traits except OC. Due to the large impact of weather factors, the results are presented for each year.
Significant differences between genotypes were established for the studied traits, except for quality traits in 2018 (Table 2 and Table 3). Averaged across sowing times, in 2017 the genotype Sava had the highest values of all traits, except for OC. However, no differences were found between the genotypes Sava and Galina for the NN, NP, TSW, and SY. In 2018, genotype had a significant effect on the PH, NN, NP, SWP, TSW, and SY. The genotype Rubin had the highest values of studied traits, except for TSW, PC, and OC. The genotypes Galina and Rubin did not present significant differences in the NN, SWP, and TSW. Averaged across genotypes, the sowing time expressed a significant effect on all the measured traits, except for PC and OC in 2018. In both years, the highest values of traits were recorded for the standard sowing time (early April).

3.2. Interaction of Factors Affected Quantitative and Quality Traits

The PC was not significantly affected by the interaction of year x sowing time (Table 1). The PH, NN, and OC were not significantly affected by the interaction of year and sowing time. The FPH, TSW, and PC were not significantly affected by the interaction of the genotype and sowing time. In essence, most of the traits, including SY, at different genotypes reacted differently to changes in sowing time in different years (year × genotype × sowing time). Only the NN and NP were not significantly affected by this interaction. The standard sowing time produced a greater value of traits, except for OC, compared to the late sowing time for genotypes.
The interaction of genotype and sowing time significantly affected all the traits in 2017 (Table 2). The FPH and PC in 2018 were not significantly affected by the interaction of genotype and sowing time (Table 3). The standard sowing time in both years produced a greater value of all traits, except for OC, compared to the late sowing time for genotypes. In 2017, the highest PH, NN, SWP, and SY were obtained from the genotype Sava at the first sowing time. The genotypes Sava and Rubin had the highest and similar values for FPH and PC in the first sowing time. The lowest NP was found from the genotype Sava in the second sowing time. The highest OC was achieved from genotype Galina in the second sowing time. In 2018, the highest PH, NP, and OC were obtained from genotype Rubin in the first sowing time. The highest NN and SY were recorded from the genotypes Galina and Rubin in the first sowing time. All three genotypes had the highest values of SW and TSW at the first sowing time, with respect to Rubin, which had the highest values of both traits in 2018.
In general for both years, the late sowing time showed a significantly lower value of all the investigated traits, however not all the genotypes showed a significant decrease at the late sowing date. Thus, in 2017 the NP for all genotypes and PC in Galina were not significantly changed. In 2018, the OC for all genotypes, NP, and TSW in Galina were not significantly changed.

3.3. Pearson’s Correlation Coefficient (r) among Studied Traits

Estimates of the phenotypic correlations among the investigated traits are shown in Table 4. The seed yield positively and significantly correlated with the plant height, first pod height, number of nodes per plant, number of nodes per plant, number of pods per plant, seed weight per plant, and 1000-seed weight. In essence, these are the yield component traits that are important in determining the seed yield. Additionally, the yield component traits had significant positive correlations with each other.

4. Discussion

4.1. Year and Genotype Affected Quantitative and Quality Traits

The high SY depended on the selection of genotypes, their adaptability to environmental conditions, and the applied cropping practices. The years affected all indicators except PC and OC. Higher values of quantitative traits were recorded in the second year under favorable meteorological conditions for soybean growth and development. According to Table 2 and Table 3, this study showed that all the genotypes were significantly different for all traits except for PC and OC in 2018. However, according to Table 1 the genotypes did not differ significantly for TSW and NN. Therefore, the fact cannot be ignored that the influence of the year reduces the reliability of the influence of the genotype and sowing time, which is partly due to the two years of observations. This indicates that the tested genotypes have significant differences in performance for the assessed traits. The genotype Sava—I maturity group—was more productive under low precipitation conditions in 2017. However, the genotype Galina did not differ in SY from Rubin and Sava. On the contrary, the genotype Rubin (II maturity group) was more productive under high precipitation conditions in 2018. Additionally, Rehman et al. [18] reported that the PH, NP, number of seeds per plant, and SY were affected significantly by the genotype. As we have already pointed out, the weather conditions differed during the investigated years. In 2017, the dry periods (higher temperatures accompanied with lower precipitation amounts) were in the summer (July and August), which has the most significant impact on the seed yield. In July, the soybeans were in the flowering stage (R1 to R2) and pod formation (R3 to R4), while in August there were the seed-filling stages (R5 to R6). The present dry periods in July and August cause the abortion of flowers and young pods, thus the NP was smaller than in 2018. Dry stress during August shortens the seed-filling duration and accelerates the maturity of plants, which is why the weights and sizes of the seeds were small [4]. Kron et al. [19] pointed out that the soybeans have a long flowering period and can compensate for short periods of dry stress to the R5 stage. However, the long hot and dry stress in the R4 stage (full pod stage when the pod growth is rapid and seed development begins) drastically reduced the yield. The NP, SWP, and TSW are essential components of yield. These yield components are strongly conditioned by each other, and the maximum yields are achieved when they are optimally balanced, because a change in one component is only to a certain extent compensated by changes in another. The dry stress during summer months in 2017 caused yield loss due to a decrease in the yield component traits, similarly to Mandić et al. [20]. Therefore, the recommendation for soybean growers is to sow at the beginning of April, so that the plants can make the most of the available precipitation. The dry stress during September 2018 did not affect the yields. Accordingly, the breeding of soybean should aim to create genotypes with a deeper rooting system for better drought stress tolerance [21]. Additionally, cold–tolerant genotypes that can be sown early in order to avoid the risks of drought in July and August should be created [22].

4.2. Sowing Time Affected Quantitative and Quality Traits

In Serbian agro–climatic conditions under dry farming, the general recommendation is to sow soybeans in April. Our results have proved that soybeans should be sown in early April, regardless of their maturity group. Early-maturing genotypes can be sown later on in April or even in May, but this is not recommended. Thus, avoiding drought stress during the critical period of development and ensuring a stable and safe yield is crucial to achieving a high yield. In addition, late sowing shortens the vegetation period of soybean plants from sowing to flowering and to maturity (R1–R8), which reduces the PH, NN, leaf area, and components of seed yield (NP, SWP, and TSW) [23,24] and SY [10,25]. Late sowing contributes to a significant reduction in the 1000-seed weight, especially in conditions of high temperatures during the seed-filling period, such as in 2017.
On the other hand, sowing in early April stimulates the early initiation of the R5 stage and lengthens the duration of the R5–R6 period, contributing to an increase in SY [25,26]. The genotypes that were sown in the early sowing time accumulated more photo-assimilates because they had a more extended growth period. The PH and FPH were higher in the first sowing time probably due the more extended growth period with optimal environmental conditions, especially during the second year of the study. A low FPH makes mechanical harvesting difficult and can cause significant yield loss [27]. Similar to our research, Rehman et al. [18] reported that the NP, number of seeds per plant, SWP, and SY of two soybean genotypes from early sowing were significantly higher than those from late sowing. In general, a delayed sowing time in soybean drastically decreases the yield due to the reduction in vegetative and reproductive growth. Our results showed that a late sowing time resulted in a lower PC of seeds in the year with unfavorable weather conditions. A similar result was established by Lima et al. [28]. In essence, the PC in soybean is caused by genetic factors and environmental factors during the grain-filling stage [29]. Benzain and Lane [30] defined that the protein content is four times more dependent on environmental conditions than on the genotype. Thus, the sowing time influenced the quality of soybean seeds during unfavorable weather conditions in 2017.

4.3. Interaction of Genotype and Sowing Time and Correlation between the Studied Traits

The interaction of genotype with sowing time induced significant variation in all the traits, except for the FPH and PC in 2018. According to Table 1, there is also no genotype × sowing time interaction for TSW. These significant interactions of genotype with sowing time indicated the inconsistent yield traits of genotypes across the sowing time. Accordingly, the interaction found for the yield components and SY suggests the existence of genetic variability for traits related to specific adaptation to sowing time. The genotype × sowing time interaction indicated that soybeans sown in early April in both years gave the highest SY. In 2017, the Sava gave the highest seed yield, while in 2018 it was Rubin. The increase in the yield and the components of yield (NN, NP, SWP, and TSW) at the early sowing time may be due to the prevailing favorable temperature and weather conditions and day length, leading to the greater expression of these traits, similarly to Setiyono et al. [31]. Additionally, Hu and Wiatrak [32] reported that the changes in photoperiod (shorter day length) with a delayed sowing time and unfavorable climatic conditions shorten the duration of the vegetative and reproductive stages of soybean genotypes, contributing to reduced values of yield component traits and yield loss. The significant genotype x sowing time interaction allowed improving the quantitative traits by the application of sowing time, which could facilitate soybean crops to achieve higher values of traits even in drought conditions.
SY is a complex trait. Our results showed that the SY depends on the NP, SWP, and TSW, similarly to earlier research by Ohyama et al. [33]. Additionally, Carvalho et al. [34] concluded that the NP, number of seeds per pod, and TSW were strongly associated with soybean SY. A negative correlation between PC and OC was observed, which indicates that it is challenging to obtain soybean genotypes with a high PC and OC, as has been reported by Carrera et al. [35]. The selection based on PC and OC complicates the breeding and management efforts for soybeans.

5. Conclusions

Genotype selection and sowing time are important management strategies to improve soybean yields and economic benefits. This study suggests that a proper genotype selection and sowing time in early April could contribute to a high yield. The delay of the sowing time significantly decreased the PH, NN, NP, SWP, and TSW and led to SY loss. The lower SY can be explanted by a shorter vegetation period and/or unfavorable climatic conditions (high temperatures and low precipitation) during the reproductive stage in July and August. Under drought stress, the genotype Sava had the maximum yield. On the contrary, under favorable climatic conditions the genotype Rubin had the highest yield. Positive correlations existed between the seed yield and its components. These results suggest that the early April sowing time was optimal for achieving a greater SY for all genotypes by extending the duration of the development stages and drought stress during the seed-filling stage.

Author Contributions

Conceptualization, V.M.; methodology, V.M. and S.Đ.; investigation, V.M., N.Đ., Z.B., V.K., M.P., and M.B.; writing–original draft, V.M. and N.Đ.; writing—review and editing, S.Đ. All authors have read and agreed to the published version of the manuscript.

Funding

The research was supported by the Ministry of Education, Science, and Technological Development of the Republic of Serbia, No. 451-03-68/2020-14 and Agrounik doo, Belgrade-Zemun, Serbia.

Acknowledgments

The authors would like to thank Vesna Dragičević, Principal Research Fellow of the Maize Research Institute “Zemun Polje”, Belgrade-Zemun, Serbia, for valuable comments and for proofreading the manuscript.

Conflicts of Interest

The authors declare no conflict of interest.

References

  1. Sudarić, A.; Kočar, M.M.; Duvnjak, T.; Zdunić, Z.; Kulundžić, A.M. Improving seed quality of soybean suitable for growing in Europe. In Soybean for Human Consumption and Animal Feed; 2019; Available online: https://www.intechopen.com/online-first/improving-seed-quality-of-soybean-suitable-for-growing-in-europe (accessed on 15 July 2020).
  2. Ngalamu, T.; Ashraf, M.; Meseka, S. Soybean (Glycine max L.) genotype and environment interaction effect on yield and other related traits. Am. J. Exp. Agric. 2013, 3, 977–987. [Google Scholar] [CrossRef]
  3. FAO (Food and Agriculture Organization of the United Nations). 2020. Available online: http://www.fao.org/faostat/en/#data (accessed on 15 July 2020).
  4. Mandić, V.; Bijelić, Z.; Krnjaja, V.; Simić, A.; Ružić-Muslić, D.; Dragičević, V.; Petričević, V. The rainfall use efficiency and soybean grain yield under rainfed conditions in Vojvodina. Biotechnol. Anim. Husb. 2017, 33, 475–486. [Google Scholar] [CrossRef]
  5. Vidić, M.; Hrustić, M.; Miladinović, J.; Đukić, V.; Đorđević, V.; Popović, V. Latest NS varieties of soybean. Field Veg. Crop. Res. 2010, 47, 347–355. [Google Scholar]
  6. Marcos Filho, J. Produção de Sementes de Soja; Fundação Cargill: Campinas, Brazil, 1986; p. 86. [Google Scholar]
  7. Jumrani, K.; Bhatia, V.S. Impact of combined stress of high temperature and water deficit on growth and seed yield of soybean. Physiol. Mol. Biol. Plants 2018, 24, 37–50. [Google Scholar] [CrossRef] [PubMed]
  8. Egli, D.B.; Cornelius, P.L. A regional analysis of the response of soybean yield to planting date. Agron. J. 2009, 101, 330–335. [Google Scholar] [CrossRef]
  9. Purcell, L.C.; Salmeron, M.; Ashlock, L. Growth and Development; Chapter 2; Arkansas soybean handbook; Ark. Coop. Ext. Ser.: Little Rock, AR, USA, 2013; pp. 1–8. [Google Scholar]
  10. Kumagai, E.; Takahashi, T. Soybean (Glycine max (L.) Merr.) Yield reduction due to late sowing as a function of radiation interception and use in a cool region of Northern Japan. Agronomy 2020, 10, 66. [Google Scholar] [CrossRef] [Green Version]
  11. Kawasaki, Y.; Yamazaki, R.; Katayama, K. Effects of late sowing on soybean yields and yield components in southwestern Japan. Plant Prod. Sci. 2018, 21, 339–348. [Google Scholar] [CrossRef] [Green Version]
  12. Avilla, M.; Braccini, A.; Motta, I.; Scapini, C.; Braccini, L. Sowing season and quality of soybean seeds. Sci. Agricola 2003, 60, 1–13. [Google Scholar]
  13. Soliman, M.M.; Rabie, E.M.; Ragheb, S.B. Response of soybean yield to late sowing date. J. Agric. Sci. 2007, 15, 51–59. [Google Scholar] [CrossRef]
  14. EL-Harty, E.H.; Rizk, A.M.A.; Gendy, E.K.; Abd El-Aal, H.T. Performance of soybean genotypes under four sowing dates at middle Egypt. Egypt J. Plant Breed 2010, 14, 283–293. [Google Scholar]
  15. Bellaloui, N.; Bruns, H.A.; Abbas, H.K.; Mengistu, A.; Fisher, D.K.; Reddy, K.N. Agricultural practices altered soybean seed protein, oil, fatty acids, sugars, and minerals in the Midsouth USA. Front. Plant Sci. 2015, 6, 31. [Google Scholar] [CrossRef] [PubMed]
  16. Ojo, D.K.; Adebisi, M.A.; Tijani, B.O. Influence of environment on protein and oil contents of soybeans seed (Glycine Max (L.) Merril). Global J. Agric. Sci. 2002, 1, 27–32. [Google Scholar] [CrossRef]
  17. Walter, H.; Lieth, H. Klimadiagram–Weltatlas; VEB Gustav Fischer Verlag: Jena, Germany, 1967. [Google Scholar]
  18. Rehman, M.; Khaliq, T.; Ahmad, A.; Wajid, S.A.; Rasul, F.; Hussain, J.; Hussain, S. Effect of planting time and cultivar and soybean performance in semi–arid Punjab, Pakistan. Global J. Sci. Front. Res. Agric. Vet. 2014, 14, 41–45. [Google Scholar]
  19. Kron, A.P.; Souza, G.M.; Ribeiro, R.V. Water deficiency at different developmental stages of Glycine max can improve drought tolerance. Bragantia 2008, 67, 43–49. [Google Scholar] [CrossRef] [Green Version]
  20. Mandić, V.; Đorđević, S.; Bijelić, Z.; Krnjaja, V.; Pantelić, V.; Simić, A.; Dragičević, V. Agronomic responses of soybean genotypes to starter nitrogen fertilizer rate. Agronomy 2020, 10, 535. [Google Scholar] [CrossRef] [Green Version]
  21. De Castro, J.N.; Müller, C.; Almeida, G.M.; Costa, A.C. Physiological tolerance to drought under high temperature in soybean cultivars. Aust. J. Crop Sci. 2019, 13, 976–987. [Google Scholar] [CrossRef]
  22. Zaytsev, N.I.; Bochkaryov, N.I.; Zelentsov, S.V. Prospects and directions for soybean breeding in Russia under implementation conditions of the national strategy of import substitution. Oil Crop. Sci. Tech. Bull. 2016, 2, 3–11. [Google Scholar]
  23. Arnold, B.H. Planting date, rate, and twin–row vs. single–row soybean. Midsouth. Agron. J. 2011, 103, 1313. [Google Scholar]
  24. Morsy, A.R. Evaluation of performance in top–cross of soybean yield through different planting dates. Ann. Agric. Sci. Moshtohor 2010, 48, 1–21. [Google Scholar]
  25. Bastidas, A.M.; Setiyono, T.D.; Dobermann, A.; Cassman, K.G.; Elmore, R.W.; Graef, G.L.; Specht, J.E. Soybean sowing date: The vegetative, reproductive, and agronomic impacts. Crop Sci. 2008, 48, 727–740. [Google Scholar] [CrossRef] [Green Version]
  26. Kandil, A.A.; Sharief, A.E.; Morsy, A.R.; El–Sayed, A.I.M. Influence of planting date on some genotypes of soybean growth, yield and seed quality. J. Biol. Sci. 2012, 13, 146–151. [Google Scholar]
  27. Kang, B.K.; Kim, H.T.; Choi, M.S.; Koo, S.C.; Seo, J.H.; Kim, H.S.; Shin, S.O.; Yun, H.T.; Oh, I.S.; Kulkarni, K.P.; et al. Genetic and environmental variation of first pod height in soybean [Glycine max (L.) Merr.]. Plant Breed. Biotechnol. 2017, 5, 36–44. [Google Scholar] [CrossRef] [Green Version]
  28. Lima, M.D.D.; Peluzio, J.M.; Mandarino, J.M.G.; Lima, D. Potassium fertilization and sowing seasons on protein yield in soybean cultivars. Rev. Bras. Eng. Agríc. Ambient. 2017, 21, 392–397. [Google Scholar] [CrossRef] [Green Version]
  29. Pípolo, A.E.; Hungria, M.; Franchini, J.C.; Balbinot, A.A., Jr.; Debiasi, H.; Mandarino, J.M.G. Teores de Óleo e Proteínaem Soja: Fatores Envolvidos e Qualidade Para a Indústria; Embrapa Soybean: Londrina, Brazil, 2015; pp. 1–15. [Google Scholar]
  30. Benzain, B.; Lane, P.W. Protein concentration of grains in relation to some weather and soil factors during 17 years of English winter wheat experiments. J. Sci. Food Agric. 1986, 37, 435–444. [Google Scholar] [CrossRef]
  31. Setiyono, T.D.; Weiss, A.; Specht, J.; Bastidas, A.M.; Cassman, K.G.; Dobermann, A. Understanding and modeling the effect of temperature and day length on soybean phenology under high-yield conditions. Field Crop. Res. 2006, 100, 257–271. [Google Scholar] [CrossRef] [Green Version]
  32. Hu, M.; Wiatrak, P. Effect of planting date on soybean growth yield and grain quality: Review. Agron. J. 2012, 104, 785–790. [Google Scholar] [CrossRef]
  33. Ohyama, T.; Tewari, K.; Ishikawa, S.; Tanaka, K.; Kamiyama, S.; Ono, Y.; Hatano, S.; Ohtake, N.; Sueyoshi, K.; Hasegawa, H.; et al. Role of nitrogen on growth and seed yield of soybean and a new fertilization technique to promote nitrogen fixation and seed yield, soybean. In Soybean—The Basis of Yield, Biomass and Productivity; Kasai, M., Ed.; IntechOpen Limited: London, UK, 2017; pp. 154–185. [Google Scholar]
  34. Carvalho, C.G.P.; Arias, C.A.A.; Toledo, J.F.F.; Oliveira, M.F.; Vello, N.A. Correlation and path analyses in soybean lines sowed at different sowing dates. Braz. J. Agric. Res. 2002, 37, 311–320. [Google Scholar]
  35. Carrera, C.; Martínez, M.J.; Dardanelli, J.; Balzarini, M. Environmental variation and correlation of seed components in non–transgenic soybeans: Protein, oil, unsaturated fatty acids, tocopherols and isoflavones. Crop Sci. 2011, 51, 800–809. [Google Scholar] [CrossRef]
Figure 1. Climate diagram by Walter and Lieth [17] across study periods.
Agriculture 10 00502 g001
Table 1. ANOVA for the effect of year, genotype, and sowing time on the investigated parameters.
FactorPHFPHNNNPSWPTSWPCOCSY
p Value
Year (Y)0.0000.0000.0000.0000.0000.0010.0780.4610.000
Genotype (G)0.0000.0000.0840.0000.0000.1510.0210.0150.002
Sowing time (ST)0.0000.0000.0000.0000.0000.0000.0000.8220.000
Y × G0.0000.0930.0000.0000.0000.0000.5370.0000.000
Y × ST0.8160.0360.2210.0310.0000.0340.0110.2380.000
G × ST0.0000.8300.0050.0000.0000.2110.9200.0000.004
Y × G × ST0.0000.0340.0650.2810.0030.0470.0000.0000.000
PH—plant height; FPH—first pod height; NN—number of nodes per plant; NP—number of pods per plant; SWP—seed weight per plant; TSW—1000-seed weight; PC—protein content; OC—oil content; SY—seed yield.
Table 2. Genotype and sowing time effects on the quantitative and quality traits in 2017.
FactorPHFPHNNNPSWPTSWPCOCSY
Genotype
(G)
Galina87.6 c10.9 c13.7 a34.0 a10.1 b135.3 ab40.8 c16.7 a1658.1 ab
Sava108.5 a12.6 a13.9 a35.0 a11.9 a141.7 a41.6 a15.0 c1726.8 a
Rubin97.9 b12.4 b12.8 b30.2 b9.2 c130.7 b41.2 b15.8 b1576.2 b
F testG*****************
Sowing time
(ST)
Standard105.7 a13.0 a14.9 a34.9 a11.1 a146.3 a41.8 a15.9 a1819.3 a
Late90.2 b11.0 b12.0 b31.2 b9.7 b125.5 b40.6 b15.7 b1488.1 b
F testST*****************
G × ST**************
Mean98.012.013.433.010.4135.941.215.81653.7
PH—plant height (cm); FPH—first pod height (cm); NN—number of nodes per plant; NP—number of pods per plant; SWP—seed weight per plant (g); TSW—1000–seed weight (g); PC—protein content (%); OC—oil content (%); SY—seed yield (kg ha−1). Means with different superscript letters in a column are significantly different by Tukey’s test at the 5% level. ** Significant at 1%; * significant at 5%.
Table 3. Genotype and sowing time effects on the quantitative and quality traits in 2018.
FactorPHFPHNNNPSWPTSWPCOCSY
Genotype
(G)
Galina107.3 c12.515.7 a33.3 c11.9 a145.3 a40.715.53790.6 b
Sava117.9 b13.315.1 b41.0 b11.1 b136.6 b41.116.23700.0 c
Rubin128.5 a13.416.0 a46.1 a12.0 a142.3 a41.016.03971.0 a
F testG**ns********nsns**
Sowing time
(ST)
Standard125.7 a13.7 a16.9 a43.3 a13.2 a148.3 a41.115.94220.8 a
Late110.0 b12.4 b14.3 b36.9 b10.1 b134.5 b40.816.03420.3 b
F testST************nsns**
G × ST**ns*******ns***
Mean 117.913.015.640.111.7141.440.915.93820.5
PH—plant height (cm); FPH—first pod height (cm); NN—number of nodes per plant; NP—number of pods per plant; SWP—seed weight per plant (g); TSW—1000–seed weight (g); PC—protein content (%); OC—oil content (%); SY—seed yield (kg ha−1). Means with different superscript letters in a column are significantly different by Tukey’s test at the 5% level. ** Significant at 1%; * significant at 5%; ns—not significant.
Table 4. Correlation matrix (Pearson) between the studied traits for both years (n = 48).
PHFPHNNNPSWPTSWPCOC
FPH0.79 **
NN0.79 **0.67 **
NP0.83 **0.53 **0.67 **
SWP0.72 **0.53 **0.79 **0.65 **
TSW0.60 **0.59 **0.78 **0.47 **0.79 **
PC0.260.30 *0.260.070.160.33 *
OC−0.03−0.100.060.20−0.120.01−0.22
SY0.77 **0.53 **0.77 **0.66 **0.55 **0.41 **−0.050.05
PH—plant height; FPH—first pod height; NN—number of nodes per plant; NP—number of pods per plant; SWP—seed weight per plant; TSW—1000–seed weight; PC—protein content; OC—oil content; SY—seed yield. ** Significant at 1%; * significant at 5%.
Publisher’s Note: MDPI stays neutral with regard to jurisdictional claims in published maps and institutional affiliations.

