Article

Comparative Response of Huanglongbing-Affected Sweet Orange Trees to Nitrogen and Zinc Fertilization under Microsprinkler Irrigation

by
Qudus O. Uthman
1,2,
Davie M. Kadyampakeni
1,2,*,
Peter Nkedi-Kizza
1,
Neriman T. Barlas
2,3,
Alisheikh A. Atta
4 and
Kelly T. Morgan
4
1
Soil and Water Sciences Department, University of Florida, 2181 McCarty Hall, Gainesville, FL 32611, USA
2
Citrus Research and Education Center, University of Florida, 700 Experiment Station Rd, Lake Alfred, FL 33850, USA
3
Department of Soil Science and Plant Nutrition, Faculty of Agriculture, University of Ege, Izmir 35040, Turkey
4
Southwest Florida Research and Education Center, University of Florida, 2685 SR 29 N, Immokalee, FL 34142, USA
*
Author to whom correspondence should be addressed.
Agriculture 2020, 10(10), 489; https://doi.org/10.3390/agriculture10100489
Submission received: 23 September 2020 / Revised: 13 October 2020 / Accepted: 17 October 2020 / Published: 21 October 2020
(This article belongs to the Section Ecosystem, Environment and Climate Change in Agriculture)

Abstract

:
Nitrogen and micronutrients have a key role in many citrus plant enzyme reactions. Although enough micronutrients may be present in the soil, deficiency can develop due to soil depletion or the formation of insoluble compounds. The objectives of this study were to (1) determine the adsorption, distribution, and availability of Zn in a sandy soil; (2) compare the effectiveness of foliar and soil application methods of Zn on Huanglongbing [HLB] affected trees; (3) compare foliar application rates of Zn for HLB-affected trees; (4) determine the effect of N rates on yield, soil inorganic N distribution patterns, and tree growth parameters. Tree rows were supplied with three N rates of 168, 224 and 280 kg·N·ha−1 and Zn at single and double recommended rates (recommended rate = 5.6 kg·Zn·ha−1) using foliar and soil application methods, in a split-plot experimental design. The results show that Zn concentration in the 0–15 cm soil depth was three times higher than the 30–45 and 45–60 cm soil depths during the study. An adsorption study revealed high Zn (KD = 6.5) sorption coefficients at 0–15 cm soil depth, while 30–45 and 45–60 cm depths showed little sorption. Leaf Zn concentration for foliar spray was two times higher than the soil application method. A nitrogen level of 224 kg N ha−1 improved canopy volume when compared to other N levels at the expense of reduced fruit weight. Foliar Zn application at 5.6 or 11.2 kg ha−1 and N rate at 224 kg ha−1 appear to be adequate for improving the performance of HLB-affected citrus trees.

1. Introduction

Several cultivars of sweet orange cultivated in Florida are reported to have a significant yield response to N fertilizers at 168 kg ha−1 [1]. Nitrogen management programs showed that the ideal N rate for increased fruit yield and quality is approximately 260 kg N ha−1 yr−1 under best management practices (BMPs) and a proper irrigation schedule [2]. A previous study claimed enhanced knowledge of the N budgets for citrus groves, which resulted in the development of appropriate BMPs to maintain production while protecting the environment [3]. BMPs are designed to decrease N leaching into groundwater by applying fertilizers in splits with appropriate rate and fertigation with improved irrigation scheduling [2,3,4].
Nutrients are important in disease control as they influence plant resistance, immunity, and pathogen growth [5,6,7]. The relationship between mineral nutrients and plant disease eventually influences the intensity of disease symptoms [8]. Zinc plays a key role as a structural, regulatory, and catalytic cofactor of many enzyme reactions in plants [9]. The foliar symptoms of HLB include small yellow leaves on one section, leaf mottling, zinc-like deficiency on newest leaves and mottling on older leaves [10]. Although Zn may be present in the soil, deficiency can develop due to soil depletion or the formation of insoluble Zn compounds [9]. The soil quantity of micronutrients in most soils is not a good sign of its availability to plants [11]. Citrus micronutrient (especially Zn) deficiencies have been observed in shallow soils with a high water table, in extremely sandy areas, and in calcareous soils [12]. Soil and foliar application of micronutrients has been recommended to correct deficiencies in Florida citrus [13].
The management of essential nutrients as a means of improving citrus growth and yield in Huanglongbing (HLB) disease-affected groves is not well understood to provide conclusive nutrient management recommendations to growers and deserves additional research [14]. Several studies have shown that increasing micronutrient application rates along with the right balance with nitrogen would enhance citrus production in terms of fruit yield, and canopy/root growth [14,15,16]. This study hypothesized that (1) foliar compared to the soil application method of Zn should improve the performance of HLB-affected trees; (2) doubling the foliar application rate of Zn should reduce the devastating effect of HLB on citrus trees through improved trunk diameter, canopy size, and yield; and (3) the efficacy of Zn in HLB-affected trees is dependent on inorganic N availability for increased yield and canopy size. The objectives of this study were to (1) determine the adsorption, distribution, and availability of Zn in a sandy soil; (2) compare the effectiveness of foliar and soil application method of Zn on HLB-affected trees; (3) compare foliar application rates of Zn for HLB-affected trees; (4) determine the effect of N rates on yield, soil inorganic N distribution patterns, and tree growth parameters.

2. Material and Methods

2.1. Description of the Study Site

This study was conducted using ‘Valencia’ (Citrus sinensis (L.) Osb.) on Swingle rootstock (Citrus paradisi Macf. 3 x Poncirus trifoliata (L.) Raf.) trees spaced at 1.8 m by 4.6 m at the Citrus Research and Education Center, Lake Alfred, FL (28.09° N, 81.75° W) which were planted in August 2012. The soil is a Candler fine sand classified as Hyperthermic, coated Lamellic Quartzipsamments formed from eolian or sandy marine deposits [17]. Soil particle size distribution was determined using the Bouyoucos hydrometer method [18]. Soil pH was measured using a soil to deionized water ratio of one-to-one and read with a hydrogen probe [19]. Organic matter content was measured using the loss-on-ignition method [20]. Soil bulk density was determined using the core method [21]. The selected chemical and physical properties of the study site are provided in Table 1. The trees were supplied with 2240 kg·ha−1 fertilizer blend at the University of Florida Institute of Food and Agricultural Sciences (UF/IFAS)’s recommended rate containing a known amount of nutrients in four splits per year, given in percentage as 9.75% N, 2% P2O5, 13% K2O, 2.28% Ca, 2.5% Mg, 11.69% S, 0.03% B, 0.27% Fe, 0.55% Mn and 0.19% Zn. These methods were also described by Uthman et al. [22,23].

2.2. Experimental Design and Treatment Application

Treatment plots contained 10 trees, where the middle 8 trees were used for measurements. The N composition of the fertilizer blend was adjusted with sole urea (46% N) for each row to receive three N rates of 168, 224, and 280 kg N ha−1 in three replicates as the main plots. Each row was sub-divided into 4 sub-plots receiving Zn applications in three splits yr−1 as follows: (1) standard soil Zn applied (control), (2) standard soil Zn applied + foliar-applied Zn based at 1× UF/IFAS recommendations, (3) 2× foliar-applied Zn at UF/IFAS recommendations + standard soil Zn application, and (4) 2× soil-applied UF/IFAS recommendations (5.60 kg Zn ha−1). The source of Zn applied was zinc sulphate. The soil treatment was applied within a 45 cm radius of the tree while the foliar treatment was applied as foliar sprays. All trees were irrigated to meet the daily crop water demand by 40 L h−1 emitters, with one emitter per two trees having a wetting diameter of 1.5 m, with each irrigation applied at 8 a.m. and 1 p.m. daily. Soil and leaf samples were collected before treatments application, which was similar to the methods of Uthman et al. [22,23].

2.3. Soil Sampling and Analysis

The citrus fibrous rooting zone is predominantly within the 0–30 cm soil depth [24]. Varying sampling distance for soil collection accounts for lateral movement and inefficiencies during the application of the treatments. Soil samples were collected in June 2018, February 2019, and September 2019 from the soil surface to 60 cm depth at 15 cm depth increments to account for nutrient movement beyond the 30 cm rooting zone at 30 and 60 cm perpendicular distance to the tree row, representing irrigated and non-irrigated zones, respectively. Soil samples were collected with at 5.7 cm diameter auger (AMS Inc, America Falls, ID, USA). Determination of soil concentration of Zn was done using the method described by Uthman et al. [22,23]. Soil Zn was determined using inductively coupled plasma-mass spectrometry (ICP-MS) at 257.6 nm wavelength [25].

2.4. Soil Nitrate and Ammonium Analysis

Soil ammonium (NH 4 + -N) and nitrate (NO 3 -N) were extracted using 2M KCl [24,26]. A 40 mL solution of 2M KCl was added to each soil sample for soil (NH 4 + -N) and nitrate analysis and the samples were capped and shaken for 15 min on a platform shaker. After shaking, all the sample solutions were allowed to settle for 15 min and filtered into labeled vials using Whatman no. 42 filter paper, capped, and stored in a freezer at <4 °C until analysis. Soil NH 4 + -N and NO 3 -N were determined using a flow analyzer (QuikChem 8500, Lachat Instruments, Loveland, CO, USA) at 660 and 520 nm, respectively, on a dry weight basis [27].

2.5. Adsorption Study

One-point sorption isotherms were determined to estimate the sorption coefficient of Zn as a function of soil depth, similar to the method of Uthman et al. [22,23]. The amounts of initial concentration of 10 mg Zn L−1 was used based on UF/IFAS recommended rate assuming 2 cm depth of incorporation into the soil. The soil:solution ratio used was 1:2, shaken for 24 h, centrifuged at 10,000 rpm for 20 min, filtered, and analyzed for Zn using inductively coupled plasma-atomic emission spectrometry (ICP-AES). The amount of Zn adsorbed to the soil was calculated from the difference between the initial and equilibrium solution concentrations as follows:
S e = v m ( C 0 C e )
where Se is the adsorbed concentration at equilibrium (mg kg−1), v is the initial volume of solution (L), m is the soil mass (kg), C0 is the initial concentration of the standard solution (mg L−1), and Ce is the soil solution concentration at equilibrium (mg L−1). The linear sorption isotherm was determined from the model below:
S e = K D C e
where KD is the sorption coefficient (L kg−1).

2.6. Leaf Collection and Analysis

Leaf samples were collected three times (February, June, and November) every year. The citrus leaf sampling technique by Obreza and Morgan was adopted by sampling from 4 quadrants of the tree in the northwest, southeast, northeast, and southwest directions and combining the sample of 8 trees per plot for a representative sample of 4 to 6 month-old leaves [13]. After collection, the leaf tissues were transported to the laboratory in a cooler and refrigerated until further processing. To remove contaminants, leaves were washed in a gentle detergent solution, and thoroughly rinsed with deionized water and dried in an oven drier at 70 °C for 72 h. Leaves were ground in a laboratory-size stainless steel Wiley mill to pass a 20-mesh (1-mm) screen before acid digestion. Determination of leaf concentration of Zn was done using the method described by Uthman et al. [22,23].

2.7. Growth, Fruit Yield, and Juice Quality Measurements

Tree trunk girth was measured using a vernier caliper, and canopy volume was calculated using the geometric prolate spheroid formula given in the equation below [28]. Measurements were done in March and November every year.
Canopy   volume   ( m 3 )   =   4 3 π r 2 ( h 2 )
where r = radius of the canopy (m); h = canopy height (m)
Fruit yield was determined in 2018, 2019, and 2020 by weighing harvested fruit from measurement trees in each plot and converting that to yield per hectare. The percentage amount of citric acid and soluble solids present in the juice were measured using the method described by [29].

2.8. Statistical Analysis

Detailed statistical analysis procedure can be found in the previous literature of Uthman et al. [22,23]. A linear mixed effect model using a non-linear mixed effect (NLME) package was used to analyze the variance between treatments effect, and Tukey honestly significant difference was used to separate means using a significance level of 0.05 [30]. Analysis of variance for leaf nutrient contents was done in R stats package using N rates as the main plot treatments and Zn treatments as the subplot treatments in a split-plot design [31].

3. Result and Discussion

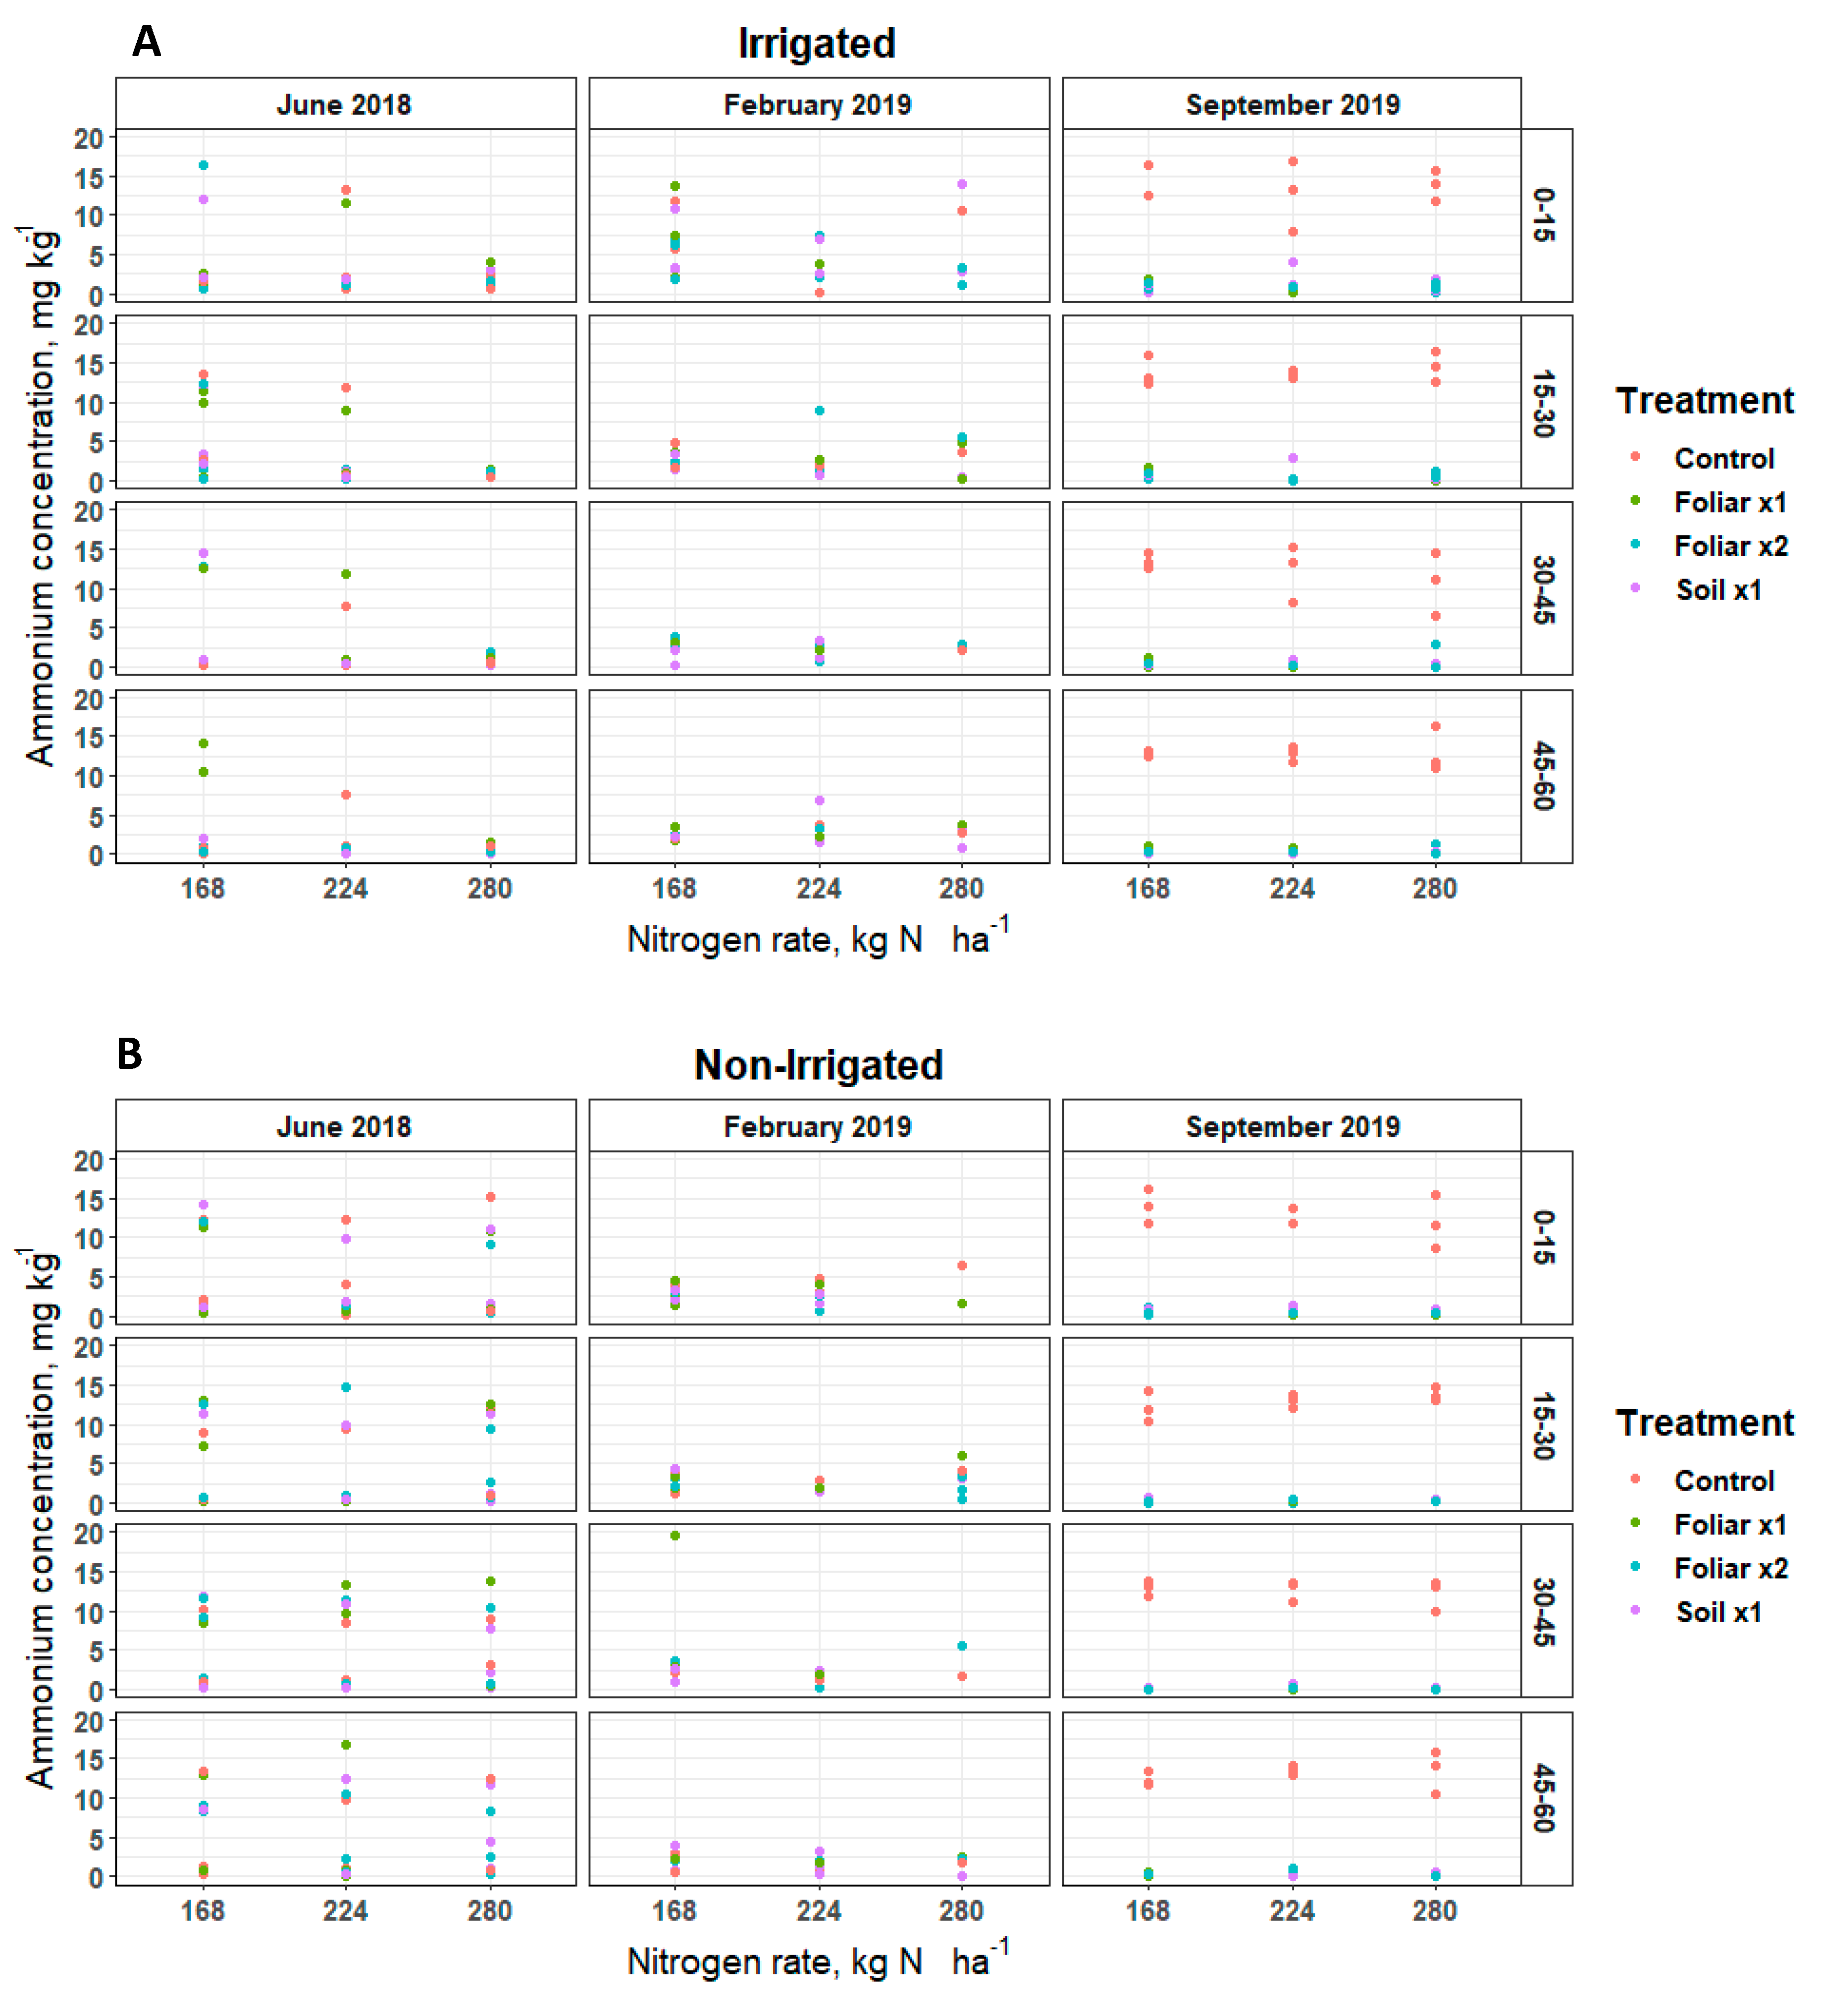
3.1. Soil Ammonium and Nitrate Distribution

Soil nitrate (NO 3 -N) and ammonium (NH 4 + -N) concentrations remained inconsistent over soil depths and sampling positions (irrigated [30 cm] and non-irrigated [60 cm]) for various levels of N and Zn rates and methods applied (Figure 1 and Figure 2). Soil NO 3 -N remained below 5, 50, and 25 mg kg−1 in June 2018, February 2019, and September 2019, respectively, at the irrigated and non-irrigated zone from the soil surface to the 60 cm depth (Figure 1). In June 2018, the soil Zn treatment (p < 0.05) showed 4 mg kg−1 of soil NO 3 -N more than the single and double foliar Zn application rates (Figure 1). Soil NH 4 + -N remained below 5 mg kg−1 in September 2019 in the non-irrigated zone, and 20 mg kg−1 in June 2018 and February 2019 in the irrigated and non-irrigated zones from the soil surface to 60 cm depth (Figure 2).

3.2. Soil Zn Distribution and Adsorption in a Sandy Soil

The 0–15 cm soil depth showed three- and six-times higher Zn concentration than the 15–30 and 30–60 cm soil depths, respectively, in June 2018 for both treatment and control plots (Table 2). The 0–15 cm soil depth also showed two- and five-times greater Zn concentration than the 15–30 and 30–60 cm soil depth respectively, in February 2019 for the treatment and control plots (Table 2). The 0–15 cm soil depth also showed two- and four-times greater Zn concentration than the 15–45 and 45–60 cm soil depth, respectively, in September 2019 for the treatment and control plots (Table 2). The 45-60 cm soil depth showed two times lower Zn concentration than the 15–45 cm soil depth in September 2019 for the treatment and control plots (Table 2). Zinc concentration for the 15–30 cm soil depth in February 2019 was 1.5 times more than in June 2018 (Table 2). The amount of Zn concentration in the soil for the control plots in the 0–15 cm layer was less than that where Zn was applied to the soil at all the sampling dates (Table 2). This implies that Zn was probably in the soil in forms that were not readily available to the citrus roots.
About 3 kg Zn ha−1 (Zn treatment plus background fertilizer blend) was applied in the first split, 34 kg Zn ha−1 was present in the soil in June 2018 in the 0–15 cm soil depth. A total of 10 kg Zn ha−1 was applied in three splits (Zn treatment plus background fertilizer blend) and 37 kg Zn ha−1 was present in the soil in February 2019 in 0–15 cm soil depth. The cumulative three split applications resulted in two times more Zn in the 0–15 cm soil depth in February 2019 than in September 2019. The rainfall from the first application of treatment to the date of sampling was about 47 cm with a peak of 25 cm in May 2018 compared to second treatment application to the date of sampling, which was about 108 cm with a double peak of 22 and 27 cm in July and August 2018, respectively [22,23]. The rainfall pattern for the year 2018 was also similar for the year 2019. High Zn concentration at the upper depth proved that it was were strongly adsorbed and retarded in the soil even if there was rainfall and irrigation supplied to meet the crop water demand. Thus, Zn was present in a high concentration in the soil. This might also be ascribed to the fact that this sand has coatings with iron and aluminum sesquioxides which might bind Zn [32].
The adsorption study revealed high Zn sorption coefficients (KD) at 0–15 and 15–30 cm soil depths, while the 30–60 cm soil depth showed negligible sorption (Table 1). Zinc sorption coefficients at 0–15 and 15–30 cm depth were respectively 130 and 50 times greater than 30–45 and 45–60 cm soil depths (Table 1). Assuming that during one of the heaviest rainfall events, the water content in the 0–15 cm depth was close to saturation (θs = 0.41), the velocity of Zn would be 25 times less than the velocity of water molecules [22]. This implies that even if water moved up to 50 cm from the soil surface, Zn would have moved only 2 cm, respectively, into the soil profile. The data in Table 1 show that Zn never moved below the 15 cm depth since the control and soil treatment have nearly equal concentrations from June 2018 to February 2019 but showed high Zn concentration in September 2019 (Table 2). Thus, strong sorption retained Zn in the 0–15 cm soil layer. It is also clear that water content during the study was close to field capacity below the 30 cm depth, implying negligible downward water movement due to the irrigation strategy used even after rainfall events [22].
This was made possible by the replacement of water lost through evapotranspiration (ET) with irrigation which kept water available throughout the whole experimental study. Hippler et al. showed that Zn soil application can supply citrus trees with nutrient requirements, but low fertilizer solubility and high soil sorption capacity limit fertilization efficiency, which was also demonstrated in this study [33]. Since most of Zn applied was adsorbed at the 0–15 and 0–30 cm soil depths, respectively, the soil solution concentration would be very low to supply the roots via mass flow [34]. Because of the low Zn concentration in the soil solution, supplying the roots via mass flow might account for only a small fraction of plant demand [34]. The soil was predominantly sandy with a low percentage of organic matter (<1%), which could have made the soil clay-size fraction responsible for Zn sorption in the 0–15 and 15–30 cm soil depths but also the presence of sand coatings, as described by Obreza and Morgan (Table 1) [13]. The epipedon of the soil under study have sand coatings that were systematically high in hydroxy-interlayered minerals and unremarkable gibbsite [32]. Zinc in the soil might have formed stable complexes with clay minerals and high molecular-weight organic compounds that exist as insoluble complexes and might have made Zn applied to the soil unavailable for uptake in the short-term, but could be released over time depending on changes in soil pH and the presence of other competing cations or nutrients [35].

3.3. Seasonal Leaf Response to Zinc

Leaf Zn followed the same pattern of increase and decrease for treatments and it has an elevated concentration in June 2018 (Figure 3). Leaf Zn concentrations showed that foliar spray was two times higher than the soil application method for the February 2019 and September 2019 sampling dates (Figure 3). The double rate of Zn showed higher leaf concentration than a single rate for the foliar spray application method (Figure 3).
Leaf Zn deficiencies in HLB-affected trees are more pronounced during the cool, wet seasons and often disappear in the warmer season following the spring and summer leaf flush seasons. Comparing the season of soil sample analysis, the September month showed a Zn concentration in the soil that was significantly higher than the cool February and warmer June months. The low concentration of Zn in the soil during these sampling dates could be caused by a slow diffusion process that was responsible for the transport of Zn to the plant roots [35]. Soil temperature which could be affected by season could increase/decrease Zn availability through its solubility and diffusion [35].
Zinc absorption is rapid following foliar application, with a sharp decrease in the absorption rate after a few hours [36]. At least 50% of Zn applied was absorbed within 24 h of application [37]. The double rate of foliar application method of Zn might cause an increase in acidity which increases its intra-cuticular penetration. There is almost a universal agreement that foliar absorption rates for Zn are greater for young leaves than for old ones, since the latter are sampled after 4 to 6 months [38]. Wallihan and Heymann-Herschberg showed that Zn sulfate and sulfur sprays (or dusts) may be combined to control both citrus rust mites and Zn deficiency in orange trees [39]. Gomes et al.’s findings show that solubilities of Zn are responsible for faster absorption rates through the leaves and that sulfate salt of this nutrients could give better utilization efficiency, as observed in this study, since the source of fertilizer used for this study was sulfate salts dissolved in water for the foliar spray [40]. The observed results also agree with the study by Morgan et al. that showed that Zn has limited mobility within plants [14].

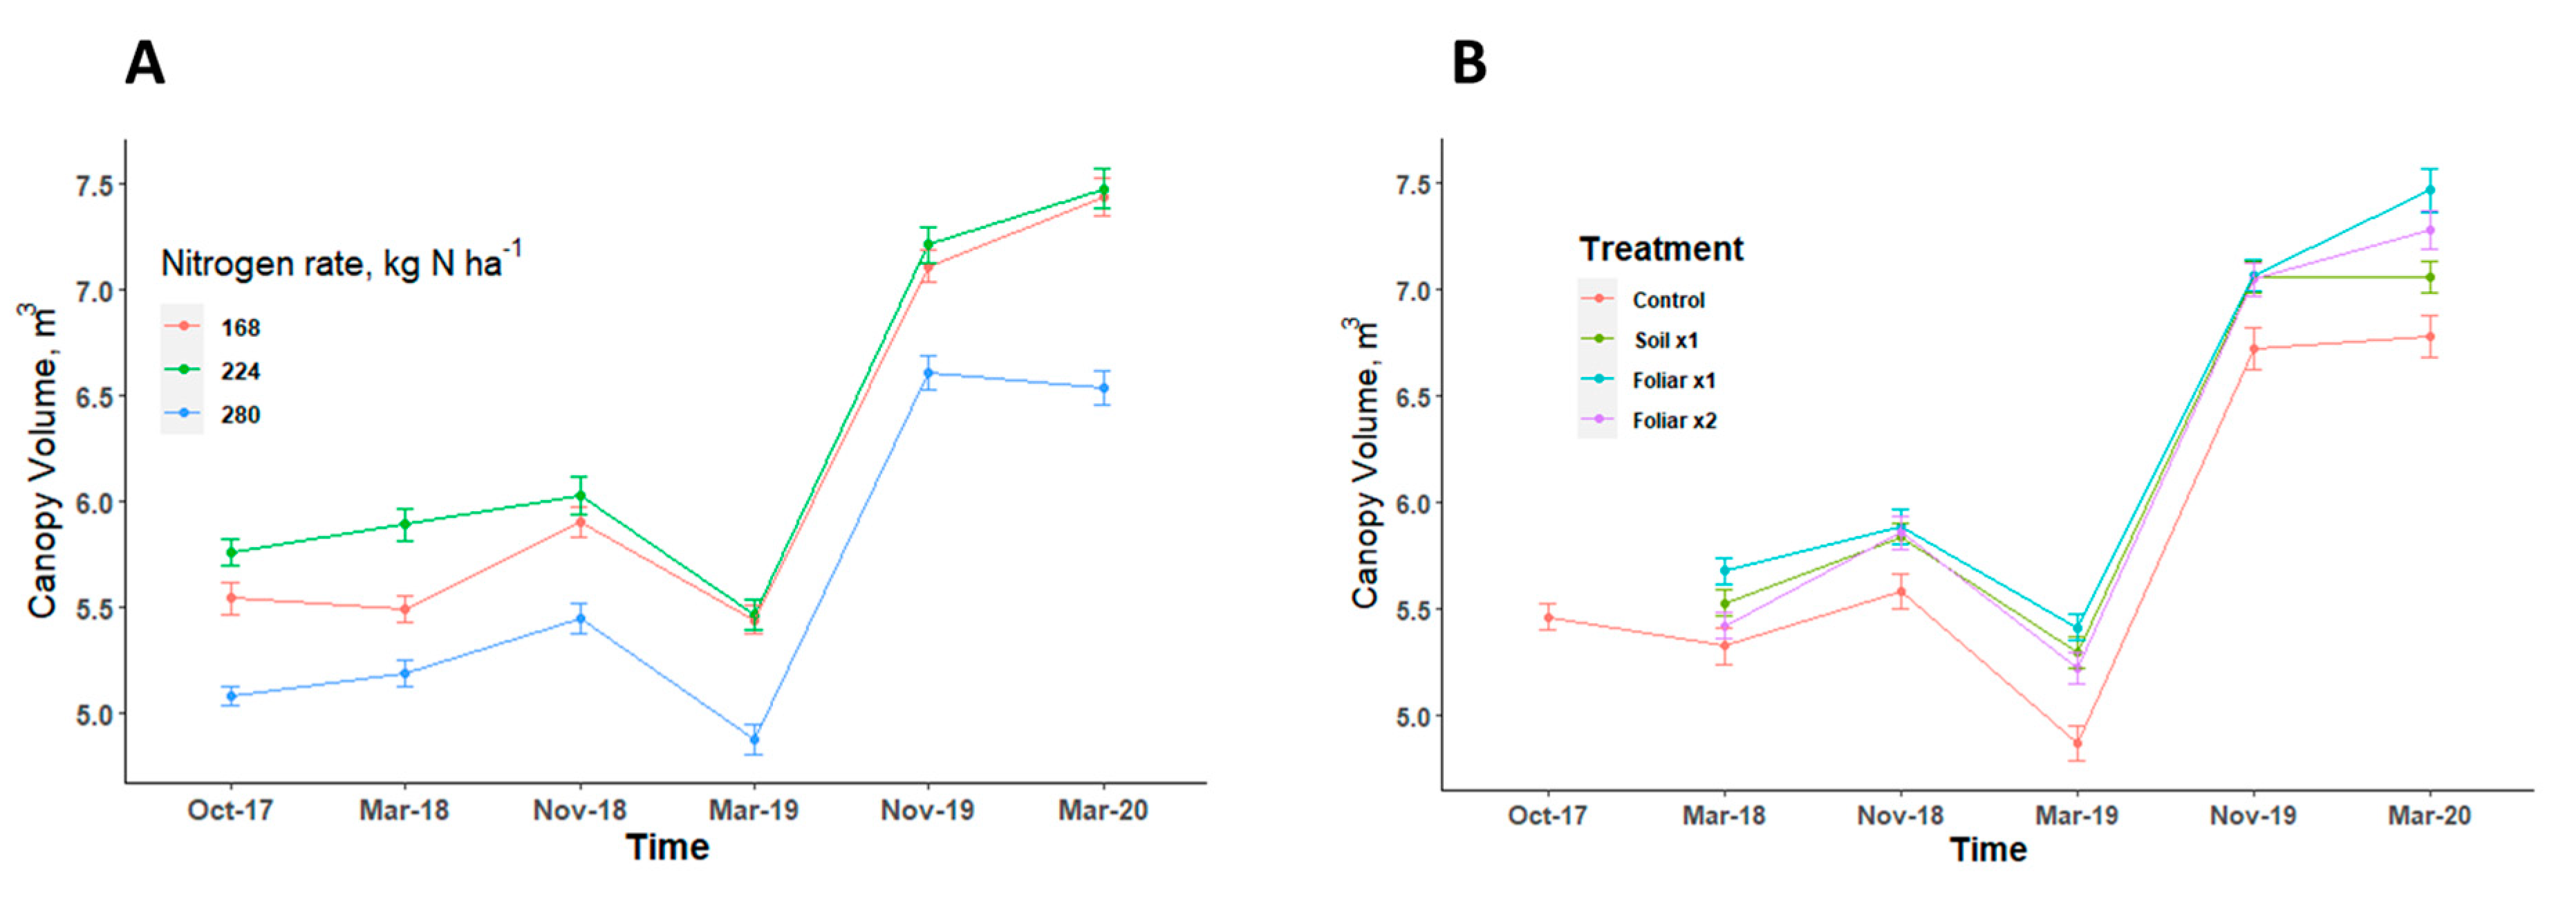
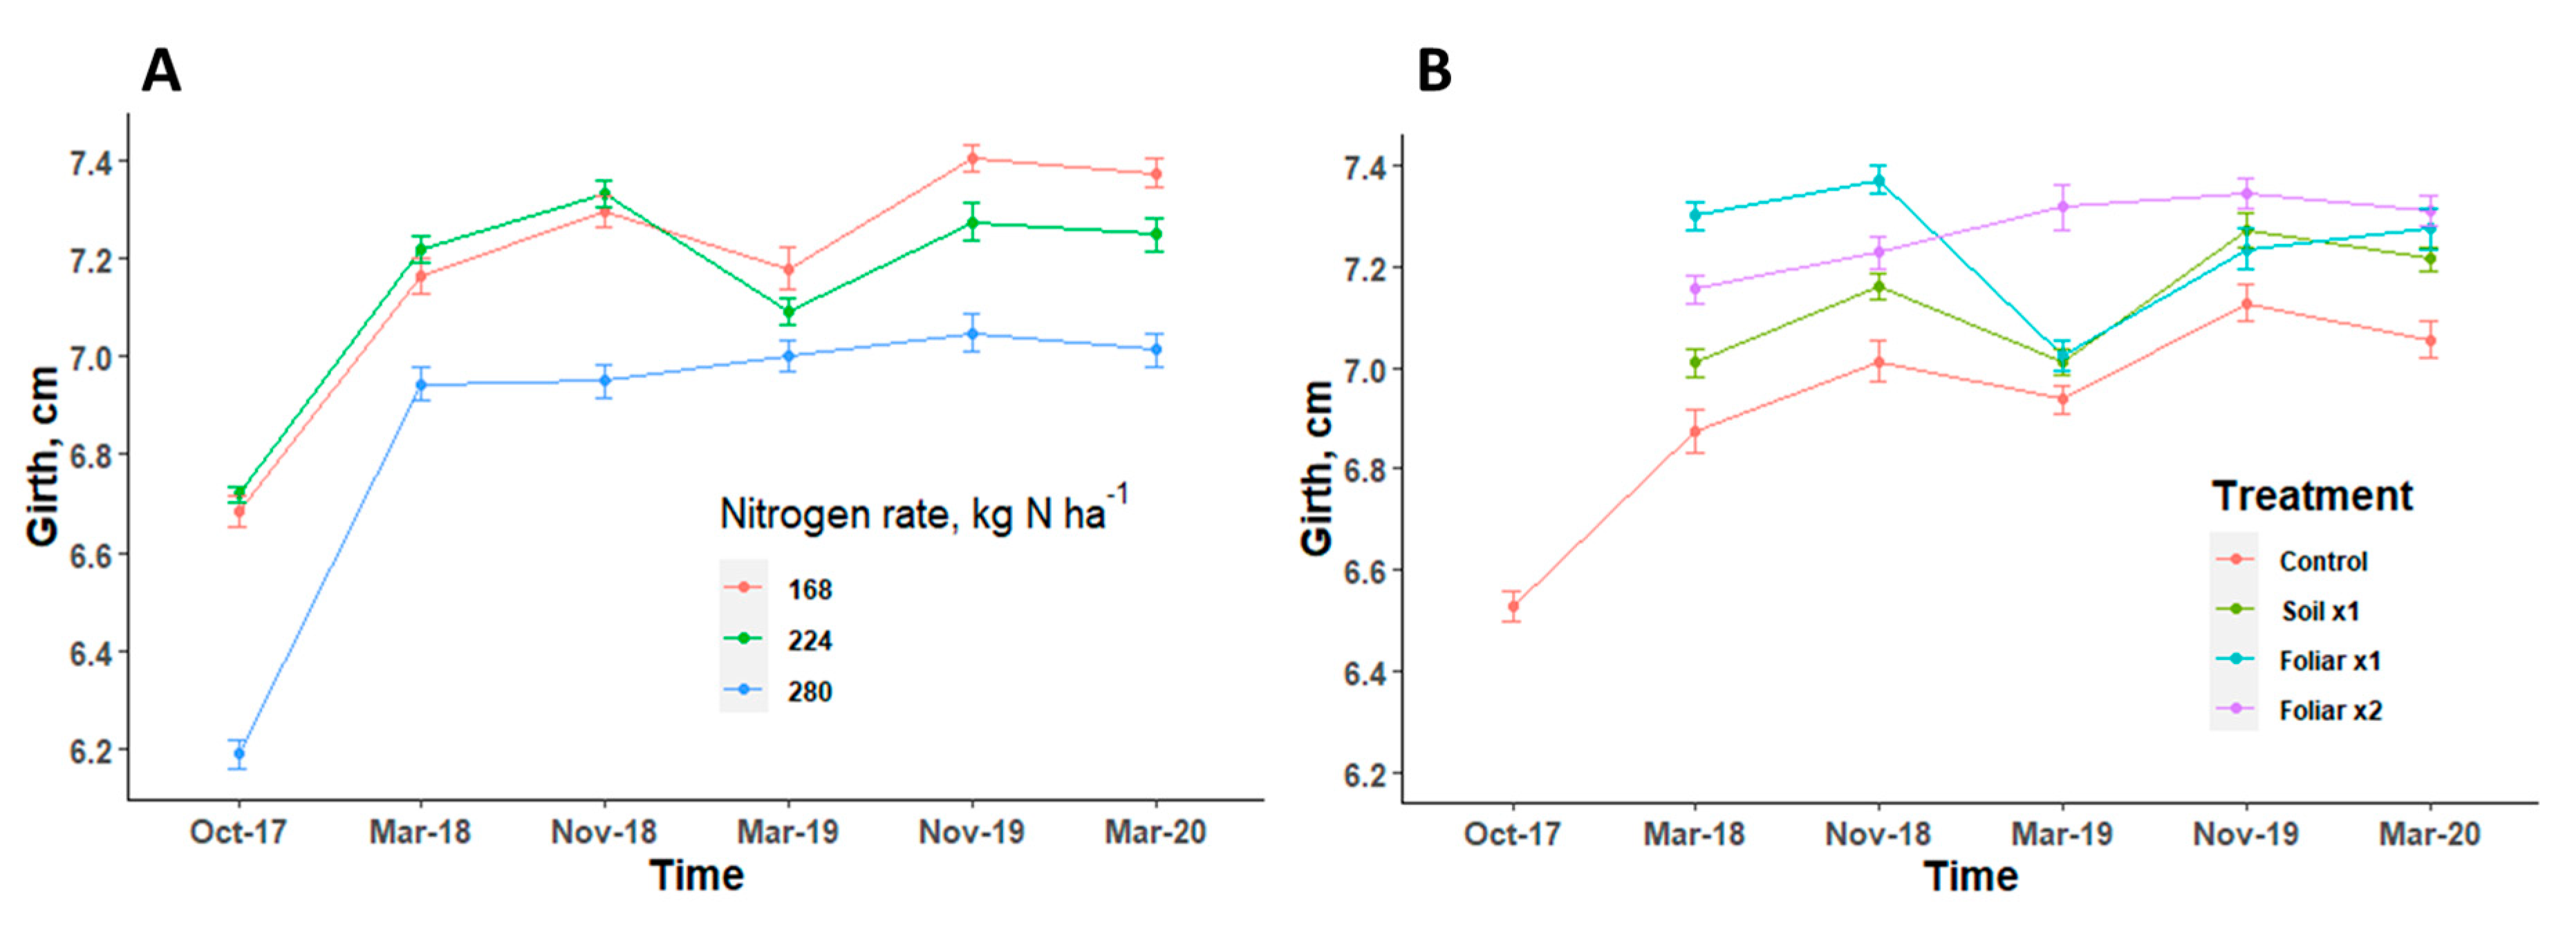
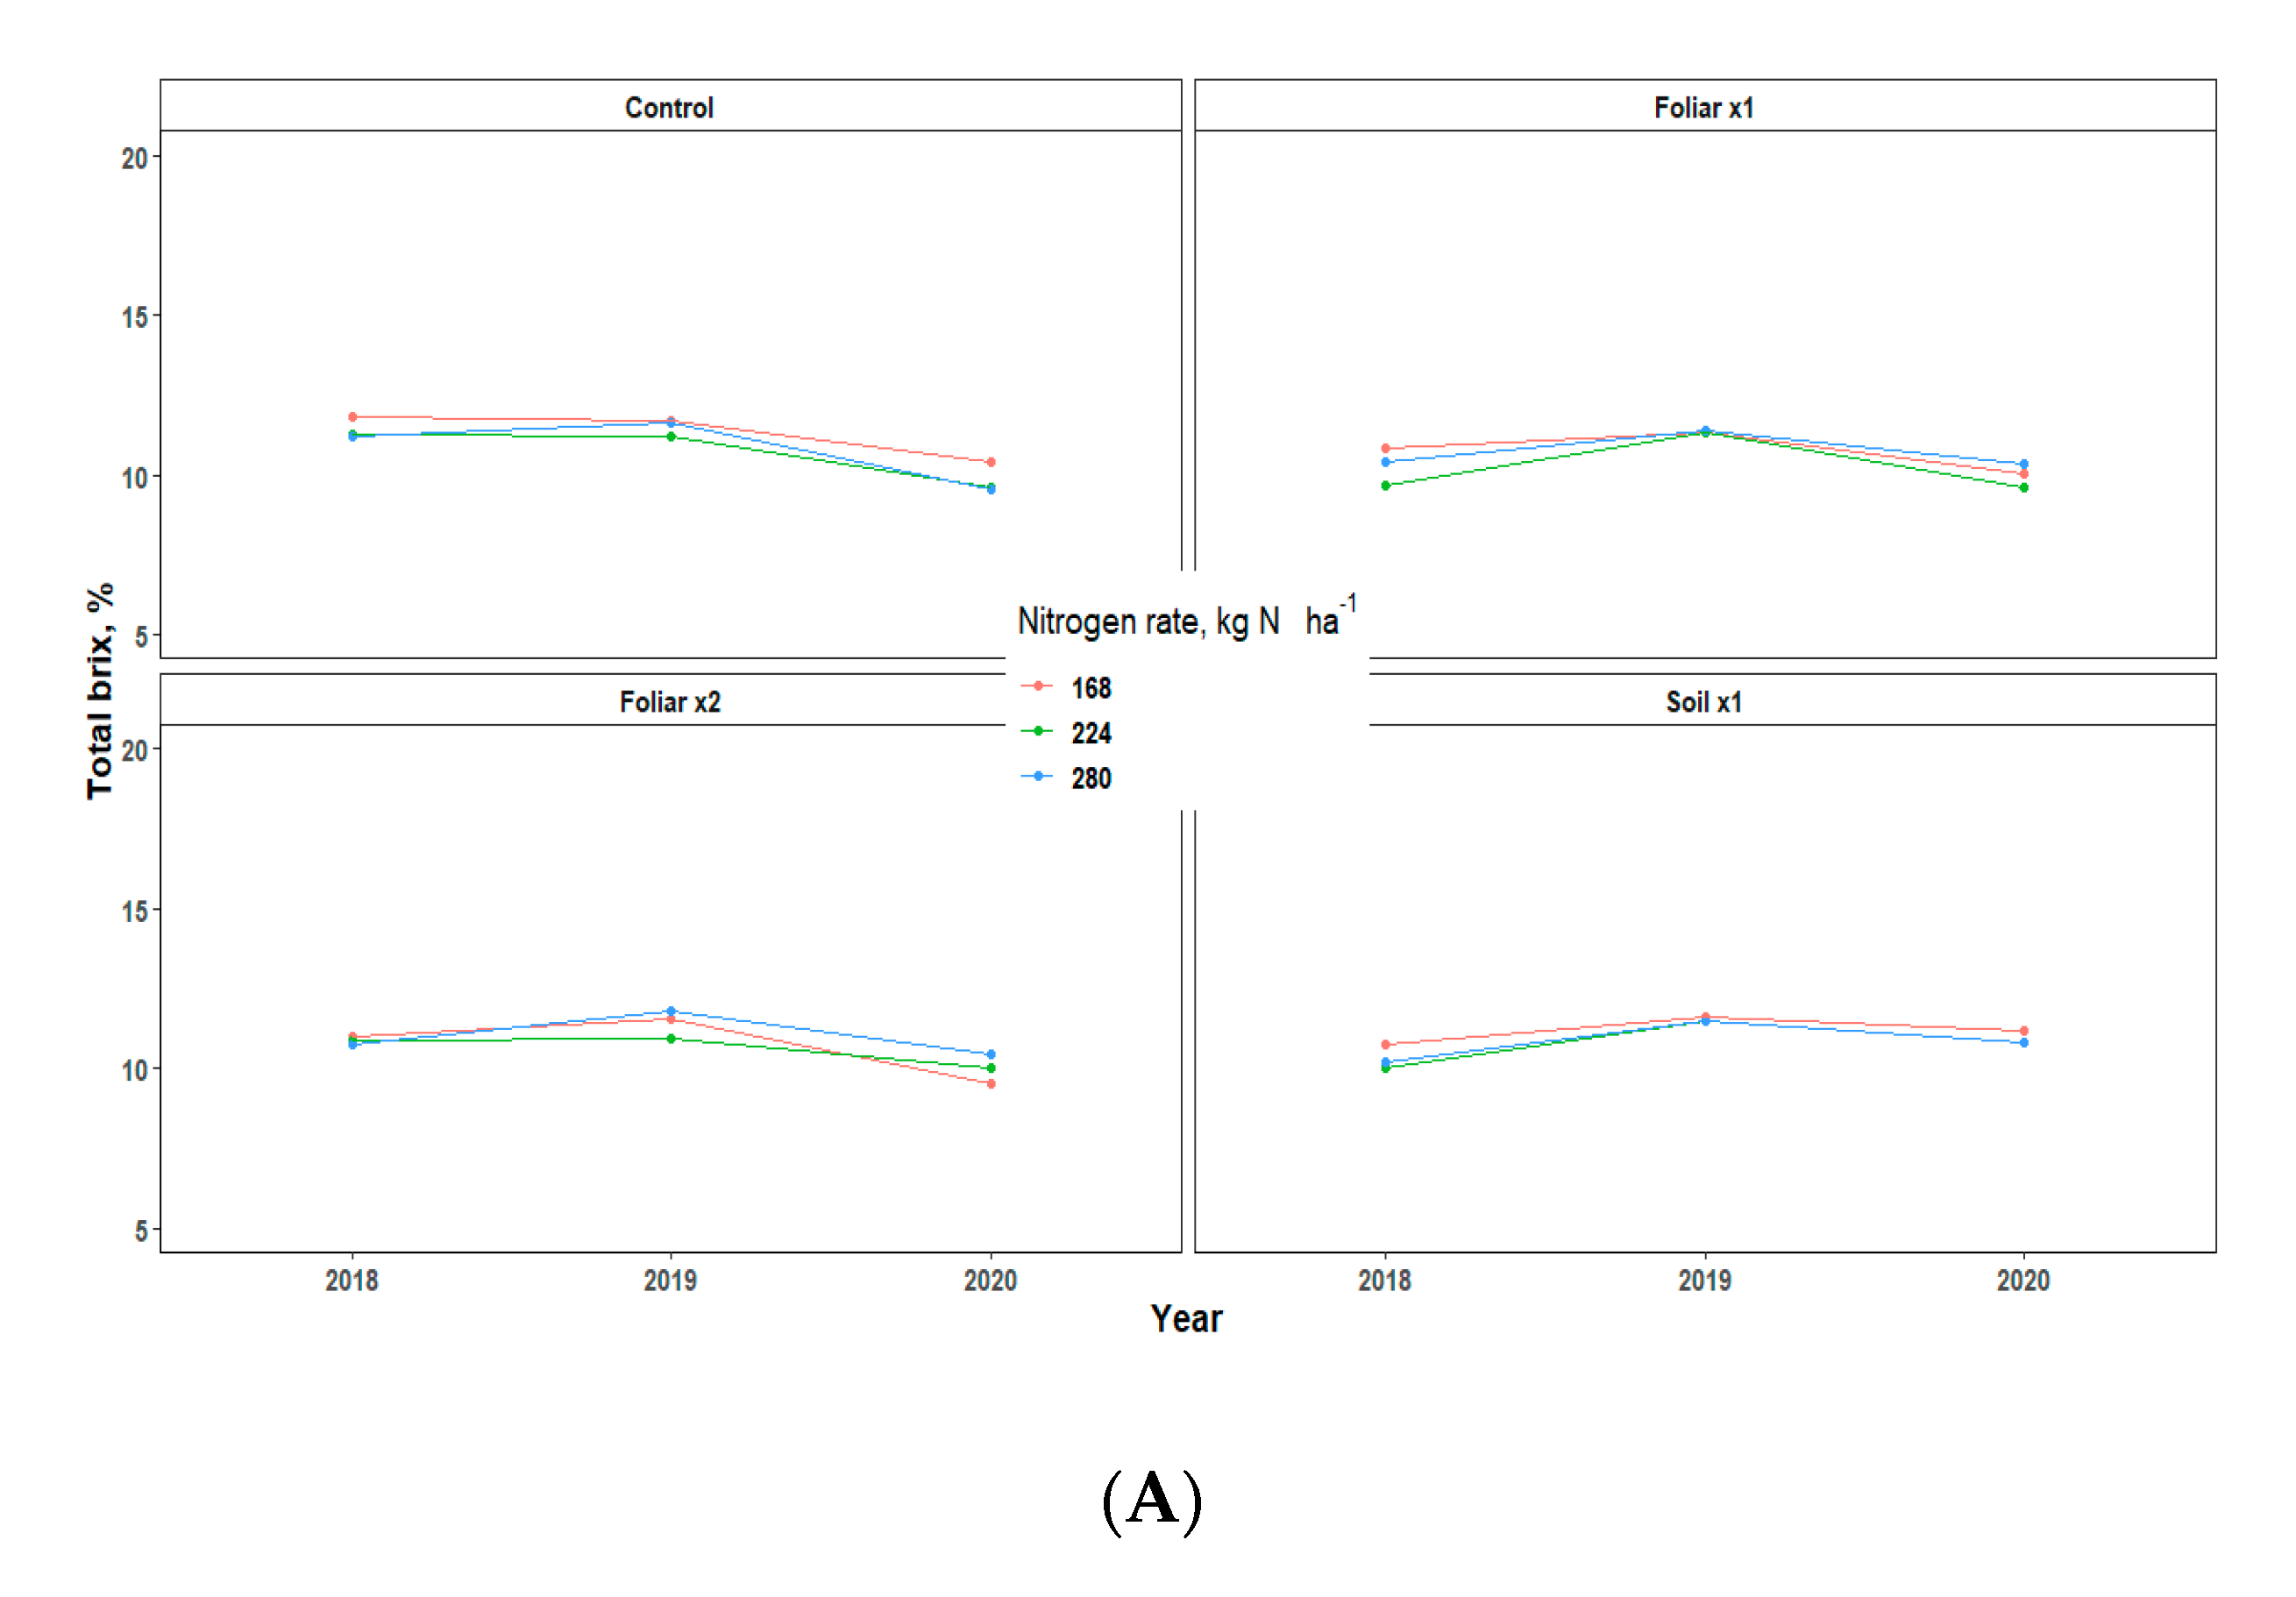
3.4. Growth and Yield Response to Nitrogen and Zinc

Tree canopy volume showed a consistent pattern in response to various levels of N and Zn applied in all the seasons (Figure 4). Trees with the highest level of N rate (280 kg N ha−1) had a canopy volume that was significantly 10% (p < 0.05) less than the trees with 168 and 224 kg N ha−1 (Figure 4A). There was no significant difference (p > 0.05) in the canopy volume when various Zn rates and methods were applied (Figure 4A). The recommended N rate at 224 kg N ha−1 and foliar application methods consistently improved canopy volume when compared to other N levels and Zn application methods (Figure 4).
Trunk diameter showed a consistent pattern in response to various N rates and Zn methods/rates applied in all the seasons (Figure 5). Trees with the highest level of N rate had a trunk diameter that was significantly (p < 0.05) less than the trees with other N levels (Figure 5A). There was no significant (p > 0.05) difference in the trunk diameter when various Zn rates and methods were applied (Figure 5B). Trunk diameter measurements were consistent and showed no significant (p > 0.05) differences, irrespective of N rates and Zn rates and methods in all seasons (Figure 5).
Yield showed an inconsistent pattern in response to Zn rates and methods and N rates in all the three years of data collection (Table 3). There were no significant differences in the various treatments applied, but the fruit weight pattern for 2018 and 2020 was 1.5 times greater than that of 2019, which may be largely due to the alternate bearing patterns observed in Valencia orange trees (Table 3) [13]. The various levels of N and Zn methods and rates have no significant effect on the percentage of total soluble solids (TSS/Brix), acid, and TSS/acid ratio, but rather showed a consistent pattern for all the three years that TSS, total acid, and TSS/Acid ratio for 2019 fruit yield was significantly higher than 2018 and 2020 by a percentage range of 0.2–2 (Figure 6).
An increase in N has been reported to increase the tree size and the harvested fruit [14]. This agrees with our study with the increase in canopy volume observed for 224 kg N ha−1, but beyond this level of N proved otherwise. Canopy volume might have increased at the expense of a reduction in fruit weight, as reported by Morgan et al. in their 5-year study [14]. A fairly strong negative relationship exists between soil nitrate form of N and yield such that a unit increase in soil NO 3 -N caused a decrease of 500 kg ha−1 of fruit (Figure 7), showing that applying N beyond the current 224 kg N ha−1 has no additional benefit. Typically, tree growth increases and yield decrease with increased N. The relationships in this paper may indicate an inconsistent soil N concentration with increased N application because of urea–N volatilization. The fruit weight and trunk diameter were not significantly different from all the years and seasons, respectively, but studies that claimed enhanced foliar nutritional treatments increase yields in the first two years compared with soil Zn application disagreed with what this study observed, probably because this was a high density planting with about 1111 trees ha−1 compared to the other studies which normally used a tree density of less than 500 trees ha−1 [14,41]. Quaggio et al. reported that N rates decreased fruit weight, which resulted in increased juice content of fruits for Valencia sweet orange [42]. Nitrogen promoted an accentuated increase in yield of soluble solids per area due to either increased fruit yield or improved fruit characteristics, such as juice content [42].

4. Conclusions

Canopy volume was improved when 224 kg N ha−1 was applied compared to other levels of nitrogen. An increase in soil nitrate concentration improved tree canopy volume at the expense of yield. Soil NO 3 -N might have been leached down the profile and NH 4 + -N might have been fixed in the little clay portion found in the sandy soil at 280 kg N ha−1. The recommended amount of Zn applied to the soil was so little compared to what was in the soil and does not reflect the added Zn. Soil applied nutrients could be adsorbed to the upper 0–30 cm soil depth for Zn and foliar application methods would meet nutrient demand of Zn at a double recommended rate for Zn. The soil is predominantly sandy, which makes the organic matter fraction and sesquioxides responsible for Zn sorption in the 0–15 and 15–30 cm soil depths. Future research should consider having elevated levels of soil Zn application at about 4x the current recommendation and using the N rate of 168 to 224 kg ha−1.

Author Contributions

Conceptualization, Q.O.U., D.M.K., P.N.-K. and K.T.M.; Methodology, Q.O.U., and D.M.K.; Software, Q.O.U., and D.M.K.; Validation, Q.O.U., D.M.K., and P.N.-K.; Formal analysis, Q.O.U.; Investigation, Q.O.U., D.M.K., P.N.-K. and K.T.M.; Resources, D.M.K and K.T.M.; Data curation, Q.O.U., and D.M.K.; Writing—original draft preparation, Q.O.U.; Writing—review and editing, Q.O.U., D.M.K., P.N.-K., A.A.A., N.T.B. and K.T.M.; Visualization, Q.O.U. and D.M.K.; Supervision, D.M.K. and P.N.-K.; Project administration, D.M.K. and K.T.M.; Funding acquisition, D.M.K. and K.T.M. All authors have read and agreed to the published version of the manuscript.

Funding

UF/IFAS Citrus Initiative, USDA NIFA Hatch Project No. FLA-CRC-005593 and USDA MAC APHIS Agreement No. AP19PPQS&T00C116.

Acknowledgments

The authors thank the UF/IFAS Citrus Initiative, USDA NIFA Hatch Project No. FLA-CRC-005593 and USDA MAC APHIS Agreement No. AP19PPQS&T00C116 for funding. The Water and Nutrient Management Lab Team at the Citrus Research and Education Center (CREC) Lake Alfred, FL is thanked for help with data collection and processing.

Conflicts of Interest

The authors declare no conflict of interest.

References

  1. Alva, A.K.; Paramasivam, S.; Hostler, K.H.; Easterwood, G.W.; Southwell, J.E. Effects of nitrogen rates on dry matter and nitrogen accumulation in citrus fruits and fruit yield. J. Plant Nutr. 2001, 24, 561–572. [Google Scholar] [CrossRef]
  2. Alva, A.K. Nitrogen best management practice for citrus trees II. Nitrogen fate, transport, and components of N budget. Sci. Hortic. 2006, 109, 223–233. [Google Scholar] [CrossRef]
  3. Obreza, T.A.; Schumann, A. Keeping Water and Nutrients in the Florida Citrus Tree Root Zone. HortTechnology 2010, 20, 67–73. [Google Scholar] [CrossRef]
  4. Alva, A.K.; Paramasivam, S.; Obreza, T.A.; Schumann, A.W. Nitrogen best management practice for citrus trees: I. Fruit yield, quality, and leaf nutritional status. Sci. Hortic. 2006, 107, 233–244. [Google Scholar] [CrossRef]
  5. Spann, T.M.; Schumann, A.W. The role of plant nutrients in disease development with emphasis on citrus and huanglongbing. Proc. Fla. State Hort. Soc. 2009, 122, 169–171. [Google Scholar]
  6. Pustika, A.B.; Subandiyah, S.; Holford, P.; Beattie, G.A.C.; Iwanami, T.; Masaoka, Y. Interactions between plant nutrition and symptom expression in mandarin trees infected with the disease huanglongbing. Australas. Plant Dis. Notes 2008, 3, 112. [Google Scholar] [CrossRef] [Green Version]
  7. Handique, U.; Ebel, R.C.; Morgan, K.T. Influence of Soil-Applied Fertilizer on Greening Development in New Growth Flushes of Sweet Orange. In Proceedings of the Florida State Horticultural Society, Alexandria, VA, USA, December 2012; pp. 36–39. Available online: https://scholar.google.com/scholar?hl=en&as_sdt=0%2C10&q=Influence+of+soil-applied+fertilizer+on+greening+development+in+new+growth+flushes+of+sweet+orange.&btnG= (accessed on 20 October 2020).
  8. Dordas, C. Role of nutrients in controlling plant diseases in sustainable agriculture. A review. Agron. Sustain. Dev. 2008, 28, 33–46. [Google Scholar] [CrossRef] [Green Version]
  9. Montalvo, D.; Degryse, F.; da Silva, R.C.; Baird, R.; McLaughlin, M.J. Chapter Five-Agronomic Effectiveness of Zinc Sources as Micronutrient Fertilizer. In Advances in Agronomy; Sparks, D.L., Ed.; Academic Press: New York, NY, USA, 2016; Volume 139, pp. 215–267. [Google Scholar]
  10. Halbert, S.E.; Manjunath, K.L. Asian citrus psyllids (Sternorrhyncha: Psyllidae) and greening disease of citrus: A literature review and assessment of risk in Florida. Fla. Entomol. 2004, 87, 330–353. [Google Scholar] [CrossRef]
  11. McLaren, R.G.; Swift, R.S.; Quin, B.F. EDTA-extractable copper, zinc, and manganese in soils of the Canterbury Plains. N. Z. J. Agric. Res. 1984, 27, 207–217. [Google Scholar] [CrossRef] [Green Version]
  12. Zekri, M.; Obreza, T.A. Micronutrient Deficiencies in Citrus: Iron, Zinc, and Manganese; Elec. Data Info. Source, SL204; University of Florida Institute of Food and Agricultural Sciences: Gainesville, FL, USA, 2003; pp. 1–3. [Google Scholar]
  13. Obreza, T.; Morgan, K. Nutrition of Florida Citrus Trees; Elec. Data Info. Source, SL253; University of Florida Institute of Food and Agricultural Sciences: Gainesville, FL, USA, 2008. [Google Scholar]
  14. Morgan, K.T.; Rouse, R.E.; Ebel, R.C. Foliar Applications of Essential Nutrients on Growth and Yield of ‘Valencia’ Sweet Orange Infected with Huanglongbing. HortScience 2016, 51, 1482–1493. [Google Scholar] [CrossRef]
  15. Atta, A.A.; Morgan, K.T.; Hamido, S.A.; Kadyampakeni, D.M. Effect of Essential Nutrients on Roots Growth and Lifespan of Huanglongbing Affected Citrus Trees. Plants 2020, 9, 483. [Google Scholar] [CrossRef] [Green Version]
  16. Atta, A.A.; Morgan, K.T.; Hamido, S.A.; Kadyampakeni, D.M.; Mahmoud, K.A. Water and soil nutrient dynamics of huanglongbing-affected citrus trees as impacted by ground-applied nutrients. Agronomy 2020, 10, 1485. [Google Scholar] [CrossRef]
  17. Descriptions, O.S.S. Natural Resources Conservation Service, United States Department of Agriculture. Electronic Document. 2012. Available online: https://scholar.google.com/scholar?lookup=0&q=Descriptions,+O.S.S.+Natural+Resources+Conservation+Service,+United+States+Department+of+Agriculture.+Electronic+Document%3B+2012.&hl=en&as_sdt=0,10 (accessed on 20 October 2020).
  18. Bouyoucos, G.J. Directions for making mechanical analyses of soils by the hydrometer method. Soil Sci. 1936, 42, 225–230. [Google Scholar] [CrossRef]
  19. Schofield, R.K.; Taylor, A.W. The Measurement of Soil pH. Soil Sci. Soc. Am. J. 1955, 19, 164–167. [Google Scholar] [CrossRef]
  20. Nelson, D.W.; Sommers, L.E. Total Carbon, Organic Carbon, and Organic Matter. In Agronomy Monographs; American Society of Agronomy, Soil Science Society of America: Madison, WI, USA, 2015; pp. 539–579. [Google Scholar] [CrossRef]
  21. Blake, G.R.; Hartge, K.H. Bulk Density. In SSSA Book Series; Soil Science Society of America, American Society of Agronomy: Madison, WI, USA, 2018; pp. 363–375. [Google Scholar] [CrossRef]
  22. Uthman, Q.O.; Kadyampakeni, D.M.; Nkedi-Kizza, P. Manganese adsorption, availability, and uptake in citrus under microsprinkler irrigation. Agrosyst. Geosci. Environ. 2020, 3. [Google Scholar] [CrossRef]
  23. Uthman, Q.O.; Kadyampakeni, D.M.; Nkedi-Kizza, P. Boron availability and uptake in huanglongbing-affected citrus trees on a Florida entisol. J. Plant Nutr. 2020, 43, 1248–1258. [Google Scholar] [CrossRef]
  24. Kadyampakeni, D.M.; Morgan, K.T.; Schumann, A.W.; Nkedi-Kizza, P. Effect of irrigation pattern and timing on root density of young citrus trees infected with Huanglongbing disease. HortTechnology 2014, 24, 209–221. [Google Scholar] [CrossRef]
  25. Gambrell, R.P. Manganese. In SSSA Book Series; Soil Science Society of America, American Society of Agronomy: Madison, WI, USA, 2018; pp. 665–682. [Google Scholar] [CrossRef]
  26. Hanlon, E.; Gonzalez, J.; Bartos, J. IFAS Extension Soil Testing Laboratory (ESTL) and Analytical Research Laboratory (ARL) Chemical Procedures and Training Manual. 2002. Available online: https://scholar.google.com/scholar?hl=en&as_sdt=0%2C10&q=Extension+Soil+Testing+Laboratory+%28ESTL%29+and+Analytical+Research+Laboratory+%28ARL%29+Chemical+Procedures+and+Training+Manual&btnG= (accessed on 20 October 2020).
  27. Harbridge, J. Determination of Nitrate in 2M KCl Soil Extracts by Flow Injection Analysis QuikChem Method 12-107-04-1-J.; Lachat Instruments: Loveland, CO, USA, 2007; Available online: https://scholar.google.com/scholar?hl=en&as_sdt=0%2C10&q=Determination+of+nitrate+in+2M+KCl+soil+extracts+by+flow+injection+analysis+QuikChem+Method&btnG= (accessed on 20 October 2020).
  28. Obreza, T.A.; Rouse, R.E. Fertilizer Effects on Early Growth and Yield of ‘Hamlin’ Orange Trees. HortScience 1993, 28, 111–114. [Google Scholar] [CrossRef] [Green Version]
  29. Wardowski, W.F. Florida Citrus Quality Tests; UF/IFAS Extension: Gainesville FL, USA, 1991. [Google Scholar]
  30. Pinheiro, J.C.; Bates, D.M. Mixed-Effects Models in Sand S-PLUS. In Statistics and Computing; Springer: New York, NY, USA, 2000. [Google Scholar] [CrossRef]
  31. Team, R.C. R: A Language and Environment for Statistical Computing; Vienna, Austria. 2013. Available online: http://cran.univ-paris1.fr/web/packages/dplR/vignettes/intro-dplR.pdf (accessed on 20 October 2020).
  32. Harris, W.G.; Carlisle, V.W.; Chesser, S.L. Clay Mineralogy as Related to Morphology of Florida Soils with Sandy Epipedons. Soil Sci. Soc. Am. J. 1987, 51, 1673–1677. [Google Scholar] [CrossRef]
  33. Hippler, F.W.R.; Boaretto, R.M.; Quaggio, J.A.; Azevedo, R.A.; Mattos, D. Towards soil management with Zn and Mn: Estimates of fertilisation efficacy ofCitrustrees. Ann. Appl. Biol. 2015, 166, 484–495. [Google Scholar] [CrossRef]
  34. Marschner, H. Zinc Uptake from Soils. In Zinc in Soils and Plants; Springer: Dordrecht, The Netherlands, 1993; pp. 59–77. [Google Scholar] [CrossRef]
  35. Havlin, J.L.; Beaton, J.D.; Tisdale, S.L.; Nelson, W.L. Soil Fertility and Fertilizers: An Introduction to Nutrient Management; Pearson Prentice Hall: Upper Saddle River, NJ, USA, 2005; Volume 515. [Google Scholar]
  36. Bukovac, M.J.; Wittwer, S.H. Absorption and Mobility of Foliar Applied Nutrients. Plant Physiol. 1957, 32, 428–435. [Google Scholar] [CrossRef] [PubMed] [Green Version]
  37. Wittwer, S.H.; Teubner, F.G. Foliar Absorption of Mineral Nutrients. Annu. Rev. Plant Physiol. 1959, 10, 13–30. [Google Scholar] [CrossRef]
  38. Swanson, C.A.; Whitney, J.B. Studies on the translocation of foliar-applied p32 and other radioisotopes in bean plants. Am. J. Bot. 1953, 40, 816–823. [Google Scholar] [CrossRef]
  39. Wallihan, E.F.; Heymann-Herschberg, L. Some Factors Affecting Absorption and Translocation of Zinc in Citrus Plants. Plant Physiol. 1956, 31, 294–299. [Google Scholar] [CrossRef] [Green Version]
  40. Gomes, M.H.F.; Machado, B.A.; Rodrigues, E.S.; Montanha, G.S.; Rossi, M.L.; Otto, R.; Linhares, F.S.; Carvalho, H.W.P. In Vivo Evaluation of Zn Foliar Uptake and Transport in Soybean Using X-ray Absorption and Fluorescence Spectroscopy. J. Agric. Food Chem. 2019, 67, 12172–12181. [Google Scholar] [CrossRef]
  41. Rouse, R.E.; Ozores-Hampton, M.; Roka, F.M.; Roberts, P. Rehabilitation of Huanglongbing-affected Citrus Trees Using Severe Pruning and Enhanced Foliar Nutritional Treatments. HortScience 2017, 52, 972–978. [Google Scholar] [CrossRef] [Green Version]
  42. Quaggio, J.A.; Mattos, D.; Cantarella, H. Fruit yield and quality of sweet oranges affected by nitrogen, phosphorus and potassium fertilization in tropical soils. Fruits 2006, 61, 293–302. [Google Scholar] [CrossRef]
Figure 1. Soil NO 3 -N distribution in a Florida sandy soil after application of three levels of nitrogen in irrigated (A) and non-irrigated (B) zones at 0–15, 15–30, 30–45 and 45–60 cm soil depths for three replicates. Treatments: control—standard soil Zn applied; foliar x1—standard soil Zn applied + foliar-applied Zn based at 1× UF/IFAS recommendations; foliar x2—2× foliar-applied Zn at UF/IFAS recommendations + standard soil Zn application; soil x1—2× soil-applied UF/IFAS recommendations (5.60 kg Zn ha−1).
Agriculture 10 00489 g001
Figure 2. Soil NH 4 + -N distribution in a Florida sandy soil after application of three levels of nitrogen in irrigated (A) and non-irrigated (B) zones at 0–15, 15–30, 30–45 and 45–60 cm soil depths for three replicates. Treatments: control—standard soil Zn applied; foliar x1—standard soil Zn applied + foliar-applied Zn based at 1× UF/IFAS recommendations; foliar x2—2× foliar-applied Zn at UF/IFAS recommendations + standard soil Zn application; soil x1—2× soil-applied UF/IFAS recommendations (5.60 kg Zn ha−1).
Agriculture 10 00489 g002
Figure 3. Leaf Zn concentration at six sampling dates by treatments with standard error bars (n = 9). Treatments: control—standard soil Zn applied; foliar x1—standard soil Zn applied + foliar-applied Zn based at 1× UF/IFAS recommendations; foliar x2—2× foliar-applied Zn at UF/IFAS recommendations + standard soil Zn application; soil x1—2× soil-applied UF/IFAS recommendations (5.60 kg Zn ha−1).
Agriculture 10 00489 g003
Figure 4. Canopy volume of HLB-affected trees treated with different levels of N (A) [n = 12] and Zn (B) [n = 9] with standard error bars. Treatments: control—standard soil Zn applied; foliar x1—standard soil Zn applied + foliar-applied Zn based at 1× UF/IFAS recommendations; foliar x2—2× foliar-applied Zn at UF/IFAS recommendations + standard soil Zn application; soil x1—2× soil-applied UF/IFAS recommendations (5.60 kg Zn ha−1).
Agriculture 10 00489 g004
Figure 5. Trunk diameter of HLB-affected trees treated with different levels of nitrogen (A) [n = 12] and Zn (B) [n = 9] with standard error bars. Treatments: control—standard soil Zn applied; foliar x1—standard soil Zn applied + foliar-applied Zn based at 1× UF/IFAS recommendations; foliar x2—2× foliar-applied Zn at UF/IFAS recommendations + standard soil Zn application; soil x1—2× soil-applied UF/IFAS recommendations (5.60 kg Zn ha−1).
Agriculture 10 00489 g005
Figure 6. Juice quality assessment [Total brix (A), Total acid (B), and Ratio (C)] of “Valencia” sweet oranges for in 2018, 2019 and 2020. Treatments: control—standard soil Zn applied; foliar x1—standard soil Zn applied + foliar-applied Zn based at 1× UF/IFAS recommendations; foliar x2—2× foliar-applied Zn at UF/IFAS recommendations + standard soil Zn application; soil x1—2× soil-applied UF/IFAS recommendations (5.60 kg Zn ha−1).
Agriculture 10 00489 g006aAgriculture 10 00489 g006b
Figure 7. Negative correlation of soil NO 3 -N to fruit weight.
Agriculture 10 00489 g007
Table 1. Soil physical and chemical properties and sorption coefficient by depth.
Soil DepthSoil TextureBulk DensitySoil pHOrganic Matter KD
(cm)Sand (%)Silt (%)Clay (%)g cm−3 (%)L kg−1
0–1595.90.53.71.56 ± 0.036.27 ± 0.080.55 ± 0.046.47
15–3096.80.72.51.67 ± 0.056.30 ± 0.120.30 ± 0.022.68
30–4597.10.42.51.61 ± 0.026.31 ± 0.130.21 ± 0.020.05
45–6097.40.62.01.63 ± 0.026.30 ± 0.140.19 ± 0.010.05
KD—Sorption coefficient; for the mean values with standard error, n = 5 for Bulk density and n = 24 for soil pH and organic matter.
Table 2. Soil Zn distribution in the 0–15, 15–30, 30–45, and 45–60 cm sampling depths on 3 sampling dates. ± are standard errors (n = 12).
Zn
Soil Depth, cmControlSoil
Jun-2018_________________mg kg−1_______________
0–1524.7 ± 0.535.7 ± 0.7
15–3010.5 ± 0.68.7 ± 0.3
30–455.1 ± 0.24.7 ± 0.1
45–605.6 ± 0.24.8 ± 0.1
Feb-2019
0–1528.8 ± 0.531.6 ± 0.6
15–3013.9 ± 0.515.2 ± 0.6
30–458.9 ± 0.46.9 ± 0.3
45–606.4 ± 0.44.1 ± 0.1
Sep-2019
0–1523.0 ± 0.674.6 ± 2.6
15–3017.5 ± 0.734.7 ± 1.1
30–4511.2 ± 0.629.5 ± 0.8
45–608.6 ± 0.515.7 ± 0.6
Table 3. Three years of fruit yield of Huanglongbing-affected “Valencia” sweet orange grove with standard error (n = 3) in Lake Alfred, Florida.
Nitrogen Rate, kg ha−1
Treatment168224280
2018____________________t ha−1______________________
Control28.0 ± 0.126.5 ± 0.224.7 ± 0.3
Foliar x126.8 ± 0.324.2 ± 0.129.8 ± 0.3
Foliar x227.9 ± 0.125.3 ± 0.225.3 ± 0.4
Soil x123.9 ± 0.328.5 ± 0.527.3 ± 0.2
2019
Control24.9 ± 0.121.4 ± 0.419.3 ± 0.3
Foliar x121.5 ± 0.320.3 ± 0.419.9 ± 0.2
Foliar x219.7 ± 0.218.2 ± 0.120.7 ± 0.4
Soil x119.9 ± 0.119.4 ± 0.417.3 ± 0.1
2020
Control26.4 ± 0.229.4 ± 0.329.0 ± 0.3
Foliar x129.3 ± 0.028.6 ± 0.228.3 ± 0.5
Foliar x228.6 ± 0.430.3 ± 0.427.5 ± 0.2
Soil x128.1 ± 0.227.9 ± 0.331.3 ± 0.1
Publisher’s Note: MDPI stays neutral with regard to jurisdictional claims in published maps and institutional affiliations.

