1. Introduction
1.1. Motivation
The hot pepper (
Capsicum annuum) is an essential vegetable globally. The FAO (2018) indicates that its production (item; “Chilles and pepper, green”) in the world has steadily increased to approximately 36.8 million tons, up more than 14.4% compared to 2014, and that China and Mexico are the top two hot pepper producing countries in the world [
1]. The production of hot peppers is considerably affected by several factors, such as a long growing period, continuous climate changes, and foreign pests, because of the increased imports of agricultural products.
The use of conventional classification techniques to identify diseases or pests can lead to the incorrect detection of diseases. “Anthracnose”, “bacterial spot” and other hot pepper diseases, can be erroneously judged. The incorrect diagnosis and prescription of diseases and pests can result in crop damage. To address these issues, multi-recognition methods, such as Google Cloud Vision, suggest multiple candidates and allow users to make the final decision. A similarity-based image search (SBIS) technique [
2], along with multi-recognition, can also be used for this purpose. A content-based image retrieval (CBIR) technique was used in many conventional SBISs. CBIR extracts features such as image color and edge using descriptors and outputs a query image by comparing similarities between features. However, owing to the limitation of descriptors in extracting features, the search accuracy of diseases and pests is relatively low compared with that of conventional deep learning-based recognition models.
Conventional deep learning models require a large amount of data and a lot of time and effort to train [
3]. Moreover, issues such as overfitting can arise [
4,
5]. Images of diseases and pests exhibit seasonality, but it is difficult to collect a sufficient amount of accurate disease and pest images because of the lack of experts in this field. Transfer learning techniques [
3] can be used in models trained with a huge amount of data in case of insufficient data or ineffective model training. Transfer learning can be mainly used for either fine-tuning or feature extraction. In this study, to address the lack of disease and pest image data, we extracted the deep features of disease and pest images using pre-trained models.
1.2. Related Work
1.2.1. Single Recognition
Conventional studies on the disease and pest recognition often use single recognition. For example, Ref. [
6] developed a robotic system to detect powdery mildew and tomato spotted wilt virus in greenhouse sweet peppers and reached a recognition accuracy of approximately 85–95%. Francis et al. [
7] recognized hot pepper diseases and pests using a soft computing technique and artificial neural networks (ANNs) and determined the percentage of infection. Wahab et al. [
8] detected the cucumber mosaic virus in hot peppers by combining k-means clustering and a support vector machine algorithm with an accuracy of ~90%. Hossain et al. [
9] recognized five hot pepper diseases and pests (alternala, anthracnose, bacterial blight, canker, and leaf spot) using texture features extracted from leaves and k-nearest neighbors Karadağ et al. [
10] detected a pepper fusarium disease using spectral reflectance and ANN, naïve Bayes, and KNN algorithms. Ferentinos [
11] recognized pepper bacterial spots using approximately 990 images.
Further, many recent disease and pest recognition studies [
12,
13,
14] implemented convolutional neural network (CNN) algorithms on crops such as rice and tomatoes and recorded a recognition accuracy of approximately 90–96%. Yun et al. [
15] combined a probabilistic neural network, leaf images of crops, and weather information to identify three types of cucumber diseases and pests. Deokar et al. [
16] proposed a disease and pest diagnosis system that detects diseases based on diseased parts found on leaves using the k-means clustering algorithm. Johannes et al. [
17] proposed a mobile-based recognition system that was able to recognize three types of wheat diseases and pests with an accuracy of ~80%.
1.2.2. Transfer Learning and Pre-Trained Models
Most machine learning models were built to operate independently; therefore, they need re-training when the data are changed. However, considerable time and effort are required for model re-training. Transfer learning (see
Figure 1) is based on utilizing a pre-trained model with its weights that has been trained on a large dataset. This is so that transfer learning helps in this situation and can solve a task by reusing the knowledge obtained from previous related tasks [
18]. This is so that it can provide a guaranteed solution for a good performance with fewer training samples [
19]. Transfer learning has been actively utilized in research, such as software defect prediction [
20], sentiment classification, activity recognition [
21], etc. Pre-trained models, trained on a huge amount of data such as ImageNet, can be applied to similar tasks and used by updating only some parameters of the model. Therefore, considerable time is saved when training the entire network is not required [
22,
23]. There are two approaches which can be used in transfer learning: feature extraction and fine-tuning [
19,
24]. Feature extraction refers to the values extracted from pre-trained models, and they are called deep features. Fine-tuning is a method of tuning partial weights or changing the partial structure of pre-trained models.
Rangarajan et al. [
25] recognized six types of tomato diseases and pests using the pre-trained AlexNet and VGG16 models and achieved recognition accuracies of 97.29 and 97.49%, respectively. Llorca et al. [
26] recognized tomato diseases and pests using the pre-trained Inception V3 model and recorded an accuracy of 88.9%. Atole et al. [
27] classified the rice status into normal, unhealthy, and snail-infested using the pre-trained AlexNet model and recorded an accuracy of 91.23%. Ramcharan et al. [
28] performed cassava disease detection using the transfer learning technique with a detection accuracy of ~95%. Nsumba et al. [
29] performed cowpea detection using the pre-trained MobileNet model and a small amount of data and recorded an accuracy of ~96%. Wang et al. [
30] recognized the stage (i.e., healthy, early, middle, end) of leaves through the VGG16, VGG19, Inception V3, and Resnet 50 models using transfer learning and reached a 90.4% accuracy with the VGG16 model.
1.2.3. Multi-Recognition and Similarity-Based Image Search
Ferentinos [
11] performed multi-recognition on 58 diseases and pests for 25 types of crops, including apples and cabbage peppers. This study used various models, such as VGG and GoogleNet, and recorded a recognition accuracy of ~99% using the VGG model. Other SBIS studies used the CBIR technique, which finds an image with the most similar feature using image content (e.g., color, shape, texture) features. Marwaha et al. [
31] investigated the diseases and pests of maize by classifying the extracted features using three descriptors, (auto color correlograms, color edge directivity descriptor, and fuzzy color and texture histogram).
Patil et al. [
32] proposed a search system based on the texture features extracted using Gabor and LBP filters and applied it to soybeans. Baquero et al. [
33] proposed a system for detecting seven types of tomato diseases and pests using the KNN algorithm and extracting features from pest images using the color structure descriptor. However, both studies achieved a relatively low search accuracy of ~60%.
Yin et al. [
34] proposed a search system based on the LIRE open library and applied it to eight types of diseases and pests of pears, strawberries, and grapes achieving an accuracy of ~83%. Piao et al. [
35] searched diseases and pests by combining various descriptors provided by LIRE. The best performance was recorded for multiple descriptors; however, the prediction accuracy was rather low (~75–83%) and decreased with the increase in the types of diseases and pests.
1.2.4. Summary
As several existing studies on the recognition of diseases and pests focused on three to ten diseases and pests per crop, the use of these models in actual growing fields is limited. Additionally, although they recorded a high recognition accuracy using the classification technique, they used single recognition to display the result to the user, thus providing an incorrect recognition result. This can be solved by using a multi-recognition or SBIS technique. However, because of descriptor limitations in feature extraction, the search accuracy of existing SBIS studies using CBIR is relatively low. Therefore, using features extracted from deep learning models is necessary. Studies using transfer learning for the recognition of crop diseases and pests recorded a high recognition accuracy of up to 97.49%, indicating that this technique can be effectively used in multiple domains when the number of disease and pest images is insufficient [
36]. So far, there are no studies that recognize diseases or pests by using search methods with deep features of transfer learning. Therefore, in this study, we propose a method of applying the deep features extracted from pre-trained models to the search of disease and pests of hot peppers and examine the possibility of recognizing them with the proposed search method.
2. Materials and Methods
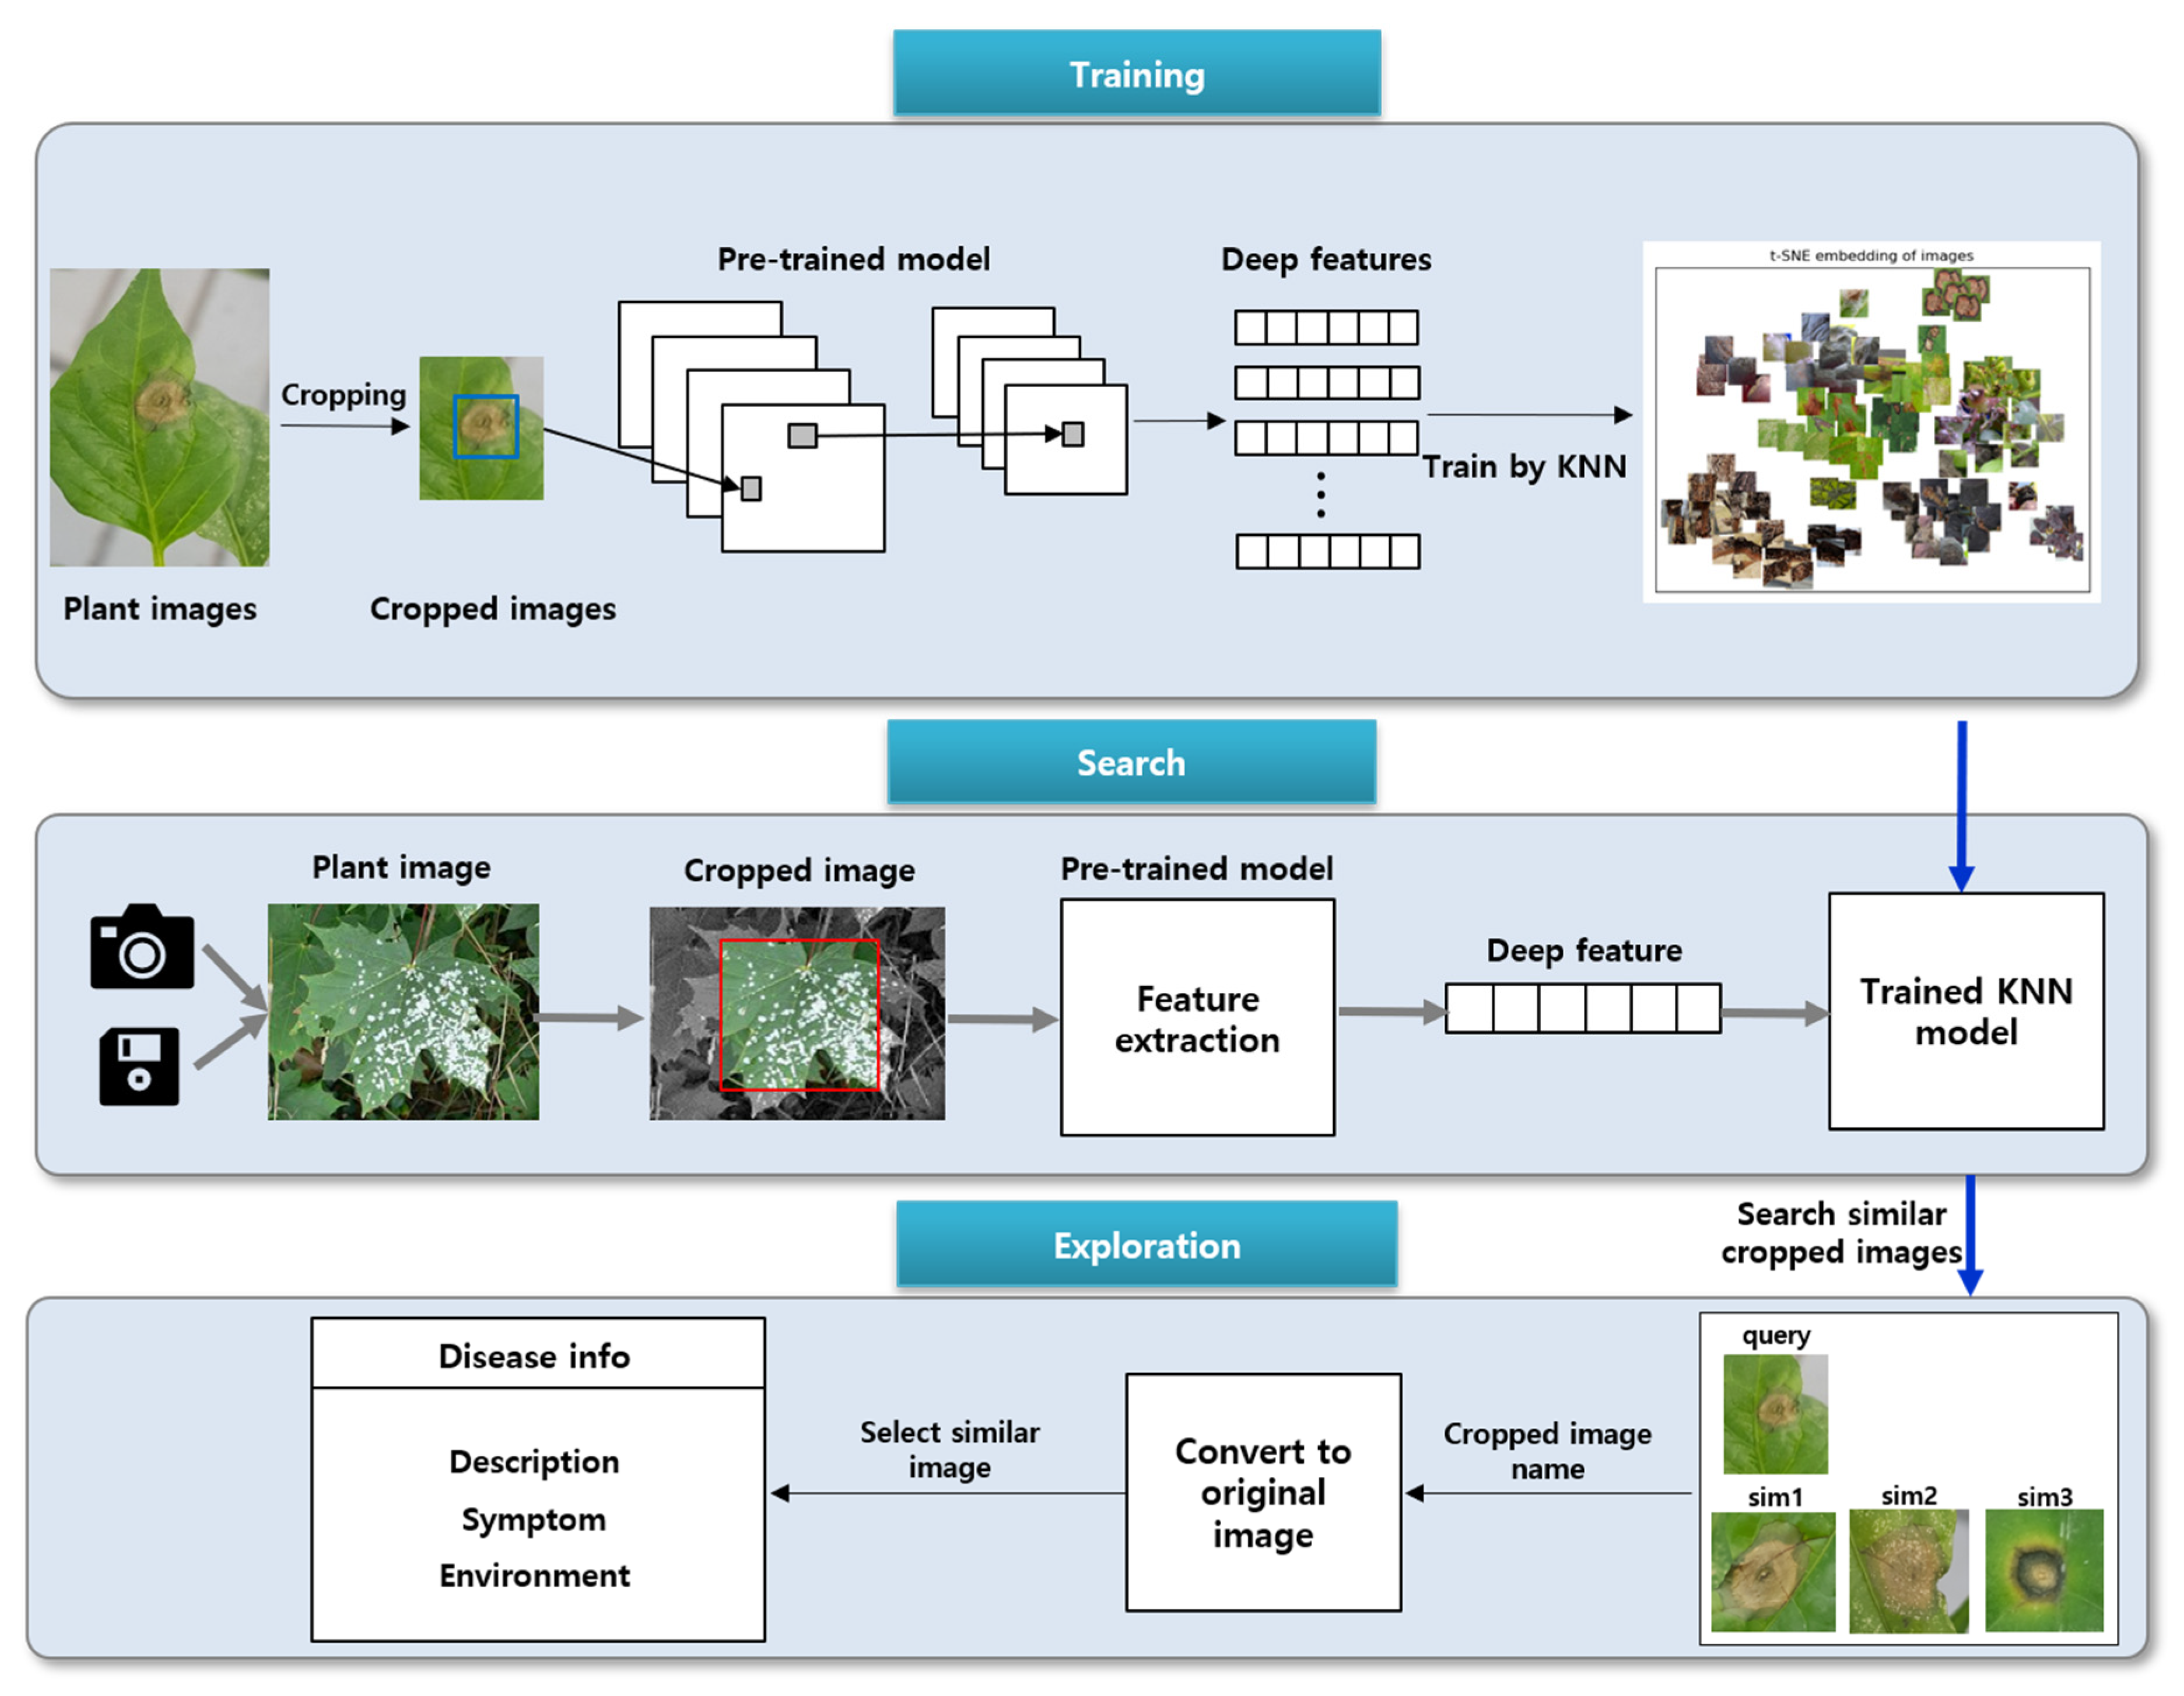
The proposed method mainly involves three stages: training, search, and exploration. The architecture of the method is illustrated in
Figure 2.
During the training process, the deep features of disease and pest images are extracted by pre-trained models trained on the ImageNet data. Next, the extracted features are applied to the KNN model. KNN is a supervised learning algorithm, which typically makes the final decision by majority voting using the information of the nearest k neighbors among the existing data.
Here, the KNN algorithm does not use the original disease and pest image but rather the cropped image containing the disease area. During the searching stage, cropping is performed on the original image, and the deep features of the cropped image are extracted using the pre-trained models. The extracted deep features are inputted into the trained KNN model and the most similar k vectors in the vector space are selected. Each vector refers to the cropped image.
Finally, during the exploration process, the original images are outputted to the user. The user confirms the information of the relevant disease or pest and selects the disease/pest image most similar to the query image.
2.1. Image Cropping
The original images were cropped to size of 128 × 128 (see
Figure 3), and the cropped image with the diseased part was used. Image cropping has an advantage of speeding up image search and improving recognition accuracy [
37,
38]. Disease and pest images also underwent the cropping process because the diseased section occupies only part of the image. The user crops the images manually in the proposed model to ensure disease selection is as accurate as possible. The cropping process was conducted by the plant experts.
2.2. Deep Feature Extraction Using Pre-Trained Models
Strategies using the transfer learning technique are mainly divided into deep feature extraction and fine-tuning. This way, deep features are extracted using pre-trained models, such as Resnet 50 [
39] and VGG 16 [
40], which have been trained on a huge number of datasets (e.g., ImageNet). In this study, we extracted deep features from eight pre-trained models: Resnet50, VGG16, VGG19, Xception [
41], Inception V3 [
42], MobileNet [
43], Inception V4 [
44], and DenseNet [
45]. The deep features extracted from each pre-trained model were applied to the search of hot pepper diseases and pests to measure the model performance.
The ImageNet data-based pre-trained models used were classified into 1000 classes. Therefore, we modified the structure of the pre-trained models because we could not directly use them for disease and pest search.
Figure 4 shows the structure of the deep feature extractor used in this study. We removed the classification layer, including the fully connected and softmax layers from the pre-trained models. We extracted the deep features of the disease and pest images by transferring parameters from the convolution layers of the pre-trained models. The dimensions of the extracted deep features differ depending on the pre-trained model. For example, 512 deep features were outputted by MobileNet, and 2048 deep features were outputted by Resnet 50. The extracted deep features are represented in the vector space using the KNN model.
2.3. Similar Image Search Using KNN
In this study, we used the KNN algorithm to search the images with the highest similarity to the disease image inputted by the user.
The important components of the KNN algorithm are the k-value and distance function. Here, k is the number of nearest neighbors for reference. For example, when k = 3, the information of three instances nearest to the input data is considered. The performance of the KNN model varies depending on the k value; therefore, appropriately selecting the k-value is essential. The same applies to the distance function that calculates the distance between instances. There are many distance functions, such as Euclidean distance and cosine similarity. Some distance functions can handle high-dimensional data or reduce the calculation speed; therefore, the use of a suitable distance function can improve the performance of the model. In this study, we used the Bray–Curtis dissimilarity [
46], commonly used in the fields of ecology and environmental science, as a metric to measure the distance between instances. The Bray–Curtis dissimilarity between two vectors A and B of length N is calculated in Equation (1). Its value range is (0, 1); the closer it is to 0, the more similar the vectors are.
In this study, we used a tree-based algorithm to effectively handle high-level deep features. We built a KNN model by using the ball-tree algorithm that can be adjusted to the structure of the expressed data and can effectively handle high-dimensional data [
47,
48]. During classification, the KNN algorithm selects one class through majority voting by referring to k close instances. However, because this study performs a search not a classification, the algorithm returns the k instances and distances nearest to the input data through the k-value without using majority voting.
2.4. Algorithm
The design process of the proposed model and the searching process using the pseudocode are shown in Algorithms 1 and 2. The model receives the cropped image as input and outputs the disease/pest images most similar to the query image. This process consists of modeling and searching.
As seen in Algorithm 1, modeling extracts deep features of all disease datasets and applies them to the KNN model. Here, deep features are extracted from the pre-trained models trained on the ImageNet dataset. Pre-trained models’ input size should be considered, “target_size”, i.e., the size of the input image, was set to (224, 224) or (299, 299). Next, the loaded image is converted into an array format, which is inputted to the pre-trained models to output the deep features. The deep features are extracted from the entire disease and pest images. Then, the KNN algorithm is modeled using the deep features, and the trained KNN model is saved.
During searching, the trained KNN model is loaded, and the disease and pest images most similar to the deep feature of the query image are outputted (see Algorithm 2). As with the modeling step, the query image is loaded as “target_size” (224, 224) or (299, 299) and converted to an array format, which is inputted to the pre-trained model to extract the deep feature. Thus, the extracted feature is inputted into the pre-trained KNN model, and the distances of the N data most similar to the deep feature and the index of the data are returned. This explains why the data become more similar as the distance between them gets shorter. Therefore, the distance values are sorted in ascending order.
| Algorithm 1. Pseudocode of modeling. |
Input: all cropped disease images of database Output: trained KNN model Algorithm: modeling Begin {Resnet 50, VGG16, VGG19, Xception, Inception, Inception v4, DenseNet, MobileNet}; image_to_array() # convert image to array pre_trained model.predict() # get deep feature from input image all disease dataset # 34 types of hot pepper diseases and pests X = []; # list of deep features knn = KNN(); for pre_trained model in pre_trained models: for img_file in all disease dataset: file_name = name(img_file); # get file name Img = load_img(file_name, target_size= target size); Img = image_to_array(img); feature = pre_trained model.predict(img).flatten(); X.append(feature); knn.compile(neighbors, algorithm = “ball_tree”, metric = “braycurtis”); knn.fit(X); # modeling the knn save(knn); # save trained knn model to local End
|
| Algorithm 2. Pseudocode of searching. |
Input: cropped image Output: disease and pest images most similar to the deep feature of the query image Algorithm: searching Begin Load trained KNN as knn Query image q distance list = [] # The list of distance with query image index_list = [] # The index list of searched images q = load_img(q, target_size=target size) q_Img = image_to_array(q) # convert image to array feature = pre_trained model.predict(q_Img).flatten() # deep feature distance list, index_list = knn.predict(feature) # sorting results by distance ASC End
|
2.5. Dataset Description
In this study, we used hot pepper (
Capsicum annuum) disease and pest images provided by the National Institute of Horticultural and Herbal Science. Sample images are shown in
Figure 5. The original images were cropped to a size of 128 × 128 (see
Figure 3), and only the cropped image with the diseased part was used. As summarized in
Table 1 and
Table 2, there are a total of 15 classes in the hot pepper disease, and 17,623 cropped images were generated from total of 1977 original images. Additionally, in the hot pepper pest, 10,388 cropped images were generated from total 2621 original images in 19 classes. The cropping process was conducted by plant experts.
2.6. Experimental Process
In this study, we used the deep features extracted from pre-trained models and outputted the N disease/pest images most similar to the query image via the KNN method. To extract deep features, we used 8 pre-trained models: Resnet50, VGG16, VGG19, Xception, Inception V3, MobileNet, Inception V4, and DenseNet, and measured the performance of the deep features extracted from each model. In the first experiment, in the top-10 (k = 10) results, we measured the search accuracy when applying the deep features extracted from all pre-trained models to the search system. In the second experiment, in the top-1 to top-5 (k = 1,2,3,4,5) results, we evaluated the performance when using the deep features extracted from the three pre-trained models that recorded the highest search accuracy in the first experiment. In the third experiment, a performance comparison between the proposed model and the CNN classification model was conducted.
2.7. Performance Evaluation of Pre-Trained Models
In this study, we evaluate the performance of the proposed disease and pest search model when applied to hot peppers. The accuracy is the ratio between the number of images related to the query image and the total number of searched images, and it is calculated from Equation (2). Here, “relevant images” refers to the number of disease and pest images that belong to the same class as the query image and “retrieved images” refers to the number of images outputted by the KNN algorithm.
i corresponds to the index number of the input image, and
N refers to the total number of images included in each disease and pest class.
The accuracy of the search model was measured using the deep features extracted from the abovementioned pre-trained models. For each pre-trained model, we extracted deep features from 34 types of hot pepper disease and pest images. We applied the extracted deep features to the KNN model and measured the performance of the search model based on the results of top-1~5 and top-10. The experiment aimed to identify the pre-trained model with the highest search performance for hot pepper diseases and pests. The experimental procedure designed for the top-10 (set k value as 10) results is as follows.
- (1)
All cropped images were used as test data after the KNN model was created.
- (2)
In the entire test image, each query image (cropped image) was inputted into the KNN model, and a total of 10 similar cropped disease and images were searched.
- (3)
Of the 10 cropped images, the first was excluded because it was the same as the inputted query image.
- (4)
From the remaining nine similar images, the accuracy was obtained by calculating the number of images that belonged to the same class as the query image.
In the second experiment, the top-1 to top-5 results were used to measure the accuracy using the 3 pre-trained models that achieved the highest accuracy in the first experiment. In this search method, the results associated with the query are placed in the front, leading to an increase in the model performance. Therefore, the proposed search model measured the performance in the top-1 to top-5 results.
In the third experiment, a performance comparison between the proposed model and the CNN classification model was conducted. In consideration of the need for sufficient data set when training a deep learning model, diseases and pests with fewer than five-hundred cropped images were excluded from this experiment.
3. Results and Discussion
Using the abovementioned research design, we applied the deep features extracted from eight pre-trained models to the image search of hot pepper diseases and pests to measure the recognition accuracy.
Table 3 and
Table 4 summarize the performance measurements of the top-10 results when the pre-trained models were applied to hot pepper diseases and pests, respectively. The experimental results indicate that the Resnet 50, VGG16, and VGG19 models recorded the highest search accuracy for the disease and pest images used in the study. The Resnet 50 model recorded the highest search accuracy for both diseases (85.6%) and pests (93.62%). It is followed by the VGG16 and VGG19 models, which recorded a search accuracy of 79.45 and 79.07% for diseases, respectively. For pests, they achieved a search accuracy of 88.72 and 88.25%, respectively.
In the second experiment, we used the three best performing models (Resnet 50, VGG16, and VGG19) to measure the search accuracy for the top-1 to top-5 results.
Figure 6 shows the performance measurement when the Resnet 50, VGG16, and VGG19 models were applied to hot pepper diseases. The Resnet 50 model has the highest search accuracy of 88.38–93.88% for the top-1 and top-5, respectively. As shown in
Figure 7, the Resnet 50 model recorded the highest search accuracy of 95.38–98.42% for the top-1 and top-5 in pest. As with diseases, the search accuracy is highest for the top-1 results and performance decreases from the top-1 to top-5.
Figure 6 and
Figure 7 indicates that the search accuracy for pests is approximately 5–7% higher than that for diseases. The reason is that pest images are more distinct than disease images because of the more easily distinguishable pests. As seen in
Table 4, some items can be searched with an accuracy of 100%. However, the search accuracy for “helicoverpa assulta” was relatively lower (66.66%) than that for other pests, because most of the corresponding images did not contain pests but the damage caused by pests.
Although the highest accuracy was recorded at top-1, there were still incorrect recognition results. Therefore, by showing multiple candidates we allow the user to make a final decision to avoid such an issue.
Table 5 is a performance comparison table between the proposed method and CNN classification model. The result shows that average accuracy of the proposed method is higher than the CNN model (for diseases: 8.62%, for pest: 14.86%).
Because the deep features were extracted from the pre-trained models trained on big data, such as ImageNet, there was no need for a model training process. Consequently, we were able to save a lot of time and resources. Furthermore, we were able to prevent overfitting that could be caused by insufficient data. Based on the experimental results, we proved that the deep features extracted from the pre-trained models could be used to recognize hot pepper disease and pests. However, further experiments should be conducted on other crops in the future.
4. Conclusions
In this study, we proposed a disease and pest search model using the transfer learning technique and KNN algorithm. In the proposed model, we extracted deep features using pre-trained models trained on the ImageNet dataset. We used eight models, including VGG16, VGG19, and Resnet 50, to extract the deep features. Next, we calculated the similarity between the extracted deep features using the KNN algorithm, and finally outputted several highly similar disease/pest images to the user. In the top-1~top-5 results, the deep features based on the Resnet 50 model showed a performance of 88.38–93.88% for diseases and 95.38–98.42% for pests. When using the deep features extracted from the VGG16 and VGG19 models, we recorded the second and third highest performance, respectively. In the top-10 results, when using the deep features extracted from the Resnet 50 model, we recorded a performance of up to 85.6 and 93.62% for diseases and pests, respectively. As a result of performance comparison between the proposed method and the simple CNN model, the proposed method recorded an 8.62% higher accuracy in diseases and 14.86% higher in pests than the CNN classification model. Since the proposed method is simple, inexpensive, and easy to implement, it could allow farmers to easily detect diseases and pests in hot peppers and potentially other crops.
In this study, we use deep features from pre-trained model on ImageNet dataset. In future work, we will fine-tune the pre-trained model to extract deep features and check the effectiveness.
Author Contributions
Conceptualization, J.-H.P.; data provision, H.Y., Y.H.G.; investigation, H.Y., Y.H.G.; methodology, S.J.Y.; project administration, H.Y.; writing—original draft preparation, C.-J.P., S.J.Y.; writing—review and editing, H.Y., Y.H.G., C.-J.P., J.-H.P. and S.J.Y. All authors have read and agreed to the published version of the manuscript.
Funding
This research was funded by the Institute of Information and Communications Technology Planning and Evaluation (IITP) grant funded by the Korea government (MSIT) (2019-0-00136, Development of AI-Convergence Technologies for Smart City Industry Productivity Innovation).
Conflicts of Interest
The authors declare no conflict of interest.
References
- FAO. 2018 FAOSTAT Oline Database. Available online: http://www.fao.org/faostat/en/#data (accessed on 24 September 2020).
- da Silva Torres, R.; Falcao, A.X. Content-based image retrieval: Theory and applications. RITA 2006, 13, 161–185. [Google Scholar]
- Kaya, A.; Keceli, A.S.; Catal, C.; Yalic, H.Y.; Temucin, H.; Tekinerdogan, B. Analysis of transfer learning for deep neural network based plant classification models. Comput. Electron. Agric. 2019, 158, 20–29. [Google Scholar] [CrossRef]
- Srivastava, N.; Hinton, G.; Krizhevsky, A.; Sutskever, I.; Salakhutdinov, R. Dropout: A simple way to prevent neural networks from overfitting. J. Mach. Learn. Res. 2014, 15, 1929–1958. [Google Scholar]
- Penatti, O.A.; Nogueira, K.; Dos Santos, J.A. Do deep features generalize from everyday objects to remote sensing and aerial scenes domains? In Proceedings of the IEEE Conference on Computer Vision and Pattern Recognition Workshops, Boston, MA, USA, 7–12 June 2015; pp. 44–51. [Google Scholar]
- Schor, N.; Bechar, A.; Ignat, T.; Dombrovsky, A.; Elad, Y.; Berman, S. Robotic disease detection in greenhouses: Combined detection of powdery mildew and tomato spotted wilt virus. IEEE Robot. Autom. Lett. 2016, 1, 354–360. [Google Scholar] [CrossRef]
- Francis, J.; Anoop, B. Identification of leaf diseases in pepper plants using soft computing techniques. In Proceedings of the 2016 Conference on Emerging Devices and Smart Systems (ICEDSS), Namakkal, India, 4–5 March 2016; pp. 168–173. [Google Scholar]
- Wahab, A.H.B.A.; Zahari, R.; Lim, T.H. Detecting diseases in Chilli Plants Using K-Means Segmented Support Vector Machine. In Proceedings of the 2019 3rd International Conference on Imaging, Signal Processing and Communication (ICISPC), Singapore, 27–29 July 2019; pp. 57–61. [Google Scholar]
- Hossain, E.; Hossain, M.F.; Rahaman, M.A. A color and texture based approach for the detection and classification of plant leaf disease using KNN classifier. In Proceedings of the 2019 International Conference on Electrical, Computer and Communication Engineering (ECCE), Cox’s Bazar, Bangladesh, 9 July 2019; pp. 1–6. [Google Scholar]
- Karadağ, K.; Tenekeci, M.E.; Taşaltın, R.; Bilgili, A. Detection of pepper fusarium disease using machine learning algorithms based on spectral reflectance. Sustain. Comput. Inform. Syst. 2019. [Google Scholar] [CrossRef]
- Ferentinos, K.P. Deep learning models for plant disease detection and diagnosis. Comput. Electron. Agric. 2018, 145, 311–318. [Google Scholar] [CrossRef]
- Sladojevic, S.; Arsenovic, M.; Anderla, A.; Culibrk, D.; Stefanovic, D. Deep neural networks based recognition of plant diseases by leaf image classification. Comput. Intell. Neurosci. 2016, 2016. [Google Scholar] [CrossRef] [Green Version]
- Brahimi, M.; Boukhalfa, K.; Moussaoui, A. Deep learning for tomato diseases: Classification and symptoms visualization. Appl. Artif. Intell. 2017, 31, 299–315. [Google Scholar] [CrossRef]
- Lu, Y.; Yi, S.; Zeng, N.; Liu, Y.; Zhang, Y. Identification of rice diseases using deep convolutional neural networks. Neurocomputing 2017, 267, 378–384. [Google Scholar] [CrossRef]
- Yun, S.; Xianfeng, W.; Shanwen, Z.; Chuanlei, Z. PNN based crop disease recognition with leaf image features and meteorological data. Int. J. Agric. Biol. Eng. 2015, 8, 60–68. [Google Scholar]
- Deokar, A.; Pophale, A.; Patil, S.; Nazarkar, P.; Mungase, S. Plant disease identification using content based image retrieval techniques based on android system. Int. Adv. Res. J. Sci. Eng. Technol. 2016, 3, 275–286. [Google Scholar]
- Johannes, A.; Picon, A.; Alvarez-Gila, A.; Echazarra, J.; Rodriguez-Vaamonde, S.; Navajas, A.D.; Ortiz-Barredo, A. Automatic plant disease diagnosis using mobile capture devices, applied on a wheat use case. Comput. Electron. Agric. 2017, 138, 200–209. [Google Scholar] [CrossRef]
- Yang, L.; Hanneke, S.; Carbonell, J. A theory of transfer learning with applications to active learning. Mach. Learn. 2013, 90, 161–189. [Google Scholar] [CrossRef]
- FotsoKamgaGuy, A.; Akram, T.; Bitjoka, L.; Naqvi, S.; Alex, M.M.; Nazeer, M. A deep heterogeneous feature fusion approach for automatic land-use classification. Inf. Sci. 2018, 467, 199–218. [Google Scholar]
- Nam, J.; Fu, W.; Kim, S.; Menzies, T.; Tan, L. Heterogeneous defect prediction. IEEE Trans. Softw. Eng. 2017, 44, 874–896. [Google Scholar] [CrossRef] [Green Version]
- Cook, D.; Feuz, K.D.; Krishnan, N.C. Transfer learning for activity recognition: A survey. Knowl. Inf. Syst. 2013, 36, 537–556. [Google Scholar] [CrossRef] [PubMed] [Green Version]
- Shie, C.-K.; Chuang, C.-H.; Chou, C.-N.; Wu, M.-H.; Chang, E.Y. Transfer representation learning for medical image analysis. In Proceedings of the 2015 37th annual international conference of the IEEE Engineering in Medicine and Biology Society (EMBC), Milan, Italy, 25–29 August 2015; pp. 711–714. [Google Scholar]
- Shin, H.-C.; Roth, H.R.; Gao, M.; Lu, L.; Xu, Z.; Nogues, I.; Yao, J.; Mollura, D.; Summers, R.M. Deep convolutional neural networks for computer-aided detection: CNN architectures, dataset characteristics and transfer learning. IEEE Trans. Med. Imaging 2016, 35, 1285–1298. [Google Scholar] [CrossRef] [Green Version]
- Coulibaly, S.; Kamsu-Foguem, B.; Kamissoko, D.; Traore, D. Deep neural networks with transfer learning in millet crop images. Comput. Ind. 2019, 108, 115–120. [Google Scholar] [CrossRef] [Green Version]
- Rangarajan, A.K.; Purushothaman, R.; Ramesh, A. Tomato crop disease classification using pre-trained deep learning algorithm. Procedia Comput. Sci. 2018, 133, 1040–1047. [Google Scholar] [CrossRef]
- Llorca, C.; Yares, M.E.; Maderazo, C. Image-based pest and disease recognition of tomato plants using a convolutional neural network. In Proceedings of the International Conference Technological Challenges for Better World, Cebu, Philippines, 26–28 March 2018. [Google Scholar]
- Atole, R.R.; Park, D. A multiclass deep convolutional neural network classifier for detection of common rice plant anomalies. Int. J. Adv. Comput. Sci. Appl. 2018, 9, 67–70. [Google Scholar]
- Ramcharan, A.; Baranowski, K.; McCloskey, P.; Ahmed, B.; Legg, J.; Hughes, D.P. Deep learning for image-based cassava disease detection. Front. Plant. Sci. 2017, 8, 1852. [Google Scholar] [CrossRef] [PubMed] [Green Version]
- Nsumba, S.; Mwebaze, E.; Bagarukayo, E.; Maiga, G.; Uganda, K. Automated image-based diagnosis of cowpea diseases. In Proceedings of the AGILE 2018, Lund, Sweden, 12–15 June 2018. [Google Scholar]
- Wang, G.; Sun, Y.; Wang, J. Automatic image-based plant disease severity estimation using deep learning. Comput. Intell. Neurosci. 2017, 2017. [Google Scholar] [CrossRef] [PubMed] [Green Version]
- Marwaha, S.; Chand, S.; Saha, A. Disease diagnosis in Crops using Content based image retrieval. In Proceedings of the 2012 12th International Conference on Intelligent Systems Design and Applications (ISDA), Kochi, India, 27–29 November 2012; pp. 729–733. [Google Scholar]
- Patil, J.K.; Kumar, R. Comparative analysis of content based image retrieval using texture features for plant leaf diseases. Int. J. Appl. Eng. Res. 2016, 11, 6244–6249. [Google Scholar]
- Baquero, D.; Molina, J.; Gil, R.; Bojacá, C.; Franco, H.; Gómez, F. An image retrieval system for tomato disease assessment. In Proceedings of the 2014 XIX Symposium on Image, Signal Processing and Artificial Vision, Armenia, Colombia, 17–19 September 2014; pp. 1–5. [Google Scholar]
- Yin, H.; Da Woon Jeong, Y.H.G.S.J.Y.; Jeon, S.B. A Diagnosis and Prescription System to Automatically Diagnose Pests. In Proceedings of the Third International Conference on Computer Science, Computer Engineering, and Education Technologies (CSCEET2016), Lodz University of Technology, Lodz, Poland, 19–21 September 2016; p. 47. [Google Scholar]
- Piao, Z.; Ahn, H.-G.; Yoo, S.J.; Gu, Y.H.; Yin, H.; Jiang, Z.; Chung, W.H. Performance analysis of combined descriptors for similar crop disease image retrieval. Clust. Comput. 2017, 20, 3565–3577. [Google Scholar] [CrossRef]
- Tan, C.; Sun, F.; Kong, T.; Zhang, W.; Yang, C.; Liu, C. A Survey on Deep Transfer Learning; Springer International Publishing: Cham, Switzerland, 2018; pp. 270–279. [Google Scholar]
- Suh, B.; Ling, H.; Bederson, B.B.; Jacobs, D.W. Automatic thumbnail cropping and its effectiveness. In Proceedings of the 16th Annual ACM Symposium on User Interface Software and Technology, Vancouver, BC, Canada, 2–5 November 2003; pp. 95–104. [Google Scholar]
- Chen, J.; Bai, G.; Liang, S.; Li, Z. Automatic image cropping: A computational complexity study. In Proceedings of the IEEE Conference on Computer Vision and Pattern Recognition, Las Vegas, NV, USA, 27–30 June 2016; pp. 507–515. [Google Scholar]
- He, K.; Zhang, X.; Ren, S.; Sun, J. Deep residual learning for image recognition. In Proceedings of the IEEE Conference on Computer Vision and Pattern Recognition, Las Vegas, NV, USA, 27–30 June 2016; pp. 770–778. [Google Scholar]
- Simonyan, K.; Zisserman, A. Very deep convolutional networks for large-scale image recognition. arXiv 2014, arXiv:1409.1556. [Google Scholar]
- Chollet, F. Xception: Deep learning with depthwise separable convolutions. In Proceedings of the IEEE Conference on Computer Vision and Pattern Recognition, Honolulu, HI, USA, 21–26 July 2017; pp. 1251–1258. [Google Scholar]
- Szegedy, C.; Vanhoucke, V.; Ioffe, S.; Shlens, J.; Wojna, Z. Rethinking the inception architecture for computer vision. In Proceedings of the IEEE Conference on Computer Vision and Pattern Recognition, Las Vegas, NV, USA, 27–30 June 2016; pp. 2818–2826. [Google Scholar]
- Howard, A.G.; Zhu, M.; Chen, B.; Kalenichenko, D.; Wang, W.; Weyand, T.; Andreetto, M.; Mobilenets, H.A. Efficient convolutional neural networks for mobile vision applications. arXiv 2017, arXiv:1704.04861. [Google Scholar]
- Szegedy, C.; Ioffe, S.; Vanhoucke, V.; Alemi, A. Inception-v4, inception-resnet and the impact of residual connections on learning. arXiv 2016, arXiv:1602.07261. [Google Scholar]
- Huang, G.; Liu, Z.; Van Der Maaten, L.; Weinberger, K.Q. Densely connected convolutional networks. In Proceedings of the IEEE Conference on Computer Vision and Pattern Recognition, Honolulu, HI, USA, 21–26 July 2017; pp. 4700–4708. [Google Scholar]
- Bray, J.R.; Curtis, J.T. An ordination of the upland forest communities of southern Wisconsin. Ecol. Monogr. 1957, 27, 326–349. [Google Scholar] [CrossRef]
- Rajani, N.F.N.; McArdle, K.; Dhillon, I. Parallel k nearest neighbor graph construction using tree-based data structures. In Proceedings of the 1st High Performance Graph Mining Workshop, Hilton, Sydney, Australia, 10 August 2015; Volume 1, pp. 3–11. [Google Scholar]
- Bentley, J.L. Multidimensional binary search trees used for associative searching. Commun. ACM 1975, 18, 509–517. [Google Scholar] [CrossRef]
© 2020 by the authors. Licensee MDPI, Basel, Switzerland. This article is an open access article distributed under the terms and conditions of the Creative Commons Attribution (CC BY) license (http://creativecommons.org/licenses/by/4.0/).


