The Relationship between Cognitive and Emotional Factors and Healthcare and Medication Use in People Experiencing Pain: A Systematic Review

 , , ,
, , ,  , , ,
, , ,  , ,
, ,
Abstract
1. Introduction
2. Methods
2.1. Protocol and Registration
2.2. Search Strategy
2.3. Eligibility Criteria
2.4. Study Selection
2.5. Data Extraction
2.6. Risk of Bias Assessment
2.7. Data Synthesis
3. Results
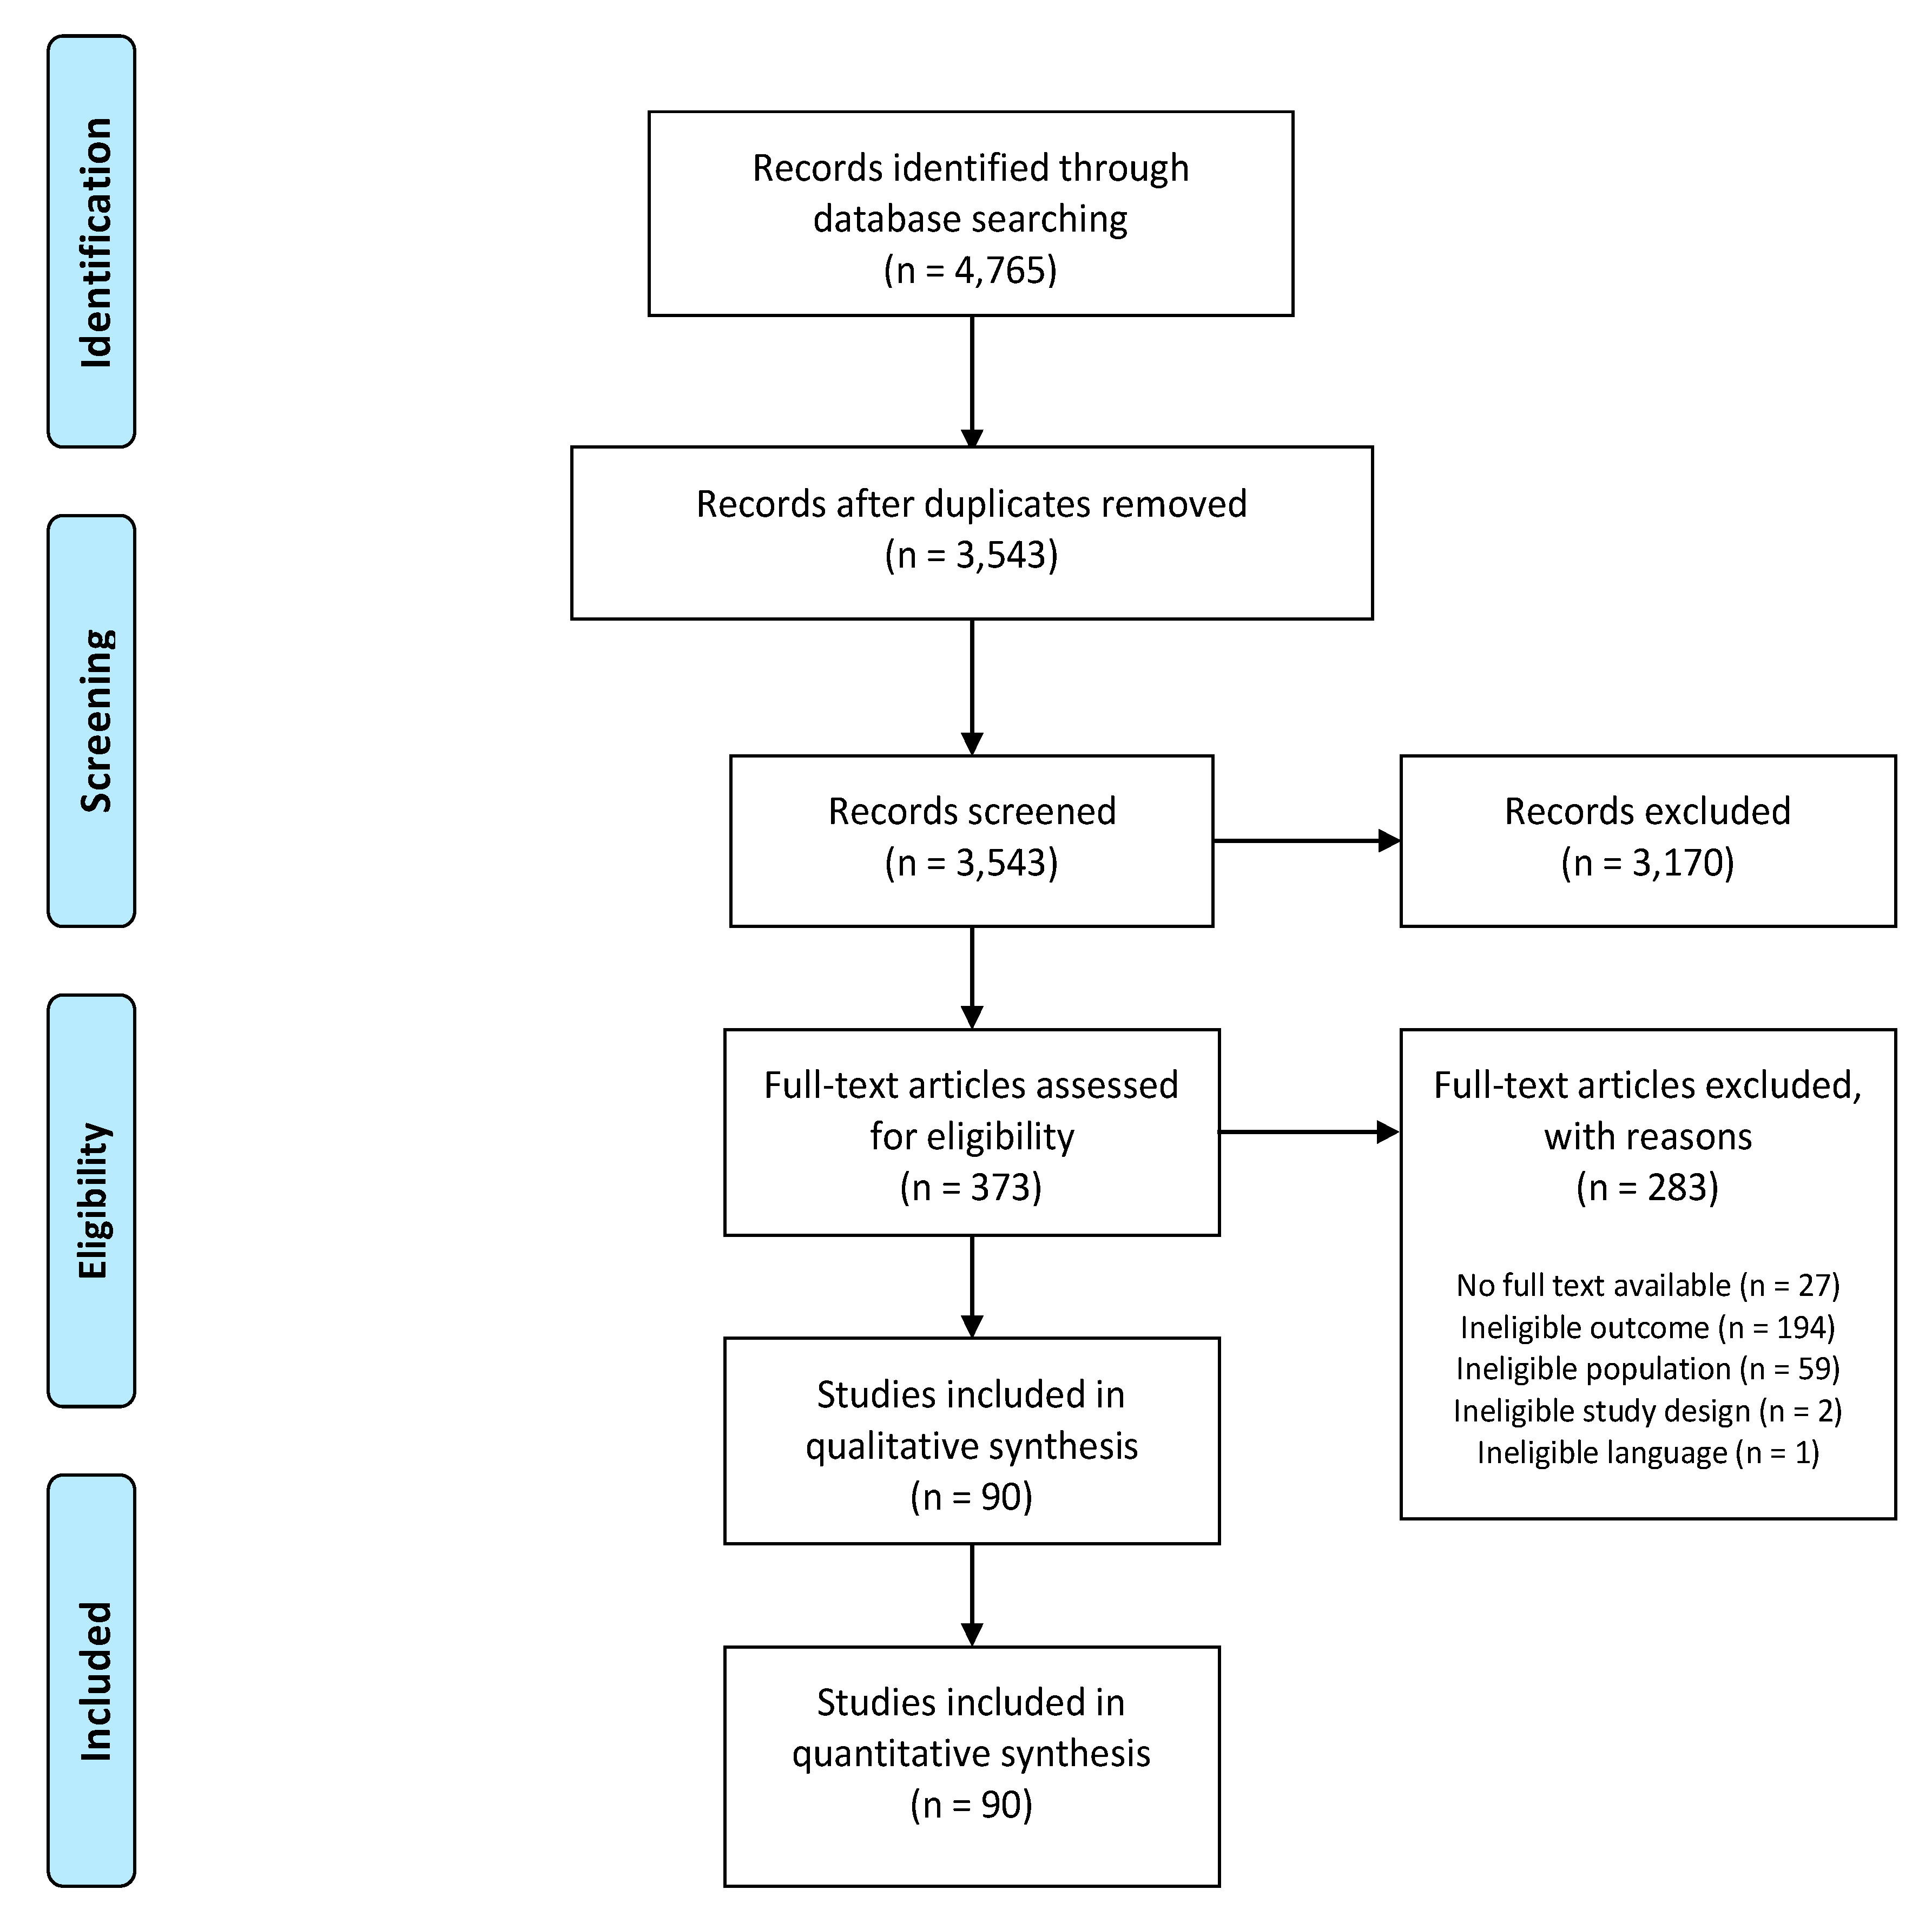
3.1. Study Selection
3.2. Study Characteristics
3.3. Risk of Bias Assessment
3.4. Evidence for Associations between CEF and HCU in People Experiencing Pain
3.4.1. Associations between CEF and Amount of HCU in People Experiencing Pain
3.4.2. Associations between CEF and Type of HCU in People Experiencing Pain
4. Discussion
4.1. Discussion of the Results
4.1.1. Summary of the Results
4.1.2. Discussion of Confirmed Associations
4.2. Directions for Future Research
4.3. Implications for Clinical Practice
4.4. Strengths and Limitations
5. Conclusions
Supplementary Materials
Author Contributions
Funding
Acknowledgments
Conflicts of Interest
Appendix A

| Search Terms | #Hits in PubMed (Date of Search) | |
|---|---|---|
| Population | ||
| * | Pain | 726,663 (27 April 2018) |
| Outcome 1: CEF | ||
| “anxiety” [MeSH terms] | ||
| “catastrophization” [MeSH terms] | ||
| “pain perception” [MeSH terms] | ||
| “acceptance” | ||
| “anger” | ||
| “anxiety” | ||
| “attention to pain” | ||
| “attitude” | ||
| “attribution” | ||
| “attributions” | ||
| “catastrophic thinking” | ||
| “catastrophisation” | ||
| “catastrophising” | ||
| “catastrophization” | ||
| “catastrophizing” | ||
| “depressive symptoms” | ||
| “depressive thoughts” | ||
| “emotional stress” | ||
| “fear of movement” | ||
| “fear of pain” | ||
| “hypervigilance” | ||
| “illness belief” | ||
| “illness beliefs” | ||
| “illness cognition” | ||
| “illness cognitions” | ||
| “illness perception” | ||
| “illness perceptions” | ||
| “kinesiophobia” | ||
| “mental stress” | ||
| “mind set” | ||
| “mindset” | ||
| “pain attention” | ||
| “pain awareness” | ||
| “pain belief” | ||
| “pain beliefs” | ||
| “pain catastrophisation” | ||
| “pain catastrophising” | ||
| “pain catastrophization” | ||
| “pain catastrophizing” | ||
| “pain cognition” | ||
| “pain cognitions” | ||
| “pain perception” | ||
| “pain perceptions” | ||
| “pain-related stress” | ||
| “pain thoughts” | ||
| “pain vigilance” | ||
| “pain vigilant” | ||
| “perceived injustice” | ||
| “psychological stress” | ||
| “psychosocial” | ||
| “resilience” | ||
| “rumination” | ||
| “self-compassion” | ||
| “self-efficacy” | ||
| “somatisation” | ||
| “somatization” | ||
| “Tampa scale” | ||
| “vigilance to pain” | ||
| * | ((((((((((((((((((((((((((((((((((((((((((((((((((((((((((“anxiety” [MeSH terms]) OR “pain perception” [MeSH terms]) OR “catastrophization” [MeSH terms]) OR “pain attention”) OR “attention to pain”) OR “pain awareness”) OR “vigilance to pain”) OR “pain vigilant”) OR “hypervigilance”) OR “pain vigilance”) OR “catastrophisation”) OR “catastrophization”) OR “catastrophising”) OR “catastrophizing”) OR “catastrophic thinking”) OR “pain catastrophisation”) OR “pain catastrophization”) OR “pain catastrophising”) OR “pain catastrophizing”) OR “fear of movement”) OR “kinesiophobia”) OR “Tampa scale”) OR “illness cognitions”) OR “illness cognition”) OR “illness belief”) OR “illness beliefs”) OR “illness perception”) OR “illness perceptions”) OR “anxiety”) OR “fear of pain”) OR “psychosocial”) OR “attitude”) OR “pain belief”) OR “pain beliefs”) OR “pain perception”) OR “pain perceptions”) OR “pain cognition”) OR “pain cognitions”) OR “pain thoughts”) OR “self-efficacy”) OR “attribution”) OR “attributions”) OR “resilience”) OR “mindset”) OR “mind set”) OR “acceptance”) OR “self-compassion”) OR “anger”) OR “rumination”) OR “perceived injustice”) OR “depressive thoughts”) OR “mental stress”) OR “psychological stress”) OR “emotional stress”) OR “pain-related stress”) OR “somatization”) OR “somatisation”) OR “depressive symptoms”) | 783,679 (27 April 2018) |
| Outcome 2: HCU | ||
| “delivery of health care/utilization” [MeSH terms] | ||
| “health care costs” [MeSH terms] | ||
| “ambulatory care cost” | ||
| “ambulatory care costs” | ||
| “ambulatory care delivery” | ||
| “ambulatory care expenditure” | ||
| “ambulatory care use” | ||
| “ambulatory care utilization” | ||
| “care trajectories” | ||
| “care trajectory” | ||
| “continuity of care” | ||
| “cost of drugs” | ||
| “cost of health care” | ||
| “cost of healthcare” | ||
| “delivery of drugs” | ||
| “delivery of health care” | ||
| “delivery of health services” | ||
| “delivery of healthcare” | ||
| “doctor shopping” | ||
| “drug cost” | ||
| “drug costs” | ||
| “drug delivery” | ||
| “drug expenditure” | ||
| “drug spending” | ||
| “drug use” | ||
| “drug utilisation” | ||
| “drug utilization” | ||
| “health care cost” | ||
| “health care costs” | ||
| “health care delivery” | ||
| “health care expenditure” | ||
| “health care savings” | ||
| “health care seeking behavior” | ||
| “health care seeking behaviour” | ||
| “health care service costs” | ||
| “health care service delivery” | ||
| “health care service seeking behavior” | ||
| “health care service use” | ||
| “health care service utilisation” | ||
| “health care service utilization” | ||
| “health care services delivery” | ||
| “health care services utilisation” | ||
| “health care services utilization” | ||
| “health care spending” | ||
| “health care use” | ||
| “health care utilisation” | ||
| “health care utilization” | ||
| “health seeking behavior” | ||
| “health seeking behaviour” | ||
| “health service delivery” | ||
| “health service expenditure” | ||
| “health service cost” | ||
| “health service costs” | ||
| “health service savings” | ||
| “health service spending” | ||
| “health service use” | ||
| “health service utilisation” | ||
| “health service utilization” | ||
| “health services cost” | ||
| “health services delivery” | ||
| “health services expenditure” | ||
| “health services use” | ||
| “health services utilisation” | ||
| “health services utilization” | ||
| “healthcare cost” | ||
| “healthcare costs” | ||
| “healthcare delivery” | ||
| “healthcare expenditure” | ||
| “healthcare savings” | ||
| “healthcare seeking behavior” | ||
| “healthcare seeking behaviour” | ||
| “healthcare service costs” | ||
| “healthcare service delivery” | ||
| “healthcare service use” | ||
| “healthcare service utilisation” | ||
| “healthcare service utilization” | ||
| “healthcare services delivery” | ||
| “healthcare services utilisation” | ||
| “healthcare services utilization” | ||
| “healthcare spending” | ||
| “healthcare use” | ||
| “healthcare utilisation” | ||
| “healthcare utilization” | ||
| “inpatient care” | ||
| “medical care delivery” | ||
| “medical care seeking behavior” | ||
| “medical care seeking behaviour” | ||
| “medical care use” | ||
| “medical care utilisation” | ||
| “medical care utilization” | ||
| “medicine delivery” | ||
| “medicine use” | ||
| “medicine utilisation” | ||
| “medicine utilization” | ||
| “medical care cost” | ||
| “medical care costs” | ||
| “medical care expenditure” | ||
| “medical care savings” | ||
| “medical care spending” | ||
| “medication cost” | ||
| “medication costs” | ||
| “medication delivery” | ||
| “medication expenditure” | ||
| “medication savings” | ||
| “medication seeking behavior” | ||
| “medication spending” | ||
| “medication use” | ||
| “medication utilisation” | ||
| “medication utilization” | ||
| “medicine cost” | ||
| “medicine costs” | ||
| “medicine expenditure” | ||
| “outpatient care” | ||
| “resource cost” | ||
| “resource costs” | ||
| “resource delivery” | ||
| “resource expenditure” | ||
| “resource saving” | ||
| “resource savings” | ||
| “resource spending” | ||
| “resource use” | ||
| “resource utilisation” | ||
| “resource utilization” | ||
| “resources costs” | ||
| “resources expenditure” | ||
| “resources saving” | ||
| “resources savings” | ||
| “resources use” | ||
| “resources utilisation” | ||
| “resources utilization” | ||
| “self-medication” | ||
| “shopping behavior” | ||
| “shopping behaviour” | ||
| “use of drugs” | ||
| “use of health care” | ||
| “use of health care services” | ||
| “use of health service” | ||
| “use of health services” | ||
| “use of healthcare” | ||
| “use of healthcare services” | ||
| “use of medicine” | ||
| “use of resources” | ||
| “utilisation of health services” | ||
| “utilization of health care” | ||
| “utilization of health service” | ||
| “utilization of health services” | ||
| “utilization of healthcare” | ||
| “utilization of healthcare services” | ||
| “utilization of resources” | ||
| * | ((((((((((((((((((((((((((((((((((((((((((((((((((((((((((((((((((((((((((((((((((((((((((((((((((((((((((((((((((((((((((((((((((((((((((((((((((((“health care costs” [MeSH terms]) OR “delivery of health care/utilization” [MeSH terms]) OR “health care seeking behaviour”) OR “health care seeking behavior”) OR “delivery of health care”) OR “use of health care”) OR “utilization of health care”) OR “health care delivery”) OR “health care use”) OR “health care utilisation”) OR “health care utilization”) OR “healthcare seeking behaviour”) OR “healthcare seeking behavior”) OR “delivery of healthcare”) OR “use of healthcare”) OR “utilization of healthcare”) OR “healthcare delivery”) OR “healthcare use”) OR “healthcare utilisation”) OR “healthcare utilization”) OR “use of health service”) OR “utilization of health service”) OR “health service delivery”) OR “health service use”) OR “health service utilisation”) OR “health service utilization”) OR “medical care seeking behaviour”) OR “medical care seeking behavior”) OR “medical care delivery”) OR “medical care use”) OR “medical care utilisation”) OR “medical care utilization”) OR “use of healthcare services”) OR “utilization of healthcare services”) OR “healthcare services delivery”) OR “healthcare services utilisation”) OR “healthcare services utilization”) OR “healthcare service delivery”) OR “healthcare service use”) OR “healthcare service utilisation”) OR “healthcare service utilization”) OR “delivery of health services”) OR “use of health services”) OR “utilisation of health services”) OR “utilization of health services”) OR “health services delivery”) OR “health services use”) OR “health services utilisation”) OR “health services utilization”) OR “use of medicine”) OR “medicine delivery”) OR “medicine use”) OR “medicine utilisation”) OR “medicine utilization”) OR “health care service seeking behavior”) OR “health care service delivery”) OR “health care service use”) OR “health care service utilisation”) OR “health care service utilization”) OR “use of health care services”) OR “health care services delivery”) OR “health care services utilisation”) OR “health care services utilization”) OR “resource delivery”) OR “resource use”) OR “resource utilisation”) OR “resource utilization”) OR “medication seeking behavior”) OR “medication delivery”) OR “medication use”) OR “medication utilisation”) OR “medication utilization”) OR “ambulatory care delivery”) OR “ambulatory care use”) OR “ambulatory care utilization”) OR “use of resources”) OR “utilization of resources”) OR “resources use”) OR “resources utilisation”) OR “resources utilization”) OR “health services cost”) OR “health services expenditure”) OR “health service savings”) OR “health service costs”) OR “health service cost”) OR “health service expenditure”) OR “health service spending”) OR “medical care savings”) OR “medical care costs”) OR “medical care cost”) OR “medical care expenditure”) OR “medical care spending”) OR “cost of health care”) OR “cost of healthcare”) OR “health care savings”) OR “health care costs”) OR “health care cost”) OR “health care expenditure”) OR “health care spending”) OR “healthcare savings”) OR “healthcare costs”) OR “healthcare cost”) OR “healthcare expenditure”) OR “healthcare spending”) OR “health care service costs”) OR “healthcare service costs”) OR “self-medication”) OR “health seeking behaviour”) OR “health seeking behavior”) OR “ambulatory care costs”) OR “ambulatory care cost”) OR “ambulatory care expenditure”) OR “resources savings”) OR “resources saving”) OR “resources costs”) OR “resources expenditure”) OR “resource savings”) OR “resource saving”) OR “resource costs”) OR “resource cost”) OR “resource expenditure”) OR “resource spending”) OR “medication savings”) OR “medication costs”) OR “medication cost”) OR “medication expenditure”) OR “medication spending”) OR “medicine costs”) OR “medicine cost”) OR “medicine expenditure”) OR “drug use”) OR “drug utilization”) OR “drug utilisation”) OR “use of drugs”) OR “drug delivery”) OR “delivery of drugs”) OR “drug cost”) OR “drug costs”) OR “cost of drugs”) OR “drug spending”) OR “drug expenditure”) OR “inpatient care”) OR “outpatient care”) OR “continuity of care”) OR “care trajectory”) OR “care trajectories”) OR “doctor shopping”) OR “shopping behavior”) OR “shopping behaviour” | 407,551 (27 April 2018) |
| Outcome 1 AND Outcome 2 | ||
| * | ((((((((((((((((((((((((((((((((((((((((((((((((((((((((((((“anxiety” [MeSH terms]) OR “pain perception” [MeSH terms]) OR “catastrophization” [MeSH terms]) OR “pain attention”) OR “attention to pain”) OR “pain awareness”) OR “vigilance to pain”) OR “pain vigilant”) OR “hypervigilance”) OR “pain vigilance”) OR “catastrophisation”) OR “catastrophization”) OR “catastrophising”) OR “catastrophizing”) OR “catastrophic thinking”) OR “pain catastrophisation”) OR “pain catastrophization”) OR “pain catastrophising”) OR “pain catastrophizing”) OR “fear of movement”) OR “kinesiophobia”) OR “Tampa scale”) OR “illness cognitions”) OR “illness cognition”) OR “illness belief”) OR “illness beliefs”) OR “illness perception”) OR “illness perceptions”) OR “anxiety”) OR “fear of pain”) OR “psychosocial”) OR “attitude”) OR “pain belief”) OR “pain beliefs”) OR “pain perception”) OR “pain perceptions”) OR “pain cognition”) OR “pain cognitions”) OR “pain thoughts”) OR “self-efficacy”) OR “attribution”) OR “attributions”) OR “resilience”) OR “mindset”) OR “mind set”) OR “acceptance”) OR “self-compassion”) OR “anger”) OR “rumination”) OR “perceived injustice”) OR “depressive thoughts”) OR “mental stress”) OR “psychological stress”) OR “emotional stress”) OR “pain-related stress”) OR “somatization”) OR “somatisation”) OR “depressive symptoms”))) AND (((((((((((((((((((((((((((((((((((((((((((((((((((((((((((((((((((((((((((((((((((((((((((((((((((((((((((((((((((((((((((((((((((((((((((((((((((((“health care costs” [MeSH terms]) OR “delivery of health care/utilization” [MeSH terms]) OR “health care seeking behaviour”) OR “health care seeking behavior”) OR “delivery of health care”) OR “use of health care”) OR “utilization of health care”) OR “health care delivery”) OR “health care use”) OR “health care utilisation”) OR “health care utilization”) OR “healthcare seeking behaviour”) OR “healthcare seeking behavior”) OR “delivery of healthcare”) OR “use of healthcare”) OR “utilization of healthcare”) OR “healthcare delivery”) OR “healthcare use”) OR “healthcare utilisation”) OR “healthcare utilization”) OR “use of health service”) OR “utilization of health service”) OR “health service delivery”) OR “health service use”) OR “health service utilisation”) OR “health service utilization”) OR “medical care seeking behaviour”) OR “medical care seeking behavior”) OR “medical care delivery”) OR “medical care use”) OR “medical care utilisation”) OR “medical care utilization”) OR “use of healthcare services”) OR “utilization of healthcare services”) OR “healthcare services delivery”) OR “healthcare services utilisation”) OR “healthcare services utilization”) OR “healthcare service delivery”) OR “healthcare service use”) OR “healthcare service utilisation”) OR “healthcare service utilization”) OR “delivery of health services”) OR “use of health services”) OR “utilisation of health services”) OR “utilization of health services”) OR “health services delivery”) OR “health services use”) OR “health services utilisation”) OR “health services utilization”) OR “use of medicine”) OR “medicine delivery”) OR “medicine use”) OR “medicine utilisation”) OR “medicine utilization”) OR “health care service seeking behavior”) OR “health care service delivery”) OR “health care service use”) OR “health care service utilisation”) OR “health care service utilization”) OR “use of health care services”) OR “health care services delivery”) OR “health care services utilisation”) OR “health care services utilization”) OR “resource delivery”) OR “resource use”) OR “resource utilisation”) OR “resource utilization”) OR “medication seeking behavior”) OR “medication delivery”) OR “medication use”) OR “medication utilisation”) OR “medication utilization”) OR “ambulatory care delivery”) OR “ambulatory care use”) OR “ambulatory care utilization”) OR “use of resources”) OR “utilization of resources”) OR “resources use”) OR “resources utilisation”) OR “resources utilization”) OR “health services cost”) OR “health services expenditure”) OR “health service savings”) OR “health service costs”) OR “health service cost”) OR “health service expenditure”) OR “health service spending”) OR “medical care savings”) OR “medical care costs”) OR “medical care cost”) OR “medical care expenditure”) OR “medical care spending”) OR “cost of health care”) OR “cost of healthcare”) OR “health care savings”) OR “health care costs”) OR “health care cost”) OR “health care expenditure”) OR “health care spending”) OR “healthcare savings”) OR “healthcare costs”) OR “healthcare cost”) OR “healthcare expenditure”) OR “healthcare spending”) OR “health care service costs”) OR “healthcare service costs”) OR “self medication”) OR “health seeking behaviour”) OR “health seeking behavior”) OR “ambulatory care costs”) OR “ambulatory care cost”) OR “ambulatory care expenditure”) OR “resources savings”) OR “resources saving”) OR “resources costs”) OR “resources expenditure”) OR “resource savings”) OR “resource saving”) OR “resource costs”) OR “resource cost”) OR “resource expenditure”) OR “resource spending”) OR “medication savings”) OR “medication costs”) OR “medication cost”) OR “medication expenditure”) OR “medication spending”) OR “medicine costs”) OR “medicine cost”) OR “medicine expenditure”) OR “drug use”) OR “drug utilization”) OR “drug utilisation”) OR “use of drugs”) OR “drug delivery”) OR “delivery of drugs”) OR “drug cost”) OR “drug costs”) OR “cost of drugs”) OR “drug spending”) OR “drug expenditure”) OR “inpatient care”) OR “outpatient care”) OR “continuity of care”) OR “care trajectory”) OR “care trajectories”) OR “doctor shopping”) OR “shopping behavior”) OR “shopping behaviour”) | 35,152 (27 April 2018) |
| Population AND Outcome 1 AND Outcome 2 | ||
| * | ((((((((((((((((((((((((((((((((((((((((((((((((((((((((((((((“anxiety” [MeSH terms]) OR “pain perception” [MeSH terms]) OR “catastrophization” [MeSH terms]) OR “pain attention”) OR “attention to pain”) OR “pain awareness”) OR “vigilance to pain”) OR “pain vigilant”) OR “hypervigilance”) OR “pain vigilance”) OR “catastrophisation”) OR “catastrophization”) OR “catastrophising”) OR “catastrophizing”) OR “catastrophic thinking”) OR “pain catastrophisation”) OR “pain catastrophization”) OR “pain catastrophising”) OR “pain catastrophizing”) OR “fear of movement”) OR “kinesiophobia”) OR “Tampa scale”) OR “illness cognitions”) OR “illness cognition”) OR “illness belief”) OR “illness beliefs”) OR “illness perception”) OR “illness perceptions”) OR “anxiety”) OR “fear of pain”) OR “psychosocial”) OR “attitude”) OR “pain belief”) OR “pain beliefs”) OR “pain perception”) OR “pain perceptions”) OR “pain cognition”) OR “pain cognitions”) OR “pain thoughts”) OR “self-efficacy”) OR “attribution”) OR “attributions”) OR “resilience”) OR “mindset”) OR “mind set”) OR “acceptance”) OR “self-compassion”) OR “anger”) OR “rumination”) OR “perceived injustice”) OR “depressive thoughts”) OR “mental stress”) OR “psychological stress”) OR “emotional stress”) OR “pain-related stress”) OR “somatization”) OR “somatisation”) OR “depressive symptoms”))) AND (((((((((((((((((((((((((((((((((((((((((((((((((((((((((((((((((((((((((((((((((((((((((((((((((((((((((((((((((((((((((((((((((((((((((((((((((((((“health care costs” [MeSH terms]) OR “delivery of health care/utilization” [MeSH terms]) OR “health care seeking behaviour”) OR “health care seeking behavior”) OR “delivery of health care”) OR “use of health care”) OR “utilization of health care”) OR “health care delivery”) OR “health care use”) OR “health care utilisation”) OR “health care utilization”) OR “healthcare seeking behaviour”) OR “healthcare seeking behavior”) OR “delivery of healthcare”) OR “use of healthcare”) OR “utilization of healthcare”) OR “healthcare delivery”) OR “healthcare use”) OR “healthcare utilisation”) OR “healthcare utilization”) OR “use of health service”) OR “utilization of health service”) OR “health service delivery”) OR “health service use”) OR “health service utilisation”) OR “health service utilization”) OR “medical care seeking behaviour”) OR “medical care seeking behavior”) OR “medical care delivery”) OR “medical care use”) OR “medical care utilisation”) OR “medical care utilization”) OR “use of healthcare services”) OR “utilization of healthcare services”) OR “healthcare services delivery”) OR “healthcare services utilisation”) OR “healthcare services utilization”) OR “healthcare service delivery”) OR “healthcare service use”) OR “healthcare service utilisation”) OR “healthcare service utilization”) OR “delivery of health services”) OR “use of health services”) OR “utilisation of health services”) OR “utilization of health services”) OR “health services delivery”) OR “health services use”) OR “health services utilisation”) OR “health services utilization”) OR “use of medicine”) OR “medicine delivery”) OR “medicine use”) OR “medicine utilisation”) OR “medicine utilization”) OR “health care service seeking behavior”) OR “health care service delivery”) OR “health care service use”) OR “health care service utilisation”) OR “health care service utilization”) OR “use of health care services”) OR “health care services delivery”) OR “health care services utilisation”) OR “health care services utilization”) OR “resource delivery”) OR “resource use”) OR “resource utilisation”) OR “resource utilization”) OR “medication seeking behavior”) OR “medication delivery”) OR “medication use”) OR “medication utilisation”) OR “medication utilization”) OR “ambulatory care delivery”) OR “ambulatory care use”) OR “ambulatory care utilization”) OR “use of resources”) OR “utilization of resources”) OR “resources use”) OR “resources utilisation”) OR “resources utilization”) OR “health services cost”) OR “health services expenditure”) OR “health service savings”) OR “health service costs”) OR “health service cost”) OR “health service expenditure”) OR “health service spending”) OR “medical care savings”) OR “medical care costs”) OR “medical care cost”) OR “medical care expenditure”) OR “medical care spending”) OR “cost of health care”) OR “cost of healthcare”) OR “health care savings”) OR “health care costs”) OR “health care cost”) OR “health care expenditure”) OR “health care spending”) OR “healthcare savings”) OR “healthcare costs”) OR “healthcare cost”) OR “healthcare expenditure”) OR “healthcare spending”) OR “health care service costs”) OR “healthcare service costs”) OR “self medication”) OR “health seeking behaviour”) OR “health seeking behavior”) OR “ambulatory care costs”) OR “ambulatory care cost”) OR “ambulatory care expenditure”) OR “resources savings”) OR “resources saving”) OR “resources costs”) OR “resources expenditure”) OR “resource savings”) OR “resource saving”) OR “resource costs”) OR “resource cost”) OR “resource expenditure”) OR “resource spending”) OR “medication savings”) OR “medication costs”) OR “medication cost”) OR “medication expenditure”) OR “medication spending”) OR “medicine costs”) OR “medicine cost”) OR “medicine expenditure”) OR “drug use”) OR “drug utilization”) OR “drug utilisation”) OR “use of drugs”) OR “drug delivery”) OR “delivery of drugs”) OR “drug cost”) OR “drug costs”) OR “cost of drugs”) OR “drug spending”) OR “drug expenditure”) OR “inpatient care”) OR “outpatient care”) OR “continuity of care”) OR “care trajectory”) OR “care trajectories”) OR “doctor shopping”) OR “shopping behavior”) OR “shopping behaviour”))) AND pain | 2561 (27 April 2018) 2828 (6 August 2019) |
Appendix B
| Author (Year) | C | D | Sample | Outcome Measures | Investigated Associations and Statistics 4 | ||
|---|---|---|---|---|---|---|---|
| Condition Duration of Pain | n Sex (%♂/%♀) Age (Mean ± SD) 1 | CEF Time of Assessment 2 CEF Cluster Outcome Measure | HCU Type of Data Collection 3 (Considered Period 2) Content (HCU Category) | ||||
| Alschuler (2012) [48] | US | CS | Multiple sclerosis with pain Mean pain duration: 137.68 m | 161 17/83 54.02 ± 11.86 y | Depressive symptoms → Patient Health Questionnaire-9 (PHQ-9) → Dichotomized for comparative analyses: - PHQ-9 ≥ 10: clinically relevant depressive symptoms - PHQ-9 < 10: no depressive symptoms | Retrospective (past 6 m + current) Types of pain treatments used → yes/no for each: - PT (type; primary care consultations) - Nerve blocks (type; invasive procedures) - Biofeedback/relaxation (type; CAM use) - Acupuncture (type; CAM use) - Magnets (type; CAM use) - Massage (type; CAM use) - Hypnosis (type; CAM use) - Counseling/psychotherapy (type; primary care consultations) - Mexiletine (type; prescription pain medication) - Neurontin (type; prescription pain medication) - TCA (type; prescription pain medication) - Narcotics (type; prescription pain medication) - Acetaminophen (type; OTC pain medication) - Advil/Aspirin/Aleve (type; OTC pain medication) - Diazepam/Alprazolam (type; prescription pain medication) - Tegretol (type; prescription pain medication) - Baclofen (type; prescription pain medication) - TENS unit (type; CAM use) - Dilantin or other anticonvulsant (type; prescription pain medication) - Chiropractic adjustment (type; CAM use) - Heat (type; CAM use) - Ice (type; CAM use) - Marijuana (type; prescription pain medication) - Strengthening exercises (type; CAM use) - Mobility exercises or ROM (type; CAM use) - Implanted nerve stimulator (type; invasive procedures) - Implanted medication pump (type; invasive procedures) → Frequency of use of the former pain treatments was also assessed to calculate the total amount of pain treatments used. (amount; HCU in general) Number of visits w/ healthcare providers for pain: - Primary care providers - MS specialists - Other physicians - PT/OT - Other providers (all above: amount; consultations) - Chiropractors (amount; CAM use) - ER (amount; emergency HCU) Total number of visits and total number of visits w/o PT/OT visits was also calculated. (amount; consultations) | To compare current and past use of the listed pain treatments between patients w/ and w/o depressive symptoms. → Chi2 |
| To investigate whether depressive symptoms were influencing the total number of pain treatments currently used and used in the past. → Regression | |||||||
| Idem, but controlling for pain intensity. → Regression | |||||||
| To comparw/ and w/o cle the number of visits w/ the following healthcare providers between patients inically relevant depressive symptoms: - PT/OT - Primary care providers - MS specialists - Other MDs - Chiropractors - ER - Other providers - Total amount of healthcare visits w/o PT/OT visits → t-test | |||||||
| To investigate whether depressive symptoms were influencing the total number of healthcare visits. → Regression | |||||||
| Idem, but controlling for pain intensity. → Multivariate regression | |||||||
| Asmundson (2001) 5 [49] | US | CS | Chronic recurring headache Mean duration of pain: 205.6 ± 156.7 m Range: 1–600 m | 108 12/88 42.3 ± 12.0 y | Anger → State-Trait Anger Expression Inventory - Trait form for anger General anxiety symptoms → State-Trait Anxiety Inventory - Trait form Symptom-related anxiety symptoms → Pain Anxiety Symptom Scale - Pain-specific cognitive anxiety - physiological anxiety - fearful appraisals of pain subscales Depressive symptoms → Beck Depression Inventory | Patient-reported Current use Headache Questionnaire: - Current OTC headache medication use (type; OTC pain medication use) - Current prescription headache medication use (type; prescription pain medication use) → Both yes/no | To investigate associations between the listed CEF and the use of prescription and OTC pain medication use for headache. → Correlations |
| To investigate whether the listed CEF ** were significantly influencing the likelihood of using prescription and OTC pain medication use for headache while also accounting for pain severity * and anxiety sensitivity **. → Hierarchical multiple regression * Fixed factor in model ** Omitted from final model if not significant | |||||||
| Biggs (2003) [50] | UK | CS | Upper abdominal or chest pain: (1) functional dyspepsia; (2) noncardiac chest pain; (3) GERD; (4) IHD; or (5) a combination of these. Median duration of symptoms: 16 m (IQR: 7–36 m) | 151 47/53 Range: 18–75 y | General anxiety symptoms → Hospital Anxiety and Depression Scale - Anxiety subscale Symptom-related anxiety symptoms → Health Anxiety Questionnaire Depressive symptoms → Hospital Anxiety and Depression Scale - Depression subscale Negative consequences beliefs → Illness Perception Questionnaire - Consequences subscale Negative illness beliefs → Illness Perception Questionnaire - Timeline subscale Psychological distress → Short Form Health Survey (SF-36) - Mental health subscale Perceived symptom control → Illness Perception Questionnaire - Cure subscale | Database extraction Retrospective (12 m before and 6 m after index visit) Number of consultations w/ - Healthcare providers in general in the 18 m period - GP - Other providers than GP (all: amount; consultations) | To investigate whether the listed CEF were influencing the total number of consultations w/ healthcare providers, number of GP visits and number of consultations w/ other providers than GP while also accounting for sex, marital status, education, access to confidant, diagnosis, pain score, remaining 7 SF-36 scores, recent social stress, exposure to death of a family member (father, mother or sibling) during childhood and reported childhood adversity (antipathy from father or mother, neglect and physical, psychological or sexual abuse). → Hierarchical stepwise multiple regression Independent variables were omitted from the final model if not significant. |
| Boyer (2009) [51] | US | C | Fibromyalgia Mean pain duration: Primary care: 9.77 ± 10.22 y Rheumatology setting: 12.93 ± 1.10 y | 315 0/100 Primary care (n = 101): 49.8 ± 10.39 y Rheumatology setting (n = 214): 52.7 ± 9.01 y | General anxiety symptoms → Hospital Anxiety and Depression Scale - Anxiety subscale Depressive symptoms → Hospital Anxiety and Depression Scale - Depression subscale Self-efficacy beliefs → Chronic Pain Self-Efficacy Scale - Pain management - symptoms management - physical functioning subscales Locus of control → Multidimensional Pain Locus of Control Scale - Internal, fate and chance subscales | Database extraction Patients were recruited from a rheumatology setting or a primary care setting. → Binary variable (type; secondary care consultations) | To compare the listed CEF between patients attending either a rheumatology setting or primary care. → t-tests |
| Buse (2012) [94] | US | C | Migraine | 5796 19/81 Nonusers (n = 4076): 50.7 ± 12.5 y Previous users (n = 798): 53.0 ± 12.5 y Current nondependent users (n = 769): 53.6 ± 11.3 y Current probable dependence (n = 153): 53.1 ± 12.4 y | General anxiety symptoms → General Anxiety Disorder-7 → Dichotomized for comparative analyses: - Clinically relevant anxiety symptoms - No anxiety symptoms → DSM-IV clinical algorithm Depressive symptoms → Patient Health Questionnaire-9 (PHQ-9) → Dichotomized for comparative analyses: - PHQ-9 ≥ 10: clinically relevant depressive symptoms - PHQ-9 < 10: no depressive symptoms | Patient-reported Retrospective (yearly survey over a period of 3 y) Frequency of opioid use + risk of dependency questionnaire based on DSM-IV criteria → sample divided in 4 groups based on type of opioid user: - Non-users (reference) - Previous users - Current non-dependent users - Current probable dependent users (type; opioid use) | To investigate whether presence of depressive and anxiety symptoms (reference: no symptoms) is influencing the likelihood of being a previous, current non-dependent or current dependent opioid user (reference: non-user). → Logistic regressions |
| Carroll (2016) 5 [96] | US | C | Sickle cell disease | 83 31/69 Chronic opioid therapy (n = 29): 40.6 ± 11.7 y No chronic opioids (n = 54): 38.0 ± 12.4 y | Depressive symptoms → Center for Epidemiologic Studies Depression Scale | Database review Current situation Being on chronic opioid therapy → yes/no (type; opioid use) | To compare level of depressive symptoms between patients on chronic opioid therapy and those who are not. → ANOVA |
| Patient-reported Daily diary - Days w/ calls to healthcare providers - Days w/ medical visits (Both: amount; consultations) | To investigate whether level of depressive symptoms is a significant covariate in the relationship between being on chronic opioid therapy (reference: not on chronic opioid therapy) and days w/ calls to providers and w/ medical visits. → Regression | ||||||
| Carroll (2018) 5 [95] | US | C | Sickle cell disease (SCD) | 73 39.36/61.64 34.43 ± 9.70 y | Assessed at baseline Symptom-related anxiety symptoms → Pain Anxiety Symptoms Scale | Database review Prospective (1 y) - Use of the Sickle Cell Infusion Center → sample divided into: - Non-utilizers - Typical utilizers (median or less) - High utilizers (above median) (amount; consultations) - Opioid dose (converted to oral morphine equivalents) (amount; pain medication use) | To compare pain anxiety scores between the 3 listed sickle cell infusion center use groups. → ANOVA |
| To investigate whether baseline pain anxiety score was influencing frequency of SCD Infusion Center use while also accounting for demographics (age and sex), disease-related variables (genotype, hemoglobin, acute chest, avascular necrosis, prior hydroxyurea, chronic transfusion and total daily opioid), socioeconomic status and psychiatric variables (family history, psychiatric treatment and substance use family). → Negative binomial generalized linear model | |||||||
| To investigate whether baseline pain anxiety score was influencing within-visit acute opioid dose while also accounting for demographics (age and sex), disease-related variables (genotype, hemoglobin, acute chest, avascular necrosis, prior hydroxyurea, chronic transfusion, total daily opioid and utilization), socioeconomic status and psychiatric variables (family history, psychiatric treatment and substance use family). → Linear mixed models | |||||||
| Ciechanowski (2003) [25] | US | C | Patients with chronic pain participating in a multidisciplinary pain program Mean pain duration: 6.3 ± 7.8 y | 111 45/55 44.7 ± 10.7 y | Assessed at baseline Catastrophizing → Coping Strategies Questionnaire - Catastrophizing subscale Depressive symptoms → Center for Epidemiologic Studies Depression Scale | Patient-reported Retrospective (past 3 m; assessed at 12 m follow-up of multidisciplinary program) Frequency of pain-related visits → Subdivided in: - ≥monthly - ≥weekly - <weekly (amount; consultations) | To investigate whether the listed CEF were influencing the likelihood of greater than monthly (reference: greater than weekly) and greater than weekly (reference: less) pain-related visits while also accounting for age, gender, baseline pain-related HCU and attachment style. → Logistic regression |
| Citero (2007) [97] | US | C | Sickle cell disease | 220 38.6/61.4 34 ± 11.4 y | Assessed at baseline Catastrophizing → Coping Strategy Questionnaire - Catastrophizing subscale | Patient-reported Prospective (daily diaries for up to 6 m) Number of pain-related: - Unscheduled doctor visits (amount; emergency HCU) - ER visits (amount; emergency HCU) - Hospitalizations (amount; hospitalizations) → analyzed both separately and combined all together (amount; HCU in general) | To investigate whether baseline catastrophizing was influencing the following HCU outcomes during the upcoming 6 m on crisis days and non-crisis days: - unscheduled doctor visits - ER visits - hospitalizations - all 3 above combined → Simple linear regression |
| Idem, but controlling for depression. → Linear regression | |||||||
| Cronan (2002) 5 [135] | US | C | Fibromyalgia patients participating in an intervention study | 600 4.7/95.3 53.92 ± 11.45 y | Assessed at baseline Depressive symptoms → Center for Epidemiologic Studies Depression Scale Helplessness → Arthritis Helplessness Index Self-efficacy beliefs → Arthritis Self-Efficacy Scale | Database extraction Retrospective (1 y before and 1 y after study initiation) Number and type of contacts and prescribed medical tests and medication → Combined into 1 HCU outcome for the year before and after study initiation (amount; HCU in general) | To investigate the association between the listed baseline CEF and the total amount of HCU 1 y before and after study initiation. → Correlations |
| To investigate whether the listed baseline CEF were influencing total HCU 1 y after study initiation, while also accounting for baseline health status, ethnicity, comorbidity, education, income, age, employment, social support, baseline HCU and coping. → Hierarchical regression | |||||||
| Cronin (2018) 5 [93] | US | CS | Sickle cell disease | 67 46.3/53.7 27.0 y (Range: 18–61 y) | Self-efficacy beliefs → Sickle Cell Self-Efficacy Scale | Database extraction Retrospective (1 y) Number of acute ER visits and hospitalizations for vaso-occlusive pain episodes → Combined in one variable for emergency HCU (amount; emergency HCU) | To investigate whether self-efficacy was significantly predicting amount of emergency HCU while also accounting for age, sex, SCD phenotypes, disease-modifying therapy and Patient Activation Measure. → Negative binomial regression |
| Cronin (2019) [52] | US | CS | Sickle cell disease | 201 42.3/57.3 26.0 y (Range: 22.0–35.0 y) | Depressive symptoms → Patient Health Questionnaire-2 | Patient-reported Retrospective (1 y) - Hospitalizations (type; hospitalizations) - Readmissions (being hospitalized twice in a 30-day period) (amount; hospitalizations) → Both yes/no | To investigate whether level of depressive symptoms was influencing the likelihood of having a hospital admission (reference: no hospital admission) and being readmitted to the hospital (reference: no readmission) while also accounting for age, sex, education, ability to pay bills, literacy, spirituality and social support. → Logistic regressions |
| Daltroy (1998) 5 [133] | US | RCT | Patients scheduled for total knee or hip arthroplasty participating in an intervention study delivering education and relaxation interventions. | 222 34/66 64 ± 12 y 73% osteoarthritis 19% rheumatoid arthritis 8% other | Measured at baseline (preoperative) General anxiety symptoms State anxiety → State-Trait Anxiety Inventory - State form Perceived symptom control → self-designed question (a lot; moderate; a little; none) | Database extraction Retrospective (4 d post-surgery) - Length of stay (amount; hospitalizations) - Postoperative pain medication use (amount; pain medication use) | To investigate whether the listed preoperative CEF were influencing postoperative length of stay and pain medication use while also accounting for age, sex, reliance in God, surgeon, date of surgery, comorbidities, cemented joint, desire for information, passive range of motion, lack of a discharge plan, denial, perceived pain control and provision of information and relaxation training. → General linear models Independent variables were omitted from final model if not contributing significantly to the model. |
| de Boer (2012) [53] | NL | CS | Patients attending a pain center Pain duration: <3 m: 34.1% 3–6 m: 2.4% >6 m: 63.5% Community sample w/ pain Pain duration: <3 m: 4.7% 3–6 m: 4% >6 m: 91.3% | Pain center patients: 150 40.7/59.3 50.6 ± 15.4 y Community sample w/ pain: 137 65/35 53.2 ± 13.5 y | Catastrophizing → Pain Catastrophizing Scale | Patient-reported Retrospective (the past in general) - Specialist consultations (type; secondary care consultations) - Pain medication use (type; pain medication use) → Both yes/no | To investigate whether level of catastrophizing was influencing the likelihood of having specialist consultations (reference: no consultation) and using pain medication (reference: no use) while also accounting for age, sex and pain intensity in the pain center patients and community sample w/ pain separately. → Hierarchical logistic regression |
| Demmelmaier (2010) [98] | SE | C | Back pain Pain duration: <3 m: 42 >12 m: 271 | First-episode group (pain < 3 m): 42 Long-duration group (pain >12 m): 271 | Measured at baseline General anxiety symptoms → Hospital Anxiety and Depression Scale - Anxiety subscale Catastrophizing → Coping Strategy Questionnaire - Catastrophizing Subscale Depressive symptoms → Hospital Anxiety and Depression Scale – Depression subscale Fear-avoidance beliefs Fear of movement and/or (re)injury → Tampa Scale for Kinesiophobia-2 Symptom vigilance → Pain Vigilance and Awareness Questionnaire Self-efficacy beliefs - Functional self-efficacy → Self-Efficacy Scale - Self-efficacy for exercise → Self-Efficacy Scale for Exercise | Patient-reported Retrospective (past 3 m; measured at 12 m follow-up) Number of consultations w/6 different healthcare providers (amount; consultations) | To investigate associations between the listed CEF at baseline and number of healthcare visits 12 m later in patients of the first-episode and long-duration groups separately. → Correlations |
| To investigate whether the listed baseline CEF are significant predictors of the number of healthcare visits 12 m later in patients of the first-episode and long-duration groups separately. → Simple linear regression Regression was only performed for variables showing a significant correlation. If simple linear regression was performed, then this was included in the review instead of the correlation analysis. | |||||||
| Dobkin (2006) [99] | CA | C | Fibromyalgia Median disease duration: 32 m (IQR: 8.8–72) | Tertiary care: 60 Community: 82 Total sample: 142 0/100 50.9 ± 10.2 y | Measured at baseline: Psychological distress → Symptom Checklist 90-R | Patient-reported Retrospective Attending tertiary care vs. community patients (type; tertiary care consultations) | To compare levels of psychological distress between patients from the tertiary care and community samples. → t-test |
| Durá-Ferrandis (2017) [134] | ES | RCT | TMD Participating in CBT intervention study | 72 Experimental group: 41 13/87 39.57 ± 13.82 y Control group: 29 9/91 38.38 ± 16.57 y | Assessed pre- and post-treatment (3 m after baseline) Catastrophizing → Pain Catastrophizing Scale Psychological distress → Brief Symptoms Inventory-18 Perceived symptom control → Survey of Pain Attitudes-35 - Perceived control subscale | Patient-reported Retrospective (past 2 m; measured pre-treatment and post-treatment (3 m after baseline)) Frequency of self-medication: number of days on which the patient voluntarily took medication to manage pain symptoms. (amount; pain medication use) | To investigate whether the listed CEF were significant mediators of the treatment effect on frequency of self-medication, meaning that the relationship between changes in CEF and treatment outcome was investigated, while also accounting for pain intensity change and coping strategies. → Structural equation modelling |
| Elander (2003) [54] | UK | CS | Hemophilia | 68 41 ± 14 y | Catastrophizing → Hemophilia-Adapted Coping Strategies Questionnaire - Negative thoughts subscale | Database extraction Comprehensive care center use vs. another hemophilia center (type; secondary care consultations) | To compare level of negative thoughts about pain between patients attending a comprehensive care center vs. another hemophilia center. → Fisher’s Exact test |
| Patient-reported Retrospective (last month) Number of: - Days when OTC pain medication was used (amount; pain medication use) - Days when prescription pain medication was used (amount; pain medication use) - Healthcare visits (amount; consultations) | To investigate correlations between level of negative thoughts about pain and amount of: - OTC pain medication use - Prescription pain medication use - Healthcare visits → Correlations | ||||||
| Elander (2014) [55] | UK | CS | General adult population w/ pain and using OTC or prescription painkillers in the last month | 112 18/82 44.5 ± 13.5 y | General anxiety symptoms → Depression, Anxiety and Stress Scale-21 - Anxiety subscale Symptom-related anxiety symptoms → Pain Anxiety Symptoms Scale Catastrophizing → Pain Catastrophizing Scale Depressive symptoms → Depression, Anxiety and Stress Scale-21 - Depression subscale Self-compassion → Self-Compassion Scale-Short Form Stress → Depression, Anxiety and Stress Scale-21 - Stress subscale Pain acceptance → Chronic Pain Acceptance Questionnaire Self-efficacy beliefs → Pain Self-Efficacy Questionnaire | Patient-reported Retrospective (last month) Frequency of OTC and prescription pain medication use → 5-point scales: once or twice; about once a week; more than once a week; almost every day; every day (Both: amount; pain medication use) | To investigate associations between the listed CEF and OTC and prescription pain medication use. → Pearson correlations |
| Engel (1996) 5 [100] | US | C | Patients w/ spinal pain having a primary care back pain visit | 1059 47.2/52.8 18–44 y: 48.3% 45–64 y: 35.9% 65–74 y: 15.8% | Measured 1 m after index visit Depressive symptoms → Symptom Checklist-90 - Depression subscale → Categorized into: - ≤1.0 - 1.01–1.6 - >1.6 | Database extraction Prospective (until 12 m after index visit) Amount of use of healthcare services for back pain (listed below), categorized into the following categories: - ≥2 primary care visits vs. <2 (amount; consultations) - ≥2 radiologic procedures vs. <2 (amount; consultations) - ≥1 specialist visit vs. <1 (type; secondary care consultations) - ≥1 admission vs. <1 (type; hospitalizations) - ≥8 pain medication fills vs. <8 (amount; pain medication use) | To investigate whether the presence of depressive symptoms was influencing use of the listed healthcare services. → Univariate logistic regressions |
| Idem, but also accounting for age, gender, education, chronic pain grade, days in pain, disability pay and diagnosis. → Multivariate logistic regression | |||||||
| Fink-Miller (2014) 5 [56] | US | CS | Chronic non-cancer pain Pain duration: >6 m | 233 49/51 49 ± 11.55 y | Catastrophizing → Pain Catastrophizing Scale Depressive symptoms → Beck Depression Inventory II | Database extraction Attending primary vs. tertiary care (type; tertiary care consultations) | To compare catastrophizing and depressive symptoms scores between primary and tertiary care patients. → Wilcoxon rank sum test |
| To investigate the influence of attending tertiary care (reference: primary care) on level of catastrophizing and depressive symptoms while adjusting for age. → Linear regression Regression was only performed for significant outcomes in comparative analysis. | |||||||
| Gebauer (2019) 5 [101] | US | C | Chronic non-cancer low back pain Mean pain duration: 13.9 ± 13.6 y | 327 26.6/73.4 18–45 y: 23.2% 46–59 y: 43.7% ≥60 y: 33.0% | Assessed at baseline, 12 m and 24 m follow-up General anxiety symptoms → Self-designed question: feeling anxious on several or more days in the past 30 d or having a panic attack in the past 2 w → yes/no Depressive symptoms → Patient Health Questionnaire-2 → Dichotomized: - PHQ-2 ≥ 3: clinically relevant depressive symptoms - PHQ-2 < 3: no depressive symptoms | Database extraction Retrospective at 12 m and 24 m follow-up for the past 12 m Opioid prescription: Morphine Equivalent Dose (MED) was calculated from the daily dose of 9 possible opioids: codeine, fentanyl, hydrocodone, hydromorphone, meperidine, methadone, morphine, oxycodone and propoxyphene. → Categorized as: - none - 1–50 mg/day MED - >50 mg/day MED (type; opioid use) | To investigate whether presence of depressive and anxiety symptoms (reference: no symptoms for both) were influencing the likelihood of using 1–50 mg/day MED opioids and >50 mg/day MED opioids (reference: no opioid use for both) while also accounting for moment of assessment, collecting disability, age, race, sex, education, pain severity, pain duration, health-related quality of life (pain interference, physical functioning, role physical and general health), overweight/obesity, other treatments, having a written pain contract and continuity of care. → Multinomial logistic regressions |
| Gil (2004) [102] | US | C | Sickle cell disease (SCD) | 41 44/56 36.6 ± 13.2 y | Assessed daily Depressive symptoms Negative mood → Daily Mood Scale - Negative mood subscale Stress → VAS perceived level of overall stress of the day Positive mood → Daily Mood Scale - Positive mood subscale | Patient-reported Prospective (daily diaries) Amount of use of the following healthcare services on the same day, the next day and 2 d later: - doctor calls (amount; consultations) - hospitalizations (amount; hospitalizations) - ER visits (amount; emergency HCU) - prescription pain medication use (amount; pain medication use) | To investigate whether stress and negative and positive mood were influencing use of the listed healthcare services on the same day, the next day and 2 d later after controlling for level of SCD pain. → Multilevel model regression analyses |
| Görge (2017) [120] | DE | C | Patients with chronic low back pain who were undergoing multidisciplinary rehabilitation Pain duration: Acute event: 0.6% <1 y: 12.4% 1–2 y: 11.1% 3–5 y: 18.6% 6–10 y: 16.3% >10 y: 40.2% | 688 42.8/57.2 51.0 ± 11.2 y | Measured at baseline and at the end of rehabilitation: Anger → Pain Coping Questionnaire - Anger subscale Symptom-related anxiety symptoms → Pain-Coping Questionnaire - Pain-related anxiety subscale Depressive symptoms → Pain Coping Questionnaire - Helplessness & depression subscale Measured at baseline only: Fear-avoidance beliefs → Fear-Avoidance Beliefs Questionnaire - Activity beliefs subscale Negative illness beliefs → Control Beliefs Concerning Illness and Health Questionnaire - Fatalistic external locus of control subscale | Patient-reported Retrospective (last 6 m; measured at baseline and 6 m after rehabilitation) Frequency of visits w/ - GP (amount; consultations) - Specialists (amount; consultations) - PT (amount; consultations) - Psychotherapy (amount; consultations) - Complementary therapist - Massage therapist - Hospital → For the baseline outcome total HCU was calculated. (amount; HCU in general) At follow-up visits w/ specific providers were analyzed separately (except for complementary and massage therapists and hospitalizations). | To investigate the influence of baseline helplessness and depression, activity beliefs and fatalistic external locus of control on baseline HCU while also accounting for gender, hours of work and days on sick leave. → Hierarchical regression analysis |
| To investigate the influence of baseline anger and anxiety symptoms and change in anxiety symptoms from baseline to post-rehabilitation on the number of follow-up GP visits while also accounting for baseline GP visits hours of work, days on sick leave, state of health, SF-12 physical component score and chronicity and change in coping (experience of competencies) and sick leave. → Hierarchical regression analysis | |||||||
| To investigate the influence of change in helplessness and depression and anxiety scores on the number of specialist visits post-rehabilitation while also accounting for baseline specialist visits, days on sick leave, state of health and change in sick leave and pain function and disability. → Hierarchical regression analysis | |||||||
| To investigate the influence of baseline helplessness and depression, activity beliefs and fatalistic external locus of control on the number of PT visits post-rehabilitation while also accounting for baseline PT visits, gender, inability to work, hours of work, days on sick leave and coping (experience of competencies) and change in sick leave. → Hierarchical regression analysis | |||||||
| To investigate the influence of baseline helplessness and depression and change in anger on the number of psychotherapy visits post-rehabilitation while also accounting for baseline psychotherapy visits, employment, hours of work, days on sick leave and disability. → Hierarchical regression analysis | |||||||
| Grant (2000) [57] | US | CS | Sickle cell disease | 43 41.9/58.1 Depressed (n = 11): 34.8 ± 7.5 y Non-depressed (n = 32): 35.1 ± 10.9 y | Depressive symptoms → Center for Epidemiologic Studies Depression Scale | Patient-reported Retrospective (last 12 m) Frequency of HCU → Structured Pain Interview; including ER visits, hospitalizations and consultations with healthcare providers (amount; HCU in general) | To investigate the relationship between depressive symptoms and frequency of HCU while controlling for age, sex, phenotype and complications. → Hierarchical regression analysis |
| Hadlandsmyth (2013) [103] | US | C | Non-cardiac chest pain Pain duration: ≤7 d: 15% 7 d–<1 m: 4% 1–6 m: 26% 6 m–1 y: 15% >1 y: 40% | Baseline: 196 43/57 50 ± 11 y Follow-up: 70 47/53 53 ± 12 y | Measured at baseline General anxiety symptoms → Depression, Anxiety and Stress Scale - Anxiety subscale Symptom-related anxiety symptoms → Albany Panic and Phobia Questionnaire - Interoceptive fear subscale | Patient-reported Retrospective (past year; measured at baseline and 1 y follow-up) Number of caregivers seen and frequency of treatment → Kelner Illness Attitude Scale (amount; consultations) | To investigate the correlation between the listed baseline CEF and baseline and follow-up frequency of healthcare visits. → Correlations |
| To investigate if the listed baseline CEF were influencing baseline and follow-up frequency of healthcare visits while also accounting for chest pain. → Linear regression Independent variables were only included in the multivariate analysis if significantly correlated w/ HCU in univariate correlation analyses. | |||||||
| Harden (1997) 5 [130] | US | CC | Chronic pain Mean pain duration: Opioid group: 60.9 ± 78.1 m Non-opioid group: 51.5 ± 76.1 m | Taking daily opioids: 100 39.4/60.6 45.8 ± 14.2 y Not taking opioids: 100 36/64 44.7 ± 14.1 y | General anxiety symptoms → State-Trait Anxiety Inventory - Trait form Depressive symptoms → Beck Depression Inventory Psychological distress → Multidimensional Pain Inventory - Affective distress subscale | Database extraction Retrospective (period not specified) Taking daily opioids → yes/no (type; opioid use) | To compare the listed CEF between patients taking and not taking opioids. → t-tests |
| Harding (2019) [58] | US | CS | Chronic pain Pain duration: ≥3 m | 127 74.0/25.2/ 0.8% transgender 52.60 ± 12.07 y | General anxiety symptoms → PROMIS Emotional Distress - Anxiety subscale Depressive symptoms → PROMIS Emotional Distress - Depression subscale | Patient-reported Retrospective (past 3 m) - Use of provider management → yes/no for each of the following: massage, osteopathic manipulation, trigger point injection, spine/joint/facet injections, spinal cord stimulation, counseling/talk therapy and surgery (amount; HCU general) - Use of self-management → yes/no for each of the following: water therapy/swimming, another exercise, heat/cold application, TENS, ultrasound, brace/corset, pain education/self-help books and relaxation practice (amount; CAM use) → For each category the number of “yes” answers was added (higher number indicates the use of more different types of either provider or self-management) | To investigate whether anxiety and depressive symptoms are significantly related to the number of different provider management categories and self-management strategies used. → Correlations |
| To investigate whether depressive and anxiety symptoms were influencing the number of different provider management categories and self-management strategies used while controlling for age, gender, pain intensity, pain interference, PTSD and sleep. → Linear regression | |||||||
| Hill (2007) [59] | UK | CS | Musculoskeletal hand problems | 2113 37/63 65.4 ± 9.6 y | Frustration → Arthritis Impact Measurement Scale-2 - Frustration subscale → Dichotomized to no days (reference)/few or all days Negative consequences beliefs → Illness Perception Questionnaire-Revised - Consequences subscale Negative illness beliefs → Illness Perception Questionnaire-Revised - Timeline cyclical - timeline acute/chronic → dichotomized to low (reference)/high score Psychological distress → Illness Perception Questionnaire-Revised - Emotional representations subscale Illness coherence → Illness Perception Questionnaire-Revised - Illness coherence subscale Perceived symptom control → Illness Perception Questionnaire-Revised - Personal control and treatment control subscales Perceived cause of symptoms → Illness Perception Questionnaire-Revised - Psychological attributions | Patient-reported Retrospective (past 12 m) - Consultations with GP → Adjusted Knee Pain Screening Tool (dichotomized to yes/no) (type; primary care consultations) - Medication consumption → Arthritis Impact Measurement Scales 2 (dichotomized to no/some) (type; pain medication use) | To investigate whether the listed CEF were influencing the likelihood of having GP consultations (reference: no GP consultations) and using medication (reference: no medication use). → Univariate logistic regression. It appears that univariate results were only reported for those associations that were found to be significant in multivariate analyses. Because of this unclarity the univariate results were not included in this review for those relationships that were insignificant in multivariate analyses. |
| To investigate whether the listed CEF were influencing the likelihood of having GP consultations (reference: no GP consultations) and using medication (reference: no medication use) while also accounting for age, sex and diagnosis. → Multivariate logistic regression | |||||||
| Howell (1999) [60] | AU | CS | Dyspepsia (upper gastrointestinal symptoms) | 614 Previous HCU 73.5/84.1 46.97 ± 14.32 y Non-users 46.55 ± 15.24 y | Symptom-related anxiety symptoms - Symptom-related anxiety → self-designed question w/ answer options: none; a little; moderate; considerable; extreme - Fear of serious illness → yes/no - Fear that pain might be cancer → yes/no | Patient-reported Retrospective (past year) - Presence of prior GP visits for dyspepsia symptoms → yes/no (type; primary care consultations) - Frequent GP visits for dyspepsia symptoms: 6 or more in the past year → yes/no (amount; consultations) | To compare the listed CEF between patients who had prior GP visits and those who did not. → Chi2 |
| To investigate whether the listed CEF were influencing the likelihood of having had prior GP visits (reference: no visits) while also accounting for gender, alcohol consumption, marital status, ethnicity, smoking status, NSAID use, age, neuroticism, pain frequency, pain duration and pain severity. → Logistic regression Independent variables were omitted from the final model if not contributing significantly. | |||||||
| To compare the listed CEF between patients having frequent GP visits and non-frequent visitors. → Chi2 | |||||||
| To investigate whether the listed CEF were influencing the likelihood of having ≥6 GP visits (reference: <6) while also accounting for gender, alcohol consumption, marital status, ethnicity, smoking status, NSAID use, age, neuroticism, pain frequency, pain duration and pain severity. → Logistic regression Independent variables were omitted from the final model if not contributing significantly. | |||||||
| Huffman (2017) 5 [121] | US | C | Patients w/ chronic non-cancer pain following an interdisciplinary outpatient program | 1457 37.88/62.12 46.29 ± 13.72 y | Assessed at baseline and program discharge General anxiety symptoms → Depression, Anxiety and Stress Scale - Anxiety subscale Depressive symptoms → Depression, Anxiety and Stress Scale - Depression subscale | Database extraction Retrospective Chronic opioid use at program admission → no/low dose/high dose chronic opioid therapy (type; opioid use) | To compare the listed CEF between the different opioid use groups at baseline. → ANOVA |
| To investigate whether level of baseline opioid use was influencing the listed post-discharge CEF while controlling for marital status, age, gender and baseline score of the respective CEF. → Linear mixed models | |||||||
| Jensen (1994) [128] | US | C | Chronic pain Participating in a 3 w multidisciplinary pain program Mean pain duration: 5.26 y (range: 3 m–32 y) | 94 40/60 42 y | Assessed at baseline and follow-up → changes from baseline to follow-up Catastrophizing → Coping Strategies Questionnaire - Catastrophizing subscale Helplessness → Coping Strategy Questionnaire - Factor analysis of the changes in subscale scores from baseline to follow-up (3 to 6 m post-treatment) resulted in 1 factor of interest: “Helplessness” (loadings: Praying and hoping 0.61; Catastrophizing 0.45) Negative consequences beliefs → Survey of Pain Attitudes - Disability and harm subscales Negative illness beliefs → Survey of Pain Attitudes - Factor analysis on the changes in subscale scores from baseline to follow-up resulting in the factor “pain as illness belief” (3 to 6 m post-treatment) resulted in the factor “Pain as illness belief” (Loadings: disability 0.82; Harm 0.75; Pain control −0.70; Medication 0.51; Medical cure 0.44; Solicitude 0.38) and the subscales: medical cure, medication and solicitude Perceived symptom control → Survey of Pain Attitudes - Pain control subscale | Patient-reported Retrospective (last 3 m; measured at baseline and follow-up (3 to 6 m post-treatment) → changes from baseline to follow-up Number of pain-related visits to physicians (amount; consultations) | To investigate correlations between changes in the listed CEF and changes in the amount of physician visits. → Zero-order correlations |
| To investigate the influence of changes in helplessness and pain as illness belief scores on post-treatment physician visits while also accounting for the baseline value of physician visits, cognitive coping attempts and coping ratings (exercise and relaxation, illness focus strategies and keeping busy). → Multiple regression Independent variables were omitted from the final model if not contributing significantly. | |||||||
| Jensen (2006) 5 [122] | DK | C | Patients w/chronic non-cancer pain who received a multidisciplinary pain treatment in the past Pain duration at baseline: <5 y: 54% 5–10 y: 21% >10 y: 25% | 160 40/60 48 y | Measured 10 y after treatment discharge General anxiety symptoms → Hospital Anxiety and Depression Scale - Anxiety subscale Catastrophizing → Coping Strategies Questionnaire - Catastrophizing subscale Depressive symptoms → Hospital Anxiety and Depression Scale - Depression subscale Psychological distress → SF-36 - Mental health subscale | Patient-reported Prospective (current use; measured 10 y after treatment discharge) Opioid use → yes/no (type; opioid use) | To compare the listed CEF between users and non-users of opioids. → Chi2 |
| Jordan (2006) 5 [104] | UK | C | Knee pain in older people w/o knee disorder consultation in the past 18 m Pain duration: <3 m: 870 ≥3 m: 862 | 1797 43/57 64.2 ± 9.46 y | Assessed at baseline General anxiety symptoms → Hospital Anxiety and Depression Scale - Anxiety subscale Depressive symptoms → Hospital Anxiety and Depression Scale - Depression subscale → Both dichotomized to most symptoms (being >top tertile of HADS scores) and less symptoms (≤top tertile) | Database extraction Retrospective (18 m after CEF survey) Recorded primary care visit for a knee disorder → yes/no (type; primary care consultations) | To investigate whether showing most depressive or anxiety symptoms (reference: less symptoms) were influencing the likelihood of having a future primary care consultation for a knee disorder (reference: no consultation). → Logistic regression |
| Idem, while also accounting for BMI, widespread pain, favorable evaluation and frequency of consulting. → Logistic regression | |||||||
| Jöud (2017) [7] | SE | CS | People experiencing pain Pain duration: <3 m: 1019 ≥3 m: 6773 | 7792 39/61 56 y (median; Q1–Q3: 42–67 y) | Catastrophizing → Pain Catastrophizing Scale (PCS) → sample subdivided into PCS > 17; PCS 10–17; PCS < 10 (reference) | Patient-reported Retrospective (last 3 m) Pain-related healthcare consultation → yes/no (type; consultations) | To investigate whether level of PCS score (reference: PCS < 10) was significantly influencing the likelihood of having a pain-related healthcare consultation (reference: no consultation) while also accounting for age, education, sex, pain spread, pain intensity and pain duration. → Poisson regression |
| Kapoor (2012) 5 [123] | US | C | Patients w/ chronic non-cancer pain participating in an RCT comparing cognitive behavioral therapy to an education intervention | 64 26.6/73.4 49.34 ± 12.48 y | Measured at baseline and completion of treatment Catastrophizing → Pain Catastrophizing Scale Depressive symptoms → Center for Epidemiological Studies Depression Scale | Database extraction Retrospective (3 m before and 12 m after treatment) Number of visits to rural healthcare center (amount; consultations) | To investigate the association between the listed CEF and number of healthcare visits pre- and post-treatment. → Correlations |
| To investigate whether the listed baseline CEF were influencing the number of visits pre- and post-treatment initiation while also accounting for age, income, number of pain locations, duration of pain, sex, quality of life and self-reported disability. → Multivariate regression analysis Only independent variables showing a significant correlation w/ the respective HCU outcome were included in the multivariate model. | |||||||
| Kapoor (2014) [61] | US | CS | Chronic pain (rural, low-income population) Pain duration: 12.54 ± 16.28 y | 64 26.6/73.4 49.34 ± 12.48 y | Catastrophizing → Pain Catastrophizing Scale Depressive symptoms → Center for Epidemiologic Studies Depression Scale | Database extraction Retrospective (past 3 m) - Total number of healthcare visits (amount; consultations) - Prescription of opioids → yes/no (type; opioid use) | To examine the association between the listed CEF and total number of healthcare visits. → Correlations |
| To investigate whether the listed CEF ** were influencing the number of healthcare visits while also accounting for number of comorbidities *, pain intensity *, age ** and pain disability **. → Poisson regression * Fixed factor in model ** Only included in regression if significant in correlation analyses | |||||||
| To examine the association between the listed CEF and receiving an opioid prescription (reference: no prescription). → Correlations | |||||||
| Keeley (2008) [105] | UK | C | Chronic low back pain Mean pain duration: 5.5 ± 5.7 y Median pain duration: 4.0 y | 108 55.6/44.4 39.9 ± 12.2 y n = 86 for HCU data | Assessed at baseline Fear-avoidance beliefs → Fear Avoidance Beliefs Questionnaire - Work and activity beliefs subscales Psychological distress → Hospital Anxiety and Depression Scale - Total score Stress → Life Events and Difficulties Schedule Back pain-related and back pain-independent social stress subscales | Patient-reported Retrospective (6 m post-baseline) Total number of contacts with healthcare services → Client Socio-Demographic and Service Receipt Inventory (amount; consultations) | To investigate whether baseline CEF were influencing number of healthcare contacts at follow-up while controlling for age, education, cause of pain and duration of pain. → Negative binomial regression |
| Kratz (2018) [62] | US | CS | Spinal cord injury with chronic pain Time since injury: 14.57 ± 12.34 y | 120 73/27 46.93 ± 46.93 y | Depressive symptoms → Patient Health Questionnaire-9 Pain acceptance → Chronic Pain Acceptance Questionnaire (CPAQ) - Total + Pain willingness and activities engagement subscales | Patient-reported Prospective (current use) - Total number of pain medications used (amount; pain medication use) - Use of opioids → yes/no (type; opioid use) - Use of Gabapentin → yes/no (type; prescription pain medication use) | To investigate if depressive symptoms and chronic pain acceptance (CPAQ total) were influencing the number of pain medications used while also accounting for pain intensity and number of painful body areas. → Poisson regression |
| Idem but w/pain willingness and activities engagement subscales instead of the total CPAQ score. → Poisson regression | |||||||
| To investigate if chronic pain acceptance was influencing the likelihood of using opioid and Gabapentin (reference: no use for both) while also accounting for pain intensity and number of painful body areas. → Logistic regression | |||||||
| Idem but w/pain willingness and activities engagement subscales instead of the total CPAQ score. → Logistic regression | |||||||
| Kuijper (2014) [106] | NL | C | Patients presenting arthralgia w/o synovitis and rheumatoid arthritis patients Pain duration: Non-synovitis: Median: 136 d Range: 7–380 d Rheumatoid arthritis: Median: 103 d Range: 7–373 d | Non-synovitis: 330 15/85 45.0 ± 12.4 y Rheumatoid arthritis: 244 32/68 54.0 ± 13.7 y | Measured at baseline Psychological distress → SF-36 - Mental component subscale Locus of control → Multidimensional Health Locus of Control Questionnaire - Internal, external and chance subscales | Patient-reported Retrospective (past 6 m; measured at baseline, 6 and 12 m follow-up) Number of visits w/ healthcare providers for joint symptoms → Transformed into combined HCU outcome = visits to GP + medical specialist + PT divided by 5 + alternative healthcare providers (amount; consultations) | To investigate whether the listed baseline CEF ** were influencing the number of healthcare visits 6 m later in patients w/o synovitis while also accounting for month *, age *, sex *, ethnicity **, education **, household composition **, employment **, BMI **, duration of symptoms **, diagnosis **, comorbidities **, coping **, pain **, fatigue ** and SF-36 physical component **. → Poisson regression * Fixed factors in model ** If significant in univariate analysis (not reported) |
| To investigate whether the listed baseline CEF ** were influencing the number of healthcare visits 6 m later in patients w/ rheumatoid arthritis while also accounting for month *, age *, sex *, ethnicity **, education **, household composition **, employment **, BMI **, duration of symptoms **, diagnosis **, comorbidities **, coping **, pain **, fatigue ** and SF-36 physical component **. → Poisson regression * Fixed factors in model ** If significant in univariate analysis (not reported) | |||||||
| Lee (2008) [63] | UK | CS | Functional bowel disease Abdominal pain for >12 w: 67% | 420 11/89 40.2 ± 14.4 y | Psychological distress → General Health Questionnaire-28 | Patient-reported Retrospective (past 12 m) Number of GP visits for bowel symptoms (amount; consultations) | To investigate the association between psychological distress and number of GP visits. → Correlations |
| To investigate whether psychological distress * was influencing number of GP visits while also accounting for duration of IBS symptoms *, more severe IBS score *, symptom severity *, employment *, pain relief by opening bowels *, pain duration * and bowel passing *. → Negative binomial regression * These independent variables were selected based on their significance in univariate correlations (not reported) | |||||||
| Lentz (2018) [107] | US | C | Patients receiving out-patient PT for a primary complaint of musculoskeletal knee, shoulder, back or neck pain | 246 34.6/65.0 46.59 ± 16.00 y | Measured at baseline (PT initiation) Psychological distress → OSPRO Yellow Flag (OSPRO-YF) tool → 2 variables: - 10-item OSPRO-YF score - 7 extra OSPRO-YF items Additionally, change in 10-item score from baseline to 4 w follow-up was calculated. | Patient-reported Retrospective (at 6 m follow-up for the previous 2 m; at 12 m follow-up for the previous 6 m → 8 m overview of HCU) Additional HCU after completion of initial PT program for primary musculoskeletal pain: - Opioid painkillers (type; opioids) - Injections (type; invasive procedures) - Surgeries (type; invasive procedures) - Diagnostic tests/imaging (type; secondary care consultations) - ER visits (type; emergency HCU) - Any HCU (amount; HCU in general) → yes/no for each | To investigate the influence of baseline psychological distress (OSPRO-YF 10-item + 7 items) and change in OSPRO-YF 10-item score on the likelihood of using the listed HCU outcomes (reference: no use) while also accounting for age, sex, race, anatomical region of pain, insurance, chronicity, surgery for current condition, comorbidity, baseline disability, baseline pain intensity and OSPRO Review of Systems score (10-item + 13 items), change in pain intensity and disability. → Logistic regression Independent variables were omitted from the final model if not contributing significantly. |
| Levenson (2008) [108] | US | C | Sickle cell disease (SCD) | 232 38.4/61.6 Mean age: 34 y Range: 16–64 y 16–24 y: n = 51 25–34 y: n = 69 35–44 y: n = 66 45–54 y: n = 35 55–64 y: n = 11 | Assessed at baseline General anxiety symptoms → Generalized Anxiety Disorder-7 Depressive symptoms → Patient Health Questionnaire-9 → Both dichotomized as: Clinically relevant symptoms yes/no | Patient-reported Retrospective (daily diary questioning the past 24 h; filled out for up to 6 m) Frequency of SCD-related: - Scheduled physician visits (amount; consultations) - Unscheduled physician visits (amount; emergency HCU) - ER visits (amount; emergency HCU) - Hospitalizations (amount; hospitalizations) - Opioids taken for sickle cell pain (amount; pain medication use) | To compare the percentage of days on which the listed healthcare services were used between patients w/ and w/o clinically relevant depressive symptoms. → Generalized estimating equations |
| Idem, but controlling for age and income. → Generalized estimating equations Only executed for significant univariate associations. | |||||||
| To compare the amount of scheduled physician visits and opioids used between patients w/ and w/o clinically relevant anxiety symptoms. → Generalized estimating equations | |||||||
| Idem, but controlling for age and income. → Generalized estimating equations Only executed for significant univariate associations. | |||||||
| Lozano-Calderon (2008) [131] | US | CC | Trapezio- metacarpal joint arthrosis | 72 19.4/80.6 65 ± 12.8 y Requested operative treatment: n = 31 Not opting for operative treatment: n = 41 | Symptom-related anxiety symptoms → Pain Anxiety Symptoms Scale Catastrophizing → Pain Catastrophizing Scale Depressive symptoms → Center for the Epidemiological Study of Depression | Patient-reported Opting for surgery → yes/no (type; invasive procedures) | To compare the listed CEF between patients opting for surgery and those who do not. → t-test |
| Lozier (2018) [64] | US | CS | People w/chronic musculoskeletal pain prescribed long-term opioid therapy | 517 Clinician- directed NPTs by level of engagement: No: 61.5 ± 10.9 y Low: 59.2 ± 11.5 y Moderate: 57.5 ± 10.1 y High: 52.4 ± 12.7 y Self-directed NPTs by level of engagement: No: 59.9 ± 11.5 y Low: 59.0 ± 10.0 y Moderate: 58.6 ± 12.3 y High: 58.3 ± 12.0 y | General anxiety symptoms → Generalized Anxiety Disorder-7 Depressive symptoms → Patient Health Questionnaire Self-efficacy beliefs → Pain Self-Efficacy Questionnaire | Patient-reported Retrospective (past 6 m) Frequency of non-pharmacological treatments (NPTs) use → subdivided into: - Clinician-directed NPTs (PT, TENS, chiropractic treatment, acupuncture, massage and psychoeducational courses (e.g., CBT)) (amount; consultations) - Self-directed NPTs (weight/strength training, yoga, tai chi, pool exercise/swimming and herbal medicine) (amount; CAM use) → For each of both types of NPTs an engagement score was calculated based on frequency of use and the different types of treatments within both categories used, resulting in 4 categories: no, low, moderate and high engagement. | To compare CEF between different engagement groups of clinician-directed NPTs. → One-way ANOVA |
| To investigate whether depressive symptoms or self-efficacy scores were influencing the use of clinician-directed NPTs while also accounting for site, age, gender, opioid dose, ethnicity, education and pain disability. → Multinomial regression analysis | |||||||
| To compare CEF between different engagement groups of self-directed NPTs. → One-way ANOVA | |||||||
| To investigate whether depressive symptoms or self-efficacy scores were influencing the use of self-directed NPTs while also accounting for site, age, gender, dose, ethnicity, education and pain disability. → Multinomial regression analysis | |||||||
| Macfarlane (1999) [65] | UK | CS | Chronic widespread pain Pain duration: >3 m | 252 35/65 18–32 y: 36 33–42 y: 45 43–52 y: 77 53–65 y: 94 | Symptom-related anxiety symptoms → Illness Attitude Scale - Disease phobia subscale Catastrophizing → Illness Attitude Scale - Hypochondriacal beliefs subscale Health worry → Illness Attitude Scale - Worry about health and concerns about pain subscales Psychological distress → General Health Questionnaire → Scoring above the median yes/no for logistic regression Symptom vigilance → Illness Attitude Scale - Bodily preoccupations subscale Thanatophobia → Illness Attitude Scale - Thanatophobia subscale | Patient-reportedRetrospective (past month) Consultation w/GP for pain → yes/no (type; primary care consultations) | To compare the listed CEF between GP consulters and non-consulters. → Mann–Whitney U |
| To investigate whether scoring > the median on psychological distress (reference: ≤median) was influencing the likelihood of having a GP consultation for pain (reference: no consultation) in men and women separately, while controlling for age. → Logistic regression | |||||||
| Macfarlane (2003) [66] | UK | CS | Orofacial pain Pain duration: <3 m: 137 ≥3 m: 279 | 555 34/66 18–25 y: 71 26–35 y: 120 36–45 y: 125 46–55 y: 151 56–65 y: 88 | Psychological distress → General Health Questionnaire-12 → Subdivided into GHQ-12 score: - 0 - 1–3 - 4–12 Perceived symptom-control → Self-designed question for pain control → Subdivided into pain control score: - 0–2 - 3–4 - 5–6 | Patient-reported Retrospective (past month) Consultation for orofacial pain → yes/no (type; consultations) | To investigate the association between level of psychological distress (reference score: 0) and pain control (reference score: 5–6) and having a healthcare consultation for orofacial pain (reference: no consultation). → Cox regression |
| Mann (2017) [67] | CA | CS | Community- dwelling individuals w/ chronic pain Pain duration: ≥3 m | 702 51/49 59 ± 13 y | Depressive symptoms → Patient Health Questionnaire-9 Self-efficacy beliefs Pain self-efficacy → Pain Self-Efficacy Questionnaire | Patient-reported Retrospective (past year) Number of health-related visits for any reason to: - GP - Specialist - Walk-in clinic → the previous 3 were combined into 1 binary variable: high (top 10% in terms of frequency of visits) vs. low clinic use (amount; consultations) Number of ER visits → transformed into binary variable: high (top 10% in terms of frequency of visits) vs. low ER use (amount; emergency HCU) | To compare the level of the listed CEF between high vs. low clinic users and between high vs. low ER users. → Relative risk comparisons |
| To investigate whether the listed CEF were influencing the likelihood of having high clinic and ER use (reference: low use) while also accounting for demographics (gender, marital status, education and annual household income), need factors (pain intensity, number of pain locations, pain frequency and presence of comorbidities, neuropathic component, back problems, arthritis, probable nerve damage, other pain diagnosis) and personal health behaviors (use of prescription medication, non-prescription medication, PT or exercise, chiropractic or massage therapy, invasive intervention and other therapy or intervention). → Logistic regression Independent factors were only included in the regression analysis if significant in univariate analysis. Independent variables were also omitted from the final model if not contributing significantly. | |||||||
| Mannion (2013) [68] | CH | CS | Low back pain (episode in the last month) | 1071 48.6/51.4 53 ± 15.8 y | Fear-avoidance beliefs → Fear-Avoidance Beliefs Questionnaire - Activity and work beliefs subscales Negative illness beliefs → Back Beliefs Questionnaire Psychological distress → Euroqol (EQ5D) - Depression/anxiety subscale | Patient-reported Retrospective (past 4 w) Low back pain-related consultations to specialists, GP, PT or other practitioner → dichotomized into HCU yes/no (type; consultations) | To investigate if the listed CEF were influencing the likelihood of using healthcare for low back pain (reference: no HCU). → Univariate logistic regression |
| To investigate if level of fear-avoidance beliefs (activity and work beliefs) and psychological distress were influencing the likelihood of using healthcare for low back pain (reference: no HCU) while controlling for sex, age, education, general health, working status, household composition (−18 y), income, low back pain frequency, low back pain intensity and limitations in ADL. → Multivariate logistic regression | |||||||
| To investigate if level of back beliefs and psychological distress were influencing the likelihood of using healthcare for low back pain (reference: no HCU) while also accounting for sex, age, education, general health, working status, household composition (−18 y), income, low back pain frequency, low back pain intensity and limitations in ADL. → Multivariate logistic regression | |||||||
| McCracken (1997) [69] | US | CS | Chronic low back pain Pain duration: Median: 36 m Range: 3–360 m | 80 41.2/58.8 48.0 ± 15.3 y | Symptom vigilance → Pain Vigilance and Awareness Questionnaire | Patient-reported Retrospective (past 9 m) Number of physician visits due to pain (amount; consultations) | To investigate the association between attention to pain and number of pain-related physician visits. → Correlations |
| To investigate whether attention to pain was influencing the number of pain-related visits while also accounting for age, gender, education, pain duration and pain intensity *. → Hierarchical multiple regression * Fixed factor Other independent variables were omitted from the final model if not contributing significantly. | |||||||
| McCracken (2005—Pain) [109] | UK | C | Chronic pain Scheduled for interdisciplinary treatment (=PT and psychosocial therapy) Pain location: 49.6% low back 13.8% lower limb 12.2% upper limb 11.4% neck 13.0% other Pain duration: Median: 87.5 m Range: 12–528 m | 118 36/64 44.2 ± 10.7 y | Assessed at baseline Pain acceptance → Chronic Pain Acceptance Questionnaire - Activities engagement and pain willingness subscales + total score | Patient-reported Retrospective (current use; measured at follow-up (3.9 m later on average)) Count of analgesic medications (amount; pain medications use) | To investigate the correlations between baseline pain acceptance scores and amount of pain medication use at follow-up. → Correlations |
| To investigate whether baseline pain willingness and activities engagement scores were influencing the amount of pain medication use at follow-up while also accounting for pain intensity *, age, gender, education and duration of pain. → Multiple regression * Fixed factor Independent variables were omitted from the final model if not contributing significantly. | |||||||
| McCracken (2005—Beh Res Ther) [124] | UK | C | Chronic pain patients following an acceptance-based treatment Pain location: 49.6% low back 13.8% lower limb 12.2% upper limb 11.4% neck 13.0% other Pain duration: Mean: 132.5 ± 127.8 m Median: 92.0 m Range: 12–528 m | 108 35.8/64.2 44.4 ± 10.7 y | Assessed at baseline (pre-treatment), start of treatment, end of treatment and 3 m follow-up Pain acceptance → Chronic Pain Acceptance Questionnaire - Activity engagement and pain willingness subscales + total score | Patient-reported Retrospective (current situation; assessed at baseline (pre-treatment), start of treatment, end of treatment and 3 m follow-up) Number of pain-related medication prescriptions (amount; pain medication use) | To investigate the correlation between changes in pain acceptance scores from pre- to post-treatment and changes in the number of pain medications used from pre- to post-treatment. → Correlations |
| McCracken (2007) [70] | UK | CS | Chronic pain Diagnoses: 32.8% fibromyalgia 21.3% other nonspecific musculoskeletal pain conditions 15.6% unknown 11.5% post lumbar surgery pain 18.8% other Pain duration: Median: 84.0 m Range: 8.0–552.0 m | 260 35.4/64.6 47.5 ± 11.5 y | Psychological flexibility → Brief Pain Coping Inventory-2 - Psychological flexibility subscale | Patient-reported Retrospective (timing see below) - Current types of pain medications (amount; pain medication use) - Strong opioid use (amount; pain medication use) - Number of pain-related GP, specialist and ER visits in the past 6 m → Summed into an overall pain-related medical visits score (amount; consultations) | To investigate correlations between psychological flexibility and the listed HCU outcomes. → Correlations |
| To investigate whether level of psychological flexibility * was influencing the number of pain medications used and the number of pain-related visits while also accounting for age, gender, years of education, duration of pain, pain intensity and pain management strategies *. → Multiple regressions * Fixed factors Independent variables were omitted from the final model if not contributing significantly. | |||||||
| Mourad (2016) [72] | SE | CS | Non-cardiac chest pain | 552 49/51 64 ± 17 y | Symptom-related anxiety symptoms - Cardiac anxiety → Cardiac Anxiety Questionnaire - Fear subscale + total score - Fear of body sensations → Body Sensations Questionnaire Depressive symptoms → Patient Health Questionnaire-9 Symptom vigilance Heart-focused attention → Cardiac Anxiety Questionnaire - Heart-focused attention subscale | Patient-reported Retrospective (past year) Number of healthcare visits for chest pain → Categorization for univariate analyses: - Very high users (>3 visits) - High users (2–3 visits) - Low users (<2 visits) → Categorization for multivariate regression: - High users (≥ 2 visits) - Low users (1 visit) (amount; consultations) | To compare CEF between the different frequency of healthcare visits categories. → Kruskal–Wallis |
| To investigate whether the listed CEF were influencing the frequency of healthcare visits while controlling for age, sex and multi-morbidity. → Multivariable logistic regression | |||||||
| Mourad (2018) [71] | SE | CS | Non-cardiac chest pain | 552 49/51 64 ± 17 y | Symptom-related anxiety symptoms - Cardiac anxiety → Cardiac Anxiety Questionnaire - Fear of body sensations → Body Sensations Questionnaire Depressive symptoms → Patient Health Questionnaire-9 | Patient-reported Retrospective (past year) Frequency of pain-related healthcare visits → categorized into: - 1 time - 2–3 times - >3 times (amount; consultations) | To model the relationship between the listed CEF and frequency of pain-related healthcare visits while also accounting for somatization. → Structural equation modelling |
| Musey (2018) 5 [110] | US | C | Low-risk chest pain | 163 32/68 47.4 ± 10.8 y | Assessed at enrollment General anxiety symptoms → Hospital Anxiety and Depression Scale - Anxiety subscale (HADS-A) → dichotomized into: - High anxiety (HADS-A ≥ 8) - Low anxiety (HADS-A < 8) | Database extraction Retrospective (past 12 m before enrollment) ER visits → yes/no (type; emergency HCU) | To compare the proportion of patients having at least 1 ER visit (reference: no visit) between patients w/ high and low levels of anxiety symptoms. → Chi2 |
| Database extraction Prospective (30 d after enrollment) Number of ER return visits (ER recidivism) (amount; emergency HCU) | To compare amount of ER recidivism between patients w/ high and low levels of anxiety symptoms. → t-test | ||||||
| Navabi (2018) 5 [111] | US | C | IBS Mean duration of symptoms: 12.6 ± 0.5 y | 432 47.2/52.8 42.3 ± 0.6 y | Assessed at baseline Psychological distress Anxiety and/or depressive symptoms → Hospital Anxiety and Depression Scale - Anxiety and depression subscale → Categorized as: depressive and/or anxiety symptoms (HADS-A or -D ≥8) vs. no symptoms (HADS-A or -D <8) | Database extraction Retrospective (during 18 m study duration) - Opiate use → yes/no (type; opioid use) - Corticosteroid use → yes/no (type; prescription medication use) - Number of ER visits for IBS symptoms (amount; emergency HCU) - Number of hospital admissions for IBD symptoms (amount; hospitalizations) - Number of imaging studies for IBS symptoms (amount; consultations) - Number of surgeries for IBS symptoms (amount; invasive procedures) → Dichotomized to history of surgery yes/no for logistic regression (type; invasive procedures) | To compare the listed HCU outcomes between patients w/ and w/o symptoms of depression and/or anxiety. → t-test, Chi2 or Fisher exact test |
| To investigate whether a history of surgery, corticosteroid use and opiate use were influencing the presence of anxiety and/or depressive symptoms (reference: no symptoms) while also accounting for significant inflammation, age, disease duration, gender, Mesalamine use, immunomodulator use, anti-TNF use, history of extra-intestinal manifestations and tobacco use. → Logistic regression Independent variables in the model were selected based on their significance in univariate comparisons. | |||||||
| Ndao-Brumblay (2010) 5 [73] | US | CS | Chronic pain Mean pain duration: 45.82 ± 64.68 m | 5,079 39.3/60.7 46.42 ± 15.0 y | Depressive symptoms → Beck Depression Inventory Perceived symptom control → Likert scale for perceived pain control | Patient-reported Retrospective (since the beginning of pain problem) Use of CAM modalities for pain: - Acupuncture - Manipulation - Biofeedback/relaxation → Dichotomized to yes/no for all + CAM use in general yes/no (all: type; CAM use) | To compare the level of the listed CEF between CAM users and non-users. → Bivariate analyses |
| To investigate whether the level of the listed CEF were influencing the likelihood of using each of the listed CAM modalities for pain while also accounting for predisposing (age, gender, race, education, marital status and pain care perception), enabling (pain prediction and residence income) and need factors (comorbidities, number of operations, pain duration, pain severity and functional limitations). → Logistic regressions | |||||||
| Newman (2018) 5 [74] | US | CS | Low-income patients with chronic pain Mean pain duration: 16.6 ± 12.2 y | 290 29.3/70.7 50.6 ± 8.9 y | Catastrophizing → Pain Catastrophizing Scale Depressive symptoms → Patient Health Questionnaire-9 | Database extraction Retrospective (past 12 m) - Number of pain-related consultations (amount; consultations) - Opioid prescription → yes/no (type; opioid use) | To investigate the association between the listed CEF and number of pain-related consultations. → Pearson correlations |
| To investigate the association between the listed CEF and opioid use. → Point-biserial correlation | |||||||
| To investigate whether the listed CEF were influencing the number of pain-related consultations while also accounting for demographics (age, sex and race), socioeconomic variables (poverty status, education and literacy) and pain-related variables (physical function, pain severity, pain interference, number of pain sites and types and opioid use). → Hierarchical multiple regression | |||||||
| Nielsen (2015) [75] | AU | CS | Chronic non-cancer pain Median pain duration: Non-users: 10.0 y Past users: 10.0 y Current less than daily users: 12.0 y Current daily users: 12.0 y | 1220 Non-users: n = 450 51.3/48.7 60.5 ± 13.6 y Past users: n = 372 39.5/60.5 56.6 ± 13.1 y Current less than daily users: n = 186 49.5/50.5 53.8 ± 12.6 y Current daily users: n = 212 39.2/60.8 54.5 ± 12.9 y | General anxiety symptoms → Generalized Anxiety Disorder-7 → Dichotomized to GAD-7 ≥10 vs. <10 Depressive symptoms → Patient Health Questionnaire-9 → Dichotomized to PHQ-9 ≥10 vs. <10 Self-efficacy beliefs Pain self-efficacy → Pain Self-Efficacy Questionnaire | Patient-reported Mixed (see below) Benzodiazepine (BZD) use: - Number of days on which medicine was used in the past month - Medication diary reporting all medications taken over a period of 7 d → Categorized into: - Non-users of BZD - Past users of BZD (not in the past month) - Current less than daily BZD users - Current daily users of BZD (amount; pain medication use) | To compare the likelihood of reporting clinically relevant symptoms of anxiety or depression between the different BZD use groups (reference: non-users). → Multinomial regression |
| To compare level of pain self-efficacy between the different BZD use groups while controlling for pain severity. → ANCOVA | |||||||
| Osborne (2007) [129] | AU | C | Patients w/ chronic osteoarthritis who follow the Arthritis Self-Management Course | 452 19/81 62.8 ± 12.4 y | Assessed at baseline (before treatment) and 6 m after treatment Self-efficacy beliefs Pain and fatigue self-efficacy → 4 items from the original 8-item Stanford Scale (overall score based on the mean of the 4 items) → Dichotomized to positive self-efficacy change vs. negative or no change | Patient-reported Retrospective (past 6 m; assessed at baseline (before treatment) and 6 m after treatment) - Number of doctor visits (amount; consultations) - Number of PT visits (amount; consultations) - Number of CAM visits (amount; CAM use) - Number of hospital admissions (amount; hospitalizations) - Length of hospital stay (amount; hospitalizations) → Dichotomous variables created for each of the above: >median number of uses vs. less | To investigate whether having an above median use of the listed healthcare services (reference: lower than median use) was influencing the likelihood of having a positive change in self-efficacy at 6 m post-treatment (reference: negative or no change) while also accounting for age, sex, education level, course attendance, baseline self-efficacy and baseline use of the respective HCU outcome. → Logistic regression |
| Pagé (2019) [112] | CA | C | Patients w/ chronic low back pain who follow a multidisciplinary pain treatment Mean pain duration: 7.7 ± 9.2 y Median pain duration: 4 y | 686 44.2/55.8 56.5 ± 14.5 y | Assessed at baseline and 6 and 12 m after treatment initiation Depressive symptoms → Beck Depression Inventory | Patient-reported Retrospective (assessed at 6 and 12 m after treatment initiation for the previous 6 m) Use of any of these treatments: - Psychological treatment (psychotherapy or group therapy) (type; primary care consultations) - Self-management (relaxation, meditation, hypnosis, visualization, distraction, self-help group) (type; CAM use) → yes/no for both | To compare level of depressive symptoms between patients using psychological treatment and those who do not and between those who use self-management modalities and those who do not at 6 and 12 m after treatment initiation. → t-tests |
| Philpot (2018) 5 [125] | US | C | Patients w/ chronic non-cancer pain enrolled in Controlled Substance Agreements (CSA) for long-term opioid therapy | 772 35/65 63.5 ± 14.9 y | Assessed at CSA enrollment General anxiety symptoms → Generalized Anxiety Disorder-7 (GAD-7) Depressive symptoms → Patient Health Questionnaire-9 (PHQ-9) → Both dichotomized to score ≥ 10 vs. score < 10 | Database extraction Retrospective (12 m before and 12 m after CSA enrollment) Number of: - Outpatient primary care visits - Outpatient specialist visits - Hospitalizations - ER visits → Difference in frequency was calculated between pre- and post-CSA enrollment → Dichotomized into decrease yes/no for each HCU type according to the following rules for decrease: - Hospitalization: decrease ≥ 1 (amount; hospitalizations) - ER visits: decrease ≥ 1 (amount; emergency HCU) - Primary care visits: decrease ≥ 3 (amount; consultations) - Specialist visits: decrease ≥ 3 (amount; consultations) | To investigate whether baseline presence of anxiety or depressive symptoms (reference: no symptoms) was influencing the likelihood of having a particular decrease in the listed HCU outcomes (reference: lower or no decrease) after CSA enrollment. → Univariate logistic regression |
| Idem, while also accounting for race, sex, age, employment status, marital status, household composition, comorbidity, education, condition, current pain intensity, PHQ-9 functional score, GAD-7 functional score, smoking, number of opioid classes prescribed, opioid prescription dose and the respective other CEF. → Multivariable logistic regression Independent variables in the model were selected based on their significance in univariate analyses. | |||||||
| Pierce (2019) 5 [76] | US | CS | Patients w/ chronic pain and current opioid use | 1785 42.18/57.82 50.34 ± 14.76 y | General anxiety symptoms → Hospital Anxiety and Depression Scale - Anxiety subscale Depressive symptoms → Hospital Anxiety and Depression Scale - Depression subscale → Both dichotomized to score ≥ 10 vs. score < 10 | Patient-reported Prospective Current Benzodiazepine use → yes/no (type; prescription pain medication use) | To compare level of depressive and general anxiety symptoms between benzodiazepine users and non-users. → t-tests |
| To investigate whether level of depressive and anxiety symptoms was influencing the likelihood of using benzodiazepines while controlling for age, sex, pain severity, pain interference, fibromyalgia survey score, lifetime abuse history and interactions between anxiety and child, adult and cumulative abuse. → Logistic regression | |||||||
| Primavera (1994) 5 [127] | US | C | Patients w/ analgesic rebound headache hospitalized in a multidisciplinary headache center Chronic daily headache | 30 | Health attribution → Health Attribution Test - Internal; Powerful other and Chance subscales | - Length of stay (amount; hospitalizations) - Amount of medication use (amount; pain medication use) | To investigate associations between health attribution scores and length of stay and medication use. → Correlation |
| Rosenberg (2008) [77] | US | CS | Chronic noncancer pain Pain duration: Median: 54 m IQR: 24–120 m | 463 32/68 53 ± 12.5 y | Depressive symptoms → self-designed question: depressive symptoms yes/no Self-efficacy beliefs Pain self-efficacy → Pain Self-efficacy Questionnaire | Patient-reported Retrospective (period not specified) CAM use: acupuncture/acupressure, chiropractic, aromatherapy, vitamin and mineral supplements, meditation/yoga, garlic preparations, traditional Chinese medicine, cod liver oil, massage, primrose oil, herbs, reflexologists, acupuncturists, root doctors, herbalists, chiropractors or other alternative practitioners → Dichotomized to CAM use yes/no (type; CAM use) | To investigate the influence of level of psychological distress and pain self-efficacy on the likelihood of using CAM services (reference: no CAM use). → Bivariate analyses |
| Shmagel (2016) [78] | US | CS | Chronic low back pain Pain duration: ≥3 m | 700 44.2/55.8 20–29 y: 15.1% 30–39 y: 18.3% 40–49 y: 19.3% 50–59 y: 27.4% 60–69 y: 20.0% | Depressive symptoms → Patient Health Questionnaire-9 (PHQ-9) → Categorized according to PHQ-9 score into: - None (1–4) - Mild (5–9) - Moderate (10–14) - Moderately severe (15–19) - Severe (20–27) | Patient-reported Retrospective (past year) Number of healthcare visits → Dichotomized to frequent users (≥10 visits per year) and normal or low users (amount; consultations) | To investigate whether level of depressive symptoms was influencing the frequency of healthcare visits while also accounting for age, race, gender, education level and number of medical comorbidities. → Logistic regression |
| Talley (1998) [79] | AU | CS | Dyspepsia Pain duration ≥5 y: | 93 Consulters (n = 65): 37/63 51 ± 14 y Non-consulters (n = 28): 39/61 46 ± 15 y | Psychological distress → General Health Questionnaire | Patient-reported Retrospective (past year and lifetime) Visits to physicians and alternative therapists for abdominal pain or discomfort → Bowel Symptoms Questionnaire → Categorized into consulters vs. non-consulters w/ dyspepsia (type; consultations) | To investigate whether level of psychological distress was influencing the likelihood of having consultations for pain (reference: no consultations) in the past year and at any time. → Univariate logistic regression |
| Thorstensson (2009) [80] | UK | CS | Chronic hip or knee pain Pain duration: >7.5 y | 1119 38/62 67.7 ± 11.0 y | Psychological distress Depressive/anxiety symptoms → Euroqol EQ5D - Depression/anxiety subscale → Dichotomized to depressive/anxiety symptoms yes/no | Patient-reported Retrospective (see below) During the past 12 m: - GP visits for hip or knee pain (type; primary care consultations) During the past 3 m: - Allied health professional (type; consultations) - Alternative therapist visits during the past 3 m for hip or knee pain (type; CAM use) → Yes/no each + yes/no for combinations (type; consultations) | To investigate whether presence of depressive/anxiety symptoms (reference: no symptoms) was influencing the likelihood of having a consultation w/ an allied health professional or alternative therapist (reference for both: no consultation) while adjusting for age and sex. → Logistic regression |
| To investigate whether presence of depressive/anxiety symptoms (reference: no symptoms) was influencing the likelihood of having a consultation w/ a GP or w/ a combination of GP/allied therapist/alternative therapist (reference for both: no consultation) while adjusting for age, sex, BMI, deprivation, living area, pain location, pain severity, mobility problems and comorbidities. → Logistic regression | |||||||
| Torrance (2013) [81] | UK | CS | Chronic pain, w/ or w/o neuropathic component Pain duration: ≥3 m | 2010 W/ neuropathic component (n = 399): 36.8/63.2 18–39 y: 60 40–59 y: 167 ≥60 y: 166 W/o neuropathic component (n = 1611): 42.5/57.5 18–39 y: 234 40–59 y: 622 ≥60 y: 740 Untreated w/ neuropathic component: n = 117 Treated w/ neuropathic component: n = 98 | Psychological distress → SF-12 - Mental component scale Self-efficacy beliefs → Pain Self-Efficacy Questionnaire | Patient-reported Retrospective (see below) Use of neuropathic pain drug for ≥3 m (=adequate trial) or stopped because of side effects → Dichotomized to treated patients (adequate trial of at least 1 neuropathic pain drug) and those left untreated (type; prescription pain medication use) | To compare level of pain self-efficacy between patients treated w/ neuropathic pain drug and those left untreated. → t-test |
| Trask (2001) [82] | CA | CS | Headache | 292 29.8/70.2 39.83 y (16–74 y) | Psychological distress → Brief Symptom Inventory → Categorized into 3 clusters: low, medium or high distress | Patient-reported Retrospective Use of the following: - Biofeedback - Relaxation - Acupuncture - Chiropractor (all above: type; CAM use) - Psychological care (type; primary care consultations) → yes/no for all Amount of: - Symptomatic medications - Preventive medications (both: amount; pain medication use) | To compare the odds for having sought psychological care or having used the listed adjuvant techniques (reference for all: no use of respective service) between the 3 psychological distress clusters. → Chi2 |
| To compare the number of symptomatic and preventive medications used between the 3 distress clusters. → ANOVA | |||||||
| Tremblay (2018) [113] | CA | C | Non-cardiac chest pain | 428 48.8/51.2 53.1 ± 15.6 y | Measured at baseline Symptom-related anxiety symptoms Heart-focused anxiety → Cardiac Anxiety Questionnaire Depressive symptoms → Hospital Anxiety and Depression Scale - Depression subscale | Patient-reported Retrospective (6 m; measured 6 m after baseline) Total number of healthcare visits (primary care, specialists and ER visits) → Abbreviated version of the Health Cost Interview (amount; consultations) | To investigate whether depressive symptoms and heart-focused anxiety were influencing the number of healthcare consultations. → Bivariate regression analyses |
| To investigate whether depressive symptoms and heart-focused anxiety were influencing the number of healthcare consultations while also accounting for age, sex, presence of panic disorder, pain frequency, pain intensity, pain interference, presence of a medical condition and gastrointestinal symptoms. → Negative binomial regression Independent variables were omitted from the model if they did not improve model parameters. | |||||||
| Tsuji (2019) [83] | JP | CS | Osteoarthritis Mean time since arthrosis diagnosis: 9.5 ± 11.8 y | 565 41.4/58.6 59.1 ± 12.1 y | Depressive symptoms → Patient Health Questionnaire-9 → Dichotomized to moderate/severe vs. mild/no symptoms | Patient-reported Retrospective (past 6 m) Number of: - Physician visits (amount; consultations) - ER visits (amount; emergency HCU) - Hospitalizations (amount; hospitalizations) | To compare the amount of use of the different healthcare services between patients w/ moderate/severe depressive symptoms and those w/ mild or no depressive symptoms. → Mann–Whitney U test |
| To investigate whether level of depressive symptoms was influencing the amount of use of the listed healthcare services while controlling for age, marital status, employment status and smoking status. → Generalized linear regression model | |||||||
| Ullrich (2013) [114] | US | C | Spinal cord injury (SCI) | 286 97/3 53 y n w/ pain: 146 | Measured during study year 1 Depressive symptoms → Center for Epidemiological Studies Depression Scale → Patients categorized as: - Pain & depression (n = 54) - Pain alone (n = 92) - Depression alone (not included in review) - None (not included in review) | Database extraction Retrospective (during study duration = 3 y) - Number of inpatient admissions at SCI unit (amount; hospitalizations) - Number of inpatient days at the SCI unit (amount; hospitalizations) - Number of SCI service outpatient visits (amount; consultations) - Number of outpatient SCI psychologist visits (amount; consultations) | To compare the listed HCU outcomes between patients from the different pain and depression groups while controlling for age, medical comorbidities and level of SCI. → ANCOVA w/ post hoc testing |
| Valdes (2015) [84] | UK | CS | People who had total knee or hip replacement Average time between replacement and baseline: 1.27 ± 2.1 y | 852 43.3/56.7 73.7 ± 8.8 y | Catastrophizing → Pain Catastrophizing Scale (PCS) → Dichotomized to PCS < 9 and PCS ≥ 9 | Patient-reported Retrospective (current use) - Taking opioids (type; opioid use) - Taking strong opioids (type; opioid use) - Taking weak opioids (type; opioid use) - Taking non-steroidal anti-inflammatory drugs (type; pain medication use) - Taking other prescription medication for pain (type; prescription pain medication) - Not taking any pain medication (type; pain medication use) → yes/no for all | To investigate the influence of presence of pain catastrophizing (reference: no catastrophizing) on the listed HCU outcomes while also accounting for age, sex, BMI, back pain, WOMAC pain and body pain. → Logistic regression |
| van Tilburg (2008) [115] | US | C | Functional bowel disorders (IBS, functional diarrhea, functional constipation and functional abdominal pain) | 1012 24.5/75.5 53.5 ± 14.0 y | General anxiety symptoms → Brief Symptom Inventory-18 - Anxiety subscale Depressive symptoms → Brief Symptom Inventory-18 - Depression subscale | Patient-reported Retrospective (past 3 m; assessed 6 m after index visit) Use of CAM (ginger root or tea, fennel seed, senna tea, psychotherapy, homeopathic, hypnotherapy, massage therapy, biofeedback, acupuncture, yoga, aromatherapy, evening primrose oil and others) → yes/no (type; CAM use) | To compare level of depressive and anxiety symptoms between patients using and not using CAM services. → t-tests |
| To investigate the influence of level of depressive and anxiety symptoms on the likelihood of using CAM services (reference: no use of CAM) while also accounting for age, sex, education, marital status, IBS severity, distention symptoms, constipation symptoms, diarrhea symptoms, somatization, quality of life, pharmacy costs, lower gastro-intestinal costs, total healthcare expenditure, non-prescription costs, satisfaction w/ care, satisfactory relief of bowel symptoms and remarkable change in bowel symptoms. → Logistic regression Independent variables in the model were selected based on their significance in univariate analyses. | |||||||
| Vervoort (2019) [116] | NL | C | Fibromyalgia | 199 5/95 43 y (range: 18–72 y) | Assessed at baseline General anxiety symptoms → Hospital Anxiety and Depression Scale - Anxiety subscale Depressive symptoms → Hospital Anxiety and Depression Scale - Depression subscale Helplessness → Illness Cognition Questionnaire - Helplessness subscale Negative consequences beliefs → Revised Fibromyalgia Illness Perception Questionnaire - Consequences subscale Negative illness beliefs → Revised Fibromyalgia Illness Perception Questionnaire - Acute/chronic timeline and cyclical timeline subscales Psychological distress → Revised Fibromyalgia Illness Perception Questionnaire - Emotional representations subscale Illness coherence → Revised Fibromyalgia Illness Perception Questionnaire - Coherence subscale Pain acceptance →Illness Cognition Questionnaire –Acceptance subscale Perceived benefits → Illness Cognition Questionnaire - Perceived benefits subscale Perceived symptom control → Revised Fibromyalgia Illness Perception Questionnaire - Personal control and treatment control subscales | Patient-reported Retrospective (assessed 18 m after fibromyalgia diagnosis for the past 6 m) Recurrent secondary HCU (yes/no) at 18 m post diagnosis: - Consultations w/ specialists - Diagnostic procedures - Admissions to healthcare institutions - Multimodal rehabilitation programs → Patients were considered a recurrent secondary healthcare user if secondary healthcare from at least 1 of the 4 categories was used in the past 6 m (dichotomized) (type; secondary care consultations) | To investigate the influence of the listed baseline CEF on the likelihood of being a recurrent secondary care user (reference: not a recurrent secondary care user) 18 m later. → Univariate logistic regression |
| To investigate the influence of the listed baseline CEF on the likelihood of being a recurrent secondary care user (reference: not a recurrent secondary care user) 18 m later while also accounting for age, gender, education level, employment, comorbidity, severity of fibromyalgia, illness invalidation, pain coping and spouse response to well behaviors and pain behaviors. → Multivariate logistic regression Independent variables in the model were selected based on their significance in univariate analyses. Independent variables were omitted from the final model if not contributing significantly. | |||||||
| Villani (2010) 5 [85] | IT | CS | Migraine | 465 Repeaters (n = 70): 18.6/81.4 36.4 ± 10.0 y Non-repeaters (n = 395): 18.5/81.5 34.4 ± 11.0 y | General anxiety symptoms → State-Trait Anxiety Inventory - State and trait form Depressive symptoms → Beck Depression Inventory | Patient-reported Retrospective (past 6 m) Number of ER visits → Categorized into 2 groups: - Repeaters: at least 3 ER visits, at least 1w apart during a 6 m period - Non-repeaters: all other migraine patients (amount; emergency HCU) | To investigate whether the listed CEF were influencing the likelihood of being a repeater of ER use (reference: no repeater). → Univariate logistic regression |
| Vina (2019) [86] | US | CS | Knee osteoarthritis with frequent pain | 360 76.4/23.6 64.2 ± 8.8 y | Depressive symptoms → Patient Health Questionnaire-8 → Dichotomized to moderate to severe depressive symptoms vs. no or mild depressive symptoms | Patient-reported Prospective (current use) Use of the following analgesics for knee osteoarthritis: - acetaminophen - NSAIDs - COX-2 inhibitors - opioid medications → patients were subdivided into user categories: - oral opioids (w/ or w/o other oral analgesic treatments) (type; opioid use) - oral non-opioid analgesics (type; pain medication use) - no oral analgesic use | To investigate the influence of having moderate to severe depressive symptoms (reference: no depressive symptoms) on the likelihood of using non-opioid analgesics (reference: no oral analgesics) or oral opioids (reference: no oral analgesics and oral non-opioid analgesics). → Univariate multinomial regression |
| To investigate the influence of having moderate to severe depressive symptoms (reference: no depressive symptoms) on the likelihood of using non-opioid analgesics (reference: no oral analgesics) or oral opioids (reference: no oral analgesics and oral non-opioid analgesics) while also accounting for age, sex, race income, WOMAC, comorbidity, BMI, social support and health literacy. → Multivariate multinomial regression | |||||||
| Von Korff (1991) 5 [87] | US | CS | Chronic pain → subdivided into: - Back pain - Headache - Abdominal pain - Chest pain - TMD pain Median pain duration: - Chest pain: 4 y - TMD: 6 y - Abdominal pain: 7 y - Back pain: 8 y - Headache: 12 y | Back pain n = 411 Headache n = 263 Abdominal pain n = 172 Chest pain n = 118 TMD pain n = 121 Chronic pain: 18–24 y: 9.7% 25–44 y: 64.1% 45–64 y: 18.6% 65+ y: 7.6% 41.6/58.4 TMD: 39 y 20/80 | Psychological distress → Symptom Checklist Revised - Depression and anxiety subscales → Subdivided into 3 groups for Chi2 and logistic regression analyses: - Low psychological distress - Mild-moderate psychological distress - Severe psychological distress | Patient-reported Retrospective (past 6 m) Healthcare contact w/ doctor, PT, dentist, chiropractor or other professional for a pain problem → Dichotomized into seeking care for pain problem yes/no (type; consultations) | To compare the % of people reporting a consultation for pain between the 3 psychological distress groups in the listed pain samples. → Chi2 |
| To investigate whether level of psychological distress (reference: low distress) was influencing the likelihood of seeking care for pain (reference: no care seeking) while also accounting for age, sex, distant onset, persistent pain, pain severity and self-rated health. → Logistic regression | |||||||
| Database extraction Retrospective (year before and after index visit) Total volume of ambulatory care (database extraction): count of primary care, specialty and emergency/walk-in visits (excluding optometry, PT, mental health and ancillary visits) → Dichotomized into seeking care for pain in general yes/no (amount; consultations) | To investigate the association between level of psychological distress and amount of healthcare use in the population sample and the TMD clinic sample. → Correlation | ||||||
| To investigate whether level of psychological distress is influencing the amount of healthcare used while also accounting for age, sex, chronic pain status and self-rated health in the population sample and TMD clinic sample. → Multiple linear regression | |||||||
| Von Korff (2007) 5 [132] | US | CC | Back pain, headache and TMD pain | 2010 Back pain (n = 807): 47/53 Headache (n = 831): 70/30 TMD pain (n = 372): 34/66 | Assessed at baseline Depressive symptoms → Symptom Checklist - Depression subscale Health worry → 0–10 rating about the degree of worry about pain Perceived symptom control → 0–10 rating about perceived pain control Self-efficacy beliefs Readiness for self-management of pain → custom-made scale | Database extraction Prospective (3 y study duration) Number of ambulatory healthcare visits for acute disease, chronic disease or symptomatic/ill-defined conditions excluding the index pain condition → Categorized into: - Low frequency users (<12 visits) - High frequency users (≥12 visits) (amount; consultations) | To compare the listed CEF between high and low frequency users. → t-tests |
| Walker (2016) [88] | CA | CS | Women waiting for a gynecological surgery | 590 0/100 48.3 ± 11.3 y | Psychological distress - Trait anxiety → State Trait Anxiety Inventory - Trait form - Depressive symptoms → Center for Epidemiologic Studies-Depression → Combined into 1 dummy: presence of anxiety and/or depression vs. no anxiety or depression | Patient-reported Retrospective (past 12 m) Pain-related HCU: number of visits to GP, specialists, walk-in clinics, ER or other healthcare professional → Transformed into: - GP visits: high (≥3 visits) vs. low (<3 visits) (amount; consultations) - Specialist visits: high (≥3 visits) vs. low (<3 visits) (amount; consultations) - Emergency HCU (walk-in clinic and ER visits): high (>0 visits) vs. low (0 visits) (type; emergency HCU) | To investigate the influencing of showing depressive and/or anxiety symptoms (reference: no symptoms) on the likelihood of the listed HCU outcomes. → Univariate logistic regression |
| To investigate the influence of showing anxiety and/or depressive symptoms is influencing the likelihood on the listed HCU outcomes while also accounting for age, marital status, employment status, education, BMI, current smoker, previous abdominal surgery, waiting time before surgery, menstruation status, taking hormone replacement therapy, taking birth control pills, preoperative malignancy and pain intensity. → Multivariable logistic regression | |||||||
| Wideman (2011) [126] | CA | C | Patients w/ musculoskeletal back or neck injury (soft-tissue sprain or strain) undergoing a 7 w PT intervention Mean pain duration: 8.63 ± 3.35 w | 202 39/61 36.57 ± 10.34 y | Measured directly after PT intervention Depressive symptoms → Beck Depression Inventory Catastrophizing → Pain Catastrophizing Scale Fear-avoidance beliefs Fear of movement → Tampa Scale of Kinesiophobia Self-efficacy beliefs Pain Self-efficacy → Pain Self-Efficacy Questionnaire | Patient-reported Retrospective (current use; assessed 1 y after baseline) Use of one of the following services for pain condition: PT, psychology, massage therapy and other medical services → yes/no for each, summed to a score between 0–4 (higher score indicates higher use of different services) (amount; consultations) Use of any of the following medications for pain condition: OTC NSAID’s, opioids, prescription anti-inflammatory drugs or psychotropic drugs → yes/no for each, summed to a score between 0–4 (higher score indicates higher use of different medications) (amount; pain medication use) | To investigate the association between the listed CEF and use of healthcare services and pain medication. → Correlations |
| To investigate the influence of the level of the listed CEF on the likelihood of using healthcare services (reference: no use) and pain medication (reference: no use) while also accounting for age, sex, pain duration, pretreatment OTC NSAID use, pretreatment opioid use, pretreatment anti-inflammatory use and post-treatment pain intensity as independent variables. Independent variables in the model were selected based on their significance in univariate analyses. | |||||||
| Wijnhoven (2007) [89] | NL | CS | Musculoskeletal pain Pain duration: >3 m of pain in the last 12 m | 2517 43/57 25–65 y Musculoskeletal pain was only present in a subsample (n not defined) | Catastrophizing → Pain Catastrophizing Scale → Subdivided into low, medium and high catastrophizing based on tertile scores | Patient-reported Retrospective (past 12 m) Contacts w/ GP, medical specialist or physiotherapist → Healthcare contact yes/no (type; consultations) Use of medicines for musculoskeletal pain → yes/no (type; pain medication use) | To investigate whether level of pain catastrophizing (reference: low catastrophizing) was influencing the likelihood of consulting a healthcare provider (reference: not consulting) and using pain medicines (reference: no use) while also accounting for age, household composition, educational level, smoking, overweight and physical activity. → Logistic regression Independent variables were omitted from the final model if not contributing significantly. |
| Williams (2006) [90] | US | CS | IBS Pain duration: repeated pain at least 12 w (not necessarily consecutive) in the past 12 m | 337 29/71 <35 y: 8.3% 35–44 y: 23.1% 45–54 y: 37.7% ≥55 y: 30.9% | Psychological distress → K6 scale of non-specific psychological distress Symptom-related anxiety symptoms Fear that abdominal symptoms are related to cancer or other illness (instrument not clearly stated) | Patient-reported Retrospective (past 12 m) Having a doctor’s visit for abdominal symptoms → Dichotomized into healthcare seekers vs. non-seekers (type; consultations) | To compare level of psychological distress between healthcare seekers and non-seekers. → Wilcoxon two-sample test |
| To investigate the influence of fear that symptoms are related to cancer or other serious illness on the likelihood of seeking healthcare (reference: not seeking care) in males and females. → Univariate logistic regression | |||||||
| Williams (2018) 5 [117] | US | C | Sickle cell disease | 95 27.5 y (median; range: 18–58) | Assessed within 2 w after hospital/ER visit (study inclusion) for vaso-occlusive crisis in the 30 m period of HCU monitoring General anxiety symptoms → self-designed question Depressive symptoms → self-designed question | Database extraction Prospective (daily monitoring of files for a 30 m period) Frequency of: - ER visits (amount; emergency HCU) - Day hospital visits (amount; consultations) - Hospitalizations (amount; hospitalizations) | To compare the frequency of use of the listed healthcare services while controlling for study site between patients w/ and w/o depressive symptoms and w/ and w/o anxiety symptoms. → ANCOVA |
| Wong (2019) 5 [118] | US | C | Patients undergoing laparoscopic hysterectomy | 125 46.5 ± 6.7 y 0/100 | Assessed preoperatively Depressive symptoms → Patient Health Questionnaire-9 General anxiety symptoms → Generalized Anxiety Disorder-7 Catastrophizing → Pain Catastrophizing Scale | Patient-reported Retrospective (assessed at 1 and 2 w post-surgery for the entire 2 w postoperative period) Amount of opioids used in the acute post-operative period (2 w) → all reported use was transformed to morphine milligram equivalents for analyses (amount; pain medication use) | To investigate whether the listed preoperative CEF were associated with postoperative opioid use. → Spearman correlations |
| Woodhouse (2016) [119] | NO | C | Neck/low back pain Pain duration: <1 m of complaints | 219 Conventional HCU (n = 93): 34/64 46 ± 11.9 y Alternative HCU (n = 18): 39/61 46 ± 11.5 y No HCU (n = 108): 45/55 46 ± 11.4 y | Assessed at baseline General anxiety symptoms → Hospital Anxiety and Depression Scale - Anxiety subscale Depressive symptoms → Hospital Anxiety and Depression Scale - Depression subscale → Both screen positive if score ≥ 8 | Patient-reported Retrospective (past 1 m; assessed at 1 (baseline), 2, 3, 6 and 12 m after pain onset) - Use of pain medications - Contacts w/ healthcare providers for spinal pain (yes/no; if yes, which type of provider) → Results subdivided into: - Conventional care users (users of physicians, PT, chiropractors and psychologists; users of both conventional and alternative care; users of prescribed medications or patients on sick leave) - Alternative care users (users of osteopaths, naprapaths, homeopaths, acupuncturists or other alternative healthcare providers and alternative treatments) → Finally categorized into conventional care users vs. no conventional care use (amount; HCU in general) | To investigate if presence of baseline anxiety or depressive symptoms (reference: absence of symptoms) are significant predictors of future conventional care use (reference: no conventional care use) while controlling for age, sex, time of follow-up, marital status, work-related factors and socioeconomic status. → Logistic GEE regression |
| Zebenholzer (2016) [91] | AT | CS | Episodic and chronic headache | 392 20.9/79.1 | Psychological distress Anxiety and/or depressive symptoms → Hospital Anxiety and Depression Scale → Screens positive if HADS ≥ 8 | Patient-reported Retrospective (past 12 m) Occurrence of healthcare consultations for headache: - Headache consultations (headache specialists, GP, PT, ER) → yes/no (type; consultations) - Headache-related examinations (MRI, CT, X-ray, eye test, blood tests) → yes/no (type; consultations) → Eurolight questionnaire | To compare rates of patients having a consultation or examination w/ a healthcare provider (reference: no consultation of examination) for headache between patients w/ and w/o depressive and/or anxiety symptoms. → Chi2 |
| Physician-reported Retrospective (the past) Use of prophylactic headache medications for ≥3 m → yes/no (amount; pain medication use) | To compare using prophylactic headache medications for ≥3 m (reference: shorter use) between patients w/ and w/o depressive and/or anxiety symptoms in patients presenting episodic and chronic headache, separately. → Chi2 | ||||||
| Zondervan (2001) [92] | UK | CS | Chronic pelvic pain Pain duration: ≥6 m | 475 Recent consulters (n = 153): 0/100 34.3 y Past consulters (n = 127): 0/100 37.7 y Non-consulters (n=195): 0/100 34.7 y | Symptom-related anxiety symptoms → Patient-reported self-designed question for pain anxiety | Patient-reported Retrospective (varying period, see below) - Consultation w/ GP or hospital doctor for any pelvic pain in the past 12 m → yes/no - Received a diagnosis or underwent an investigation for any pelvic pain in the past → yes/no → Categorized into: - Recent consulters (sought care in the past 12 m) - Past consulters (did not consult in the past 12 m but received a diagnosis or underwent an investigation in the past) -Non-consulters (never had a consultation, diagnosis or investigation for pelvic pain) (amount; consultations) | To investigate differences in the proportion of patients reporting pain anxiety symptoms in the 3 consulter groups. → Chi2 |
Appendix C
| Reporting | External Validity | Internal Validity | ||||||||||||||||||||||||||
|---|---|---|---|---|---|---|---|---|---|---|---|---|---|---|---|---|---|---|---|---|---|---|---|---|---|---|---|---|
| Hypothesis | Main Outcomes | Patient Characteristics | Interventions | Distributions of Principal Confounders | Findings | Estimates of Random Variability | Characteristics of Patients LTFU | Actual Probability Values | Representativeness of Patients Asked | Representativeness of Included Patients | Representativeness of Treatment Accommodation | Blinding of Study Subjects | Blinding of Assessor | Data Dredging | Adjustment for Different Follow-Up Duration | Appropriateness of Statistics | Compliance with Intervention | Outcome Measures Valid/Reliable | HCU Primarily Registered for Scientific Research | Cases and Control from the Same Population | Cases and Controls Recruited over Same Period | Study Subjects Randomized to Intervention Groups | Randomized Intervention Assignment Concealed | Adjustment for Confounding | Losses of Patients or Missing Data Taken into Account | A priori Sample Size Calculation | Total | |
| Cross-Sectional Studies | …/16 | |||||||||||||||||||||||||||
| Alschuler (2012) [48] | 1 | 1 | 1 | NA | 0 | 1 | 1 | NA | 0 | 1 | 0 | NA | NA | NA | 1 | NA | 1 | NA | 1 | 1 | NA | NA | NA | NA | 0 | 1 | 0 | 11/16 |
| Asmundson (2001) [49] | 1 | 1 | 1 | NA | 0 | 1 | 1 | NA | 1 | 1 | 0 | NA | NA | NA | 1 | NA | 0 | NA | 1 | 0 | NA | NA | NA | NA | 0 | 1 | 0 | 10/16 |
| Biggs (2003) [50] | 1 | 1 | 1 | NA | 1 | 1 | 1 | NA | 1 | 1 | 1 | NA | NA | NA | 1 | NA | 1 | NA | 1 | 0 | NA | NA | NA | NA | 1 | 0 | 0 | 13/16 |
| Boyer (2009) [51] | 1 | 1 | 1 | NA | 1 | 1 | 1 | NA | 0 | 0 | 0 | NA | NA | NA | 1 | NA | 1 | NA | 1 | 1 | NA | NA | NA | NA | 0 | 0 | 0 | 10/16 |
| Cronin (2018) [93] | 1 | 1 | 1 | NA | 1 | 1 | 1 | NA | 1 | 1 | 0 | NA | NA | NA | 1 | NA | 1 | NA | 1 | 0 | NA | NA | NA | NA | 1 | 1 | 0 | 13/16 |
| Cronin (2019) [52] | 1 | 1 | 1 | NA | 1 | 1 | 1 | NA | 1 | 1 | 0 | NA | NA | NA | 1 | NA | 1 | NA | 1 | 1 | NA | NA | NA | NA | 1 | 1 | 1 | 15/16 |
| de Boer (2012) [53] | 1 | 1 | 1 | NA | 1 | 1 | 1 | NA | 0 | 1 | 0 | NA | NA | NA | 1 | NA | 1 | NA | 1 | 1 | NA | NA | NA | NA | 1 | 0 | 0 | 12/16 |
| Elander (2003) [54] | 1 | 1 | 1 | NA | 1 | 1 | 0 | NA | 0 | 1 | 1 | NA | NA | NA | 0 | NA | 0 | NA | 1 | 1 | NA | NA | NA | NA | 0 | 1 | 0 | 8/16 |
| Elander (2014) [55] | 1 | 1 | 1 | NA | 1 | 1 | 1 | NA | 0 | 0 | 0 | NA | NA | NA | 1 | NA | 1 | NA | 1 | 1 | NA | NA | NA | NA | 1 | 0 | 0 | 11/16 |
| Fink-Miller (2014) [56] | 1 | 1 | 1 | NA | 1 | 1 | 0 | NA | 1 | 1 | 0 | NA | NA | NA | 1 | NA | 1 | NA | 1 | 0 | NA | NA | NA | NA | 1 | 0 | 0 | 11/16 |
| Grant (2000) [57] | 1 | 1 | 1 | NA | 1 | 1 | 1 | NA | 0 | 0 | 0 | NA | NA | NA | 1 | NA | 1 | NA | 1 | 1 | NA | NA | NA | NA | 1 | 0 | 0 | 11/16 |
| Harding (2019) [58] | 1 | 1 | 1 | NA | 1 | 1 | 1 | NA | 1 | 1 | 0 | NA | NA | NA | 1 | NA | 1 | NA | 1 | 1 | NA | NA | NA | NA | 1 | 0 | 0 | 13/16 |
| Hill (2007) [59] | 1 | 1 | 1 | NA | 1 | 1 | 1 | NA | 0 | 1 | 1 | NA | NA | NA | 1 | NA | 1 | NA | 1 | 1 | NA | NA | NA | NA | 1 | 1 | 0 | 14/16 |
| Howell (1999) [60] | 1 | 1 | 1 | NA | 1 | 1 | 1 | NA | 1 | 1 | 0 | NA | NA | NA | 1 | NA | 1 | NA | 1 | 1 | NA | NA | NA | NA | 1 | 0 | 0 | 13/16 |
| Jöud (2017) [7] | 1 | 1 | 1 | NA | 1 | 1 | 1 | NA | 1 | 1 | 0 | NA | NA | NA | 1 | NA | 1 | NA | 1 | 1 | NA | NA | NA | NA | 1 | 0 | 0 | 13/16 |
| Kapoor (2014) [61] | 1 | 1 | 1 | NA | 1 | 1 | 1 | NA | 1 | 1 | 1 | NA | NA | NA | 1 | NA | 1 | NA | 1 | 0 | NA | NA | NA | NA | 1 | 0 | 0 | 12/16 |
| Kratz (2018) [62] | 1 | 1 | 1 | NA | 1 | 1 | 1 | NA | 1 | 1 | 0 | NA | NA | NA | 1 | NA | 1 | NA | 1 | 1 | NA | NA | NA | NA | 1 | 0 | 0 | 12/16 |
| Lee (2008) [63] | 1 | 1 | 1 | NA | 1 | 1 | 1 | NA | 1 | 1 | 0 | NA | NA | NA | 1 | NA | 1 | NA | 1 | 1 | NA | NA | NA | NA | 1 | 0 | 1 | 14/16 |
| Lozier (2018) [64] | 1 | 1 | 1 | NA | 1 | 1 | 1 | NA | 1 | 1 | 0 | NA | NA | NA | 1 | NA | 1 | NA | 1 | 1 | NA | NA | NA | NA | 1 | 0 | 0 | 13/16 |
| Macfarlane (1999) [65] | 1 | 1 | 1 | NA | 1 | 1 | 1 | NA | 0 | 1 | 0 | NA | NA | NA | 1 | NA | 1 | NA | 1 | 1 | NA | NA | NA | NA | 1 | 1 | 0 | 13/16 |
| Macfarlane (2003) [66] | 1 | 1 | 1 | NA | 1 | 1 | 1 | NA | 1 | 1 | 0 | NA | NA | NA | 1 | NA | 1 | NA | 1 | 1 | NA | NA | NA | NA | 1 | 0 | 0 | 13/16 |
| Mann (2017) [67] | 1 | 1 | 1 | NA | 1 | 1 | 1 | NA | 1 | 1 | 0 | NA | NA | NA | 1 | NA | 1 | NA | 1 | 1 | NA | NA | NA | NA | 1 | 0 | 0 | 13/16 |
| Mannion (2013) [68] | 1 | 1 | 1 | NA | 1 | 1 | 1 | NA | 1 | 1 | 0 | NA | NA | NA | 1 | NA | 1 | NA | 1 | 1 | NA | NA | NA | NA | 1 | 0 | 0 | 12/16 |
| McCracken (1997) [69] | 1 | 1 | 1 | NA | 1 | 1 | 1 | NA | 1 | 1 | 0 | NA | NA | NA | 0 | NA | 1 | NA | 1 | 1 | NA | NA | NA | NA | 1 | 0 | 0 | 12/16 |
| McCracken (2007) [70] | 1 | 1 | 1 | NA | 1 | 1 | 1 | NA | 0 | 1 | 0 | NA | NA | NA | 1 | NA | 1 | NA | 1 | 1 | NA | NA | NA | NA | 1 | 0 | 0 | 12/16 |
| Mourad (2016) [72] | 1 | 1 | 1 | NA | 1 | 1 | 1 | NA | 1 | 1 | 0 | NA | NA | NA | 1 | NA | 1 | NA | 1 | 1 | NA | NA | NA | NA | 1 | 1 | 0 | 14/16 |
| Mourad (2018) [71] | 1 | 1 | 1 | NA | 1 | 1 | 1 | NA | 1 | 1 | 0 | NA | NA | NA | 1 | NA | 1 | NA | 1 | 1 | NA | NA | NA | NA | 0 | 1 | 0 | 13/16 |
| Ndao-Brumblay (2010) [73] | 1 | 1 | 1 | NA | 1 | 1 | 1 | NA | 0 | 1 | 0 | NA | NA | NA | 1 | NA | 1 | NA | 0 | 0 | NA | NA | NA | NA | 1 | 0 | 0 | 10/16 |
| Newman (2018) [74] | 1 | 1 | 1 | NA | 1 | 1 | 1 | NA | 1 | 0 | 0 | NA | NA | NA | 1 | NA | 1 | NA | 1 | 0 | NA | NA | NA | NA | 1 | 0 | 0 | 11/16 |
| Nielsen (2015) [75] | 1 | 1 | 1 | NA | 1 | 1 | 1 | NA | 0 | 1 | 0 | NA | NA | NA | 1 | NA | 1 | NA | 1 | 1 | NA | NA | NA | NA | 1 | 0 | 0 | 12/16 |
| Pierce (2019) [76] | 1 | 1 | 1 | NA | 1 | 1 | 1 | NA | 1 | 1 | 0 | NA | NA | NA | 1 | NA | 1 | NA | 1 | 0 | NA | NA | NA | NA | 1 | 0 | 0 | 12/16 |
| Rosenberg (2008) [77] | 1 | 1 | 1 | NA | 1 | 1 | 1 | NA | 1 | 1 | 0 | NA | NA | NA | 1 | NA | 1 | NA | 1 | 1 | NA | NA | NA | NA | 1 | 0 | 0 | 13/16 |
| Shmagel (2016) [78] | 1 | 0 | 1 | NA | 1 | 1 | 1 | NA | 1 | 1 | 1 | NA | NA | NA | 1 | NA | 1 | NA | 1 | 1 | NA | NA | NA | NA | 1 | 0 | 0 | 13/16 |
| Talley (1998) [79] | 1 | 1 | 1 | NA | 1 | 1 | 1 | NA | 1 | 1 | 1 | NA | NA | NA | 1 | NA | 1 | NA | 1 | 1 | NA | NA | NA | NA | 1 | 0 | 0 | 14/16 |
| Thorstensson (2009) [80] | 1 | 1 | 1 | NA | 1 | 1 | 1 | NA | 0 | 1 | 1 | NA | NA | NA | 1 | NA | 1 | NA | 1 | 1 | NA | NA | NA | NA | 1 | 1 | 0 | 14/16 |
| Torrance (2013) [81] | 1 | 1 | 1 | NA | 1 | 1 | 1 | NA | 1 | 1 | 1 | NA | NA | NA | 1 | NA | 1 | NA | 1 | 1 | NA | NA | NA | NA | 0 | 0 | 0 | 13/16 |
| Trask (2001) [82] | 1 | 1 | 1 | NA | 1 | 1 | 1 | NA | 0 | 1 | 1 | NA | NA | NA | 0 | NA | 1 | NA | 0 | 0 | NA | NA | NA | NA | 0 | 0 | 0 | 9/16 |
| Tsuji (2019) [83] | 1 | 1 | 1 | NA | 1 | 1 | 1 | NA | 1 | 1 | 1 | NA | NA | NA | 1 | NA | 1 | NA | 1 | 1 | NA | NA | NA | NA | 1 | 0 | 0 | 14/16 |
| Valdes (2015) [84] | 1 | 1 | 1 | NA | 1 | 1 | 1 | NA | 1 | 0 | 0 | NA | NA | NA | 0 | NA | 1 | NA | 1 | 1 | NA | NA | NA | NA | 1 | 0 | 0 | 11/16 |
| Villani (2010) [85] | 0 | 1 | 1 | NA | 1 | 1 | 1 | NA | 0 | 1 | 0 | NA | NA | NA | 1 | NA | 1 | NA | 1 | 0 | NA | NA | NA | NA | 1 | 0 | 0 | 10/16 |
| Vina (2019) [86] | 1 | 1 | 1 | NA | 1 | 1 | 1 | NA | 1 | 1 | 1 | NA | NA | NA | 1 | NA | 1 | NA | 1 | 1 | NA | NA | NA | NA | 1 | 0 | 0 | 14/16 |
| Von Korff (1991) [87] | 1 | 1 | 1 | NA | 1 | 1 | 0 | NA | 0 | 1 | 0 | NA | NA | NA | 1 | NA | 1 | NA | 1 | 1 | NA | NA | NA | NA | 1 | 0 | 0 | 11/16 |
| Walker (2016) [88] | 1 | 1 | 1 | NA | 1 | 1 | 1 | NA | 0 | 0 | 0 | NA | NA | NA | 1 | NA | 1 | NA | 1 | 1 | NA | NA | NA | NA | 1 | 0 | 0 | 11/16 |
| Wijnhoven (2007) [89] | 1 | 1 | 1 | NA | 1 | 1 | 1 | NA | 0 | 1 | 0 | NA | NA | NA | 1 | NA | 1 | NA | 1 | 1 | NA | NA | NA | NA | 1 | 0 | 0 | 12/16 |
| Williams (2006) [90] | 1 | 1 | 1 | NA | 1 | 1 | 1 | NA | 1 | 1 | 1 | NA | NA | NA | 1 | NA | 1 | NA | 1 | 1 | NA | NA | NA | NA | 1 | 0 | 0 | 14/16 |
| Zebenholzer (2016) [91] | 1 | 1 | 1 | NA | 1 | 1 | 1 | NA | 1 | 1 | 1 | NA | NA | NA | 1 | NA | 1 | NA | 1 | 1 | NA | NA | NA | NA | 0 | 0 | 0 | 13/16 |
| Zondervan (2001) [92] | 1 | 1 | 1 | NA | 1 | 1 | 1 | NA | 1 | 1 | 1 | NA | NA | NA | 1 | NA | 1 | NA | 1 | 1 | NA | NA | NA | NA | 1 | 0 | 1 | 15/16 |
| Observational Cohort Studies | …/18 | |||||||||||||||||||||||||||
| Buse (2012) [94] | 1 | 1 | 1 | NA | 1 | 1 | 1 | 0 | 0 | 1 | 0 | NA | NA | NA | 1 | 1 | 1 | NA | 1 | 1 | NA | NA | NA | NA | 1 | 0 | 0 | 13/18 |
| Carroll (2016) [96] | 1 | 1 | 1 | NA | 1 | 1 | 1 | 1 | 0 | 1 | 0 | NA | NA | NA | 1 | 1 | 0 | NA | 1 | 0 | NA | NA | NA | NA | 0 | 1 | 0 | 12/18 |
| Carroll (2018) [95] | 1 | 1 | 1 | NA | 1 | 1 | 1 | 0 | 0 | 0 | 0 | NA | NA | NA | 1 | 0 | 1 | NA | 1 | 0 | NA | NA | NA | NA | 1 | 0 | 0 | 10/18 |
| Citero (2007) [97] | 1 | 1 | 1 | NA | 1 | 1 | 1 | 1 | 1 | 1 | 0 | NA | NA | NA | 1 | 0 | 1 | NA | 1 | 1 | NA | NA | NA | NA | 0 | 0 | 0 | 13/18 |
| Demmelmaier (2010) [98] | 1 | 1 | 1 | NA | 0 | 1 | 1 | 0 | 0 | 1 | 1 | NA | NA | NA | 1 | 0 | 1 | NA | 1 | 1 | NA | NA | NA | NA | 0 | 0 | 0 | 11/18 |
| Dobkin (2006) [99] | 1 | 1 | 1 | NA | 1 | 1 | 1 | 0 | 0 | 1 | 0 | NA | NA | NA | 1 | 0 | 1 | NA | 1 | 1 | NA | NA | NA | NA | 0 | 0 | 0 | 11/18 |
| Engel (1996) [100] | 1 | 1 | 1 | NA | 1 | 1 | 1 | 0 | 0 | 1 | 0 | NA | NA | NA | 1 | 1 | 1 | NA | 1 | 0 | NA | NA | NA | NA | 1 | 0 | 0 | 12/18 |
| Gebauer (2019) [101] | 1 | 1 | 1 | NA | 1 | 1 | 1 | 0 | 1 | 1 | 0 | NA | NA | NA | 1 | 0 | 1 | NA | 1 | 0 | NA | NA | NA | NA | 1 | 1 | 0 | 13/18 |
| Gil (2004) [102] | 1 | 1 | 1 | NA | 1 | 1 | 1 | 0 | 0 | 0 | 0 | NA | NA | NA | 1 | 1 | 1 | NA | 1 | 1 | NA | NA | NA | NA | 1 | 1 | 0 | 13/18 |
| Hadlandsmyth (2013) [103] | 1 | 1 | 1 | NA | 0 | 1 | 1 | 1 | 1 | 0 | 0 | NA | NA | NA | 1 | 0 | 1 | NA | 1 | 1 | NA | NA | NA | NA | 0 | 0 | 0 | 11/18 |
| Jordan (2006) [104] | 1 | 1 | 1 | NA | 1 | 1 | 1 | 0 | 0 | 1 | 0 | NA | NA | NA | 1 | 1 | 1 | NA | 1 | 0 | NA | NA | NA | NA | 1 | 0 | 0 | 12/18 |
| Keeley (2008) [105] | 1 | 1 | 1 | NA | 1 | 1 | 1 | 0 | 1 | 1 | 0 | NA | NA | NA | 1 | 0 | 1 | NA | 1 | 1 | NA | NA | NA | NA | 1 | 0 | 0 | 13/18 |
| Kuijper (2014) [106] | 1 | 1 | 1 | NA | 1 | 1 | 1 | 0 | 1 | 1 | 0 | NA | NA | NA | 1 | 0 | 1 | NA | 1 | 1 | NA | NA | NA | NA | 1 | 1 | 0 | 16/18 |
| Lentz (2018) [107] | 1 | 1 | 1 | NA | 1 | 1 | 1 | 1 | 1 | 1 | 1 | NA | NA | NA | 1 | 0 | 1 | NA | 1 | 1 | NA | NA | NA | NA | 1 | 1 | 1 | 17/18 |
| Levenson (2008) [108] | 1 | 1 | 1 | NA | 1 | 1 | 1 | 1 | 1 | 0 | 0 | NA | NA | NA | 1 | 0 | 1 | NA | 1 | 1 | NA | NA | NA | NA | 1 | 0 | 0 | 13/18 |
| McCracken (2005; Pain) [109] | 1 | 1 | 1 | NA | 1 | 1 | 1 | 1 | 0 | 1 | 1 | NA | NA | NA | 0 | 0 | 1 | NA | 1 | 1 | NA | NA | NA | NA | 1 | 0 | 0 | 13/18 |
| Musey (2018) [110] | 1 | 1 | 1 | NA | 1 | 1 | 1 | 0 | 1 | 0 | 0 | NA | NA | NA | 1 | 0 | 1 | NA | 1 | 0 | NA | NA | NA | NA | 1 | 0 | 1 | 12/18 |
| Navabi (2018) [111] | 1 | 1 | 1 | NA | 1 | 1 | 1 | 0 | 0 | 1 | 0 | NA | NA | NA | 1 | 0 | 1 | NA | 1 | 0 | NA | NA | NA | NA | 1 | 0 | 0 | 11/18 |
| Pagé (2019) [112] | 0 | 1 | 1 | NA | 1 | 1 | 1 | 0 | 1 | 1 | 1 | NA | NA | NA | 0 | 0 | 1 | NA | 1 | 1 | NA | NA | NA | NA | 1 | 0 | 0 | 12/18 |
| Tremblay (2018) [113] | 1 | 1 | 1 | NA | 1 | 1 | 1 | 1 | 1 | 1 | 0 | NA | NA | NA | 1 | 0 | 1 | NA | 1 | 1 | NA | NA | NA | NA | 1 | 0 | 0 | 14/18 |
| Ullrich (2013) [114] | 1 | 1 | 1 | NA | 1 | 1 | 1 | 0 | 0 | 1 | 1 | NA | NA | NA | 1 | 0 | 1 | NA | 1 | 0 | NA | NA | NA | NA | 1 | 0 | 0 | 12/18 |
| Van Tilburg (2008) [115] | 1 | 1 | 1 | NA | 1 | 1 | 1 | 0 | 0 | 1 | 1 | NA | NA | NA | 1 | 0 | 1 | NA | 1 | 1 | NA | NA | NA | NA | 1 | 0 | 0 | 12/18 |
| Vervoort (2019) [116] | 1 | 1 | 1 | NA | 1 | 1 | 1 | 1 | 1 | 1 | 0 | NA | NA | NA | 1 | 0 | 1 | NA | 1 | 1 | NA | NA | NA | NA | 1 | 1 | 0 | 15/18 |
| Williams (2018) [117] | 1 | 1 | 1 | NA | 1 | 1 | 1 | 0 | 1 | 1 | 0 | NA | NA | NA | 1 | 0 | 1 | NA | 0 | 1 | NA | NA | NA | NA | 1 | 0 | 0 | 12/18 |
| Wong (2019) [118] | 1 | 0 | 1 | NA | 1 | 1 | 0 | 0 | 0 | 1 | 0 | NA | NA | NA | 1 | 0 | 1 | NA | 1 | 1 | NA | NA | NA | NA | 0 | 1 | 0 | 10/18 |
| Woodhouse (2016) [119] | 1 | 1 | 1 | NA | 1 | 1 | 1 | 0 | 1 | 1 | 0 | NA | NA | NA | 1 | 0 | 1 | NA | 1 | 1 | NA | NA | NA | NA | 1 | 0 | 0 | 13/18 |
| Single-Group Interventional Cohort Studies | …/21 | |||||||||||||||||||||||||||
| Ciechanowski (2003) [25] | 1 | 1 | 1 | 0 | 0 | 1 | 1 | 1 | 0 | 1 | 1 | 0 | NA | NA | 1 | 0 | 1 | 0 | 1 | 1 | NA | NA | NA | NA | 1 | 1 | 0 | 14/21 |
| Görge (2017) [120] | 1 | 1 | 1 | 1 | 1 | 1 | 1 | 1 | 0 | 1 | 0 | 1 | NA | NA | 1 | 0 | 1 | 0 | 1 | 1 | NA | NA | NA | NA | 1 | 1 | 0 | 16/21 |
| Huffman (2017) [121] | 1 | 1 | 1 | 1 | 1 | 1 | 1 | 1 | 0 | 0 | 0 | 0 | NA | NA | 1 | 0 | 1 | 1 | 1 | 0 | NA | NA | NA | NA | 1 | 0 | 1 | 14/21 |
| Jensen (1994) [128] | 1 | 1 | 1 | 1 | 1 | 1 | 1 | 1 | 0 | 0 | 0 | 0 | NA | NA | 0 | 1 | 1 | 0 | 1 | 1 | NA | NA | NA | NA | 1 | 0 | 0 | 13/21 |
| Jensen (2006) [122] | 1 | 1 | 1 | 0 | 1 | 1 | 0 | 1 | 1 | 1 | 1 | 0 | NA | NA | 1 | 1 | 1 | 0 | 1 | 0 | NA | NA | NA | NA | 0 | 1 | 0 | 14/21 |
| Kapoor (2012) [123] | 1 | 1 | 1 | 0 | 1 | 1 | 1 | 0 | 1 | 1 | 0 | 1 | NA | NA | 1 | 0 | 1 | 1 | 1 | 0 | NA | NA | NA | NA | 1 | 0 | 0 | 13/21 |
| McCracken (2005; Beh Res Ther) [124] | 1 | 1 | 1 | 1 | 1 | 1 | 1 | 1 | 0 | 1 | 1 | 0 | NA | NA | 0 | 1 | 1 | 0 | 1 | 1 | NA | NA | NA | NA | 0 | 0 | 0 | 13/21 |
| Osborne (2007) [129] | 1 | 1 | 1 | 0 | 1 | 1 | 1 | 1 | 1 | 0 | 0 | 1 | NA | NA | 1 | 0 | 1 | 1 | 1 | 1 | NA | NA | NA | NA | 1 | 1 | 0 | 16/21 |
| Philpot (2018) [125] | 0 | 1 | 1 | 1 | 1 | 1 | 1 | 0 | 1 | 1 | 0 | 1 | NA | NA | 1 | 0 | 1 | 0 | 1 | 0 | NA | NA | NA | NA | 1 | 0 | 0 | 13/21 |
| Primavera (1994) [127] | 1 | 1 | 1 | 1 | 0 | 1 | 0 | 0 | 1 | 1 | 0 | 0 | NA | NA | 0 | 0 | 0 | 0 | 0 | 0 | NA | NA | NA | NA | 0 | 0 | 0 | 7/21 |
| Wideman (2011) [126] | 1 | 1 | 1 | 1 | 1 | 1 | 1 | 1 | 0 | 1 | 0 | 0 | NA | NA | 1 | 0 | 1 | 0 | 1 | 1 | NA | NA | NA | NA | 1 | 0 | 0 | 14/21 |
| Case-Control Studies | …/19 | |||||||||||||||||||||||||||
| Harden (1997) [130] | 1 | 0 | 1 | NA | 1 | 1 | 1 | NA | 0 | 0 | 0 | NA | NA | 0 | 1 | NA | 1 | NA | 1 | 0 | 1 | 1 | NA | NA | 1 | 0 | 1 | 12/19 |
| Lozano-Calderon (2008) [131] | 1 | 1 | 1 | NA | 1 | 1 | 1 | NA | 1 | 1 | 1 | NA | NA | 1 | 1 | NA | 1 | NA | 1 | 1 | 1 | 1 | NA | NA | 1 | 0 | 1 | 15/19 |
| Von Korff (2007) [132] | 1 | 1 | 1 | NA | 1 | 1 | 1 | 0 | 1 | 1 | 0 | NA | NA | 0 | 1 | 1 | 1 | NA | 1 | 0 | 1 | 0 | NA | NA | 0 | 0 | 0 | 13/19 |
| RCT and multiple-group cohort studies | …/27 | |||||||||||||||||||||||||||
| Cronan (2002) [135] | 1 | 1 | 1 | 0 | 0 | 1 | 1 | 0 | 1 | 1 | 0 | 0 | 0 | 0 | 1 | 0 | 1 | 0 | 1 | 0 | 1 | 0 | 1 | 0 | 1 | 0 | 0 | 13/27 |
| Daltroy (1998) [133] | 1 | 1 | 1 | 1 | 1 | 1 | 0 | 0 | 1 | 1 | 0 | 1 | 0 | 1 | 1 | 1 | 1 | 0 | 1 | 0 | 1 | 1 | 1 | 1 | 1 | 0 | 0 | 19/27 |
| Durá-Ferrandis (2017) [134] | 1 | 1 | 1 | 1 | 1 | 1 | 1 | 1 | 0 | 1 | 1 | 0 | 0 | 1 | 1 | 0 | 1 | 0 | 1 | 1 | 1 | 0 | 1 | 1 | 1 | 0 | 0 | 19/27 |
Appendix D
| CEF | Type of HCU | Univariate Associations a | Multivariate Associations a | ||||||
|---|---|---|---|---|---|---|---|---|---|
| + | − | 0 | LoA b | + | − | 0 | LoA b | ||
| MALADAPTIVE CEF CLUSTERS | |||||||||
| Anger | Consultations | Görge [120]: 1 | Görge [120]: 1 | ? <4 | |||||
| Anxiety symptoms (general) | Pain medication use | Elander [55]: 1 Levenson [108]: 1 Nielsen [75]: 1 Wong [118] c: 1 | Elander [55]: 1 | ++ 4/5 80% | Daltroy [133] c: 1 Levenson [108]: 1 | ? <4 | |||
| Consultations | Hadlandsmyth [103]: 1 | Philpot [125] c: 2 | Demmelmaier [98]: 2 Hadlandsmyth [103]: 1 Levenson [108]: 1 Lozier [64]: 1 | 00 1/8 13% | Hadlandsmyth [103]: 1 | Philpot [125] c: 1 | Biggs [50]: 3 Philpot [125] c: 1 Williams [117] c: 1 | 00 1/7 14% | |
| Emergency HCU | Musey [110] c: 1 | Philpot [125] c: 1 Villani [85] c: 2 | 0 1/4 25% | Philpot [125] c: 1 Williams [117] c: 1 | ? <4 | ||||
| Hospitalizations | Philpot [125] c: 1 | ? <4 | Daltroy [133] c: 1 | Philpot [125] c: 1 Williams [117] c: 1 | ? <4 | ||||
| CAM use | Harding [58]: 1 | Lozier [64]: 1 | ? <4 | Harding [58]: 1 | ? <4 | ||||
| HCU in general | Harding [58]: 1 | ? <4 | Woodhouse [119]: 1 | Harding [58]: 1 | ? <4 | ||||
| Anxiety symptoms (symptom-related) | Pain medication use | Elander [55]: 1 | Elander [55]: 1 | ? <4 | Carroll [95] c: 1 | ? <4 | |||
| Consultations | Hadlandsmyth [103]: 2 Howell [60]: 3 Mourad [72]: 3 Tremblay [113]: 1 Zondervan [92]: 1 | Carroll [95] c: 1 | ++ 10/11 91% | Carroll [95] c: 1 Görge [120]: 2 Hadlandsmyth [103]: 1 Howell [60]: 1 Mourad [72]: 1 Mourad [71]: 1 Tremblay [113]: 1 | Biggs [50]: 3 Görge [120]: 1 Howell [60]: 2 Mourad [72]: 1 Mourad [71]: 1 | ? 8/16 50% | |||
| Catastrophizing | Pain medication use | Elander [55]: 1 Wideman [126]: 1 Wong [118] c: 1 | Elander [54]: 2 Elander [55]: 1 | ? 3/6 50% | Durá-Ferrandis [134]: 1 Wideman [126]: 1 | ? <4 | |||
| Consultations | Kapoor [123] c: 2 Newman [74] b: 1 Wideman [126]: 1 | Jensen [128]: 1 Kapoor [61]: 1 | Demmelmaier [98]: 2 Elander [54]: 1 | ? 4/9 44% | Ciechanowski [25]: 2 Kapoor [123] c: 2 Kapoor [61]: 1 Newman [74] b: 1 Wideman [126]: 1 | 00 0/7 0% | |||
| Emergency HCU | CItero [97]: 4 | 00 0/4 0% | CItero [97]: 4 | 00 0/4 0% | |||||
| Hospitalizations | CItero [97]: 2 | ? <4 | CItero [97]: 2 | ? <4 | |||||
| HCU in general | CItero [97]: 2 | ? <4 | CItero [97]: 2 | ? <4 | |||||
| Depressive symptoms | Pain medication use | Elander [55]: 1 Engel [100] c: 1 Levenson [108]: 1 Nielsen [75]: 1 Wideman [126]: 1 Wong [118] c: 1 | Elander [55]: 1 | ++ 6/7 86% | Engel [100] c: 1 Gil [102]: 1 | Gil [102]: 2 Kratz [62]: 1 Levenson [108]: 1 Wideman [126]: 1 | 00 2/7 29% | ||
| Consultations | Demmelmaier [98]: 1 Engel [100] c: 2 Kapoor [123] c: 1 Levenson [108]: 1 Lozier [64]: 1 Mann [67]: 1 Mourad [72]: 1 Newman [74] c: 1 Tremblay [113]: 1 Tsuji [83]: 1 Von Korff [132] c: 1 Wideman [126]: 1 | Kapoor [61]: 1 | Alschuler [48]: 7 Demmelmaier [98]: 1 Kapoor [123] c: 1 Philpot [125] c: 2 | ? 13/25 52% | Carroll [96]: 2 Gil [102]: 1 Görge [120]: 3 Kapoor [123] c: 1 Kapoor [61]: 1 Newman [74] c: 1 Shmagel [78]: 1 Tsuji [83]: 1 Ullrich [114]: 2 | Alschuler [48]: 1 Biggs [50]: 3 Ciechanowski[25]: 2 Engel [100] c: 2 Gil [102]: 2 Levenson [108]: 1 Lozier [64]: 1 Mann [67]: 1 Mourad [72]: 1 Mourad [71]: 1 Philpot [125] c: 1 Tremblay [113]: 1 Wideman [126]: 1 Williams [117] c: 1 | ? 13/32 41% | ||
| Emergency HCU | Mann [67]: 1 Tsuji [83]: 1 Villani [85] c: 1 | Philpot [125] c: 1 | Alschuler [48]: 1 Levenson [108]: 2 | ? 3/7 43% | Tsuji [83]: 1 | Philpot [125] c: 1 | Gil [102]: 3 Mann [67]: 1 Williams [117] c: 1 | 00 1/7 14% | |
| Hospitalizations | Tsuji [83]: 1 | Philpot [125] c: 1 | Levenson [108]: 1 | ? <4 | Tsuji [83]: 1 | Cronin [52]: 1 Gil [102]: 3 Philpot [125] c: 1 Ullrich [114]: 2 Williams [117] c: 1 | 00 1/9 11% | ||
| CAM use | Harding [58]: 1 | Alschuler [48]: 1 Lozier [64]: 1 | ? <4 | Harding [58]: 1 Lozier [64]: 1 | ? <4 | ||||
| HCU in general | Alschuler [48]: 1 Cronan [135] c: 1 | Alschuler [48]: 1 Cronan [135] c: 1 Harding [58]: 1 | ? 2/5 40% | Görge [120]: 1 Woodhouse [119]: 1 | Alschuler [48]: 2 Cronan [135] c: 1 Grant [57]: 1 Harding [58]: 1 | 00 2/7 29% | |||
| Fear-avoidance beliefs | Pain medication use | Wideman [126]: 1 | ? <4 | Wideman [126]: 1 | ? <4 | ||||
| Consultations | Wideman [126]: 1 | Demmelmaier [98]: 2 | ? <4 | Keeley [105]: 1 | Görge [120]: 1 Keeley [105]: 1 Wideman [126]: 1 | 00 1/4 25% | |||
| HCU in general | Görge [120]: 1 | ? <4 | |||||||
| Health worry | Consultations | Von Korff [132] c: 1 | ? <4 | ||||||
| Helplessness | Consultations | Jensen [128]: 1 | ? <4 | ||||||
| HCU in general | Cronan [135] c: 2 | ? <4 | Cronan [135] c: 1 | ? <4 | |||||
| Negative consequences beliefs | Consultations | Jensen [128]: 2 | ? <4 | Biggs [50]: 3 | ? <4 | ||||
| Negative illness beliefs | Consultations | Jensen [128]: 3 | ? <4 | Biggs [50]: 1 | Biggs [50]: 2 Görge [120]: 1 Jensen [128]: 1 | 00 1/5 20% | |||
| HCU in general | Görge [120]: 1 | ? <4 | |||||||
| Psychological distress | Pain medication use | Trask [82]: 2 Zebenholzer [91]: 2 | 00 0/4 0% | Durá-Ferrandis [134]: 1 | ? <4 | ||||
| Consultations | Lee [63]: 1 Navabi [111] c: 1 Von Korff [87] c: 4 Walker [88]: 2 | + 8/8 100% | Lee [63]: 1 | Biggs [50]: 2 | Biggs [50]: 1 Keeley [105]: 1 Kuijper [106]: 2 Von Korff [87] c: 4 Walker [88]: 2 | 00 1/13 8% | |||
| Emergency HCU | Navabi [111] c: 1 | ? <4 | |||||||
| Invasive procedures | Navabi [111] c: 1 | ? <4 | |||||||
| Hospitalizations | Navabi [111] c: 1 | ? <4 | |||||||
| HCU in general | Lentz [107]: 3 | ? <4 | |||||||
| Stress | Pain medication use | Elander [55]: 2 | ? <4 | Gil [102]: 3 | ? <4 | ||||
| Consultations | Gil [102]: 1 Keeley [105]: 1 | Gil [102]: 2 Keeley [105]: 1 | ? 2/5 40% | ||||||
| Emergency HCU | Gil [102]: 3 | ? <4 | |||||||
| Hospitalizations | Gil [102]: 3 | ? <4 | |||||||
| Symptom vigilance | Consultations | McCracken [69]: 1 Mourad [72]: 1 | Demmelmaier [98]: 2 | ? 2/4 50% | McCracken [69]: 1 | ? <4 | |||
| POSITIVE CEF CLUSTERS | |||||||||
| Pain acceptance | Pain medication use | Elander [55]: 1 McCracken [109]: 2 | Elander [55]: 1 McCracken [109]: 1 McCracken [124]: 3 | ? 3/8 38% | Kratz [62]: 1 McCracken [109]: 1 | Kratz [62]: 2 McCracken [109]: 1 | ? 2/5 40% | ||
| Perceived symptom control | Pain medication use | Daltroy [133] c: 1 Durá-Ferrandis [134]: 1 | ? <4 | ||||||
| Consultations | Von Korff [132] c: 1 | Jensen [128]: 1 | ? <4 | Biggs [50]: 3 | ? <4 | ||||
| Hospitalizations | Daltroy [133] c: 1 | ? <4 | |||||||
| Positive mood | Pain medication use | Gil [102]: 1 | Gil [102]: 2 | ? <4 | |||||
| Consultations | Gil [102]: 1 | Gil [102]: 2 | ? <4 | ||||||
| Emergency HCU | Gil [102]: 3 | ? <4 | |||||||
| Hospitalizations | Gil [102]: 2 | Gil [102]: 1 | ? <4 | ||||||
| Psychological flexibility | Pain medication use | McCracken [70]: 2 | ? <4 | McCracken [70]: 1 | ? <4 | ||||
| Consultations | McCracken [70]: 1 | ? <4 | McCracken [70]: 1 | ? <4 | |||||
| Self-compassion | Pain medication use | Elander [55]: 2 | ? <4 | ||||||
| Self-efficacy beliefs | Pain medication use | Elander [55]: 1 Wideman [126]: 1 | Elander [55]: 1 | ? <4 | Nielsen [75]: 1 Wideman [126]: 1 | ? <4 | |||
| Consultations | Mann [67]: 1 Von Korff [132] c: 1 Wideman [126]: 1 | Demmelmaier [98]: 4 Lozier [64]: 1 | ? 3/8 38% | Mann [67]: 1 | Lozier [64]: 1 Osborne [129]: 2 Wideman [126]: 1 | 00 1/5 20% | |||
| Emergency HCU | Mann [67]: 1 | ? <4 | Mann [67]: 1 Cronin [93] c: 1 | ? <4 | |||||
| Hospitalizations | Osborne [129]: 2 | ? <4 | |||||||
| CAM use | Lozier [64]: 1 | ? <4 | Lozier [64]: 1 Osborne [129]: 1 | ? <4 | |||||
| HCU in general | Cronan [135] c: 2 | ? <4 | Cronan [135] c: 1 | ? <4 | |||||
| OTHER CEF CLUSTERS | |||||||||
| Health attributions | Pain medication use | Primavera [127] c: 3 | ? <4 | ||||||
| Hospitalizations | Primavera [127] c: 3 | ? <4 | |||||||
| Locus of control | Consultations | Kuijper [106]: 1 | Kuijper [106]: 1 | Kuijper [106]: 4 | 00 1/6 17% | ||||
| CEF | Type of HCU | Univariate Associations a | Multivariate Associations a | ||||||
|---|---|---|---|---|---|---|---|---|---|
| + | − | 0 | LoA b | + | − | 0 | LoA b | ||
| MALADAPTIVE CEF CLUSTERS | |||||||||
| Anger | Prescription pain medication | Asmundson [49] c: 1 | ? <4 | Asmundson [49] c: 1 | ? <4 | ||||
| OTC pain medication | Asmundson [49] c: 1 | ? <4 | Asmundson [49] c: 1 | ? <4 | |||||
| Anxiety symptoms (general) | Prescription pain medication | Pierce [76] c: 1 | Asmundson [49] c: 1 | ? <4 | Pierce [76] c: 1 | Asmundson [49] c: 1 | ? <4 | ||
| OTC pain medication | Asmundson [49] c: 1 | ? <4 | Asmundson [49] c: 1 | ? <4 | |||||
| Opioids | Buse [94]: 3 Huffman [121] c: 1 | Harden [130] c: 1 Jensen [122] c: 1 | + 4/6 67% | Gebauer [101] c: 2 Huffman [121] c: 1 | ? <4 | ||||
| Primary care consultations | Jordan [104] c: 1 | ? <4 | Jordan [104] c: 1 | ? <4 | |||||
| Secondary care consultations | Boyer [51]: 1 Vervoort [116]: 1 | ? <4 | Vervoort [116]: 1 | ? <4 | |||||
| Emergency HCU | Musey [110] c: 1 | ? <4 | |||||||
| CAM | van Tilburg [115]: 1 | ? <4 | van Tilburg [115]: 1 | ? <4 | |||||
| Anxiety symptoms (symptom- related) | Prescription pain medication | Asmundson [49] c: 1 | Asmundson [49] c: 2 | ? <4 | Asmundson [49] c: 1 | Asmundson [49] c: 2 | ? <4 | ||
| OTC pain medication | Asmundson [49] c: 3 | ? <4 | Asmundson [49] c: 1 | Asmundson [49] c: 2 | ? <4 | ||||
| Consultations | Williams [90]: 1 | Williams [90]: 1 | ? <4 | ||||||
| Primary care consultations | Howell [60]: 3 | Macfarlane [65]: 1 | ++ 3/4 75% | Howell [60]: 1 | Howell [60]: 2 | ? <4 | |||
| Invasive procedures | Lozano-Calderon [131]: 1 | ? <4 | |||||||
| Catastrophizing | Pain medication | de Boer [53]: 1 Valdes [84]: 1 Wijnhoven [89]: 2 | de Boer [53]: 1 Valdes [84]: 1 | ++ 4/6 67% | |||||
| Prescription pain medication | Valdes [84]: 1 | ? <4 | |||||||
| Opioids | Jensen [122] c: 1 | Kapoor [61]: 1 Newman [74] c: 1 | ? <4 | Valdes [84]: 2 | Valdes [84]: 1 | ? <4 | |||
| Consultations | Wijnhoven [89]: 2 Jöud [7]: 1 | ? <4 | |||||||
| Primary care consultations | Macfarlane [65]: 1 | ? <4 | |||||||
| Secondary care consultations | Elander [54]: 1 | ? <4 | de Boer [53]: 1 | de Boer [53]: 1 | ? <4 | ||||
| Tertiary care consultations | Fink-Miller [56] c: 1 | ? <4 | Fink-Miller [56] c: 1 | ? <4 | |||||
| Invasive procedures | Lozano-Calderon [131]: 1 | ? <4 | |||||||
| Depressive symptoms | Pain medication | Vina [86]: 1 | ? <4 | Vina [86]: 1 | ? <4 | ||||
| Prescription pain medication | Alschuler [48]: 1 Pierce [76] c: 1 | Alschuler [48]: 15 Asmundson [49] c: 1 | 00 2/18 11% | Asmundson [49] c: 1 Kratz [62]: 1 Pierce [76] c: 1 | ? <4 | ||||
| OTC pain medication | Alschuler [48]: 1 | Alschuler [48]: 3 Asmundson [49] c: 1 | 00 1/5 20% | Asmundson [49] c: 1 | ? <4 | ||||
| Opioids | Buse [94]: 3 Carroll [96] c: 1 Huffman [121] c: 1 Jensen [122] c: 1 Vina [86]: 2 | Harden [130] c: 1 Kapoor [61]: 1 Newman [74] c: 1 | ++ 8/11 73% | Gebauer [101] c: 1 Vina [86]: 1 | Gebauer [101] c: 1 Huffman [121] c: 1 Kratz [62]: 1 Vina [86]: 1 | 0 2/6 33% | |||
| Primary care consultations | Pagé [112]: 2 | Alschuler [48]: 4 Jordan [104] c: 1 | 00 2/7 29% | Jordan [104] c: 1 | ? <4 | ||||
| Secondary care consultations | Vervoort [116]: 1 | Boyer [51]: 1 Engel [100] c: 1 | ? <4 | Engel [100] c: 1 Vervoort [116]: 1 | ? <4 | ||||
| Tertiary care consultations | Fink-Miller [56] c: 1 | ? <4 | |||||||
| Invasive procedures | Alschuler [48]: 1 | Alschuler [48]: 3 Lozano-Calderon [131]: 1 | 00 1/5 20% | ||||||
| Hospitalizations | Engel [100] c: 1 | ? <4 | Cronin [52]: 1 | ? <4 | |||||
| CAM | Alschuler [48]: 3 Ndao-Brumblay [73] c: 2 van Tilburg [115]: 1 | Alschuler [48]: 18 Ndao-Brumblay [73] c: 2 Pagé [112]: 2 Rosenberg [77]: 1 | 00 6/29 21% | Ndao-Brumblay [73] c: 4 van Tilburg [115]: 1 | 0 0/5 0% | ||||
| Fear-avoidance beliefs | Consultations | Mannion [68]: 2 | ? <4 | Mannion [68]: 1 | Mannion [68]: 1 | ? <4 | |||
| Frustration | Pain medication | Hill [59]: 1 | ? <4 | Hill [59]: 1 | ? <4 | ||||
| Primary care consultations | Hill [59]: 1 | ? <4 | |||||||
| Health worry | Primary care consultations | Macfarlane [65]: 2 | ? <4 | ||||||
| Helplessness | Secondary care consultations | Vervoort [116]: 1 | ? <4 | Vervoort [116]: 1 | ? <4 | ||||
| Negative consequences beliefs | Pain medication | Hill [59]: 1 | ? <4 | Hill [59]: 1 | ? <4 | ||||
| Primary care consultations | Hill [59]: 1 | ? <4 | Hill [59]: 1 | ? <4 | |||||
| Secondary care consultations | Vervoort [116]: 1 | ? <4 | Vervoort [116]: 1 | ? <4 | |||||
| Negative illness beliefs | Pain medication | Hill [59]: 1 | ? <4 | Hill [59]: 1 | Hill [59]: 1 | ? <4 | |||
| Consultations | Mannion [68]: 1 | ? <4 | Mannion [68]: 1 | ? <4 | |||||
| Primary care consultations | Hill [59]: 1 | ? <4 | Hill [59]: 1 | Hill [59]: 1 | ? <4 | ||||
| Secondary care consultations | Vervoort [116]: 2 | ? <4 | |||||||
| Psychological distress | Pain medication | Hill [59]: 1 | ? <4 | Hill [59]: 1 | ? <4 | ||||
| Prescription pain medication | Navabi [111] c: 1 Torrance [81]: 1 | ? <4 | Navabi [111] c: 1 | ? <4 | |||||
| Opioids | Jensen [122] c: 1 Navabi [111] c: 1 | Harden [130] c: 1 | ? <4 | Lentz [107]: 3 Navabi [111] c: 1 | 00 0/4 0% | ||||
| Consultations | Macfarlane [66]: 1 Mannion [68]: 1 Talley [79]: 2 Von Korff [87] c: 5 Williams [90]: 1 Zebenholzer [91]: 2 | 00 0/12 0% | Von Korff [87] c: 1 | Mannion [68]: 1 Thorstensson [80]: 2 Von Korff [87] c: 4 | 0 1/8 13% | ||||
| Primary care consultations | Hill [59]: 1 Macfarlane [65]: 1 Trask [82]: 1 | ? <4 | Hill [59]: 1 Macfarlane [65]: 1 | Macfarlane [65]: 1 Thorstensson [80]: 1 | ? 2/4 50% | ||||
| Secondary care consultations | Vervoort [116]: 1 | ? <4 | Lentz [107]: 3 | ? <4 | |||||
| Tertiary care consultations | Dobkin [99]: 1 | ? <4 | |||||||
| Emergency HCU | Walker [88]: 1 | ? <4 | Walker [88]: 1 | Lentz [107]: 3 | 00 1/4 25% | ||||
| Invasive procedures | Lentz [107]: 1 Navabi [111] c: 1 | Lentz [107]: 5 | 00 2/7 29% | ||||||
| CAM | Trask [82]: 4 | 00 0/4 0% | Thorstensson [80]: 1 | ? <4 | |||||
| Symptom vigilance | Primary care consultations | Macfarlane [65]: 1 | ? <4 | ||||||
| Thanatophobia | Primary care consultations | Macfarlane [65]: 1 | ? <4 | ||||||
| POSITIVE CEF CLUSTERS | |||||||||
| Illness Coherence | Pain medication | Hill [59]: 1 | ? <4 | Hill [59]: 1 | ? <4 | ||||
| Primary care consultations | Hill [59]: 1 | ? <4 | |||||||
| Secondary care consultations | Vervoort [116]: 1 | ? <4 | |||||||
| Pain acceptance | Prescription pain medication | Kratz [62]: 1 | Kratz [62]: 2 | ? <4 | |||||
| Opioids | Kratz [62]: 2 | Kratz [62]: 1 | ? <4 | ||||||
| Secondary care consultations | Vervoort [116]: 1 | ? <4 | |||||||
| Perceived benefits | Secondary care consultations | Vervoort [116]: 1 | ? <4 | ||||||
| Perceived symptom control | Pain medication | Hill [59]: 1 | ? <4 | Hill [59]: 1 | Hill [59]: 1 | ? <4 | |||
| Consultations | Macfarlane [66]: 1 | ? <4 | |||||||
| Primary care consultations | Hill [59]: 1 | ? <4 | Hill [59]: 1 | Hill [59]: 1 | ? <4 | ||||
| Secondary care consultations | Vervoort [116]: 1 | Vervoort [116]: 1 | ? <4 | Vervoort [116]: 1 | ? <4 | ||||
| CAM | Ndao-Brumblay [73] c: 3 | Ndao-Brumblay [73] c: 1 | + 3/4 75% | Ndao-Brumblay [73] c: 3 | Ndao-Brumblay [73] c: 1 | + 3/4 75% | |||
| Self-efficacy beliefs | Prescription pain medication | Torrance [81]: 1 | ? <4 | ||||||
| Secondary care consultations | Boyer [51]: 1 | Boyer [51]: 3 | 00 1/4 25% | ||||||
| CAM | Rosenberg [77]: 1 | ? <4 | |||||||
| OTHER CEF CLUSTERS | |||||||||
| Locus of control | Secondary care consultations | Boyer [51]: 3 | ? <4 | ||||||
| Perceived cause of symptoms | Pain medication | Hill [59]: 1 | ? <4 | ||||||
| Primary care consultations | Hill [59]: 1 | ? <4 | |||||||
References
- Salvi, S.; Apte, K.; Madas, S.; Barne, M.; Chhowala, S.; Sethi, T.; Aggarwal, K.; Agrawal, A.; Gogtay, J. Symptoms and medical conditions in 204 912 patients visiting primary health-care practitioners in India: A 1-day point prevalence study (the POSEIDON study). Lancet Glob. Health 2015, 3, e776–e784. [Google Scholar] [CrossRef]
- Seal, K.; Becker, W.; Tighe, J.; Li, Y.; Rife, T. Managing Chronic Pain in Primary Care: It Really Does Take a Village. J. Gen. Intern. Med. 2017, 32, 931–934. [Google Scholar] [CrossRef]
- Blyth, F.M.; Huckel Schneider, C. Global burden of pain and global pain policy-creating a purposeful body of evidence. Pain 2018, 159 (Suppl. 1), S43–S48. [Google Scholar] [CrossRef] [PubMed]
- Hay, S.I.; Abajobir, A.A.; Abate, K.H.; Abbafati, C.; Abbas, K.M.; Abd-Allah, F.; Abdulkader, R.S.; Abdulle, A.M.; Abebo, T.A.; Abera, S.F.; et al. Global, regional, and national disability-adjusted life-years (DALYs) for 333 diseases and injuries and healthy life expectancy (HALE) for 195 countries and territories, 1990–2016: A systematic analysis for the Global Burden of Disease Study 2016. Lancet 2017, 390, 1260–1344. [Google Scholar] [CrossRef]
- Blyth, F.M.; Briggs, A.M.; Schneider, C.H.; Hoy, D.G.; March, L.M. The Global Burden of Musculoskeletal Pain-Where to From Here? Am. J. Public Health 2019, 109, 35–40. [Google Scholar] [CrossRef]
- James, S.L.; Abate, D.; Abate, K.H.; Abay, S.M.; Abbafati, C.; Abbasi, N.; Abbastabar, H.; Abd-Allah, F.; Abdela, J.; Abdelalim, A.; et al. Global, regional, and national incidence, prevalence, and years lived with disability for 354 diseases and injuries for 195 countries and territories, 1990–2017: A systematic analysis for the Global Burden of Disease Study 2017. Lancet 2018, 392, 1789–1858. [Google Scholar] [CrossRef]
- Joud, A.; Bjork, J.; Gerdle, B.; Grimby-Ekman, A.; Larsson, B. The association between pain characteristics, pain catastrophizing and health care use—Baseline results from the SWEPAIN cohort. Scand. J. Pain 2017, 16, 122–128. [Google Scholar] [CrossRef]
- Clauw, D.J.; Essex, M.N.; Pitman, V.; Jones, K.D. Reframing chronic pain as a disease, not a symptom: Rationale and implications for pain management. Postgrad. Med. 2019, 131, 185–198. [Google Scholar] [CrossRef]
- International Association for the Study of Pain—Terminology. Available online: https://www.iasp-pain.org/Education/Content.aspx?ItemNumber=1698#Pain (accessed on 31 October 2019).
- Linton, S.J.; Shaw, W.S. Impact of psychological factors in the experience of pain. Phys. Ther. 2011, 91, 700–711. [Google Scholar] [CrossRef]
- Fillingim, R.B. Individual differences in pain: Understanding the mosaic that makes pain personal. Pain 2017, 158 (Suppl. 1), S11–S18. [Google Scholar] [CrossRef]
- Clewley, D.; Rhon, D.; Flynn, T.; Koppenhaver, S.; Cook, C. Health seeking behavior as a predictor of healthcare utilization in a population of patients with spinal pain. PLoS ONE 2018, 13, e0201348. [Google Scholar] [CrossRef] [PubMed]
- Andersen, R.M. National health surveys and the behavioral model of health services use. Med. Care 2008, 46, 647–653. [Google Scholar] [CrossRef] [PubMed]
- Andersen, R.M. Revisiting the behavioral model and access to medical care: Does it matter? J. Health Soc. Behav. 1995, 36, 1–10. [Google Scholar] [CrossRef] [PubMed]
- Calvo Lobo, C.; Vilar-Fernández, J.M.; Losa-Iglesias, M.E.; López-López, D.; Rodríguez-Sanz, D.; Palomo-López, P.; Becerro-de Bengoa-Vallejo, R. Depression Symptoms Among Older Adults with and without Subacute Low Back Pain. Rehabil. Nurs. J. 2019, 44, 47–51. [Google Scholar] [CrossRef] [PubMed]
- Lopez-Lopez, D.; Vilar-Fernandez, J.M.; Calvo-Lobo, C.; Losa-Iglesias, M.E.; Rodriguez-Sanz, D.; Becerro-de-Bengoa-Vallejo, R. Evaluation of Depression in Subacute Low Back Pain: A Case Control Study. Pain Physician 2017, 20, E499–E505. [Google Scholar] [CrossRef] [PubMed]
- Palomo-López, P.; Becerro-de-Bengoa-Vallejo, R.; Elena-Losa-Iglesias, M.; López-López, D.; Rodríguez-Sanz, D.; Cáceres-León, M.; Calvo-Lobo, C. Relationship of Depression Scores and Ranges in Women Who Suffer From Fibromyalgia by Age Distribution: A Case-Control Study. Worldviews Evid. Based Nurs. 2019, 16, 211–220. [Google Scholar] [CrossRef] [PubMed]
- Svensson, G.L.; Lundberg, M.; Ostgaard, H.C.; Wendt, G.K. High degree of kinesiophobia after lumbar disc herniation surgery: A cross-sectional study of 84 patients. Acta Orthop. 2011, 82, 732–736. [Google Scholar] [CrossRef]
- Abbott, A.D.; Tyni-Lenne, R.; Hedlund, R. Early rehabilitation targeting cognition, behavior, and motor function after lumbar fusion: A randomized controlled trial. Spine 2010, 35, 848–857. [Google Scholar] [CrossRef]
- Monticone, M.; Ferrante, S.; Teli, M.; Rocca, B.; Foti, C.; Lovi, A.; Brayda Bruno, M. Management of catastrophising and kinesiophobia improves rehabilitation after fusion for lumbar spondylolisthesis and stenosis. A randomised controlled trial. Eur. Spine J. 2014, 23, 87–95. [Google Scholar] [CrossRef]
- Rice, D.; McNair, P.; Huysmans, E.; Letzen, J.; Finan, P. Best Evidence Rehabilitation for Chronic Pain Part 5: Osteoarthritis. J. Clin. Med. 2019, 8, 1769. [Google Scholar] [CrossRef]
- Ciechanowski, P.; Sullivan, M.; Jensen, M.; Romano, J.; Summers, H. The relationship of attachment style to depression, catastrophizing and health care utilization in patients with chronic pain. Pain 2003, 104, 627–637. [Google Scholar] [CrossRef]
- Keefe, F.J.; Brown, G.K.; Wallston, K.A.; Caldwell, D.S. Coping with rheumatoid arthritis pain: Catastrophizing as a maladaptive strategy. Pain 1989, 37, 51–56. [Google Scholar] [CrossRef]
- Gil, K.M.; Abrams, M.R.; Phillips, G.; Williams, D.A. Sickle cell disease pain: 2. Predicting health care use and activity level at 9-month follow-up. J. Consult. Clin. Psychol. 1992, 60, 267–273. [Google Scholar] [CrossRef] [PubMed]
- Turner, J.A.; Jensen, M.P.; Romano, J.M. Do beliefs, coping, and catastrophizing independently predict functioning in patients with chronic pain? Pain 2000, 85, 115–125. [Google Scholar] [CrossRef]
- Hirsch, O.; Strauch, K.; Held, H.; Redaelli, M.; Chenot, J.F.; Leonhardt, C.; Keller, S.; Baum, E.; Pfingsten, M.; Hildebrandt, J.; et al. Low back pain patient subgroups in primary care: Pain characteristics, psychosocial determinants, and health care utilization. Clin. J. Pain 2014, 30, 1023–1032. [Google Scholar] [CrossRef] [PubMed]
- Frostholm, L.; Petrie, K.J.; Ornbol, E.; Fink, P. Are illness perceptions related to future healthcare expenditure in patients with somatoform disorders? Psychol. Med. 2014, 44, 2903–2911. [Google Scholar] [CrossRef]
- Frostholm, L.; Fink, P.; Christensen, K.S.; Toft, T.; Oernboel, E.; Olesen, F.; Weinman, J. The patients’ illness perceptions and the use of primary health care. Psychosom. Med. 2005, 67, 997–1005. [Google Scholar] [CrossRef]
- Schoormans, D.; Sprangers, M.A.; van Melle, J.P.; Pieper, P.G.; van Dijk, A.P.; Sieswerda, G.T.; Hulsbergen-Zwarts, M.S.; Plokker, T.H.; Brunninkhuis, L.G.; Vliegen, H.W.; et al. Clinical and psychological characteristics predict future healthcare use in adults with congenital heart disease. Eur. J. Cardiovasc. Nurs. 2016, 15, 72–81. [Google Scholar] [CrossRef]
- Vervoort, V.M.; Vriezekolk, J.E.; Olde Hartman, T.C.; Cats, H.A.; van Helmond, T.; van der Laan, W.H.; Geenen, R.; van den Ende, C.H. Cost of illness and illness perceptions in patients with fibromyalgia. Clin. Exp. Rheumatol. 2016, 34, S74–S82. [Google Scholar]
- Van Oosterwijck, J.; Nijs, J.; Meeus, M.; Truijen, S.; Craps, J.; Van den Keybus, N.; Paul, L. Pain neurophysiology education improves cognitions, pain thresholds, and movement performance in people with chronic whiplash: A pilot study. J. Rehabil. Res. Dev. 2011, 48, 43–58. [Google Scholar] [CrossRef]
- Malfliet, A.; Kregel, J.; Coppieters, I.; De Pauw, R.; Meeus, M.; Roussel, N.; Cagnie, B.; Danneels, L.; Nijs, J. Effect of Pain Neuroscience Education Combined with Cognition-Targeted Motor Control Training on Chronic Spinal Pain: A Randomized Clinical Trial. JAMA Neurol. 2018, 75, 808–817. [Google Scholar] [CrossRef] [PubMed]
- De Boer, M.J.; Versteegen, G.J.; Vermeulen, K.M.; Sanderman, R.; Struys, M.M. A randomized controlled trial of an Internet-based cognitive-behavioural intervention for non-specific chronic pain: An effectiveness and cost-effectiveness study. Eur. J. Pain 2014, 18, 1440–1451. [Google Scholar] [CrossRef] [PubMed]
- Liberati, A.; Altman, D.G.; Tetzlaff, J.; Mulrow, C.; Gotzsche, P.C.; Ioannidis, J.P.; Clarke, M.; Devereaux, P.J.; Kleijnen, J.; Moher, D. The PRISMA statement for reporting systematic reviews and meta-analyses of studies that evaluate health care interventions: Explanation and elaboration. J. Clin. Epidemiol. 2009, 62, e1–e34. [Google Scholar] [CrossRef] [PubMed]
- Richardson, W.S.; Wilson, M.C.; Nishikawa, J.; Hayward, R.S. The well-built clinical question: A key to evidence-based decisions. ACP J. Club 1995, 123, A12–A13. [Google Scholar] [PubMed]
- Huang, X.; Lin, J.; Demner-Fushman, D. Evaluation of PICO as a knowledge representation for clinical questions. AMIA Annu. Symp. Proc. AMIA Symp. 2006, 2006, 359–363. [Google Scholar]
- Association, A.P. Dictionary of Psychology. Available online: https://dictionary.apa.org/browse/a (accessed on 2 July 2020).
- Ouzzani, M.; Hammady, H.; Fedorowicz, Z.; Elmagarmid, A. Rayyan-a web and mobile app for systematic reviews. Syst. Rev. 2016, 5, 210. [Google Scholar] [CrossRef]
- Elmagarmid, A.; Fedorowicz, Z.; Hammady, H.; Ilyas, I.; Khabsa, M.; Ouzzani, M. Rayyan: A systematic reviews web app for exploring and filtering searches for eligible studies for Cochrane Reviews. In Evidence-Informed Public Health: Opportunities and Challenges; John Wiley & Sons: Hyderabad, India, 2014. [Google Scholar]
- Downs, S.H.; Black, N. The feasibility of creating a checklist for the assessment of the methodological quality both of randomised and non-randomised studies of health care interventions. J. Epidemiol. Community Health 1998, 52, 377–384. [Google Scholar] [CrossRef]
- Huysmans, E.; Goudman, L.; Van Belleghem, G.; De Jaeger, M.; Moens, M.; Nijs, J.; Ickmans, K.; Buyl, R.; Vanroelen, C.; Putman, K. Return to work following surgery for lumbar radiculopathy: A systematic review. Spine J. Off. J. North Am. Spine Soc. 2018, 18, 1694–1714. [Google Scholar] [CrossRef]
- Campbell, R.A.; Bradshaw, E.J.; Ball, N.B.; Pease, D.L.; Spratford, W. Injury epidemiology and risk factors in competitive artistic gymnasts: A systematic review. Br. J. Sports Med. 2019, 53, 1056–1069. [Google Scholar] [CrossRef]
- Freke, M.D.; Kemp, J.; Svege, I.; Risberg, M.A.; Semciw, A.; Crossley, K.M. Physical impairments in symptomatic femoroacetabular impingement: A systematic review of the evidence. Br. J. Sports Med. 2016, 50, 1180. [Google Scholar] [CrossRef]
- Sallis, J.F.; Prochaska, J.J.; Taylor, W.C. A review of correlates of physical activity of children and adolescents. Med. Sci. Sports Exerc. 2000, 32, 963–975. [Google Scholar] [CrossRef] [PubMed]
- Van Der Horst, K.; Paw, M.J.; Twisk, J.W.; Van Mechelen, W. A brief review on correlates of physical activity and sedentariness in youth. Med. Sci. Sports Exerc. 2007, 39, 1241–1250. [Google Scholar] [CrossRef] [PubMed]
- Hinkley, T.; Crawford, D.; Salmon, J.; Okely, A.D.; Hesketh, K. Preschool children and physical activity: A review of correlates. Am. J. Prev. Med. 2008, 34, 435–441. [Google Scholar] [CrossRef] [PubMed]
- Lubans, D.R.; Morgan, P.J.; Cliff, D.P.; Barnett, L.M.; Okely, A.D. Fundamental movement skills in children and adolescents: Review of associated health benefits. Sports Med. 2010, 40, 1019–1035. [Google Scholar] [CrossRef]
- Alschuler, K.N.; Jensen, M.P.; Ehde, D.M. The association of depression with pain-related treatment utilization in patients with multiple sclerosis. Pain Med. 2012, 13, 1648–1657. [Google Scholar] [CrossRef][Green Version]
- Asmundson, G.J.; Wright, K.D.; Norton, P.J.; Veloso, F. Anxiety sensitivity and other emotionality traits in predicting headache medication use in patients with recurring headaches: Implications for abuse and dependency. Addict. Behav. 2001, 26, 827–840. [Google Scholar] [CrossRef]
- Biggs, A.M.; Aziz, Q.; Tomenson, B.; Creed, F. Do childhood adversity and recent social stress predict health care use in patients presenting with upper abdominal or chest pain? Psychosom. Med. 2003, 65, 1020–1028. [Google Scholar] [CrossRef]
- Boyer, A.L.; Mira Pastor, M.A.; Calatayud, N.P.; Lopez-Roig, S.; Cantero Terol, M.C. Comparing fibromyalgia patients from primary care and rheumatology settings: Clinical and psychosocial features. Rheumatol. Int. 2009, 29, 1151–1160. [Google Scholar] [CrossRef]
- Cronin, R.M.; Hankins, J.S.; Byrd, J.; Pernell, B.M.; Kassim, A.; Adams-Graves, P.; Thompson, A.; Kalinyak, K.; DeBaun, M.; Treadwell, M. Risk factors for hospitalizations and readmissions among individuals with sickle cell disease: Results of a U.S. survey study. Hematology 2019, 24, 189–198. [Google Scholar] [CrossRef]
- De Boer, M.J.; Struys, M.M.; Versteegen, G.J. Pain-related catastrophizing in pain patients and people with pain in the general population. Eur. J. Pain 2012, 16, 1044–1052. [Google Scholar] [CrossRef]
- Elander, J.; Barry, T. Analgesic use and pain coping among patients with haemophilia. Haemoph. Off. J. World Fed. Hemoph. 2003, 9, 202–213. [Google Scholar] [CrossRef] [PubMed]
- Elander, J.; Duarte, J.; Maratos, F.A.; Gilbert, P. Predictors of painkiller dependence among people with pain in the general population. Pain Med. 2014, 15, 613–624. [Google Scholar] [CrossRef] [PubMed]
- Fink-Miller, E.L.; Long, D.M.; Gross, R.T. Comparing chronic pain treatment seekers in primary care versus tertiary care settings. J. Am. Board Fam. Med. 2014, 27, 594–601. [Google Scholar] [CrossRef] [PubMed]
- Grant, M.M.; Gil, K.M.; Floyd, M.Y.; Abrams, M. Depression and functioning in relation to health care use in sickle cell disease. Ann. Behav. Med. Publ. Soc. Behav. Med. 2000, 22, 149–157. [Google Scholar] [CrossRef]
- Harding, K.; Day, M.A.; Ehde, D.M.; Wood, A.E.; McCall, A.; Williams, R. Mental and Physical Health Correlates of Pain Treatment Utilization among Veterans with Chronic Pain: A Cross-sectional Study. Mil. Med. 2019, 184, e127–e134. [Google Scholar] [CrossRef]
- Hill, S.; Dziedzic, K.; Thomas, E.; Baker, S.R.; Croft, P. The illness perceptions associated with health and behavioural outcomes in people with musculoskeletal hand problems: Findings from the North Staffordshire Osteoarthritis Project (NorStOP). Rheumatology 2007, 46, 944–951. [Google Scholar] [CrossRef]
- Howell, S.; Talley, N.J. Does fear of serious disease predict consulting behaviour amongst patients with dyspepsia in general practice? Eur. J. Gastroenterol. Hepatol. 1999, 11, 881–886. [Google Scholar] [CrossRef]
- Kapoor, S.; Thorn, B.E. Healthcare use and prescription of opioids in rural residents with pain. Rural Remote Health 2014, 14, 2879. [Google Scholar]
- Kratz, A.L.; Murphy, J., III; Kalpakjian, C.Z.; Chen, P. Medicate or Meditate? Greater Pain Acceptance is Related to Lower Pain Medication Use in Persons with Chronic Pain and Spinal Cord Injury. Clin. J. Pain 2018, 34, 357–365. [Google Scholar] [CrossRef]
- Lee, V.; Guthrie, E.; Robinson, A.; Kennedy, A.; Tomenson, B.; Rogers, A.; Thompson, D. Functional bowel disorders in primary care: Factors associated with health-related quality of life and doctor consultation. J. Psychosom. Res. 2008, 64, 129–138. [Google Scholar] [CrossRef]
- Lozier, C.C.; Nugent, S.M.; Smith, N.X.; Yarborough, B.J.; Dobscha, S.K.; Deyo, R.A.; Morasco, B.J. Correlates of Use and Perceived Effectiveness of Non-pharmacologic Strategies for Chronic Pain Among Patients Prescribed Long-term Opioid Therapy. J. Gen. Intern. Med. 2018, 33, 46–53. [Google Scholar] [CrossRef] [PubMed]
- Macfarlane, G.J.; Morris, S.; Hunt, I.M.; Benjamin, S.; McBeth, J.; Papageorgiou, A.C.; Silman, A.J. Chronic widespread pain in the community: The influence of psychological symptoms and mental disorder on healthcare seeking behavior. J. Rheumatol. 1999, 26, 413–419. [Google Scholar] [PubMed]
- Macfarlane, T.V.; Blinkhorn, A.S.; Davies, R.M.; Kincey, J.; Worthington, H.V. Factors associated with health care seeking behaviour for orofacial pain in the general population. Community Dent. Health 2003, 20, 20–26. [Google Scholar] [PubMed]
- Mann, E.G.; Johnson, A.; Gilron, I.; VanDenKerkhof, E.G. Pain Management Strategies and Health Care Use in Community-Dwelling Individuals Living with Chronic Pain. Pain Med. 2017, 18, 2267–2279. [Google Scholar] [CrossRef] [PubMed]
- Mannion, A.F.; Wieser, S.; Elfering, A. Association between beliefs and care-seeking behavior for low back pain. Spine 2013, 38, 1016–1025. [Google Scholar] [CrossRef]
- McCracken, L.M. “Attention” to pain in persons with chronic pain: A behavioral approach. Behav. Ther. 1997, 28, 271–284. [Google Scholar] [CrossRef]
- McCracken, L.M.; Vowles, K.E. Psychological flexibility and traditional pain management strategies in relation to patient functioning with chronic pain: An examination of a revised instrument. J. Pain 2007, 8, 700–707. [Google Scholar] [CrossRef]
- Mourad, G.; Jaarsma, T.; Stromberg, A.; Svensson, E.; Johansson, P. The associations between psychological distress and healthcare use in patients with non-cardiac chest pain: Does a history of cardiac disease matter? BMC Psychiatry 2018, 18, 172. [Google Scholar] [CrossRef]
- Mourad, G.; Stromberg, A.; Johansson, P.; Jaarsma, T. Depressive Symptoms, Cardiac Anxiety, and Fear of Body Sensations in Patients with Non-Cardiac Chest Pain, and Their Relation to Healthcare-Seeking Behavior: A Cross-Sectional Study. Patient 2016, 9, 69–77. [Google Scholar] [CrossRef]
- Ndao-Brumblay, S.K.; Green, C.R. Predictors of complementary and alternative medicine use in chronic pain patients. Pain Med. 2010, 11, 16–24. [Google Scholar] [CrossRef]
- Newman, A.K.; Kapoor, S.; Thorn, B.E. Health Care Utilization for Chronic Pain in Low-Income Settings. Pain Med. 2018, 19, 2387–2397. [Google Scholar] [CrossRef] [PubMed]
- Nielsen, S.; Lintzeris, N.; Bruno, R.; Campbell, G.; Larance, B.; Hall, W.; Hoban, B.; Cohen, M.L.; Degenhardt, L. Benzodiazepine use among chronic pain patients prescribed opioids: Associations with pain, physical and mental health, and health service utilization. Pain Med. 2015, 16, 356–366. [Google Scholar] [CrossRef] [PubMed]
- Pierce, J.; Moser, S.; Hassett, A.L.; Brummett, C.M.; Christianson, J.A.; Goesling, J. Influence of Abuse History on Concurrent Benzodiazepine and Opioid Use in Chronic Pain Patients. J. Pain 2019, 20, 473–480. [Google Scholar] [CrossRef] [PubMed]
- Rosenberg, E.I.; Genao, I.; Chen, I.; Mechaber, A.J.; Wood, J.A.; Faselis, C.J.; Kurz, J.; Menon, M.; O’Rorke, J.; Panda, M.; et al. Complementary and alternative medicine use by primary care patients with chronic pain. Pain Med. 2008, 9, 1065–1072. [Google Scholar] [CrossRef]
- Shmagel, A.; Foley, R.; Ibrahim, H. Epidemiology of Chronic Low Back Pain in US Adults: Data from the 2009–2010 National Health and Nutrition Examination Survey. Arthritis Care Res. 2016, 68, 1688–1694. [Google Scholar] [CrossRef]
- Talley, N.J.; Boyce, P.; Jones, M. Dyspepsia and health care seeking in a community: How important are psychological factors? Dig. Dis. Sci. 1998, 43, 1016–1022. [Google Scholar] [CrossRef]
- Thorstensson, C.A.; Gooberman-Hill, R.; Adamson, J.; Williams, S.; Dieppe, P. Help-seeking behaviour among people living with chronic hip or knee pain in the community. BMC Musculoskelet. Disord. 2009, 10, 153. [Google Scholar] [CrossRef]
- Torrance, N.; Ferguson, J.A.; Afolabi, E.; Bennett, M.I.; Serpell, M.G.; Dunn, K.M.; Smith, B.H. Neuropathic pain in the community: More under-treated than refractory? Pain 2013, 154, 690–699. [Google Scholar] [CrossRef]
- Trask, P.C.; Iezzi, T.; Kreeft, J. Comparison of headache parameters using headache type and emotional status. J. Psychosom. Res. 2001, 51, 529–536. [Google Scholar] [CrossRef]
- Tsuji, T.; Nakata, K.; Vietri, J.; Jaffe, D.H. The added burden of depression in patients with osteoarthritis in Japan. Clin. Outcomes Res. Ceor. 2019, 11, 411–421. [Google Scholar] [CrossRef]
- Valdes, A.M.; Warner, S.C.; Harvey, H.L.; Fernandes, G.S.; Doherty, S.; Jenkins, W.; Wheeler, M.; Doherty, M. Use of prescription analgesic medication and pain catastrophizing after total joint replacement surgery. Semin. Arthritis Rheum. 2015, 45, 150–155. [Google Scholar] [CrossRef]
- Villani, V.; Di Stani, F.; Vanacore, N.; Scattoni, L.; Cerbo, R.; Bruti, G. The “repeater” phenomenon in migraine patients: A clinical and psychometric study. Headache 2010, 50, 348–356. [Google Scholar] [CrossRef] [PubMed]
- Vina, E.R.; Hausmann, L.R.M.; Obrosky, D.S.; Youk, A.; Ibrahim, S.A.; Weiner, D.K.; Gallagher, R.M.; Kwoh, C.K. Social & psychological factors associated with oral analgesic use in knee osteoarthritis management. Osteoarthr. Cartil. 2019, 27, 1018–1025. [Google Scholar] [CrossRef]
- Von Korff, M.; Wagner, E.H.; Dworkin, S.F.; Saunders, K.W. Chronic pain and use of ambulatory health care. Psychosom. Med. 1991, 53, 61–79. [Google Scholar] [CrossRef]
- Walker, S.; Hopman, W.M.; Carley, M.E.; Mann, E.G.; VanDenKerkhof, E.G. Healthcare Use for Pain in Women Waiting for Gynaecological Surgery. Pain Res. Manag. 2016, 2016, 1343568. [Google Scholar] [CrossRef]
- Wijnhoven, H.A.; de Vet, H.C.; Picavet, H.S. Sex differences in consequences of musculoskeletal pain. Spine 2007, 32, 1360–1367. [Google Scholar] [CrossRef] [PubMed]
- Williams, R.E.; Black, C.L.; Kim, H.Y.; Andrews, E.B.; Mangel, A.W.; Buda, J.J.; Cook, S.F. Determinants of healthcare-seeking behaviour among subjects with irritable bowel syndrome. Aliment. Pharmacol. Ther. 2006, 23, 1667–1675. [Google Scholar] [CrossRef] [PubMed]
- Zebenholzer, K.; Lechner, A.; Broessner, G.; Lampl, C.; Luthringshausen, G.; Wuschitz, A.; Obmann, S.M.; Berek, K.; Wober, C. Impact of depression and anxiety on burden and management of episodic and chronic headaches—A cross-sectional multicentre study in eight Austrian headache centres. J. Headache. Pain 2016, 17, 15. [Google Scholar] [CrossRef] [PubMed]
- Zondervan, K.T.; Yudkin, P.L.; Vessey, M.P.; Jenkinson, C.P.; Dawes, M.G.; Barlow, D.H.; Kennedy, S.H. The community prevalence of chronic pelvic pain in women and associated illness behaviour. Br. J. Gen. Pract. 2001, 51, 541–547. [Google Scholar]
- Cronin, R.M.; Dorner, T.L.; Utrankar, A.; Allen, W.; Rodeghier, M.; Kassim, A.A.; Jackson, G.P.; DeBaun, M.R. Increased Patient Activation Is Associated with Fewer Emergency Room Visits and Hospitalizations for Pain in Adults with Sickle Cell Disease. Pain Med. 2019, 20, 1464–1471. [Google Scholar] [CrossRef]
- Buse, D.C.; Pearlman, S.H.; Reed, M.L.; Serrano, D.; Ng-Mak, D.S.; Lipton, R.B. Opioid use and dependence among persons with migraine: Results of the AMPP study. Headache 2012, 52, 18–36. [Google Scholar] [CrossRef] [PubMed]
- Carroll, C.P.; Cichowitz, C.; Yu, T.; Olagbaju, Y.O.; Nelson, J.A.; Campbell, T.; Lanzkron, S. Predictors of acute care utilization and acute pain treatment outcomes in adults with sickle cell disease: The role of non-hematologic characteristics and baseline chronic opioid dose. Am. J. Hematol. 2018, 93, 1127–1135. [Google Scholar] [CrossRef] [PubMed]
- Carroll, C.P.; Lanzkron, S.; Haywood, C., Jr.; Kiley, K.; Pejsa, M.; Moscou-Jackson, G.; Haythornthwaite, J.A.; Campbell, C.M. Chronic Opioid Therapy and Central Sensitization in Sickle Cell Disease. Am. J. Prev. Med. 2016, 51, S69–S77. [Google Scholar] [CrossRef] [PubMed]
- Citero Vde, A.; Levenson, J.L.; McClish, D.K.; Bovbjerg, V.E.; Cole, P.L.; Dahman, B.A.; Penberthy, L.T.; Aisiku, I.P.; Roseff, S.D.; Smith, W.R. The role of catastrophizing in sickle cell disease—The PiSCES project. Pain 2007, 133, 39–46. [Google Scholar] [CrossRef]
- Demmelmaier, I.; Asenlof, P.; Lindberg, P.; Denison, E. Biopsychosocial predictors of pain, disability, health care consumption, and sick leave in first-episode and long-term back pain: A longitudinal study in the general population. Int. J. Behav. Med. 2010, 17, 79–89. [Google Scholar] [CrossRef] [PubMed]
- Dobkin, P.L.; Sita, A.; Sewitch, M.J. Predictors of adherence to treatment in women with fibromyalgia. Clin. J. Pain 2006, 22, 286–294. [Google Scholar] [CrossRef] [PubMed]
- Engel, C.C.; von Korff, M.; Katon, W.J. Back pain in primary care: Predictors of high health-care costs. Pain 1996, 65, 197–204. [Google Scholar] [CrossRef]
- Gebauer, S.; Salas, J.; Scherrer, J.F.; Burge, S.; Schneider, F.D. Disability Benefits and Change in Prescription Opioid Dose. Popul. Health Manag. 2019, 22, 503–510. [Google Scholar] [CrossRef]
- Gil, K.M.; Carson, J.W.; Porter, L.S.; Scipio, C.; Bediako, S.M.; Orringer, E. Daily mood and stress predict pain, health care use, and work activity in African American adults with sickle-cell disease. Health Psychol. Off. J. Div. Health Psychol. Am. Psychol. Assoc. 2004, 23, 267–274. [Google Scholar] [CrossRef]
- Hadlandsmyth, K.; Rosenbaum, D.L.; Craft, J.M.; Gervino, E.V.; White, K.S. Health care utilisation in patients with non-cardiac chest pain: A longitudinal analysis of chest pain, anxiety and interoceptive fear. Psychol. Health 2013, 28, 849–861. [Google Scholar] [CrossRef]
- Jordan, K.; Jinks, C.; Croft, P. A prospective study of the consulting behaviour of older people with knee pain. Br. J. Gen. Pract. 2006, 56, 269–276. [Google Scholar] [PubMed]
- Keeley, P.; Creed, F.; Tomenson, B.; Todd, C.; Borglin, G.; Dickens, C. Psychosocial predictors of health-related quality of life and health service utilisation in people with chronic low back pain. Pain 2008, 135, 142–150. [Google Scholar] [CrossRef] [PubMed]
- Kuijper, T.M.; Luime, J.J.; Alves, C.; Barendregt, P.J.; van Zeben, J.; Bindels, P.J.; Hazes, J.M. Quality of life and health care use in patients with arthralgias without synovitis compared with patients diagnosed with early rheumatoid arthritis: Data from an early arthritis cohort. Arthritis Care Res. 2014, 66, 379–386. [Google Scholar] [CrossRef] [PubMed]
- Lentz, T.A.; Beneciuk, J.M.; George, S.Z. Prediction of healthcare utilization following an episode of physical therapy for musculoskeletal pain. BMC Health Serv. Res. 2018, 18, 648. [Google Scholar] [CrossRef]
- Levenson, J.L.; McClish, D.K.; Dahman, B.A.; Bovbjerg, V.E.; Penberthy, L.T.; Aisiku, I.P.; Roberts, J.D.; Roseff, S.D.; Smith, W.R. Depression and anxiety in adults with sickle cell disease: The PiSCES project. Psychosom. Med. 2008, 70, 192–196. [Google Scholar] [CrossRef]
- McCracken, L.M.; Eccleston, C. A prospective study of acceptance of pain and patient functioning with chronic pain. Pain 2005, 118, 164–169. [Google Scholar] [CrossRef]
- Musey, P.I., Jr.; Patel, R.; Fry, C.; Jimenez, G.; Koene, R.; Kline, J.A. Anxiety Associated with Increased Risk for Emergency Department Recidivism in Patients with Low-Risk Chest Pain. Am. J. Cardiol. 2018, 122, 1133–1141. [Google Scholar] [CrossRef]
- Navabi, S.; Gorrepati, V.S.; Yadav, S.; Chintanaboina, J.; Maher, S.; Demuth, P.; Stern, B.; Stuart, A.; Tinsley, A.; Clarke, K.; et al. Influences and Impact of Anxiety and Depression in the Setting of Inflammatory Bowel Disease. Inflamm. Bowel Dis. 2018, 24, 2303–2308. [Google Scholar] [CrossRef]
- Page, M.G.; Boyd, K.; Ware, M.A. Examination of the Course of Low Back Pain Intensity Based on Baseline Predictors and Health Care Utilization among Patients Treated in Multidisciplinary Pain Clinics: A Quebec Pain Registry Study. Pain Med. 2019, 20, 564–573. [Google Scholar] [CrossRef] [PubMed]
- Tremblay, M.A.; Denis, I.; Turcotte, S.; Fleet, R.P.; Archambault, P.; Dionne, C.E.; Foldes-Busque, G. Heart-focused anxiety and health care seeking in patients with non-cardiac chest pain: A prospective study. Gen. Hosp. Psychiatry 2018, 50, 83–89. [Google Scholar] [CrossRef]
- Ullrich, P.M.; Lincoln, R.K.; Tackett, M.J.; Miskevics, S.; Smith, B.M.; Weaver, F.M. Pain, depression, and health care utilization over time after spinal cord injury. Rehabil. Psychol. 2013, 58, 158–165. [Google Scholar] [CrossRef] [PubMed]
- Van Tilburg, M.A.; Palsson, O.S.; Levy, R.L.; Feld, A.D.; Turner, M.J.; Drossman, D.A.; Whitehead, W.E. Complementary and alternative medicine use and cost in functional bowel disorders: A six month prospective study in a large HMO. BMC Complement. Altern. Med. 2008, 8, 46. [Google Scholar] [CrossRef] [PubMed]
- Vervoort, V.M.; Vriezekolk, J.E.; Olde Hartman, T.C.; van Helmond, T.; van der Laan, W.H.; Geenen, R.; van den Ende, C.H. Cognitive-behavioural and social factors do not predict recurrent secondary healthcare use in patients with fibromyalgia: A longitudinal study. Clin. Exp. Rheumatol. 2019, 37 (Suppl. 116), 44–50. [Google Scholar] [PubMed]
- Williams, H.; Silva, R.N.S.; Cline, D.; Freiermuth, C.; Tanabe, P. Social and Behavioral Factors in Sickle Cell Disease: Employment Predicts Decreased Health Care Utilization. J. Health Care Poor Underserved 2018, 29, 814–829. [Google Scholar] [CrossRef] [PubMed]
- Wong, M.; Vogell, A.; Wright, K.; Isaacson, K.; Loring, M.; Morris, S. Opioid use after laparoscopic hysterectomy: Prescriptions, patient use, and a predictive calculator. Am. J. Obstet. Gynecol. 2019, 220, 259.e1–259.e11. [Google Scholar] [CrossRef]
- Woodhouse, A.; Pape, K.; Romundstad, P.R.; Vasseljen, O. Health care contact following a new incident neck or low back pain episode in the general population; the HUNT study. BMC Health Serv. Res. 2016, 16, 81. [Google Scholar] [CrossRef]
- Gorge, M.; Ziehm, J.; Farin, E. Health-care utilization of patients with chronic back pain before and after rehabilitation. BMC Health Serv. Res. 2017, 17, 812. [Google Scholar] [CrossRef]
- Huffman, K.L.; Rush, T.E.; Fan, Y.; Sweis, G.W.; Vij, B.; Covington, E.C.; Scheman, J.; Mathews, M. Sustained improvements in pain, mood, function and opioid use post interdisciplinary pain rehabilitation in patients weaned from high and low dose chronic opioid therapy. Pain 2017, 158, 1380–1394. [Google Scholar] [CrossRef]
- Jensen, M.K.; Thomsen, A.B.; Hojsted, J. 10-year follow-up of chronic non-malignant pain patients: Opioid use, health related quality of life and health care utilization. Eur. J. Pain 2006, 10, 423–433. [Google Scholar] [CrossRef]
- Kapoor, S.; Thorn, B.E.; Allen, R.S.; Kilgo, G.R. Psychosocial Predictors of Health Care Utilization in Chronic Pain Patients Living in Rural Alabama. Ph.D. Thesis, Graduate School of The University of Alabama, Tuscaloosa, AL, USA, 2012. [Google Scholar]
- McCracken, L.M.; Vowles, K.E.; Eccleston, C. Acceptance-based treatment for persons with complex, long standing chronic pain: A preliminary analysis of treatment outcome in comparison to a waiting phase. Behav. Res. Ther. 2005, 43, 1335–1346. [Google Scholar] [CrossRef]
- Philpot, L.M.; Ramar, P.; Elrashidi, M.Y.; Sinclair, T.A.; Ebbert, J.O. A Before and After Analysis of Health Care Utilization by Patients Enrolled in Opioid Controlled Substance Agreements for Chronic Noncancer Pain. Mayo Clin. Proc. 2018, 93, 1431–1439. [Google Scholar] [CrossRef] [PubMed]
- Wideman, T.H.; Sullivan, M.J. Differential predictors of the long-term levels of pain intensity, work disability, healthcare use, and medication use in a sample of workers’ compensation claimants. Pain 2011, 152, 376–383. [Google Scholar] [CrossRef] [PubMed]
- Primavera, J.P., III; Kaiser, R.S. The relationship between locus of control, amount of pre-admission analgesic/ergot overuse, and length of stay for patients admitted for inpatient treatment of chronic headache. Headache 1994, 34, 204–208. [Google Scholar] [CrossRef] [PubMed]
- Jensen, M.P.; Turner, J.A.; Romano, J.M. Correlates of improvement in multidisciplinary treatment of chronic pain. J. Consult. Clin. Psychol. 1994, 62, 172–179. [Google Scholar] [CrossRef] [PubMed]
- Osborne, R.H.; Wilson, T.; Lorig, K.R.; McColl, G.J. Does self-management lead to sustainable health benefits in people with arthritis? A 2-year transition study of 452 Australians. J. Rheumatol. 2007, 34, 1112–1117. [Google Scholar] [PubMed]
- Harden, R.N.; Bruehl, S.; Siegler, J.; Cole, P.A. Pain, psychological status, and functional recovery in chronic pain patients on daily opioids: A case comparison. J. Back Musculoskelet. Rehabil. 1997, 9, 101–108. [Google Scholar] [CrossRef]
- Lozano-Calderon, S.A.; Souer, J.S.; Jupiter, J.B.; Ring, D. Psychological differences between patients that elect operative or nonoperative treatment for trapeziometacarpal joint arthrosis. Hand 2008, 3, 271–275. [Google Scholar] [CrossRef]
- Von Korff, M.; Lin, E.H.; Fenton, J.J.; Saunders, K. Frequency and priority of pain patients’ health care use. Clin. J. Pain 2007, 23, 400–408. [Google Scholar] [CrossRef]
- Daltroy, L.H.; Morlino, C.I.; Eaton, H.M.; Poss, R.; Liang, M.H. Preoperative education for total hip and knee replacement patients. Arthritis Care Res. Off. J. Arthritis Health Prof. Assoc. 1998, 11, 469–478. [Google Scholar] [CrossRef]
- Dura-Ferrandis, E.; Ferrando-Garcia, M.; Galdon-Garrido, M.J.; Andreu-Vaillo, Y. Confirming the mechanisms behind cognitive-behavioural therapy effectiveness in chronic pain using structural equation modeling in a sample of patients with temporomandibular disorders. Clin. Psychol. Psychother. 2017, 24, 1377–1383. [Google Scholar] [CrossRef]
- Cronan, T.A.; Serber, E.R.; Walen, H.R. Psychosocial Predictors of Health Status and Health Care Costs among People with Fibromyalgia. Anxiety Stress Coping 2002, 15, 261–274. [Google Scholar] [CrossRef]
- Shipton, E.A.; Shipton, E.E.; Shipton, A.J. A review of the opioid epidemic: What do we do about it? Pain Ther. 2018, 7, 23–36. [Google Scholar] [CrossRef] [PubMed]
- Häuser, W.; Petzke, F.; Radbruch, L.; Tölle, T.R. The opioid epidemic and the long-term opioid therapy for chronic noncancer pain revisited: A transatlantic perspective. Pain Manag. 2016, 6, 249–263. [Google Scholar] [CrossRef]
- Häuser, W.; Schug, S.; Furlan, A.D. The opioid epidemic and national guidelines for opioid therapy for chronic noncancer pain: A perspective from different continents. Pain Rep. 2017, 2, e599. [Google Scholar] [CrossRef]
- Florence, C.S.; Zhou, C.; Luo, F.; Xu, L. The Economic Burden of Prescription Opioid Overdose, Abuse, and Dependence in the United States, 2013. Med. Care 2016, 54, 901–906. [Google Scholar] [CrossRef] [PubMed]
- Manchikanti, L.; Boswell, M.V.; Hirsch, J.A. Lessons learned in the abuse of pain-relief medication: A focus on healthcare costs. Expert Rev. Neurother. 2013, 13, 527–544. [Google Scholar] [CrossRef] [PubMed][Green Version]
- Clark, J.M.; Cao, Y.; Krause, J.S. Risk of Pain Medication Misuse after Spinal Cord Injury: The Role of Substance Use, Personality, and Depression. J. Pain 2017, 18, 166–177. [Google Scholar] [CrossRef]
- Hah, J.M.; Sturgeon, J.A.; Zocca, J.; Sharifzadeh, Y.; Mackey, S.C. Factors associated with prescription opioid misuse in a cross-sectional cohort of patients with chronic non-cancer pain. J. Pain Res. 2017, 10, 979–987. [Google Scholar] [CrossRef]
- Kurlander, J.E.; Kerr, E.A.; Krein, S.; Heisler, M.; Piette, J.D. Cost-related nonadherence to medications among patients with diabetes and chronic pain: Factors beyond finances. Diabetes Care 2009, 32, 2143–2148. [Google Scholar] [CrossRef]
- Yennurajalingam, S.; Edwards, T.; Arthur, J.A.; Lu, Z.; Najera, J.; Nguyen, K.; Manju, J.; Kuriakose, L.; Wu, J.; Liu, D.; et al. Predicting the risk for aberrant opioid use behavior in patients receiving outpatient supportive care consultation at a comprehensive cancer center. Cancer 2018, 124, 3942–3949. [Google Scholar] [CrossRef] [PubMed]
- Leeuw, M.; Goossens, M.E.; Linton, S.J.; Crombez, G.; Boersma, K.; Vlaeyen, J.W. The fear-avoidance model of musculoskeletal pain: Current state of scientific evidence. J. Behav. Med. 2007, 30, 77–94. [Google Scholar] [CrossRef] [PubMed]
- McLeod, C.C.; Klabunde, C.N.; Willis, G.B.; Stark, D. Health care provider surveys in the United States, 2000–2010: A review. Eval. Health Prof. 2013, 36, 106–126. [Google Scholar] [CrossRef] [PubMed]
- Michaelides, A.; Zis, P. Depression, anxiety and acute pain: Links and management challenges. Postgrad. Med. 2019, 131, 438–444. [Google Scholar] [CrossRef] [PubMed]
- Sullivan, M.J.; Bishop, S.R.; Pivik, J. The Pain Catastrophizing Scale: Development and Validation. Psychol. Assess. 1995, 7, 524–532. [Google Scholar] [CrossRef]
- Sullivan, M.J.; Neish, N.R. Catastrophizing, anxiety and pain during dental hygiene treatment. Community Dent. Oral Epidemiol. 1998, 26, 344–349. [Google Scholar] [CrossRef]
- Martinez-Calderon, J.; Jensen, M.P.; Morales-Asencio, J.M.; Luque-Suarez, A. Pain Catastrophizing and Function In Individuals with Chronic Musculoskeletal Pain: A Systematic Review and Meta-Analysis. Clin. J. Pain 2019, 35, 279–293. [Google Scholar] [CrossRef]
- Hoogendam, L.; van der Oest, M.J.W.; Tsehaie, J.; Wouters, R.M.; Vermeulen, G.M.; Slijper, H.P.; Selles, R.W.; Porsius, J.T. Psychological factors are more strongly associated with pain than radiographic severity in non-invasively treated first carpometacarpal osteoarthritis. Disabil. Rehabil. 2019, 1–6. [Google Scholar] [CrossRef]
- Kennedy, P.; Joshi, R.; Dhawan, A. The Effect of Psychosocial Factors on Outcomes in Patients with Rotator Cuff Tears: A Systematic Review. Arthroscopy 2019, 35, 2698–2706. [Google Scholar] [CrossRef]
- Lee, H.; Hübscher, M.; Moseley, G.L.; Kamper, S.J.; Traeger, A.C.; Mansell, G.; McAuley, J.H. How does pain lead to disability? A systematic review and meta-analysis of mediation studies in people with back and neck pain. Pain 2015, 156, 988–997. [Google Scholar] [CrossRef]
- Crombez, G.; Eccleston, C.; Van Damme, S.; Vlaeyen, J.W.S.; Karoly, P. Fear-avoidance model of chronic pain: The next generation. Clin. J. Pain 2012, 28, 475–483. [Google Scholar] [CrossRef]
- Babitsch, B.; Gohl, D.; von Lengerke, T. Re-revisiting Andersen’s Behavioral Model of Health Services Use: A systematic review of studies from 1998–2011. Psycho-Soc. Med. 2012, 9. [Google Scholar] [CrossRef]
- Andersen, R.; Newman, J.F. Societal and individual determinants of medical care utilization in the United States. Milbank Meml. Fund Q. Health Soc. 1973, 51, 95–124. [Google Scholar] [CrossRef]
- Louw, A.; Puentedura, E.J.; Reed, J.; Zimney, K.; Grimm, D.; Landers, M.R. A controlled clinical trial of preoperative pain neuroscience education for patients about to undergo total knee arthroplasty. Clin. Rehabil. 2019, 33, 1722–1731. [Google Scholar] [CrossRef] [PubMed]
- Gallagher, L.; McAuley, J.; Moseley, G.L. A randomized-controlled trial of using a book of metaphors to reconceptualize pain and decrease catastrophizing in people with chronic pain. Clin. J. Pain 2013, 29, 20–25. [Google Scholar] [CrossRef] [PubMed]
- Watson, J.A.; Ryan, C.G.; Cooper, L.; Ellington, D.; Whittle, R.; Lavender, M.; Dixon, J.; Atkinson, G.; Cooper, K.; Martin, D.J. Pain Neuroscience Education for Adults with Chronic Musculoskeletal Pain: A Mixed-Methods Systematic Review and Meta-Analysis. J. Pain Off. J. Am. Pain Soc. 2019, 20, 1140.e1–1140.e22. [Google Scholar] [CrossRef] [PubMed]
- Bodes Pardo, G.; Lluch Girbés, E.; Roussel, N.A.; Gallego Izquierdo, T.; Jiménez Penick, V.; Pecos Martín, D. Pain Neurophysiology Education and Therapeutic Exercise for Patients with Chronic Low Back Pain: A Single-Blind Randomized Controlled Trial. Arch. Phys. Med. Rehabil. 2018, 99, 338–347. [Google Scholar] [CrossRef]
- Malfliet, A.; Kregel, J.; Meeus, M.; Danneels, L.; Cagnie, B.; Roussel, N.; Nijs, J. Patients with Chronic Spinal Pain Benefit From Pain Neuroscience Education Regardless the Self-Reported Signs of Central Sensitization: Secondary Analysis of a Randomized Controlled Multicenter Trial. PMR J. Inj. Funct. Rehabil. 2018, 10, 1330–1343. [Google Scholar] [CrossRef]
- Moseley, G.L.; Nicholas, M.K.; Hodges, P.W. A randomized controlled trial of intensive neurophysiology education in chronic low back pain. Clin. J. Pain 2004, 20, 324–330. [Google Scholar] [CrossRef]
- Lluch, E.; Duenas, L.; Falla, D.; Baert, I.; Meeus, M.; Sanchez-Frutos, J.; Nijs, J. Preoperative Pain Neuroscience Education Combined with Knee Joint Mobilization for Knee Osteoarthritis: A Randomized Controlled Trial. Clin. J. Pain 2018, 34, 44–52. [Google Scholar] [CrossRef]
- Deguchi, N.; Hirakawa, Y.; Izawa, S.; Yokoyama, K.; Muraki, K.; Oshibuti, R.; Higaki, Y. Effects of pain neuroscience education in hospitalized patients with high tibial osteotomy: A quasi-experimental study using propensity score matching. BMC Musculoskelet. Disord. 2019, 20, 516. [Google Scholar] [CrossRef]
- Louw, A.; Zimney, K.; Reed, J.; Landers, M.; Puentedura, E.J. Immediate preoperative outcomes of pain neuroscience education for patients undergoing total knee arthroplasty: A case series. Physiother. Theory Pract. 2019, 35, 543–553. [Google Scholar] [CrossRef] [PubMed]
- Van Oosterwijck, J.; Meeus, M.; Paul, L.; De Schryver, M.; Pascal, A.; Lambrecht, L.; Nijs, J. Pain physiology education improves health status and endogenous pain inhibition in fibromyalgia: A double-blind randomized controlled trial. Clin. J. Pain 2013, 29, 873–882. [Google Scholar] [CrossRef] [PubMed]
- Meeus, M.; Nijs, J.; Van Oosterwijck, J.; Van Alsenoy, V.; Truijen, S. Pain physiology education improves pain beliefs in patients with chronic fatigue syndrome compared with pacing and self-management education: A double-blind randomized controlled trial. Arch. Phys. Med. Rehabil. 2010, 91, 1153–1159. [Google Scholar] [CrossRef] [PubMed]
- Louw, A.; Diener, I.; Landers, M.R.; Puentedura, E.J. Preoperative pain neuroscience education for lumbar radiculopathy: A multicenter randomized controlled trial with 1-year follow-up. Spine 2014, 39, 1449–1457. [Google Scholar] [CrossRef] [PubMed]
- Louw, A.; Diener, I.; Landers, M.R.; Zimney, K.; Puentedura, E.J. Three-year follow-up of a randomized controlled trial comparing preoperative neuroscience education for patients undergoing surgery for lumbar radiculopathy. J. Spine Surg. 2016, 2, 289–298. [Google Scholar] [CrossRef] [PubMed]

| Inclusion | Exclusion |
|---|---|
| Full text (arms of) (quasi-)experimental studies or observational studies | Case reports, systematic reviews and meta-analyses, narrative reviews, letters to the editor, expert opinions, conference abstracts, studies without available full-text version |
| English, French or Dutch written | Other languages |
| Evaluation of the relationship between CEF, including but not limited to, anger, anxiety symptoms, catastrophizing, depressive symptoms, fear-avoidance beliefs, illness beliefs, psychological distress, stress, self-compassion, symptom vigilance, pain acceptance, perceived symptom control and self-efficacy beliefs, and HCU | No investigation of the relationship between CEF and HCU |
| CEF assessed by means of patient-reported instruments | Instruments specifically designed for physicians to diagnose psychiatric conditions (e.g., PRIME-MD, Anxiety Disorders Interview Schedule for DSM-IV) |
| HCU reported in terms of amount of HCU (of a particular type of HCU or of HCU in general) or in terms of type of healthcare services used (absence/presence of certain types of HCU) | Studies only reporting healthcare costs, without mentioning utilization, those only investigating adherence to recommendations, medication misuse or substance abuse for non-medical purposes and studies concerning the use of assistive or ergonomic devices (e.g., prosthesis, orthosis and canes) |
| Participants had to be adults (≥18 years old) experiencing either acute, subacute or chronic pain. | Complete or part of the sample was not experiencing pain and no separate analysis for people with pain was executed. Studies on children, women experiencing labor pain, people suffering from dementia, intraoperative subjects and palliative patients. |
| Studies reporting a quantified association or relationship analyzed by using statistics. | Studies only reporting observations without quantitative analysis or studies only including qualitative analyses. |
| Reliable and Valid Outcome Measures 1 | Reporting of Results 1 | Generalizability of Results 1 | Risk of Bias (High/Moderate/Low) 2 | |
|---|---|---|---|---|
| Alschuler (2012) [48] | Moderate | |||
| Asmundson (2001) [49] | High | |||
| Biggs (2003) [50] | Moderate | |||
| Boyer (2009) [51] | Moderate | |||
| Buse (2012) [94] | Moderate | |||
| Carroll (2016) [96] | High | |||
| Carroll (2018) [95] | High | |||
| Ciechanowski (2003) [25] | Low | |||
| Citero (2007) [97] | Moderate | |||
| Cronan (2002) [135] | High | |||
| Cronin (2018) [93] | High | |||
| Cronin (2019) [52] | Moderate | |||
| Daltroy (1998) [133] | High | |||
| De Boer (2012) [53] | Moderate | |||
| Demmelmaier (2010) [98] | Low | |||
| Dobkin (2006) [99] | Moderate | |||
| Durá-Ferrandis (2017) [134] | Low | |||
| Elander (2003) [54] | Moderate | |||
| Elander (2014) [55] | Moderate | |||
| Engel (1996) [100] | High | |||
| Fink-Miller (2014) [56] | High | |||
| Gebauer (2019) [101] | High | |||
| Gil (2004) [102] | Moderate | |||
| Görge (2017) [120] | Moderate | |||
| Grant (2000) [57] | Moderate | |||
| Hadlandsmyth (2013) [103] | Moderate | |||
| Harden (1997) [130] | High | |||
| Harding (2019) [58] | Moderate | |||
| Hill (2007) [59] | Low | |||
| Howell (1999) [60] | Moderate | |||
| Huffman (2017) [121] | High | |||
| Jensen (1994) [128] | Moderate | |||
| Jensen (2006) [122] | High | |||
| Jordan (2006) [104] | High | |||
| Jöud (2017) [7] | Moderate | |||
| Kapoor (2012) [123] | High | |||
| Kapoor (2014) [61] | Moderate | |||
| Keeley (2008) [105] | Moderate | |||
| Kratz (2018) [62] | Moderate | |||
| Kuijper (2014) [106] | Moderate | |||
| Lee (2008) [63] | Moderate | |||
| Lentz (2018) [107] | Low | |||
| Levenson (2008) [108] | Moderate | |||
| Lozano-Calderon (2008) [131] | Low | |||
| Lozier (2018) [64] | Moderate | |||
| Macfarlane (1999) [65] | Moderate | |||
| Macfarlane (2003) [66] | Moderate | |||
| Mann (2017) [67] | Moderate | |||
| Mannion (2013) [68] | Moderate | |||
| McCracken (1997) [69] | Moderate | |||
| McCracken (2005; Pain) [109] | Low | |||
| McCracken (2005; Beh Res Ther) [124] | Low | |||
| McCracken (2007) [70] | Moderate | |||
| Mourad (2016) [72] | Moderate | |||
| Mourad (2018) [71] | Moderate | |||
| Musey (2018) [110] | High | |||
| Navabi (2018) [111] | High | |||
| Ndao-Brumblay (2010) [73] | High | |||
| Newman (2018) [74] | High | |||
| Nielsen (2015) [75] | Moderate | |||
| Osborne (2007) [129] | Moderate | |||
| Pagé (2019) [112] | Low | |||
| Philpot (2018) [125] | High | |||
| Pierce (2019) [76] | High | |||
| Primavera (1994) [127] | High | |||
| Rosenberg (2008) [77] | Moderate | |||
| Shmagel (2016) [78] | Moderate | |||
| Talley (1998) [79] | Low | |||
| Thorstensson (2009) [80] | Low | |||
| Torrance (2013) [81] | Low | |||
| Trask (2001) [82] | Moderate | |||
| Tremblay (2018) [113] | Moderate | |||
| Tsuji (2019) [83] | Low | |||
| Ullrich (2013) [114] | Moderate | |||
| Valdes (2015) [84] | Moderate | |||
| van Tilburg (2008) [115] | Low | |||
| Vervoort (2019) [116] | Moderate | |||
| Villani (2010) [85] | High | |||
| Vina (2019) [86] | Low | |||
| Von Korff (1991) [87] | High | |||
| Von Korff (2007) [132] | High | |||
| Walker (2016) [88] | Moderate | |||
| Wideman (2011) [126] | Moderate | |||
| Wijnhoven (2007) [89] | Moderate | |||
| Williams (2006) [90] | Low | |||
| Williams (2018) [117] | High | |||
| Wong (2019) [118] | High | |||
| Woodhouse (2016) [119] | Moderate | |||
| Zebenholzer (2016) [91] | Low | |||
| Zondervan (2001) [92] | Low |
© 2020 by the authors. Licensee MDPI, Basel, Switzerland. This article is an open access article distributed under the terms and conditions of the Creative Commons Attribution (CC BY) license (http://creativecommons.org/licenses/by/4.0/).
Share and Cite
Huysmans, E.; Leemans, L.; Beckwée, D.; Nijs, J.; Ickmans, K.; Moens, M.; Goudman, L.; Buyl, R.; Putman, K.; Coppieters, I. The Relationship between Cognitive and Emotional Factors and Healthcare and Medication Use in People Experiencing Pain: A Systematic Review. J. Clin. Med. 2020, 9, 2486. https://doi.org/10.3390/jcm9082486
Huysmans E, Leemans L, Beckwée D, Nijs J, Ickmans K, Moens M, Goudman L, Buyl R, Putman K, Coppieters I. The Relationship between Cognitive and Emotional Factors and Healthcare and Medication Use in People Experiencing Pain: A Systematic Review. Journal of Clinical Medicine. 2020; 9(8):2486. https://doi.org/10.3390/jcm9082486
Chicago/Turabian StyleHuysmans, Eva, Lynn Leemans, David Beckwée, Jo Nijs, Kelly Ickmans, Maarten Moens, Lisa Goudman, Ronald Buyl, Koen Putman, and Iris Coppieters. 2020. "The Relationship between Cognitive and Emotional Factors and Healthcare and Medication Use in People Experiencing Pain: A Systematic Review" Journal of Clinical Medicine 9, no. 8: 2486. https://doi.org/10.3390/jcm9082486
APA StyleHuysmans, E., Leemans, L., Beckwée, D., Nijs, J., Ickmans, K., Moens, M., Goudman, L., Buyl, R., Putman, K., & Coppieters, I. (2020). The Relationship between Cognitive and Emotional Factors and Healthcare and Medication Use in People Experiencing Pain: A Systematic Review. Journal of Clinical Medicine, 9(8), 2486. https://doi.org/10.3390/jcm9082486