Clinical and Analytical Validation of a Novel Urine-Based Test for the Detection of Allograft Rejection in Renal Transplant Patients

 ,
,
Abstract
1. Introduction
2. Experimental Section
2.1. Study Population and Sample Collection
2.2. Kidney Biopsy
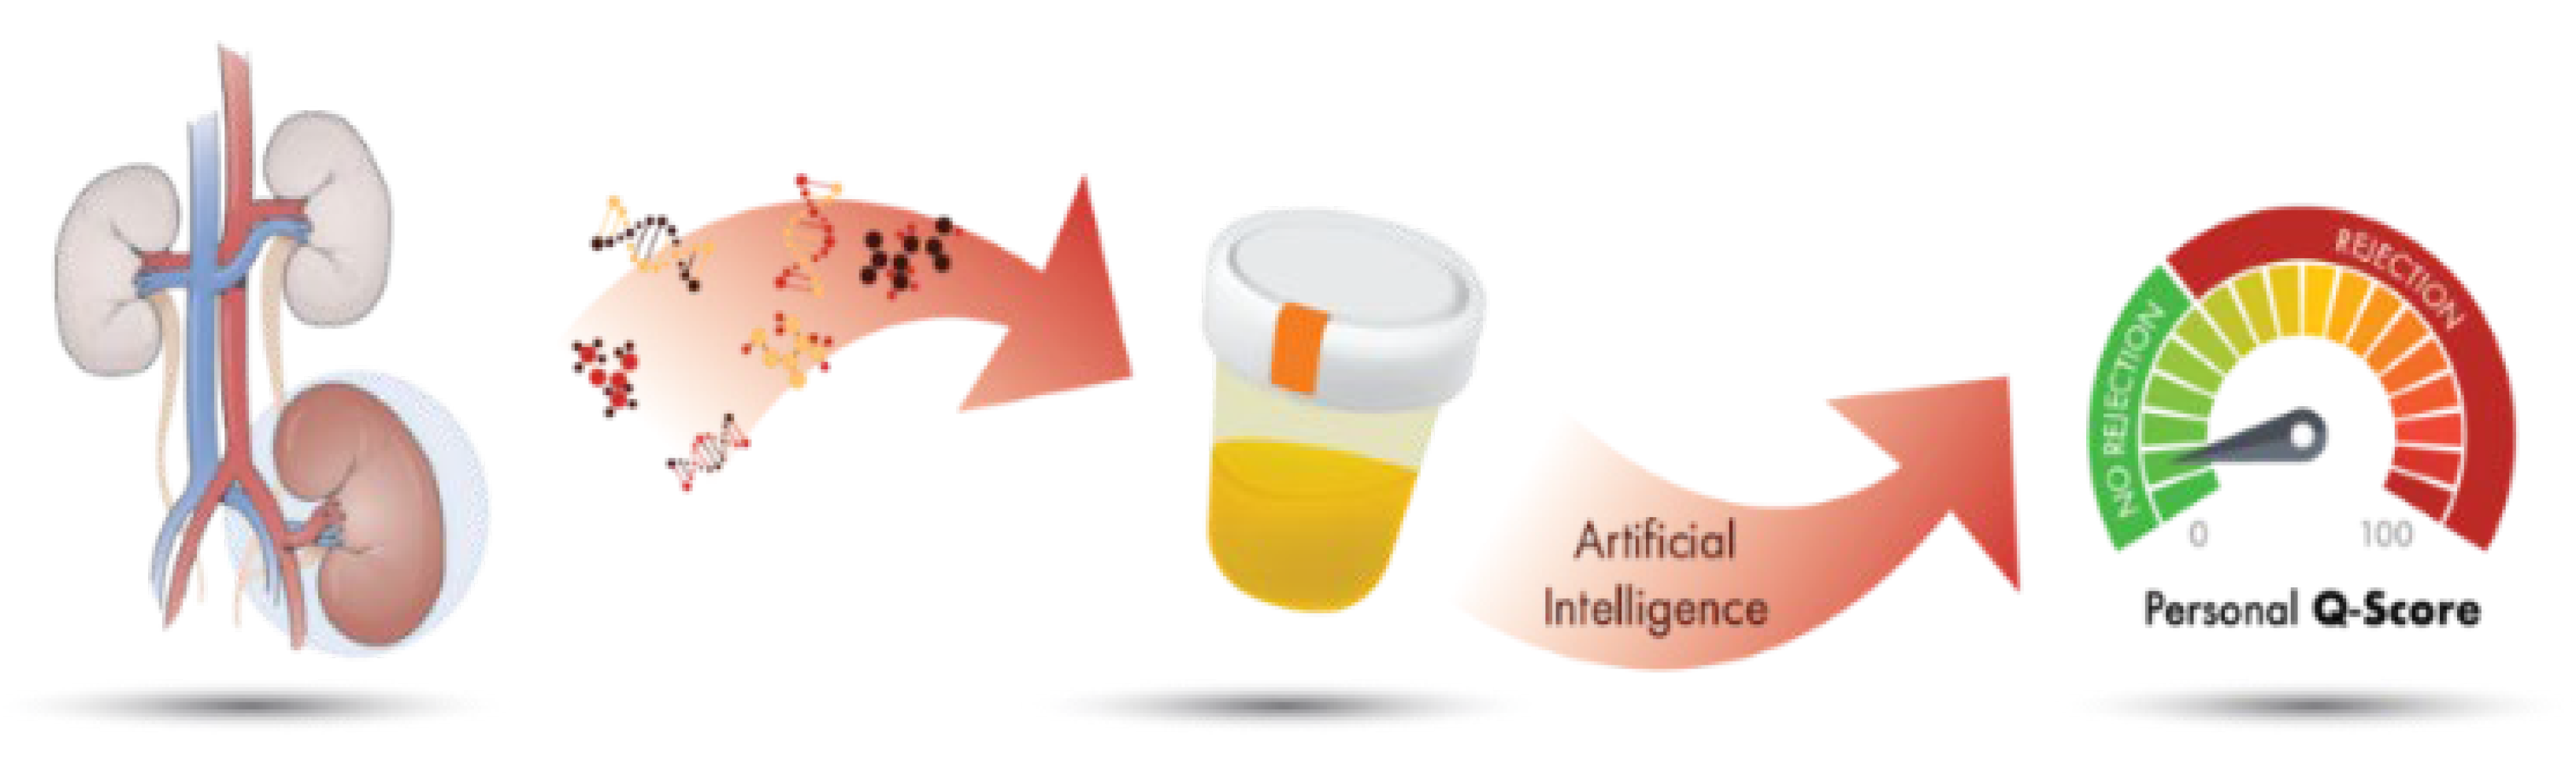
2.3. QSant Assay
2.4. Statistical Analysis and Algorithm Development
3. Results
3.1. Study Design and Cohort Description
3.2. Differentiation of AR Patients from STA Patients
3.3. Comparison of QSant Performance to Clinical Parameters
3.4. QSant Utility in Pediatric Transplant Patients
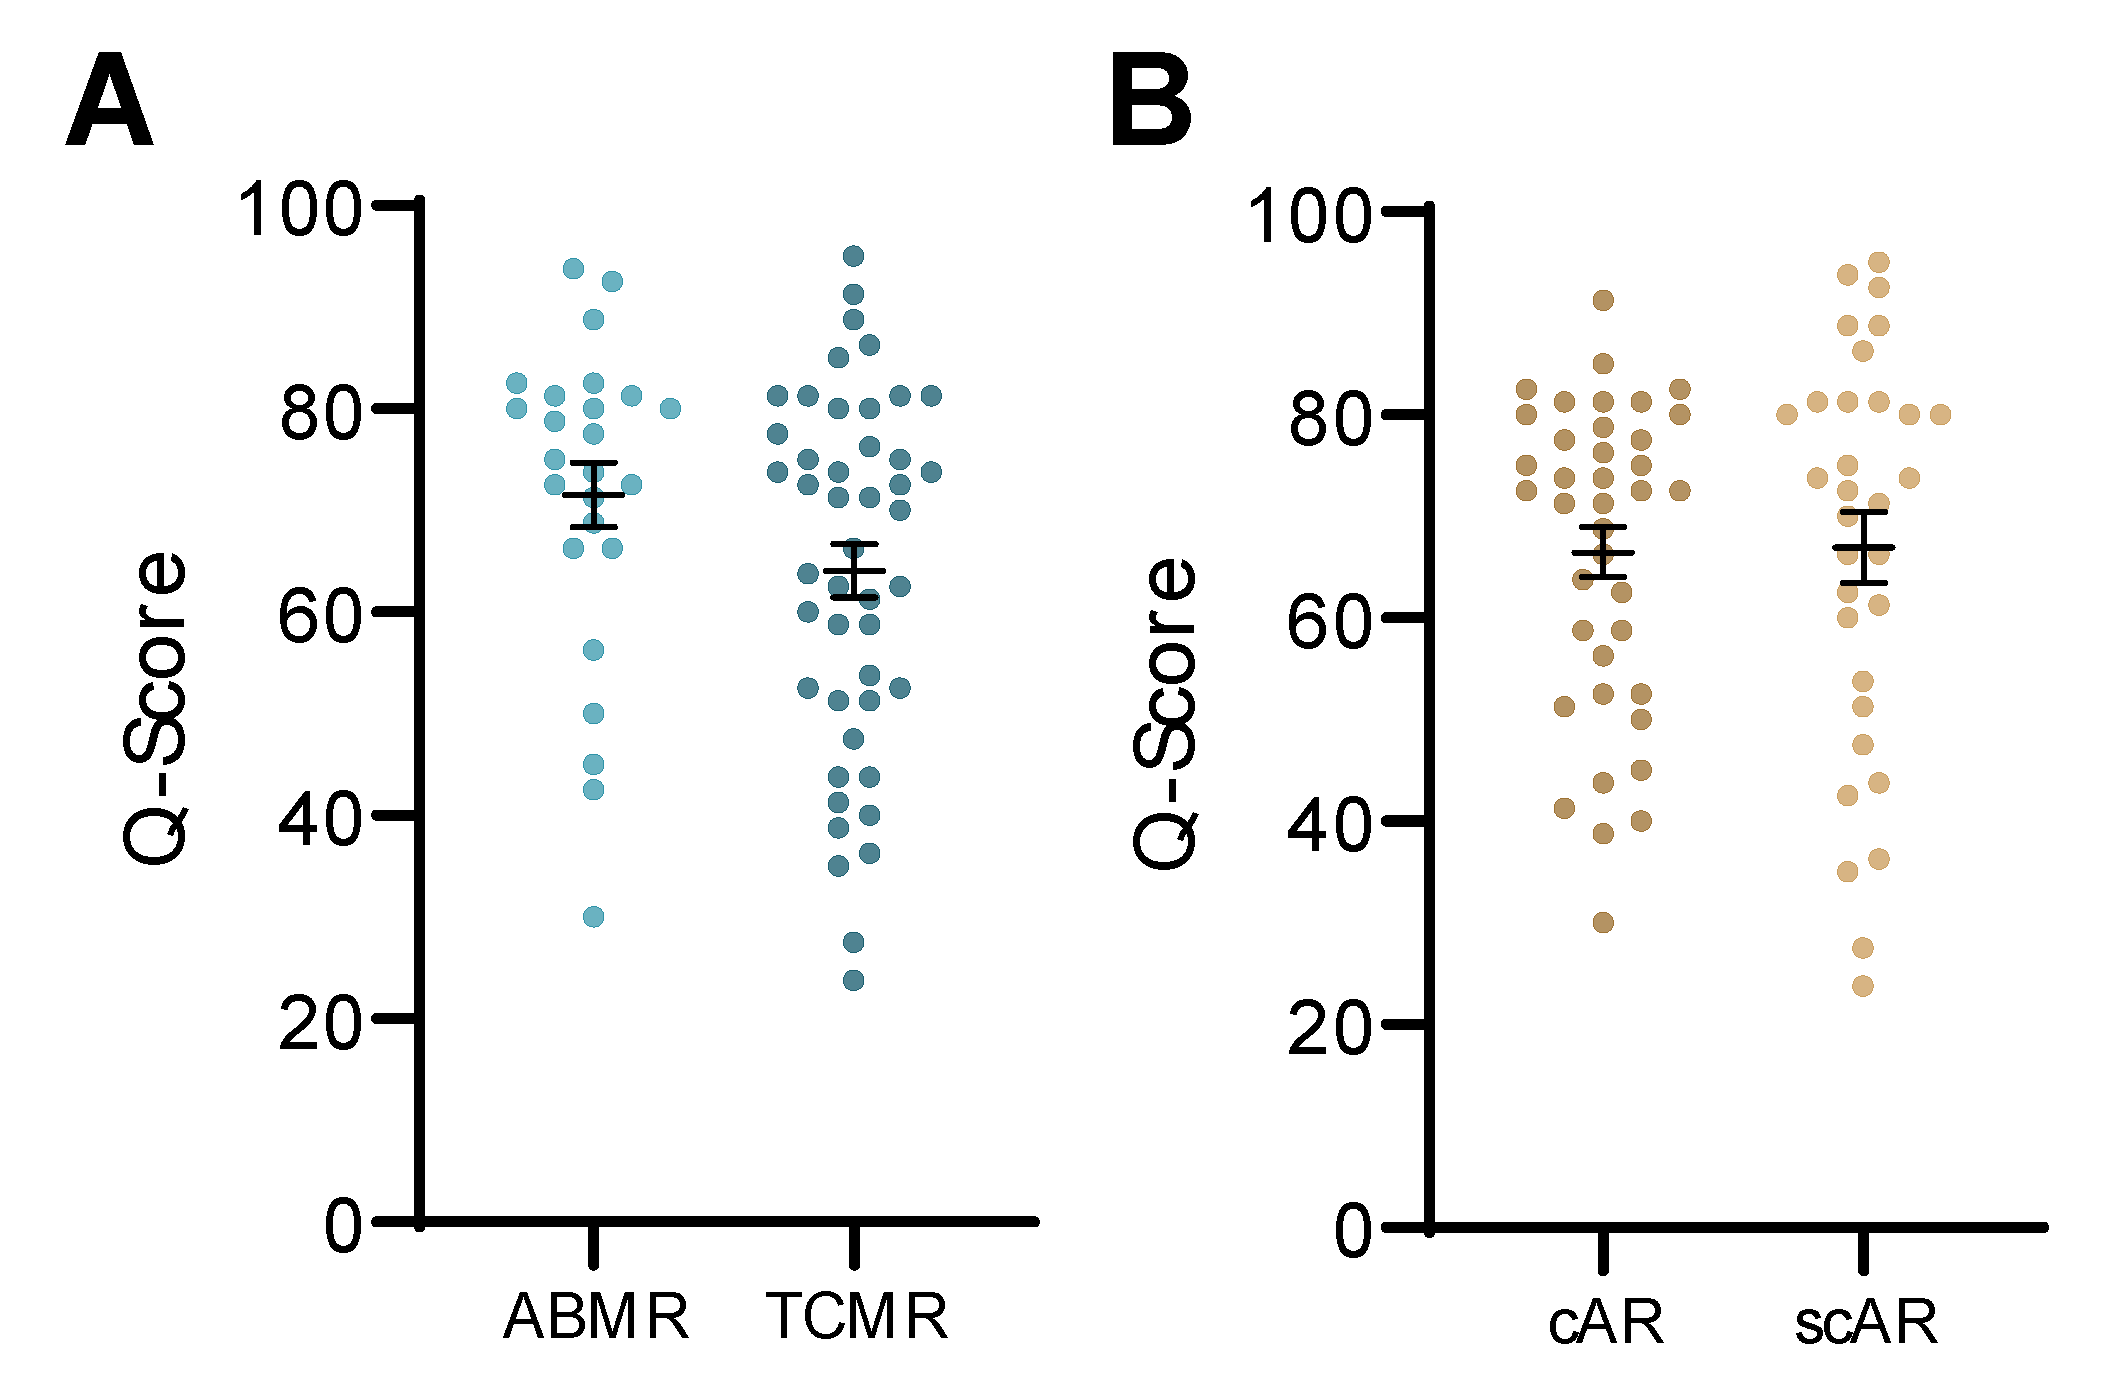
3.5. Correlations of Q-Scores to Different Transplant Rejection Phenotypes
3.6. Detection of Subclinical Allograft Rejection
3.7. Timing of QSant Post-Transplantation
3.8. Avoiding Unnecessary Biopsies
4. Discussion
5. Conclusions
Author Contributions
Funding
Acknowledgments
Conflicts of Interest
References
- Hart, A.; Smith, J.M.; Skeans, M.A.; Gustafson, S.K.; Wilk, A.R.; Castro, S.; Robinson, A.; Wainright, J.L.; Snyder, J.J.; Kasiske, B.L.; et al. OPTN/SRTR 2017 Annual Data Report: Kidney. Am. J. Transplant. 2017, 19, 19–123. [Google Scholar] [CrossRef] [PubMed]
- Transplant Trends—UNOS. Available online: https://unos.org/data/transplant-trends/ (accessed on 19 June 2020).
- Lamb, K.E.; Lodhi, S.; Meier-Kriesche, H.U. Long-term renal allograft survival in the United States: A critical reappraisal. Am. J. Transplant. 2011, 11, 450–462. [Google Scholar] [CrossRef] [PubMed]
- Bloom, R.D.; Bromberg, J.S.; Poggio, E.D.; Bunnapradist, S.; Langone, A.J.; Sood, P.; Matas, A.J.; Mehta, S.; Mannon, R.B.; Sharfuddin, A.; et al. Cell-Free DNA and Active Rejection in Kidney Allografts. J. Am. Soc. Nephrol. 2017, 28, 2221–2232. [Google Scholar] [CrossRef] [PubMed]
- Roedder, S.; Sigdel, T.; Salomonis, N.; Hsieh, S.; Dai, H.; Bestard, O.; Metes, D.; Zeevi, A.; Gritsch, A.; Cheeseman, J.; et al. The kSORT Assay to Detect Renal Transplant Patients at High Risk for Acute Rejection: Results of the Multicenter AART Study. PLoS Med. 2014, 11, e1001759. [Google Scholar] [CrossRef]
- Sigdel, T.; Archila, F.; Constantin, T.; Prins, S.; Liberto, J.; Damm, I.; Towfighi, P.; Navarro, S.; Kirkizlar, E.; Demko, Z.; et al. Optimizing Detection of Kidney Transplant Injury by Assessment of Donor-Derived Cell-Free DNA via Massively Multiplex PCR. J. Clin. Med. 2018, 8, 19. [Google Scholar] [CrossRef]
- Yang, J.Y.C.; Sarwal, M.M. Transplant genetics and genomics. Nat. Rev. Genet. 2017, 18, 309–326. [Google Scholar] [CrossRef] [PubMed]
- Furness, P.N.; Taub, N. International variation in the interpretation of renal transplant biopsies: Report of the CERTPAP project. Kidney Int. 2001, 60, 1998–2012. [Google Scholar] [CrossRef] [PubMed]
- Knight, S.R.; Thorne, A.; Lo Faro, M.L. Donor-specific Cell-free DNA as a Biomarker in Solid Organ Transplantation. A Systematic Review. Transplantation 2019, 103, 273–283. [Google Scholar] [CrossRef] [PubMed]
- Watson, D.; Yang, J.Y.C.; Sarwal, R.D.; Sigdel, T.K.; Liberto, J.M.; Damm, I.; Louie, V.; Sigdel, S.; Livingstone, D.; Soh, K.; et al. A Novel Multi-Biomarker Assay for Non-Invasive Detection and Quantitative Monitoring of Kidney Injury. J. Clin. Med. 2019, 8, 499. [Google Scholar] [CrossRef] [PubMed]
- Yang, J.Y.C.; Sarwal, R.D.; Sigdel, T.K.; Damm, I.; Rosenbaum, B.; Liberto, J.M.; Chan-On, C.; Arreola-Guerra, J.M.; Alberu, J.; Vincenti, F.; et al. A urine score for noninvasive accurate diagnosis and prediction of kidney transplant rejection. Sci. Transl. Med. 2020, 12, 1–11. [Google Scholar] [CrossRef] [PubMed]
- Haas, M.; Loupy, A.; Lefaucheur, C.; Roufosse, C.; Glotz, D.; Seron, D.; Nankivell, M.; Halloran, P.F.; Colvin, R.B.; Akalin, E.; et al. The Banff 2017 Kidney Meeting Report: Revised diagnostic criteria for chronic active T cell–mediated rejection, antibody-mediated rejection, and prospects for integrative endpoints for next-generation clinical trials. Am. J. Transplant. 2018, 18, 293–307. [Google Scholar] [CrossRef] [PubMed]
- Schwarz, A.; Gwinner, W.; Hiss, M.; Radermacher, J.; Mengel, M.; Haller, H. Safety and adequacy of renal transplant protocol biopsies. Am. J. Transplant. 2005, 5, 1992–1996. [Google Scholar] [CrossRef] [PubMed]


| Phenotype Characteristic | Training (157 Samples) | Validation (66 Samples) | Overall (223 Samples) | p-Value |
|---|---|---|---|---|
| Recipient | ||||
| • Recipient age, year (SD) (min, max) | 32.6 (14.8) (3, 76) | 31.7 (13.3) (4, 70) | 32.4 (14.4) (3, 76) | 0.138 |
| • Recipient gender, female (%) | 76 (48.4%) | 32 (48.5%) | 108 (48.4%) | 1.000 |
| Donor Source | ||||
| • Deceased donor (%) | 50 (31.8%) | 15 (22.7%) | 65 (29.1%) | 0.106 |
| • Living related (%) | 80 (51.0%) | 32 (48.5%) | 112 (50.2%) | |
| • Living unrelated (%) | 25 (15.9%) | 19 (28.8%) | 44 (19.7%) | |
| • Unspecified (%) | 2 (1.3%) | 0 (0.0%) | 2 (0.9%) | |
| Cause of ESRD | ||||
| • Congenital | 50 (31.8%) | 24 (36.4%) | 74 (33.2%) | 0.854 |
| • Diabetes mellitus | 16 (10.2%) | 3 (4.5%) | 19 (8.5%) | |
| • Glomerulonephritis | 10 (6.4%) | 4 (6.1%) | 14 (6.3%) | |
| • Hypertension | 14 (8.9%) | 6 (9.1%) | 20 (9.0%) | |
| • Immune-mediated | 28 (17.8%) | 14 (21.2%) | 42 (18.8%) | |
| • Obstructive | 8 (5.1%) | 4 (6.1%) | 12 (5.4%) | |
| • Other | 29 (18.5%) | 11 (16.7%) | 40 (17.9%) | |
| • Unspecified | 2 (1.3%) | 0 (0.0%) | 2 (0.9%) | |
| Ethnicity | ||||
| • African American | 5 (3.2%) | 2 (3.0%) | 7 (3.1%) | 0.634 |
| • Asian | 4 (2.5%) | 2 (3.0%) | 6 (2.7%) | |
| • Caucasian | 5 (3.2%) | 4 (6.1%) | 9 (4.0%) | |
| • Hispanic | 105 (66.9%) | 48 (72.7%) | 153 (68.6%) | |
| • Other | 2 (1.3%) | 0 (0.0%) | 2 (0.9%) | |
| • Unspecified | 36 (22.9%) | 10 (15.2%) | 46 (20.6%) | |
| Phenotype | ||||
| • AR | 45 (28.7%) | 26 (39.4%) | 71 (31.8%) | 0.158 |
| • STA | 112 (71.3%) | 40 (60.6%) | 152 (68.2%) |
© 2020 by the authors. Licensee MDPI, Basel, Switzerland. This article is an open access article distributed under the terms and conditions of the Creative Commons Attribution (CC BY) license (http://creativecommons.org/licenses/by/4.0/).
Share and Cite
Nolan, N.; Valdivieso, K.; Mani, R.; Yang, J.Y.C.; Sarwal, R.D.; Katzenbach, P.; Chalasani, K.; Hongo, D.; Lugtu, G.; Mark, C.; et al. Clinical and Analytical Validation of a Novel Urine-Based Test for the Detection of Allograft Rejection in Renal Transplant Patients. J. Clin. Med. 2020, 9, 2325. https://doi.org/10.3390/jcm9082325
Nolan N, Valdivieso K, Mani R, Yang JYC, Sarwal RD, Katzenbach P, Chalasani K, Hongo D, Lugtu G, Mark C, et al. Clinical and Analytical Validation of a Novel Urine-Based Test for the Detection of Allograft Rejection in Renal Transplant Patients. Journal of Clinical Medicine. 2020; 9(8):2325. https://doi.org/10.3390/jcm9082325
Chicago/Turabian StyleNolan, Niamh, Katherine Valdivieso, Rekha Mani, Joshua Y. C. Yang, Reuben D. Sarwal, Phoebe Katzenbach, Kavita Chalasani, Donna Hongo, Gladys Lugtu, Corinne Mark, and et al. 2020. "Clinical and Analytical Validation of a Novel Urine-Based Test for the Detection of Allograft Rejection in Renal Transplant Patients" Journal of Clinical Medicine 9, no. 8: 2325. https://doi.org/10.3390/jcm9082325
APA StyleNolan, N., Valdivieso, K., Mani, R., Yang, J. Y. C., Sarwal, R. D., Katzenbach, P., Chalasani, K., Hongo, D., Lugtu, G., Mark, C., Chen, E., Nijor, R., Savoca, D., Wexler, D. S., Whitson, T., Huang, S.-J., Lu, L. H., Zawada, R. J. X., Hytopoulos, E., & Sarwal, M. M. (2020). Clinical and Analytical Validation of a Novel Urine-Based Test for the Detection of Allograft Rejection in Renal Transplant Patients. Journal of Clinical Medicine, 9(8), 2325. https://doi.org/10.3390/jcm9082325