The Association between High Body Mass Index and Early Clinical Outcomes in Patients with Proximal Femur Fractures


 ,
, 
Abstract
1. Introduction
2. Methods
2.1. Study Population
2.2. Data Collection
2.3. Surgical Therapy
2.4. Outcome Parameters
2.5. Statistics
3. Results
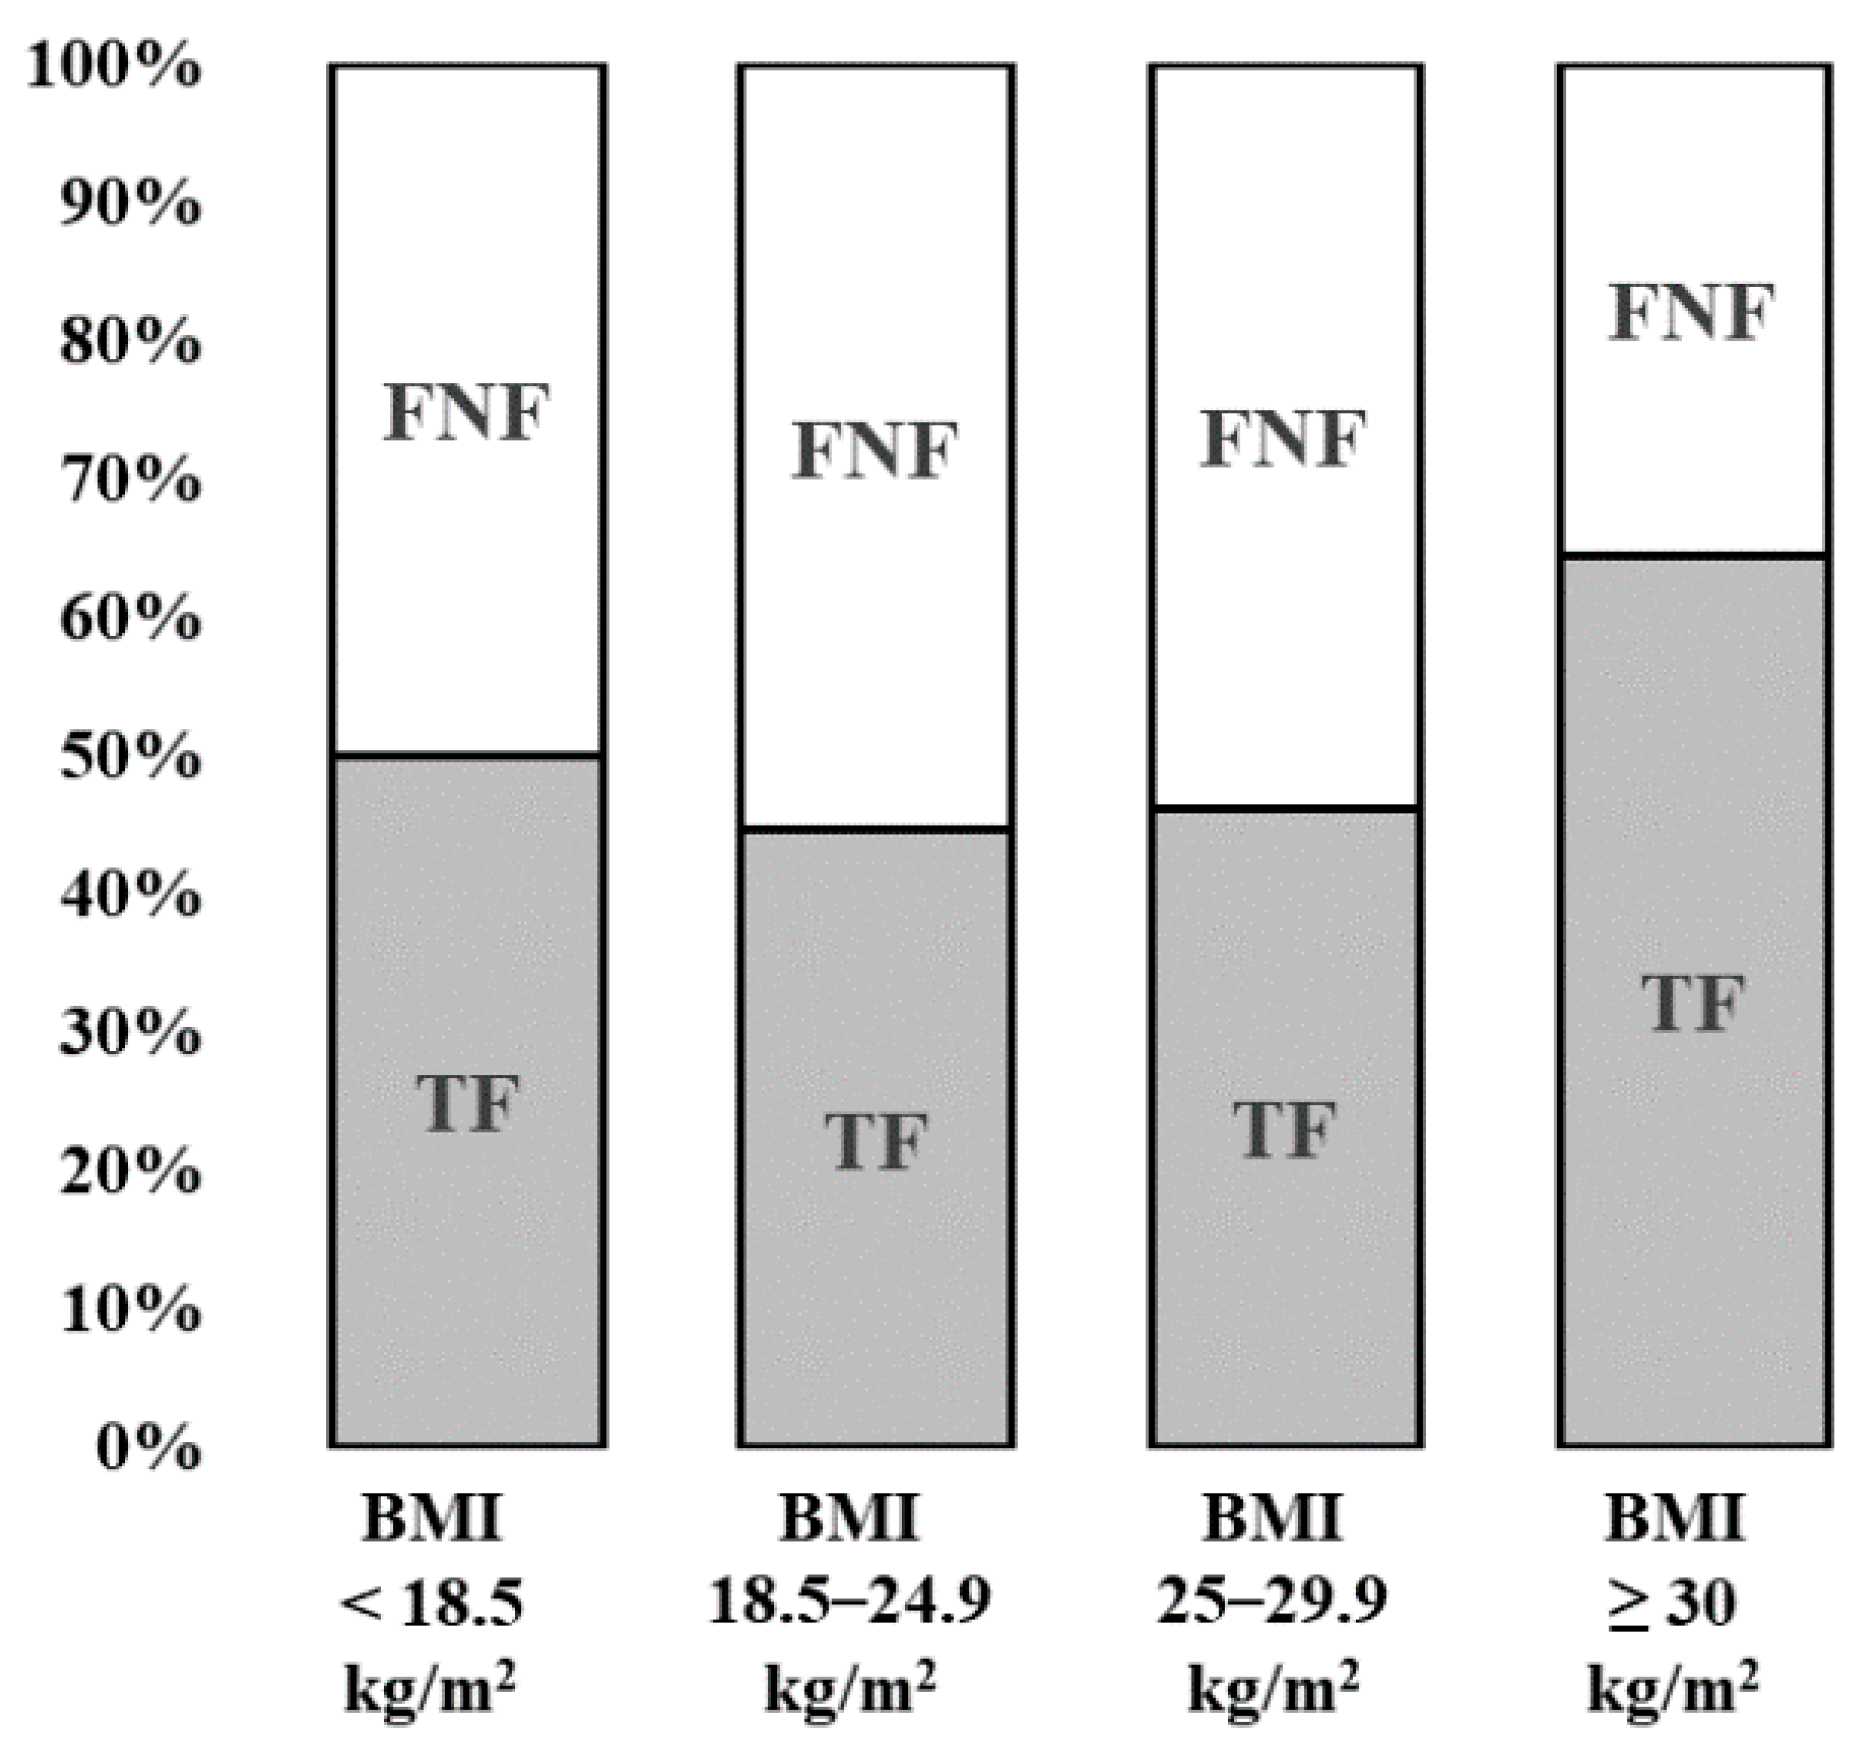
3.1. Type of Fracture
3.2. Differences between the BMI Groups
4. Discussion
5. Conclusions
6. Limitations
Author Contributions
Funding
Conflicts of Interest
Abbreviations
| ASA | American Society of Anesthesiologists |
| BMI | Body mass index |
| DHS | Dynamic hip screw |
| DVT | Deep vein thrombosis |
| FNF | Femoral neck fracture |
| HA | Hemiarthroplasty |
| ICD-10 | International Statistical Classification of Diseases and Related Health Problems (10th revision) |
| LOS | Length of stay |
| NW | Normal weight |
| OB | Obese |
| OR | Odds ratio |
| OW | Overweight |
| TF | Trochanteric fracture |
| THA | Total hip arthroplasty |
| TUM | Technical University Munich |
| UW | Underweight |
| WHO | World Health Organization |
References
- Schuit, S.C.; van der Klift, M.; Weel, A.E.; de Laet, C.E.; Burger, H.; Seeman, E.; Hofman, A.; Uitterlinden, A.G.; van Leeuwen, J.P.; Pols, H.A. Fracture incidence and association with bone mineral density in elderly men and women: The Rotterdam study. Bone 2004, 34, 195–202. [Google Scholar] [CrossRef] [PubMed]
- Hoffmann, F.; Glaeske, G. Incidence of hip fracture in Germany—Person-related analysis of health insurance population. Gesundheitswesen 2006, 68, 161–164. [Google Scholar] [CrossRef] [PubMed]
- Fox, K.M.; Magaziner, J.; Hebel, J.R.; Kenzora, J.E.; Kashner, T.M. Intertrochanteric versus femoral neck hip fractures: Differential characteristics, treatment, and sequelae. J. Gerontol. A Biol. Sci. Med. Sci. 1999, 54, M635–M640. [Google Scholar] [CrossRef]
- Klopfer, T.; Hemmann, P.; Ziegler, P.; Stöckle, U.; Bahrs, C. Proximale femurfraktur und insuffizienzfrakturen im alter. Trauma Berufskrankh. 2017, 19, 27–36. [Google Scholar] [CrossRef][Green Version]
- Jaacks, L.M.; Vandevijvere, S.; Pan, A.; McGowan, C.J.; Wallace, C.; Imamura, F.; Mozaffarian, D.; Swinburn, B.; Ezzati, M. The obesity transition: Stages of the global epidemic. Lancet Diabetes Endocrinol. 2019, 7, 231–240. [Google Scholar] [CrossRef]
- Hanna, J.S. Sarcopenia and critical illness. J. Parenter. Enter. Nutr. 2015, 39, 273–281. [Google Scholar] [CrossRef] [PubMed]
- Kanis, J.; Johnell, O.; Gullberg, B.; Allander, E.; Elffors, L.; Ranstam, J.; Dequeker, J.; Dilsen, G.; Gennari, C.; Vaz, A.L.; et al. Risk factors for hip fracture in men from southern Europe: The medos study. Mediterranean osteoporosis study. Osteoporos. Int. 1999, 9, 45–54. [Google Scholar] [CrossRef]
- Court-Brown, C.M.; Duckworth, A.D.; Ralston, S.; McQueen, M.M. The relationship between obesity and fractures. Injury 2019, 50, 1423–1428. [Google Scholar] [CrossRef]
- Flodin, L.; Laurin, A.; Lokk, J.; Cederholm, T.; Hedstrom, M. Increased 1-year survival and discharge to independent living in overweight hip fracture patients: A prospective study of 843 patients. Acta Orthop. 2016, 87, 146–151. [Google Scholar] [CrossRef]
- Scully, W.; Piuzzi, N.S.; Sodhi, N.; Sultan, A.A.; George, J.; Khlopas, A.; Muschler, G.F.; Higuera, C.A.; Mont, M.A. The effect of body mass index on 30-day complications after total hip arthroplasty. Hip Int. J. Clin. Exp. Res. Hip Pathol. Ther. 2020, 30, 125–134. [Google Scholar] [CrossRef]
- Basques, B.A.; Bohl, D.D.; Golinvaux, N.S.; Leslie, M.P.; Baumgaertner, M.R.; Grauer, J.N. Postoperative length of stay and 30-day readmission after geriatric hip fracture: An analysis of 8434 patients. J. Orthop. Trauma 2015, 29, e115–e120. [Google Scholar] [CrossRef]
- Batsis, J.A.; Huddleston, J.M.; Melton, L.J., 3rd; Huddleston, P.M.; Larson, D.R.; Gullerud, R.E.; McMahon, M.M. Body mass index (bmi) and risk of noncardiac postoperative medical complications in elderly hip fracture patients: A population-based study. J. Hosp. Med. 2009, 4, E1–E9. [Google Scholar] [CrossRef]
- Shaparin, N.; Widyn, J.; Nair, S.; Kho, I.; Geller, D.; Delphin, E. Does the obesity paradox apply to early postoperative complications after hip surgery? A retrospective chart review. J. Clin. Anesth. 2016, 32, 84–91. [Google Scholar] [CrossRef] [PubMed]
- Prugger, C.; Keil, U. Entwicklung der adipositas in Deutschland—Größenordnung, determinanten und perspektiven. Dtsch. Med. Wochenschr. 2007, 132, 892–897. [Google Scholar] [CrossRef] [PubMed]
- World Health Organization. Obesity: Preventing and managing the global epidemic. Report of a who consultation. World Health Organ. Tech. Rep. Ser. 2000, 894, 1–253. [Google Scholar]
- Owens, W.D.; Felts, J.A.; Spitznagel, E.L., Jr. Asa physical status classifications: A study of consistency of ratings. Anesthesiology 1978, 49, 239–243. [Google Scholar] [CrossRef] [PubMed]
- Mahoney, F.I.; Barthel, D.W. Functional evaluation: The barthel index. Md. State Med. J. 1965, 14, 61–65. [Google Scholar]
- Tucker, M.C.; Schwappach, J.R.; Leighton, R.K.; Coupe, K.; Ricci, W.M. Results of femoral intramedullary nailing in patients who are obese versus those who are not obese: A prospective multicenter comparison study. J. Orthop. Trauma 2007, 21, 523–529. [Google Scholar] [CrossRef]
- Kadry, B.; Press, C.D.; Alosh, H.; Opper, I.M.; Orsini, J.; Popov, I.A.; Brodsky, J.B.; Macario, A. Obesity increases operating room times in patients undergoing primary hip arthroplasty: A retrospective cohort analysis. PeerJ 2014, 2. [Google Scholar] [CrossRef]
- Meller, M.M.; Toossi, N.; Gonzalez, M.H.; Son, M.-S.; Lau, E.C.; Johanson, N. Surgical risks and costs of care are greater in patients who are super obese and undergoing THA. Clin. Orthop. Relat. Res. 2016, 474, 2472–2481. [Google Scholar] [CrossRef]
- Hauck, K.; Hollingsworth, B. The impact of severe obesity on hospital length of stay. Med. Care 2010, 48, 335–340. [Google Scholar] [CrossRef] [PubMed]
- Zizza, C.; Herring, A.H.; Stevens, J.; Popkin, B.M. Length of hospital stays among obese individuals. Am. J. Public Health 2004, 94, 1587–1591. [Google Scholar] [CrossRef] [PubMed]
- Anis, H.K.; Sodhi, N.; Coste, M.; Ehiorobo, J.O.; Newman, J.M.; Garbarino, L.J.; Gold, P.; Freund, B.; Piuzzi, N.; Mont, M.A. A comparison of peri-operative outcomes between elective and non-elective total hip arthroplasties. Ann. Transl. Med. 2019, 7, 78. [Google Scholar] [CrossRef] [PubMed]
- Bryant, M.K.; Parrish, M.; Roy, S.; Udekwu, P.; Farrell, M.; Schinco, M.; Ganga, S. Inferior clinical outcomes after femur fracture in the obese are potentially preventable. Injury 2019, 50, 2049–2054. [Google Scholar] [CrossRef] [PubMed]
- Eschbach, D.A.; Oberkircher, L.; Bliemel, C.; Mohr, J.; Ruchholtz, S.; Buecking, B. Increased age is not associated with higher incidence of complications, longer stay in acute care hospital and in hospital mortality in geriatric hip fracture patients. Maturitas 2013, 74, 185–189. [Google Scholar] [CrossRef] [PubMed]
- Hales, C.M.; Carroll, M.D.; Fryar, C.D.; Ogden, C.L. Prevalence of Obesity and Severe Obesity among Adults: United States, 2017–2018; National Center for Health Statistics: Hyattsville, MD, USA, 2020.
- Schienkiewitz, A.; Mensink, G.; Kuhnert, R.; Lange, C. Übergewicht und Adipositas bei Erwachsenen in Deutschland. Available online: https://www.rki.de/DE/Content/Gesundheitsmonitoring/Gesundheitsberichterstattung/GBEDownloadsJ/FactSheets/JoHM_2017_02_Uebergewicht_Adipositas_Erwachsene.html (accessed on 14 June 2017).
- Chee, Y.H.; Teoh, K.H.; Sabnis, B.M.; Ballantyne, J.A.; Brenkel, I.J. Total hip replacement in morbidly obese patients with osteoarthritis: Results of a prospectively matched study. J. Bone Joint Surg. Br. 2010, 92, 1066–1071. [Google Scholar] [CrossRef]
- Busato, A.; Röder, C.; Herren, S.; Eggli, S. Influence of high bmi on functional outcome after total hip arthroplasty. Obes. Surg. 2008, 18, 595–600. [Google Scholar] [CrossRef]
- Nafiu, O.O.; Kheterpal, S.; Moulding, R.; Picton, P.; Tremper, K.K.; Campbell, D.A., Jr.; Eliason, J.L.; Stanley, J.C. The association of body mass index to postoperative outcomes in elderly vascular surgery patients: A reverse j-curve phenomenon. Anesth. Analg. 2011, 112, 23–29. [Google Scholar] [CrossRef]
- Modig, K.; Erdefelt, A.; Mellner, C.; Cederholm, T.; Talbäck, M.; Hedström, M. “Obesity paradox” holds true for patients with hip fracture: A registry-based cohort study. J. Bone Joint Surg. Am. 2019, 101, 888–895. [Google Scholar] [CrossRef]
- Akinleye, S.D.; Garofolo, G.; Culbertson, M.D.; Homel, P.; Erez, O. The role of bmi in hip fracture surgery. Geriatr. Orthop. Surg. Rehabil. 2018, 9, 2151458517747414. [Google Scholar] [CrossRef]
- Destatis, S.B. Mikrozensus—Fragen zur Gesundheit—Körpermaße der Bevölkerung 2017. Available online: http://www.gbe-bund.de/oowa921-install/servlet/oowa/aw92/dboowasys921.xwdevkit/xwd_init?gbe.isgbetol/xs_start_neu/&p_aid=3&p_aid=70540760&nummer=223&p_sprache=D&p_indsp=99999999&p_aid=34467983 (accessed on 1 August 2018).
- De Laet, C.; Kanis, J.A.; Oden, A.; Johanson, H.; Johnell, O.; Delmas, P.; Eisman, J.A.; Kroger, H.; Fujiwara, S.; Garnero, P.; et al. Body mass index as a predictor of fracture risk: A meta-analysis. Osteoporos. Int. 2005, 16, 1330–1338. [Google Scholar] [CrossRef] [PubMed]
- Bachmann, K.N.; Fazeli, P.K.; Lawson, E.A.; Russell, B.M.; Riccio, A.D.; Meenaghan, E.; Gerweck, A.V.; Eddy, K.; Holmes, T.; Goldstein, M.; et al. Comparison of hip geometry, strength, and estimated fracture risk in women with anorexia nervosa and overweight/obese women. J. Clin. Endocrinol. Metab. 2014, 99, 4664–4673. [Google Scholar] [CrossRef]
- Mautalen, C.A.; Vega, E.M.; Einhorn, T.A. Are the etiologies of cervical and trochanteric hip fractures different? Bone 1996, 18, S133–S137. [Google Scholar] [CrossRef]
- Lloyd, J.T.; Alley, D.E.; Hawkes, W.G.; Hochberg, M.C.; Waldstein, S.R.; Orwig, D.L. Body mass index is positively associated with bone mineral density in us older adults. Arch. Osteoporos. 2014, 9, 175. [Google Scholar] [CrossRef] [PubMed]
- Mosca, L.N.; Goldberg, T.B.; da Silva, V.N.; da Silva, C.C.; Kurokawa, C.S.; Bisi Rizzo, A.C.; Corrente, J.E. Excess body fat negatively affects bone mass in adolescents. Nutrition 2014, 30, 847–852. [Google Scholar] [CrossRef] [PubMed]
- Cao, J.J.; Sun, L.; Gao, H. Diet-induced obesity alters bone remodeling leading to decreased femoral trabecular bone mass in mice. Ann. N. Y. Acad. Sci. 2010, 1192, 292–297. [Google Scholar] [CrossRef] [PubMed]
- Kim, J.; Kwon, H.; Heo, B.-K.; Joh, H.-K.; Lee, C.M.; Hwang, S.-S.; Park, D.; Park, J.-H. The association between fat mass, lean mass and bone mineral density in premenopausal women in Korea: A cross-sectional study. Korean J. Fam. Med. 2018, 39, 74–84. [Google Scholar] [CrossRef]
- Irving, D.; Hinkley, J.; Marquart, M. The relationship between bmi and stability of intertrochanteric fracture following low-energy falls. A retrospective cohort study. Geriatr. Orthop. Surg. Rehabil. 2019, 10, 2151459319857555. [Google Scholar] [CrossRef]
- Onggo, J.R.; Onggo, J.D.; de Steiger, R.; Hau, R. Greater risks of complications, infections, and revisions in the obese versus non-obese total hip arthroplasty population of 2,190,824 patients: A meta-analysis and systematic review. Osteoarthr. Cartil. 2020, 28, 31–44. [Google Scholar] [CrossRef] [PubMed]
- Sayed-Noor, A.S.; Mukka, S.; Mohaddes, M.; Kärrholm, J.; Rolfson, O. Body mass index is associated with risk of reoperation and revision after primary total hip arthroplasty: A study of the Swedish hip arthroplasty register including 83,146 patients. Acta Orthop. 2019, 90, 220–225. [Google Scholar] [CrossRef]
- Dy, C.J.; Bozic, K.J.; Pan, T.J.; Wright, T.M.; Padgett, D.E.; Lyman, S. Risk factors for early revision after total hip arthroplasty. Arthritis Care Res. 2014, 66, 907–915. [Google Scholar] [CrossRef] [PubMed]
- Thelwall, S.; Harrington, P.; Sheridan, E.; Lamagni, T. Impact of obesity on the risk of wound infection following surgery: Results from a nationwide prospective multicentre cohort study in England. Clin. Microbiol. Infect. 2015, 21, e1001–e1008. [Google Scholar] [CrossRef] [PubMed]
- Gurunathan, U.; Ramsay, S.; Mitric, G.; Way, M.; Wockner, L.; Myles, P. Association between obesity and wound infection following colorectal surgery: Systematic review and meta-analysis. J. Gastrointest. Surg. 2017, 21, 1700–1712. [Google Scholar] [CrossRef] [PubMed]
- Pierpont, Y.N.; Dinh, T.P.; Salas, R.E.; Johnson, E.L.; Wright, T.G.; Robson, M.C.; Payne, W.G. Obesity and surgical wound healing: A current review. ISRN Obes. 2014, 2014, 638936. [Google Scholar] [CrossRef]
- Kim, Y.; Morshed, S.; Joseph, T.; Bozic, K.; Ries, M.D. Clinical impact of obesity on stability following revision total hip arthroplasty. Clin. Orthop. Relat. Res. 2006, 453, 142–146. [Google Scholar] [CrossRef]
- Elkins, J.M.; Daniel, M.; Pedersen, D.R.; Singh, B.; Yack, H.J.; Callaghan, J.J.; Brown, T.D. Morbid obesity may increase dislocation in total hip patients: A biomechanical analysis. Clin. Orthop. Relat. Res. 2013, 471, 971–980. [Google Scholar] [CrossRef]
- Elson, L.C.; Barr, C.J.; Chandran, S.E.; Hansen, V.J.; Malchau, H.; Kwon, Y.-M. Are morbidly obese patients undergoing total hip arthroplasty at an increased risk for component malpositioning? J. Arthroplast. 2013, 28, 41–44. [Google Scholar] [CrossRef]
- Bowditch, M.G.; Villar, R.N. Do obese patients bleed more? A prospective study of blood loss at total hip replacement. Ann. R. Coll. Surg. Engl. 1999, 81, 198–200. [Google Scholar]
- Cao, G.; Chen, G.; Yang, X.; Huang, Q.; Huang, Z.; Xu, H.; Alexander, P.G.; Zhou, Z.; Pei, F. Obesity does not increase blood loss or incidence of immediate postoperative complications during simultaneous total knee arthroplasty: A multicenter study. Knee 2020, 27, 963–969. [Google Scholar] [CrossRef]
- Frisch, N.; Wessell, N.M.; Charters, M.; Peterson, E.; Cann, B.; Greenstein, A.; Silverton, C.D. Effect of body mass index on blood transfusion in total hip and knee arthroplasty. Orthopedics 2016, 39, e844–e849. [Google Scholar] [CrossRef]
- Kassebaum, N.J.; Jasrasaria, R.; Naghavi, M.; Wulf, S.K.; Johns, N.; Lozano, R.; Regan, M.; Weatherall, D.; Chou, D.P.; Eisele, T.P.; et al. A systematic analysis of global anemia burden from 1990 to 2010. Blood 2014, 123, 615–624. [Google Scholar] [CrossRef] [PubMed]
- Alban, R.; Lyass, S.; Margulies, D.; Shabot, M. Obesity does not affect mortality after trauma. Am. Surg. 2006, 72, 966–969. [Google Scholar] [PubMed]
- Evans, D.; Stawicki, S.; Davido, H.; Eiferman, D. Obesity in trauma patients: Correlations of body mass index with outcomes, injury patterns, and complications. Am. Surg. 2011, 77, 1003–1008. [Google Scholar] [CrossRef] [PubMed]


| Femoral Neck Fracture | Trochanteric Femur Fracture | p-Value | |
|---|---|---|---|
| n (%) | 506 (53%) | 444 (47%) | |
| Age (years) | 73.7 ± 13.6 | 76.1 ± 13.3 | 0.002 * |
| Gender female | 345 (68.2%) | 292 (65.8%) | 0.429 |
| BMI (kg/m2) | 23.3 ± 3.8 | 23.8 ± 4.6 | 0.274 |
| ASA score | 2.3 ± 0.7 | 2.3 ± 0.7 | 0.239 |
| Osteoporosis | 39 (7.7%) | 40 (9.0%) | 0.469 |
| Length of stay (days) | 13.8 ± 10.0 | 13.8 ± 7.5 | 0.294 |
| Mortality | 22 (4.3%) | 9 (2.0%) | 0.045 * |
| Mobility on crutches | 298 (63.0%) | 212 (51.2%) | <0.001 * |
| OR | 95% CI | p-Value | |
|---|---|---|---|
| BMI | 1.033 | 1.002–1.066 | 0.040 * |
| Age | 1.016 | 1.006–1.027 | 0.002 * |
| Gender female | 1.243 | 0.932–1.658 | 0.138 |
| Osteoporosis (anamn.) | 1.202 | 0.752–1.922 | 0.441 |
| Under-Weight (n = 80) | Normal Weight (n = 570) | Over-Weight (n = 241) | Obese (n = 59) | p-Value | |
|---|---|---|---|---|---|
| Age (years) | 76.9 ± 15.1 | 74.8 ± 13.9 | 74.5 ± 12.1 | 72.8 ± 12.8 | 0.089 |
| Gender female | 66 (82.5%) | 392 (68.8%) | 140 (58.1%) | 39 (66.1%) | <0.001 * |
| ASA score | 2.27 ± 0.7 | 2.25 ± 0.7 | 2.31 ± 0.7 | 2.54 ± 0.7 | 0.012 * |
| Fracture type | 0.034 * | ||||
| Femoral neck fracture | 40 (50%) | 315 (55.3%) | 130 (53.9%) | 21 (35.6%) | |
| Trochanteric fracture | 40 (50%) | 255 (44.7%) | 111 (46.1%) | 38 (64.4%) | |
| No of preexisting morbidities | 2.47 ± 1.9 | 2.38 ± 1.8 | 2.58 ± 1.8 | 3.10 ± 1.6 | 0.004 * |
| Diabetes mellitus | 7 (8.8%) | 78 (13.7%) | 57 (23.7%) | 22 (37.3%) | <0.001 * |
| Arterial hypertension | 32 (40.0%) | 288 (50.5%) | 145 (60.2%) | 44 (74.6%) | <0.001 * |
| Coronary heart disease | 20 (25.0%) | 148 (26.0%) | 76 (31.5%) | 24 (40.7%) | 0.053 |
| Hypothyroidism | 11 (13.7%) | 75 (13.2%) | 31 (12.9%) | 13 (22.0%) | 0.302 |
| Osteoporosis | 10 (12.5%) | 49 (8.6%) | 15 (6.2%) | 5 (8.5%) | 0.331 |
| Dementia | 15 (18.8%) | 70 (12.3%) | 24 (10.0%) | 5 (8.5%) | 0.186 |
| Stroke | 7 (8.8%) | 58 (10.2%) | 28 (11.6%) | 6 (10.2%) | 0.898 |
| Substance addiction | 13 (16.3%) | 37 (6.5%) | 13 (5.4%) | 2 (3.4%) | 0.004 * |
| Chronic kidney disease | 6 (7.5%) | 48 (8.4%) | 28 (11.6%) | 9 (15.3%) | 0.201 |
| Tumor disease | 16 (20.0%) | 78 (13.7%) | 32 (13.3%) | 9 (15.3%) | 0.466 |
| No of medications | 3.4 ± 3.5 | 3.5 ± 3.4 | 3.9 ± 3.5 | 4.4 ± 3.0 | 0.103 |
| Under-Weight (n = 80) | Normal Weight (n = 570) | Over-Weight (n = 241) | Obese (n = 59) | Bivariate p-Value a | Multivariate p-Value b | |
|---|---|---|---|---|---|---|
| Revision | 4 (5.0%) | 47 (8.2%) | 22 (9.1%) | 7 (11.9%) | 0.512 | 0.538 |
| Erythrocyte transfusion | 30 (37.5%) | 195 (34.3%) | 78 (32.4%) | 19 (32.8%) | 0.852 | 0.873 |
| Wound site infection | 1 (1.3%) | 14 (2.5%) | 9 (3.7%) | 3 (5.1%) | 0.422 | 0.511 |
| Urinary tract infection | 6 (7.5%) | 51 (8.9%) | 23 (9.5%) | 6 (10.2%) | 0.940 | 0.810 |
| Pneumonia | 4 (5.0%) | 24 (4.2%) | 12 (5.0%) | 4 (6.8%) | 0.817 | 0.751- |
| Deep vein thrombosis | 1 (1.3%) | 7 (1.2%) | 4 (1.7%) | 0 (0.0%) | 0.953 | 0.980- |
| Operation time (min) | 85.3 ± 42.9 | 90.2 ± 38.2 | 99.9 ± 39.9 | 117.2 ± 61.5 | <0.001 * | <0.001 * |
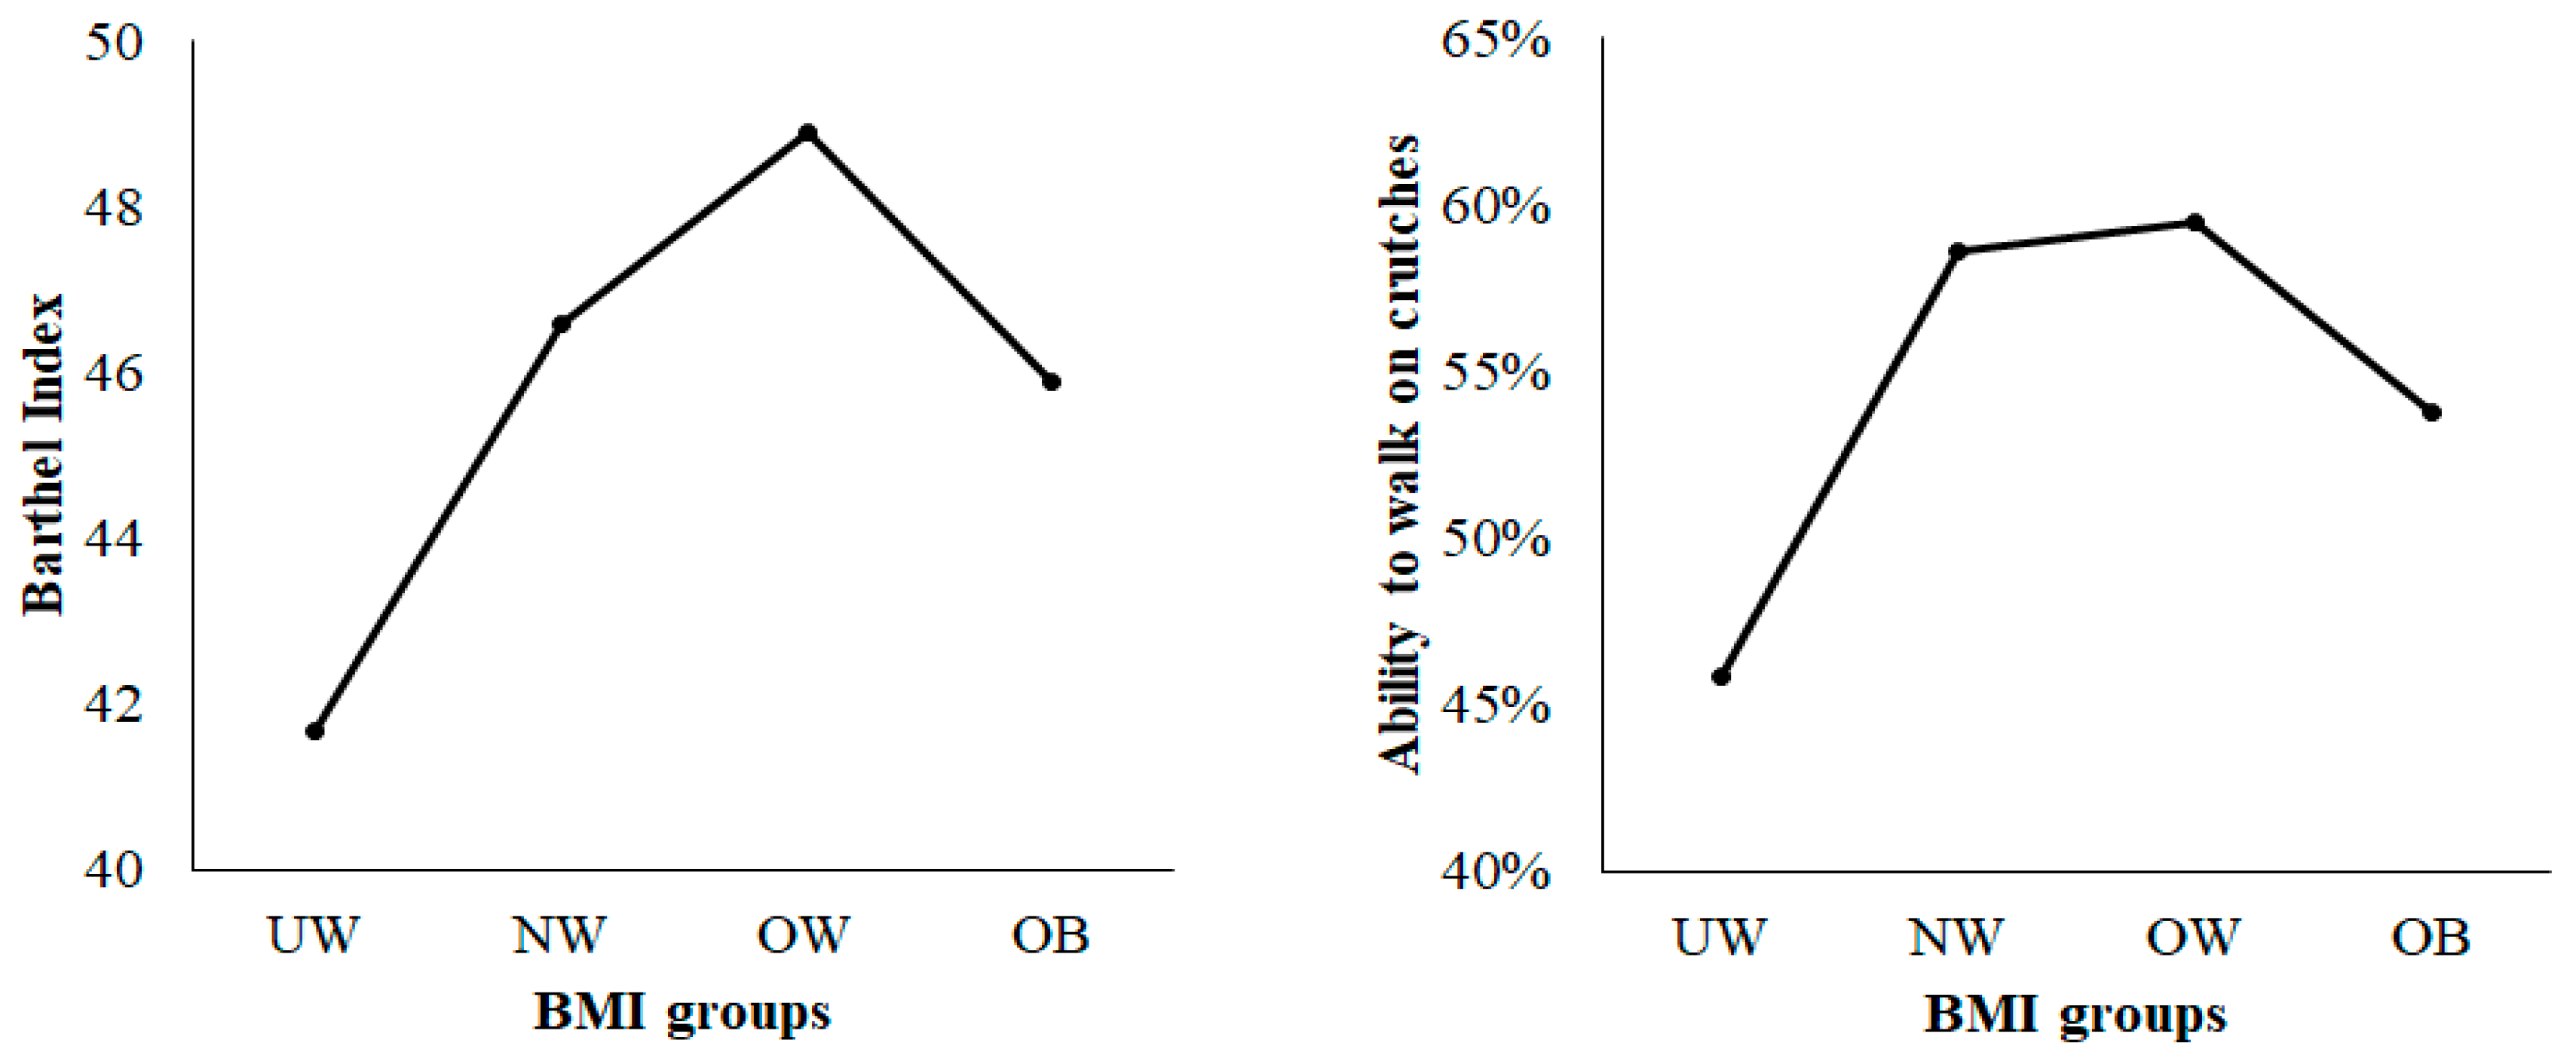
| Mobility on crutches | 34 (45.9%) | 310 (58.6%) | 138 (59.5%) | 28 (53.8%) | 0.098 | 0.481 |
| Barthel Index score | 41.7 ± 19.5 | 46.6 ± 22.3 | 48.9 ± 17.1 | 45.0 ± 12.2 | 0.062 | 0.052 |
| Mortality | 2 (2.5%) | 17 (3.0%) | 11 (4.6%) | 1 (1.7%) | 0.065 | 0.628 |
| Length of stay (LOS) | 12.3 ± 4.8 | 13.6 ± 7.8 | 14.2 ± 11.7 | 16.0 ± 9.7 | 0.040 * | 0.040 * |
| Length of Stay (LOS) | Operation Time | |||||
|---|---|---|---|---|---|---|
| OR | 95% CI | p-Value | OR | 95% CI | p-Value | |
| BMI underweight | −0.210 | −0.358–−0.066 | 0.004 * | −0.320 | −0.457–−0.183 | <0.001 * |
| BMI normal | −0.128 | −0.244–0.013 | 0.029 * | −0.253 | −0.363–−0.144 | <0.001 * |
| BMI overweight | −0.113 | −0.235–0.010 | 0.071 | −0.144 | −0.260–−0.028 | <0.001 * |
| BMI obese | reference | reference | ||||
| Age | 0.006 | 0.003–0.008 | 0.002 * | −0.003 | −0.005–−0.001 | 0.008 * |
| Gender female | −0.043 | −0.018–0.103 | 0.164 | −0.017 | −0.075–0.040 | 0.552 |
| ASA score | 0.116 | 0.076–0.155 | <0.001 * | −0.002 | −0.040–0.035 | 0.899 |
| Fracture type | 0.002 | −0.052–0.057 | 0.931 | −0.253 | −0.305–−0.201 | <0.001 * |
© 2020 by the authors. Licensee MDPI, Basel, Switzerland. This article is an open access article distributed under the terms and conditions of the Creative Commons Attribution (CC BY) license (http://creativecommons.org/licenses/by/4.0/).
Share and Cite
Müller, M.; Gutwerk, A.; Greve, F.; Völker, L.; Zyskowski, M.; Kirchhoff, C.; Biberthaler, P.; Pförringer, D.; Braun, K. The Association between High Body Mass Index and Early Clinical Outcomes in Patients with Proximal Femur Fractures. J. Clin. Med. 2020, 9, 2076. https://doi.org/10.3390/jcm9072076
Müller M, Gutwerk A, Greve F, Völker L, Zyskowski M, Kirchhoff C, Biberthaler P, Pförringer D, Braun K. The Association between High Body Mass Index and Early Clinical Outcomes in Patients with Proximal Femur Fractures. Journal of Clinical Medicine. 2020; 9(7):2076. https://doi.org/10.3390/jcm9072076
Chicago/Turabian StyleMüller, Michael, Alexander Gutwerk, Frederik Greve, Lisa Völker, Michael Zyskowski, Chlodwig Kirchhoff, Peter Biberthaler, Dominik Pförringer, and Karl Braun. 2020. "The Association between High Body Mass Index and Early Clinical Outcomes in Patients with Proximal Femur Fractures" Journal of Clinical Medicine 9, no. 7: 2076. https://doi.org/10.3390/jcm9072076
APA StyleMüller, M., Gutwerk, A., Greve, F., Völker, L., Zyskowski, M., Kirchhoff, C., Biberthaler, P., Pförringer, D., & Braun, K. (2020). The Association between High Body Mass Index and Early Clinical Outcomes in Patients with Proximal Femur Fractures. Journal of Clinical Medicine, 9(7), 2076. https://doi.org/10.3390/jcm9072076