Tumor Volume Dynamics as an Early Biomarker for Patient-Specific Evolution of Resistance and Progression in Recurrent High-Grade Glioma

 , , ,
, , ,  ,
,
Abstract
1. Introduction
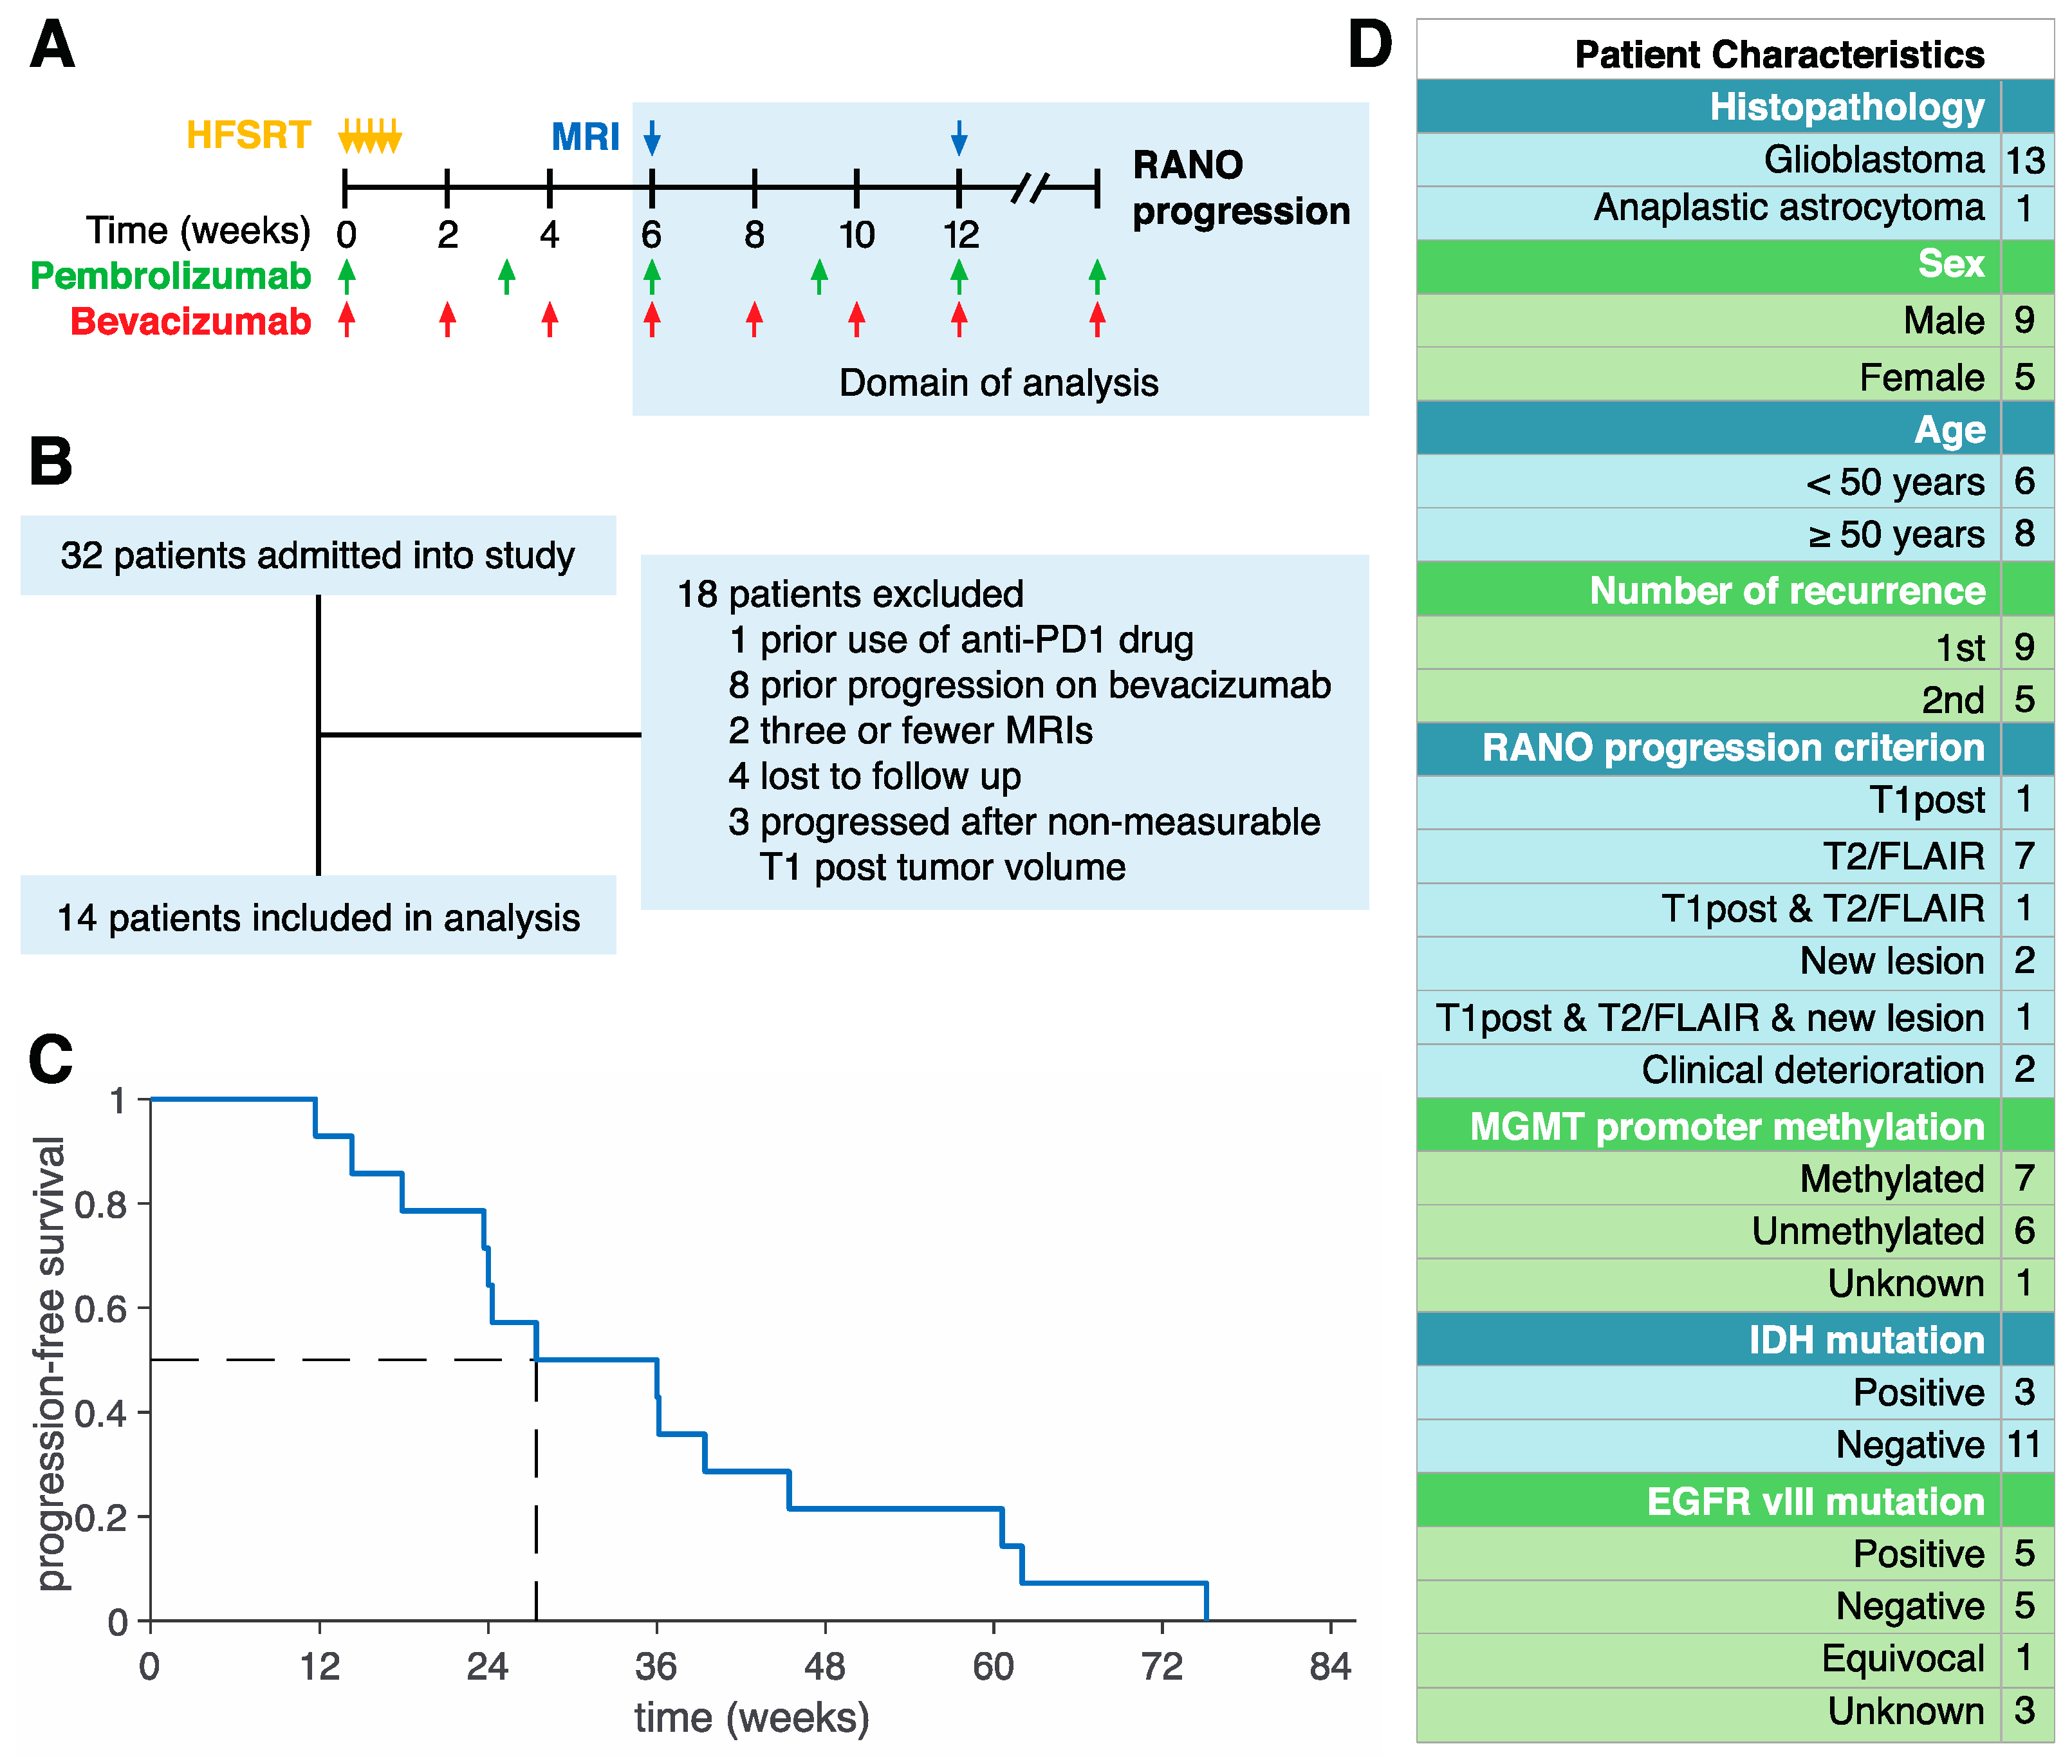
2. Experimental Section
3. Results
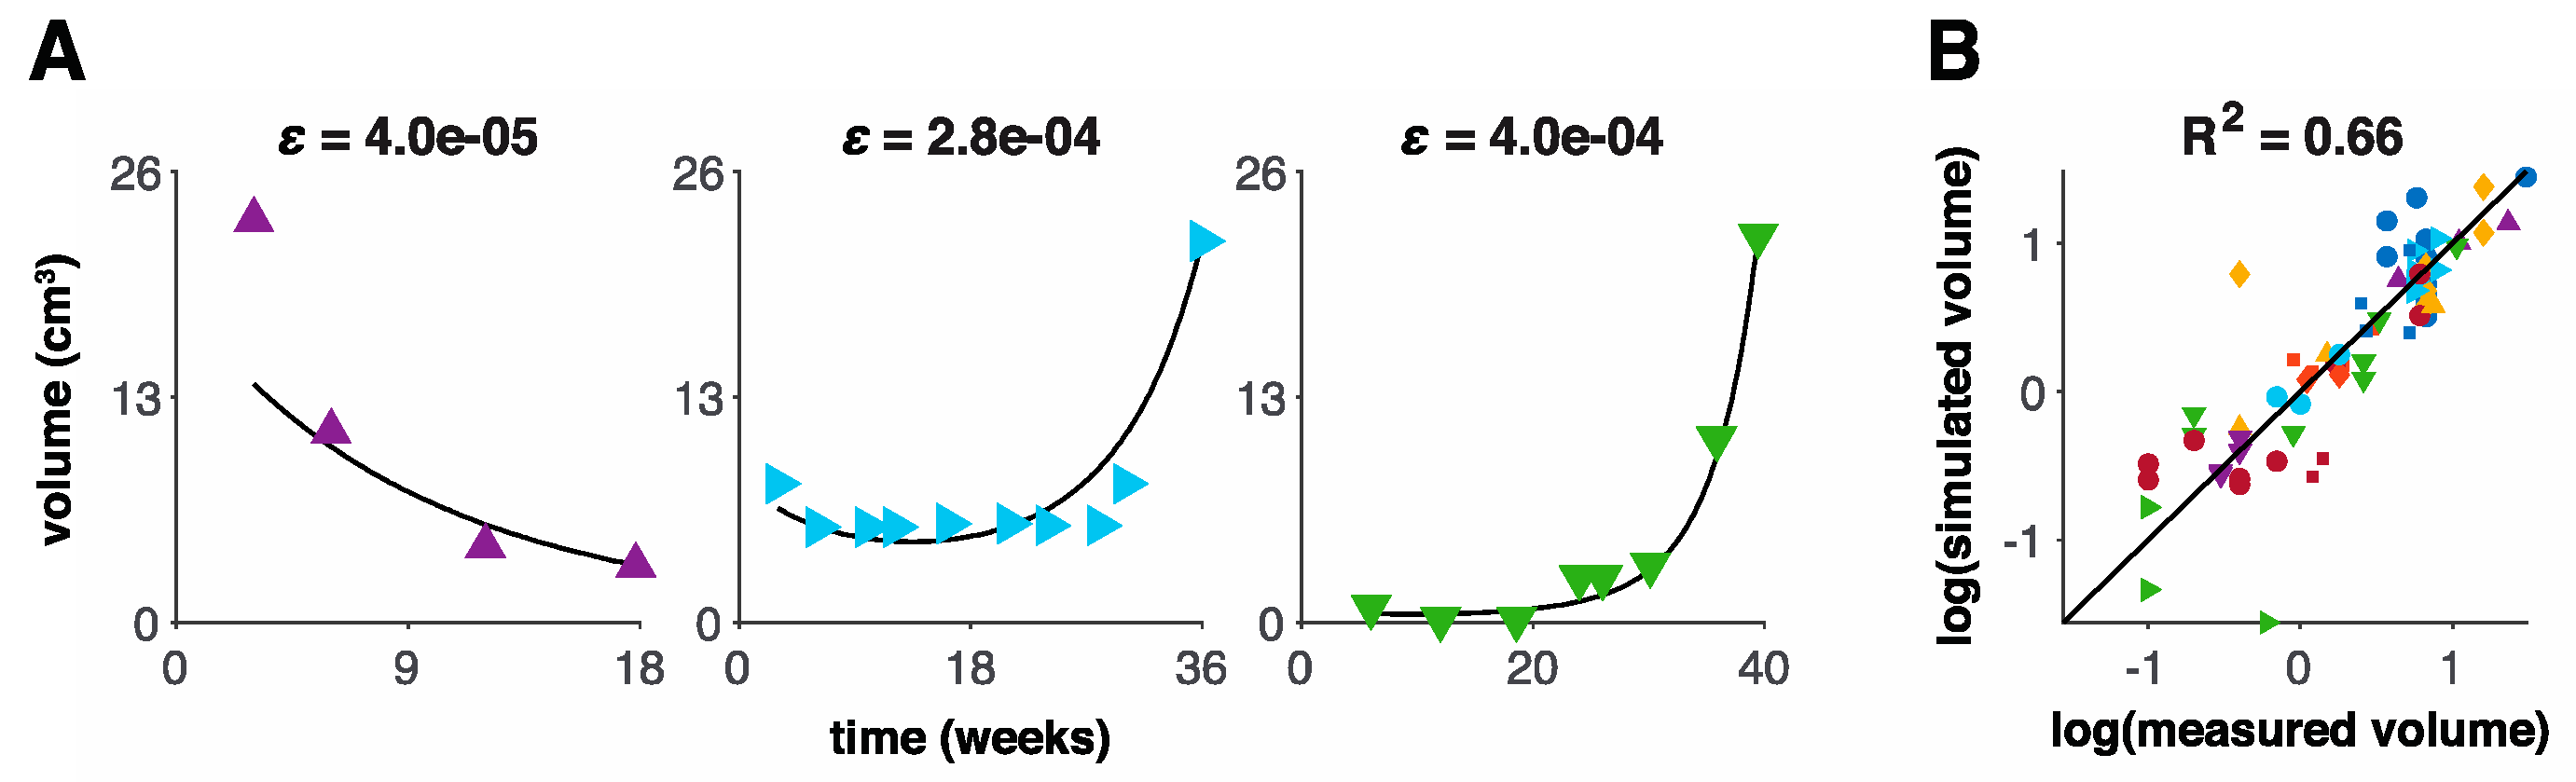
3.1. Model Fits to Patient Data
3.2. Model Predicts Early Progression in 9 of 14 Patients
4. Discussion
Supplementary Materials
Author Contributions
Funding
Acknowledgments
Conflicts of Interest
References
- Wainwright, D.A.; Chang, A.L.; Dey, M.; Balyasnikova, I.V.; Kim, C.K.; Tobias, A.; Cheng, Y.; Kim, J.W.; Qiao, J.; Zhang, L.; et al. Durable therapeutic efficacy utilizing combinatorial blockade against IDO, CTLA-4, and PD-L1 in mice with brain tumors. Clin. Cancer Res. 2014, 20, 5290–5301. [Google Scholar] [CrossRef]
- Berghoff, A.S.; Kiesel, B.; Widhalm, G.; Rajky, O.; Ricken, G.; Woehrer, A.; Dieckmann, K.; Filipits, M.; Zielinski, C.; Marosi, C.; et al. PD1 and PD-L1 expression in glioblastoma. J. Clin. Oncol. 2014, 32, 2011. [Google Scholar] [CrossRef]
- Berghoff, A.S.; Kiesel, B.; Widhalm, G.; Rajky, O.; Ricken, G.; Woehrer, A.; Dieckmann, K.; Filipits, M.; Brandstetter, A.; Weller, M.; et al. Programmed death ligand 1 expression and tumor-infiltrating lymphocytes in glioblastoma. Neuro Oncol. 2015, 17, 1064–1075. [Google Scholar] [CrossRef] [PubMed]
- Yao, Y.; Tao, R.; Wang, X.; Wang, Y.; Mao, Y.; Zhou, L.F. B7-H1 is correlated with malignancy-grade gliomas but is not expressed exclusively on tumor stem-like cells. Neuro Oncol. 2009, 11, 757–766. [Google Scholar] [CrossRef] [PubMed]
- Friedman, H.S.; Prados, M.D.; Wen, P.Y.; Mikkelsen, T.; Schiff, D.; Abrey, L.; Yung, W.K.; Paleologos, N.; Nicholas, M.K.; Jensen, R.; et al. Bevacizumab Alone and in Combination With Irinotecan in Recurrent Glioblastoma. J. Clin. Oncol. 2009, 27, 4733–4740. [Google Scholar] [CrossRef]
- Kreisl, T.N.; Kim, L.; Moore, K.; Duic, P.; Royce, C.; Stroud, I.; Garren, N.; Mackey, M.; Butman, J.; Camphausen, K.; et al. Phase II trial of single-agent bevacizumab followed by bevacizumab plus irinotecan at tumor progression in recurrent glioblastoma. J. Clin. Oncol. 2009, 27, 740–745. [Google Scholar] [CrossRef]
- McGranahan, T.; Therkelsen, K.E.; Ahmad, S.; Nagpal, S. Current State of Immunotherapy for Treatment of Glioblastoma. Curr. Treat. Options Oncol. 2019, 20, 24. [Google Scholar] [CrossRef] [PubMed]
- Reardon, D.A.; De Groot, J.F.; Colman, H.; Jordan, J.T.; Daras, M.; Clarke, J.L.; Nghiemphu, P.L.; Gaffey, S.C.; Peters, K.B. Safety of pembrolizumab in combination with bevacizumab in recurrent glioblastoma (rGBM). J. Clin. Oncol. 2016, 34, 2010. [Google Scholar] [CrossRef]
- Sahebjam, S.; Forsyth, P.; Arrington, J.; Jaglal, M.; Tran, N.D.; Etame, A.B.; Wicklund, M.; Drury-Sibiga, A.; Long, W.; Evernden, B.; et al. ATIM-18. A phase I trial of hypofractionated stereotactic irrradiation (HFSRT) with pembrolizumab and bevacizumab in patients with recurrent high grade glioma (NCT02313272). Neuro-Oncology 2017, 19, vi30. [Google Scholar] [CrossRef]
- Wen, P.Y.; Macdonald, D.R.; Reardon, D.A.; Cloughesy, T.F.; Sorensen, A.G.; Galanis, E.; DeGroot, J.; Wick, W.; Gilbert, M.R.; Lassman, A.B.; et al. Updated response assessment criteria for high-grade gliomas: Response assessment in Neuro-oncology working group. J. Clin. Oncol. 2010, 28, 1963–1972. [Google Scholar] [CrossRef]
- Ellingson, B.M.; Cloughesy, T.F.; Lai, A.; Nghiemphu, P.L.; Mischel, P.S.; Pope, W.B. Quantitative volumetric analysis of conventional MRI response in recurrent glioblastoma treated with bevacizumab. Neuro Oncol. 2011, 13, 401–409. [Google Scholar] [CrossRef] [PubMed]
- Gahrmann, R.; Bent, M.J.V.D.; Van Der Holt, B.; Vernhout, R.M.; Taal, W.; Vos, M.; De Groot, J.C.; Beerepoot, L.V.; Buter, J.; Flach, Z.H.; et al. Comparison of 2D (RANO) and volumetric methods for assessment of recurrent glioblastoma treated with bevacizumab-a report from the BELOB trial. Neuro Oncol. 2017, 19, 853–861. [Google Scholar] [CrossRef] [PubMed]
- Huang, R. Response assessment in high-grade glioma: Tumor volume as endpoint. Neuro Oncol. 2017, 19, 744–745. [Google Scholar] [CrossRef] [PubMed]
- Brady, R.; Enderling, H. Mathematical Models of Cancer: When to Predict Novel Therapies, and When Not to. Bull. Math. Biol. 2019, 81, 3722–3731. [Google Scholar] [CrossRef]
- Claret, L.; Gupta, M.; Han, K.; Joshi, A.; Sarapa, N.; He, J.; Powell, B.; Bruno, R. Evaluation of Tumor-Size Response Metrics to Predict Overall Survival in Western and Chinese Patients With First-Line Metastatic Colorectal Cancer. J. Clin. Oncol. 2013, 31, 2110–2114. [Google Scholar] [CrossRef]
- Alfonso, J.C.; Köhn-Luque, A.; Stylianopoulos, T.; Feuerhake, F.; Deutsch, A.; Hatzikirou, H. Why one-size-fits-all vaso-modulatory interventions fail to control glioma invasion: In silico insights. Sci. Rep. 2016, 6, 37283. [Google Scholar] [CrossRef]
- Baldock, A.L.; Ahn, S.; Rockne, R.C.; Johnston, S.; Neal, M.L.; Corwin, D.; Clark-Swanson, K.; Sterin, G.; Trister, A.D.; Malone, H.; et al. Patient-Specific Metrics of Invasiveness Reveal Significant Prognostic Benefit of Resection in a Predictable Subset of Gliomas. PLoS ONE 2014, 9, e99057. [Google Scholar] [CrossRef]
- Baldock, A.L.; Yagle, K.; Born, N.E.; Ahn, S.; Trister, A.; Neal, M.L.; Johnston, S.K.; Bridge, C.A.; Basanta, D.; Scott, J.; et al. Invasion and proliferation kinetics in enhancing gliomas predict IDH1 mutation status. Neuro Oncol. 2014, 16, 779–786. [Google Scholar] [CrossRef]
- Harpold, H.L.; Alvord, E.C., Jr.; Swanson, K.R. The evolution of mathematical modeling of glioma proliferation and invasion. J. Neuropathol. Exp. Neurol. 2007, 66, 1–9. [Google Scholar] [CrossRef]
- Jackson, P.R.; Juliano, J.; Hawkins-Daarud, A.; Rockne, R.C.; Swanson, K.R. Patient-specific mathematical Neuro-oncology: Using a simple proliferation and invasion tumor model to inform clinical practice. Bull. Math. Biol. 2015, 77, 846–856. [Google Scholar] [CrossRef]
- Rockne, R.C.; Rockhill, J.K.; Mrugala, M.; Spence, A.M.; Kalet, I.; Hendrickson, K.; Lai, A.; Cloughesy, T.; Alvord, E.C.; Swanson, K.R. Predicting the efficacy of radiotherapy in individual glioblastoma patients in vivo: A mathematical modeling approach. Phys. Med. Biol. 2010, 55, 3271–3285. [Google Scholar] [CrossRef] [PubMed]
- Swanson, K.R.; Alvord, E.C.; Murray, J.D. Virtual resection of gliomas: Effect of extent of resection on recurrence. Math. Comp. Model. 2003, 37, 1177–1190. [Google Scholar] [CrossRef]
- Swanson, K.R.; Rockne, R.C.; Claridge, J.; Chaplain, M.A.; Alvord, E.C., Jr.; Anderson, A.R. Quantifying the role of angiogenesis in malignant progression of gliomas: In silico modeling integrates imaging and histology. Cancer Res. 2011, 71, 7366–7375. [Google Scholar] [CrossRef] [PubMed]
- Tracqui, P.; Cruywagen, G.C.; Woodward, D.E.; Bartoo, G.T.; Murray, J.D.; Alvord, E.C., Jr. A mathematical model of glioma growth: The effect of chemotherapy on spatio-temporal growth. Cell Prolif. 1995, 28, 17–31. [Google Scholar] [CrossRef]
- Banks, H.; Tran, H. Mathematical and Experimental Modeling of Physical and Biological Processes; Chapman and Hall/CRC: New York, NY, USA, 2009. [Google Scholar]
- Chowell, G. Fitting dynamic models to epidemic outbreaks with quantified uncertainty: A primer for parameter uncertainty, identifiability, and forecasts. Infect. Dis. Model. 2017, 2, 379–398. [Google Scholar] [CrossRef]
- Miao, H.; Xia, X.; Perelson, A.S.; Wu, H. On Identifiability of Nonlinear ODE Models and Applications in Viral Dynamics. SIAM Rev. 2011, 53, 3–39. [Google Scholar] [CrossRef]
- Törnqvist, L.; Vartia, P.; Vartia, Y.O. How should relative changes be measured? Am. Stat. 1985, 39, 43–46. [Google Scholar]


| Parameter | Unit | Meaning | Bounds | Patient-Specific |
|---|---|---|---|---|
| day−1 | Net growth rate in the absence of therapy | |||
| day−1 | Initial treatment sensitivity | |||
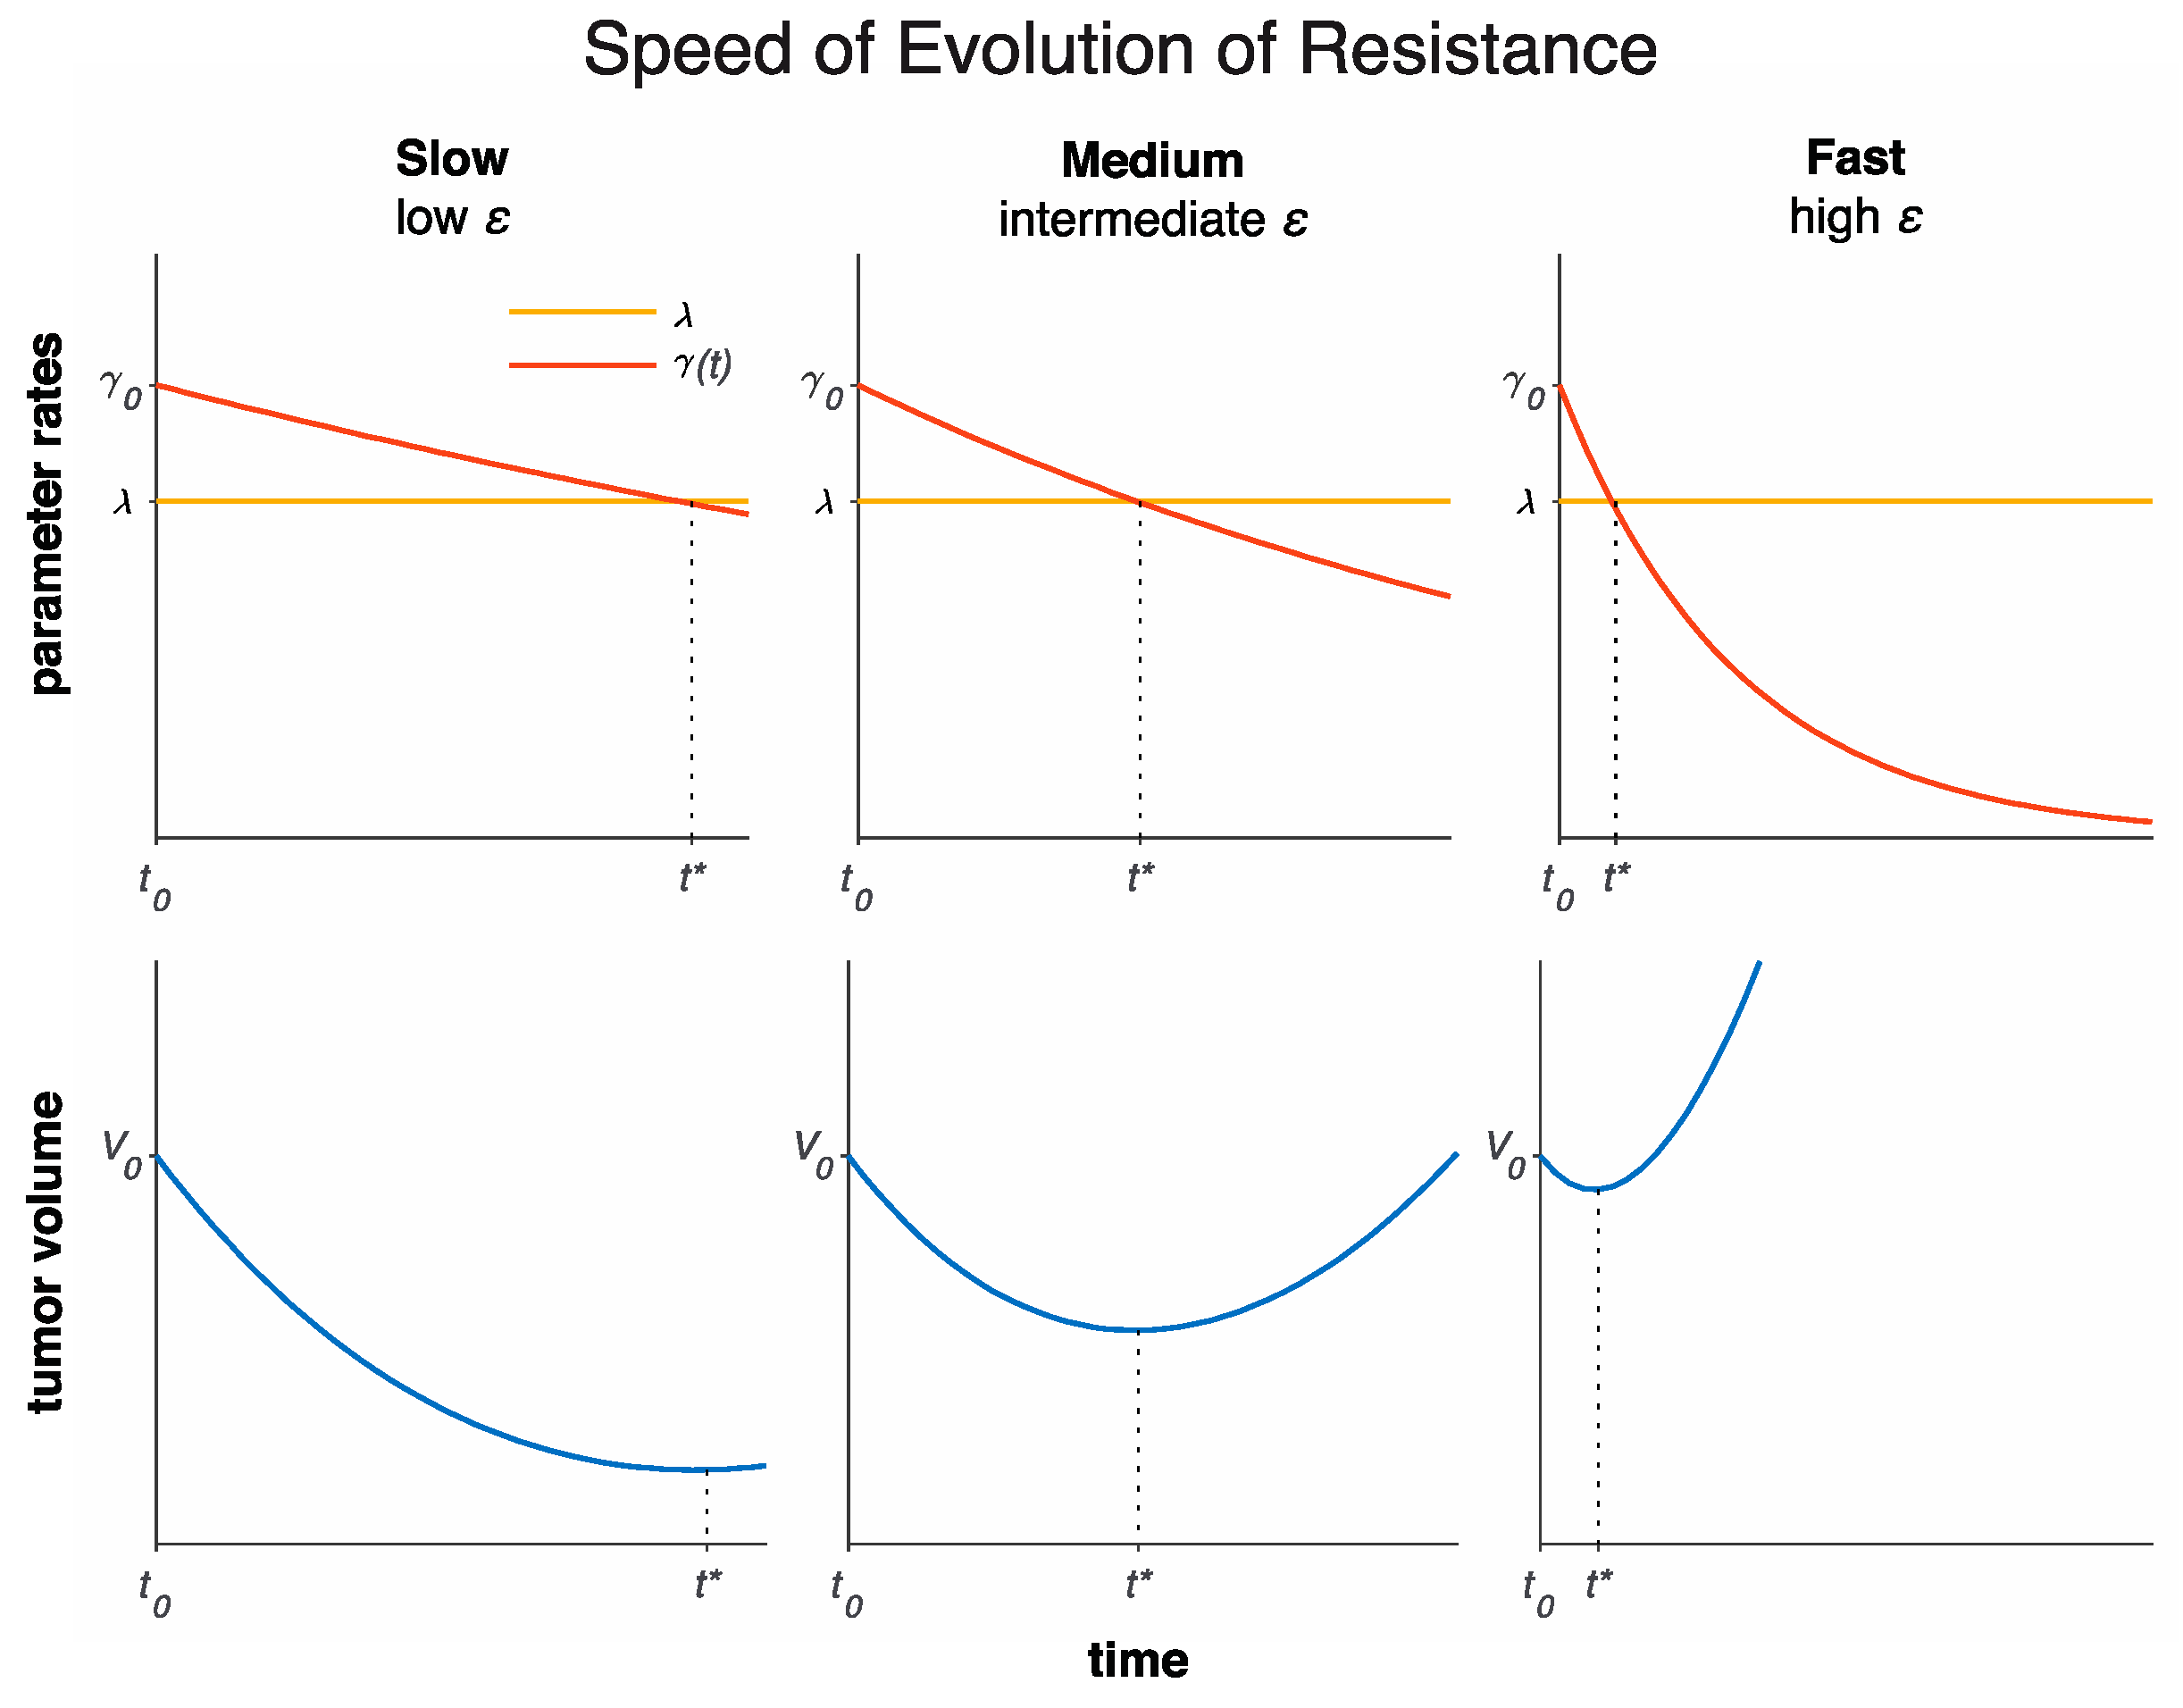
| day−1 | Evolution of resistance rate | ✓ |
| Progression Criterion | NPV | FN | Mean Scans Predicted Early | Median Weeks Predicted Early | Mean Weeks Predicted Early |
|---|---|---|---|---|---|
| 0% | 0.25 | 3 | 3.7 | 12 | 18.5 |
| 25% | 0.57 | 3 | 3.3 | 12 | 17.2 |
| 50% | 0.79 | 3 | 2.6 | 10 | 14 |
| 75% | 0.79 | 3 | 2.6 | 10 | 14 |
| 100% | 0.82 | 3 | 2.2 | 10 | 12 |
| 125% | 0.82 | 3 | 2.2 | 10 | 12 |
| 150% | 0.83 | 3 | 2.1 | 10 | 11.7 |
| 175% | 0.83 | 3 | 2.1 | 10 | 11.7 |
| 200% | 0.84 | 3 | 2.0 | 9.3 | 11.3 |
| 225% | 0.76 | 5 | 2.3 | 10 | 13.2 |
| 250% | 0.76 | 5 | 2.3 | 10 | 13.2 |
| 275% | 0.81 | 5 | 1.6 | 9.3 | 8.1 |
| 300% | 0.81 | 5 | 1.6 | 9.3 | 8.1 |
© 2020 by the authors. Licensee MDPI, Basel, Switzerland. This article is an open access article distributed under the terms and conditions of the Creative Commons Attribution (CC BY) license (http://creativecommons.org/licenses/by/4.0/).
Share and Cite
Glazar, D.J.; Grass, G.D.; Arrington, J.A.; Forsyth, P.A.; Raghunand, N.; Yu, H.-H.M.; Sahebjam, S.; Enderling, H. Tumor Volume Dynamics as an Early Biomarker for Patient-Specific Evolution of Resistance and Progression in Recurrent High-Grade Glioma. J. Clin. Med. 2020, 9, 2019. https://doi.org/10.3390/jcm9072019
Glazar DJ, Grass GD, Arrington JA, Forsyth PA, Raghunand N, Yu H-HM, Sahebjam S, Enderling H. Tumor Volume Dynamics as an Early Biomarker for Patient-Specific Evolution of Resistance and Progression in Recurrent High-Grade Glioma. Journal of Clinical Medicine. 2020; 9(7):2019. https://doi.org/10.3390/jcm9072019
Chicago/Turabian StyleGlazar, Daniel J., G. Daniel Grass, John A. Arrington, Peter A. Forsyth, Natarajan Raghunand, Hsiang-Hsuan Michael Yu, Solmaz Sahebjam, and Heiko Enderling. 2020. "Tumor Volume Dynamics as an Early Biomarker for Patient-Specific Evolution of Resistance and Progression in Recurrent High-Grade Glioma" Journal of Clinical Medicine 9, no. 7: 2019. https://doi.org/10.3390/jcm9072019
APA StyleGlazar, D. J., Grass, G. D., Arrington, J. A., Forsyth, P. A., Raghunand, N., Yu, H.-H. M., Sahebjam, S., & Enderling, H. (2020). Tumor Volume Dynamics as an Early Biomarker for Patient-Specific Evolution of Resistance and Progression in Recurrent High-Grade Glioma. Journal of Clinical Medicine, 9(7), 2019. https://doi.org/10.3390/jcm9072019