Macular Thickness Decrease in Asymptomatic Subjects at High Genetic Risk of Developing Alzheimer’s Disease: An OCT Study

 ,
,  ,
,  ,
, 
 , , ,
, , ,  ,
,  and
and 
Abstract
1. Introduction
2. Materials and Methods
2.1. Study Design
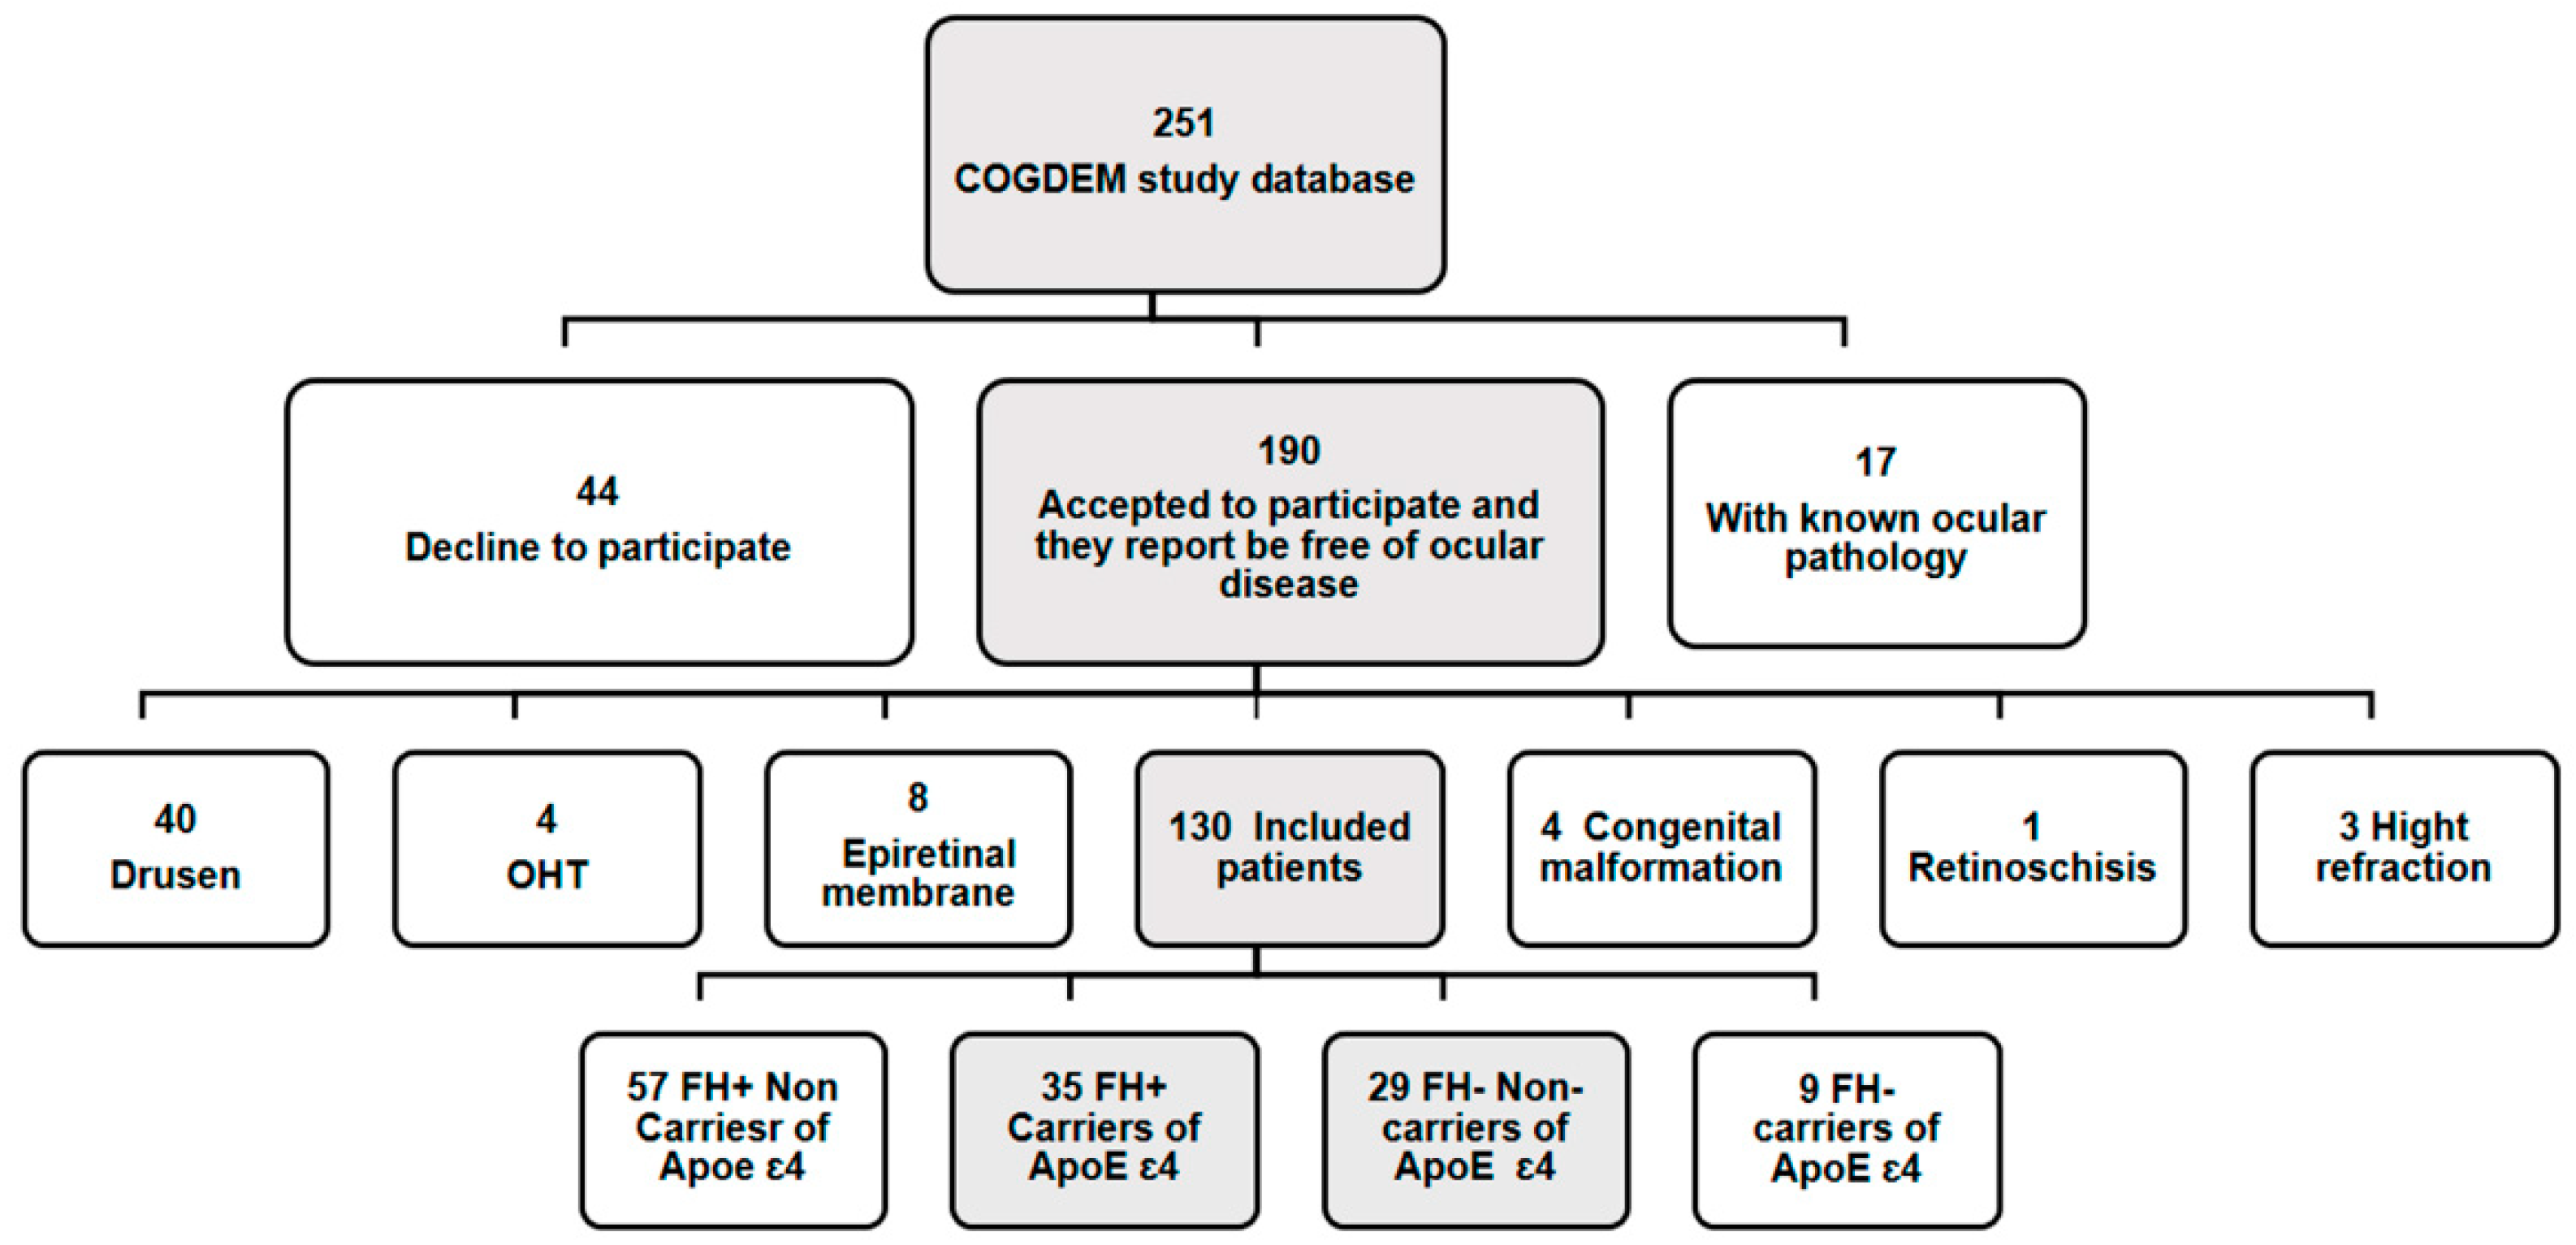
2.2. Subjects
2.3. Ophthalmological Tests
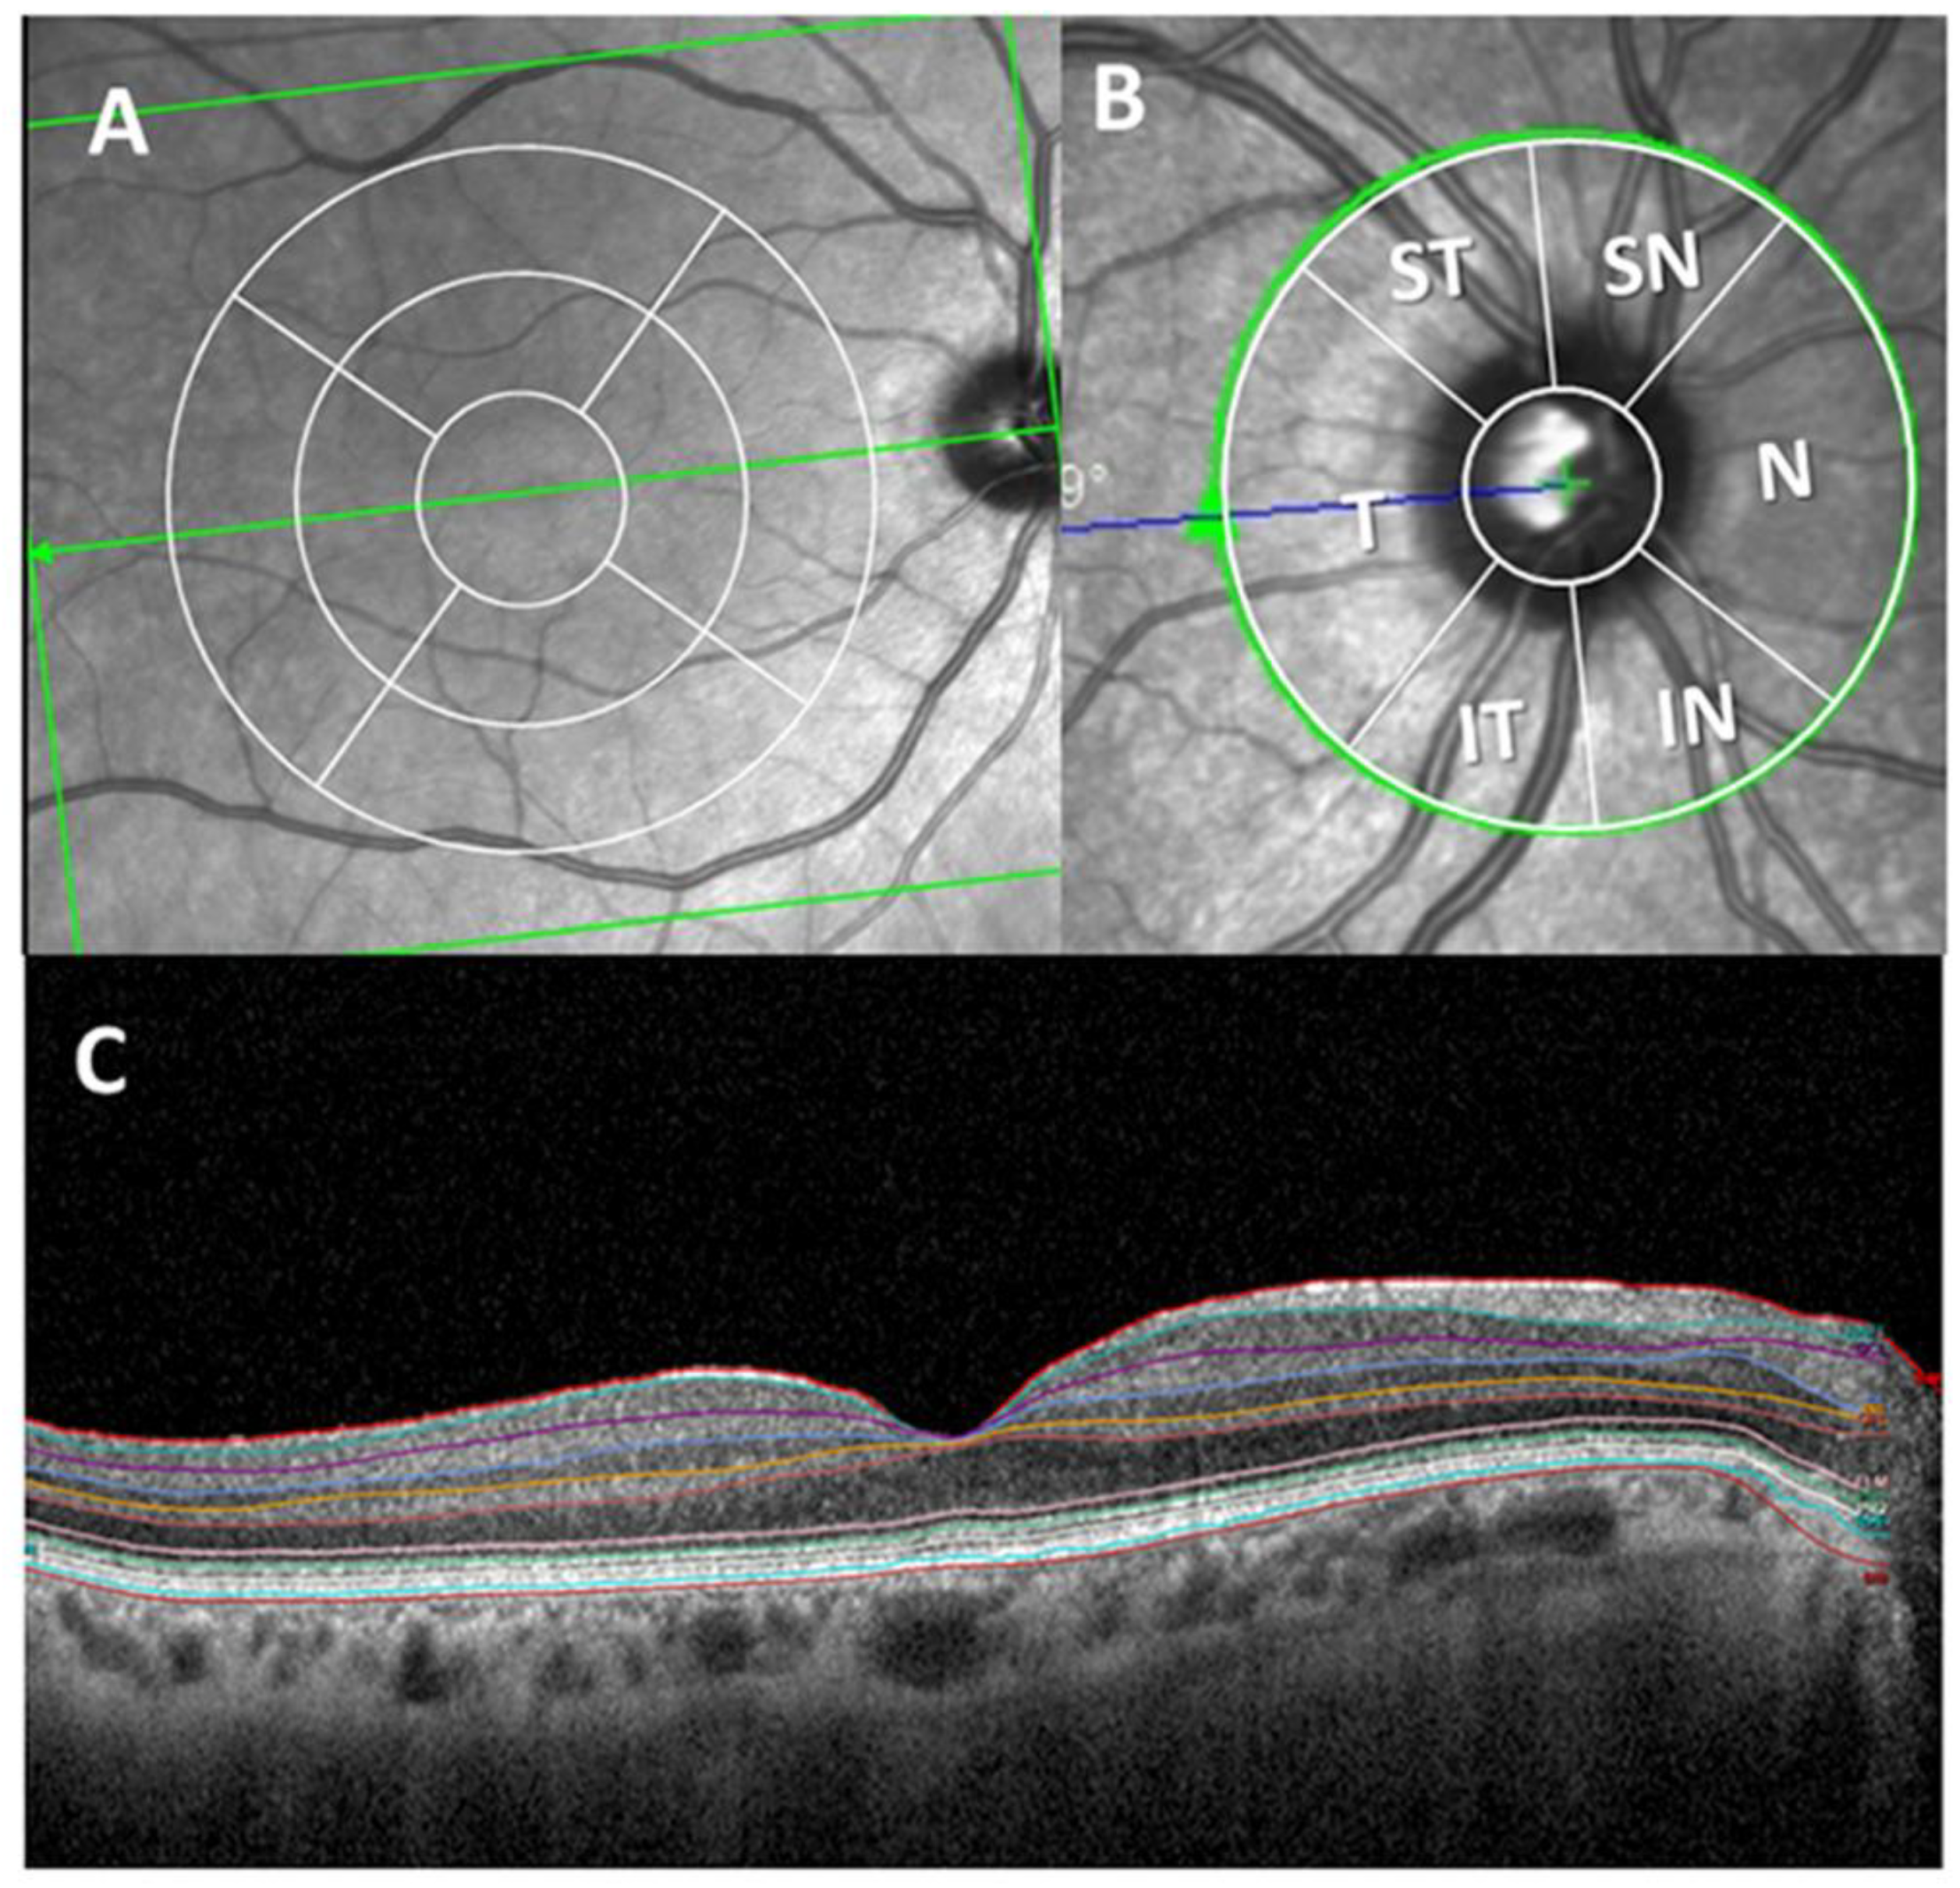
2.4. Optical Coherence Tomography
2.5. Statistical Analysis
3. Results
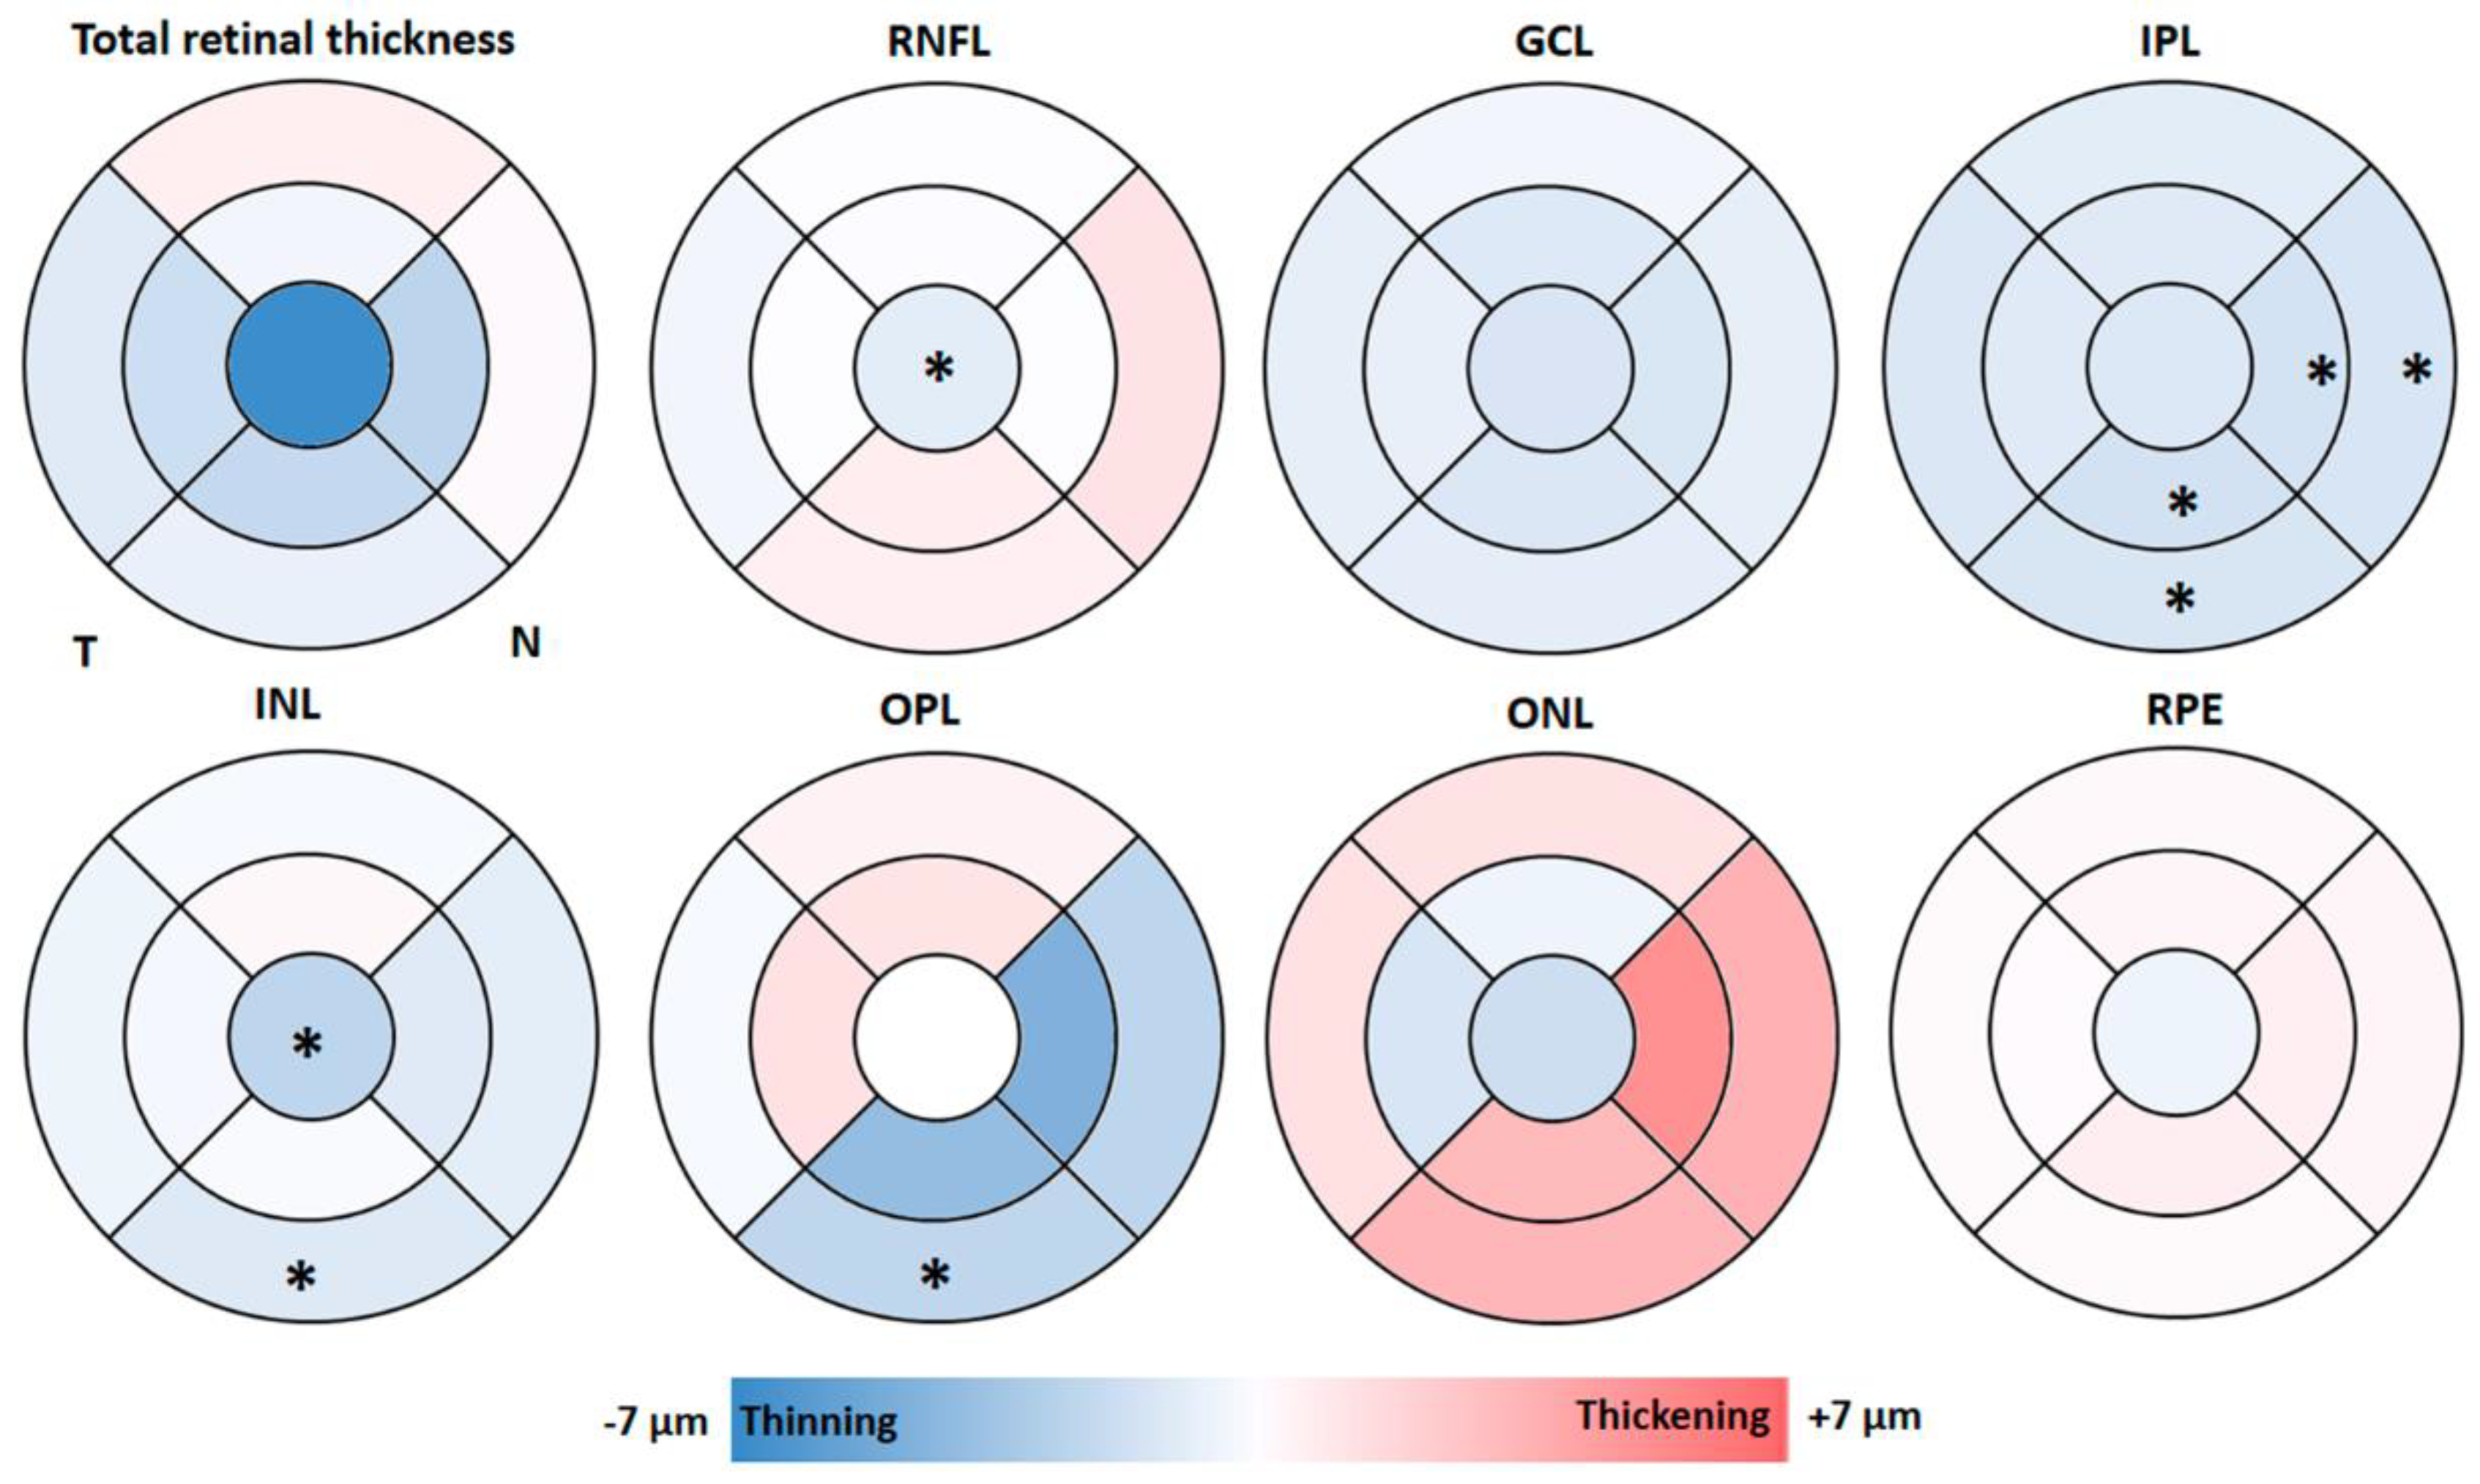
3.1. Macular Thickness Analysis by OCT
3.2. Peripapillary RNFL Segmentation Thickness Analysis by OCT
4. Discussion
Author Contributions
Funding
Conflicts of Interest
References
- Donix, M.; Small, G.W.; Bookheimer, S.Y. Family history and APOE-4 genetic risk in Alzheimer’s disease. Neuropsychol. Rev. 2012, 22, 298–309. [Google Scholar] [CrossRef] [PubMed]
- Shaw, L.M.; Arias, J.; Blennow, K.; Galasko, D.; Molinuevo, J.L.; Salloway, S.P.; Schindler, S.; Carrillo, M.C.; Hendrix, J.A.; Ross, A.; et al. Appropriate use criteria for lumbar puncture and cerebrospinal fluid testing in the diagnosis of Alzheimer’s disease. Alzheimer’s Dement. 2018, 14, 1505–1521. [Google Scholar] [CrossRef] [PubMed]
- Poirier, J.; Bertrand, P.; Kogan, S.; Gauthier, S.; Davignon, J.; Bouthillier, D. Apolipoprotein E polymorphism and Alzheimer’s disease. Lancet 1993, 342, 697–699. [Google Scholar] [CrossRef]
- Budelier, M.M.; Bateman, R.J. Biomarkers of Alzheimer Disease. J. Appl. Lab. Med. 2019, 5, 194–208. [Google Scholar] [CrossRef]
- Corbo, R.M.; Scacchi, R. Apolipoprotein E (APOE) allele distribution in the world. Is APOE*4 a ’thrifty’ allele? Ann. Hum. Genet. 1999, 63, 301–310. [Google Scholar] [CrossRef]
- Corder, E.; Saunders, A.; Strittmatter, W.; Schmechel, D.; Gaskell, P.; Small, G.; Roses, A.; Haines, J.; Pericak-Vance, M. Gene dose of apolipoprotein E type 4 allele and the risk of Alzheimer’s disease in late onset families. Science 1993, 261, 921–923. [Google Scholar] [CrossRef]
- Jack, C.R.; Bennett, D.A.; Blennow, K.; Carrillo, M.C.; Dunn, B.; Haeberlein, S.B.; Holtzman, D.M.; Jagust, W.; Jessen, F.; Karlawish, J.; et al. NIA-AA Research Framework: Toward a biological definition of Alzheimer’s disease. Alzheimer’s Dement. 2018, 14, 535–562. [Google Scholar] [CrossRef]
- Leoni, V. The effect of apolipoprotein E (ApoE) genotype on biomarkers of amyloidogenesis, tau pathology and neurodegeneration in Alzheimer’s disease. Clin. Chem. Lab. Med. 2011, 49, 375–383. [Google Scholar] [CrossRef]
- Trachtenberg, A.J.; Filippini, N.; Ebmeier, K.P.; Smith, S.M.; Karpe, F.; Mackay, C. The effects of APOE on the functional architecture of the resting brain. NeuroImage 2012, 59, 565–572. [Google Scholar] [CrossRef]
- Lim, Y.Y.; Villemagne, V.L.; Pietrzak, R.H.; Ames, D.; Ellis, K.; Harrington, K.; Snyder, P.J.; Martins, R.N.; Masters, C.L.; Rowe, C.C.; et al. APOE ε4 moderates amyloid-related memory decline in preclinical Alzheimer’s disease. Neurobiol. Aging 2015, 36, 1239–1244. [Google Scholar] [CrossRef]
- Kivipelto, M.; Rovio, S.; Ngandu, T.; Kåreholt, I.; Eskelinen, M.; Winblad, B.; Hachinski, V.; Cedazo-Minguez, A.; Soininen, H.; Tuomilehto, J.; et al. Apolipoprotein E ɛ4 magnifies lifestyle risks for dementia: A population-based study. J. Cell. Mol. Med. 2008, 12, 2762–2771. [Google Scholar] [CrossRef]
- Bookheimer, S.Y.; Strojwas, M.H.; Cohen, M.S.; Saunders, A.M.; Pericak-Vance, M.A.; Mazziotta, J.C.; Small, G.W. Patterns of brain activation in people at risk for Alzheimer’s disease. N. Engl. J. Med. 2000, 343, 450–456. [Google Scholar] [CrossRef]
- Reiman, E.M.; Uecker, A.; Caselli, R.J.; Lewis, S.; Bandy, D.; De Leon, M.; De Santi, S.; Convit, A.; Osborne, D.; Weaver, A.; et al. Hippocampal volumes in cognitively normal persons at genetic risk for Alzheimer’s disease. Ann. Neurol. 1998, 44, 288–291. [Google Scholar] [CrossRef]
- Bendlin, B.B.; Ries, M.L.; Canu, E.; Sodhi, A.; Lazar, M.; Alexander, A.L.; Carlsson, C.M.; Sager, M.A.; Asthana, S.; Johnson, S.C. White matter is altered with parental family history of Alzheimer’s disease. Alzheimer’s Dement. 2010, 6, 394–403. [Google Scholar] [CrossRef]
- Badía, M.-C.; Giraldo, E.; Dasí, F.; Alonso, D.; Lainez, J.M.; Lloret, A.; Viña, J. Reductive stress in young healthy individuals at risk of Alzheimer disease. Free Radic. Biol. Med. 2013, 63, 274–279. [Google Scholar] [CrossRef]
- Badia, M.-C.; Lloret, A.; Giraldo, E.; Dasí, F.; Olaso, G.; Alonso, M.-D.; Viña, J. Lymphocytes from Young Healthy Persons Carrying the ApoE4 Allele Overexpress Stress-Related Proteins Involved in the Pathophysiology of Alzheimer’s Disease. J. Alzheimer’s Dis. 2012, 33, 77–83. [Google Scholar] [CrossRef]
- Brugulat-Serrat, A.; Rojas, S.; Bargalló, N.; Conesa, G.; Minguillón, C.; Fauria, K.; Gramunt, N.; Molinuevo, J.L.; Gispert, J.D. Incidental findings on brain MRI of cognitively normal first-degree descendants of patients with Alzheimer’s disease: A cross-Sectional analysis from the ALFA (Alzheimer and Families) project. BMJ Open 2017, 7. [Google Scholar] [CrossRef]
- Nakamura, A.; Cuesta, P.; Kato, T.; Arahata, Y.; Iwata, K.; Yamagishi, M.; Kuratsubo, I.; Kato, K.; Bundo, M.; Diers, K.; et al. Early functional network alterations in asymptomatic elders at risk for Alzheimer’s disease. Sci. Rep. 2017, 7, 6517. [Google Scholar] [CrossRef]
- Busche, M.A.; Eichhoff, G.; Adelsberger, H.; Abramowski, R.; Wiederhold, K.-H.; Haass, C.; Staufenbiel, M.; Konnerth, A.; Garaschuk, O. Clusters of Hyperactive Neurons Near Amyloid Plaques in a Mouse Model of Alzheimer’s Disease. Science 2008, 321, 1686–1689. [Google Scholar] [CrossRef]
- Bateman, R.J.; Xiong, C.; Benzinger, T.L.; Fagan, A.M.; Goate, A.M.; Fox, N.; Marcus, D.S.; Cairns, N.J.; Xie, X.; Blazey, T.M.; et al. Clinical and biomarker changes in dominantly inherited Alzheimer’s disease. N. Engl. J. Med. 2012, 367, 795–804. [Google Scholar] [CrossRef]
- Dubois, B.; Hampel, H.; Feldman, H.H.; Scheltens, P.; Aisen, P.; Andrieu, S.; Bakardjian, H.; Benali, H.; Bertram, L.; Blennow, K.; et al. Preclinical Alzheimer’s disease: Definition, natural history, and diagnostic criteria. Alzheimer’s Dement. 2016, 12, 292–323. [Google Scholar] [CrossRef]
- Koronyo, Y.; Salumbides, B.C.; Black, K.L.; Koronyo-Hamaoui, M. Alzheimer’s Disease in the Retina: Imaging Retinal A Plaques for Early Diagnosis and Therapy Assessment. Neurodegener. Dis. 2012, 10, 285–293. [Google Scholar] [CrossRef]
- Alber, J.; Goldfarb, D.; Hernandez, K.; Cheng, D.; Cordeiro, F.; Van Stavern, G.P.; Snyder, P.J.; Thompson, L.I.; Debuc, D.C.; Arthur, E.; et al. Developing retinal biomarkers for the earliest stages of Alzheimer’s disease: What we know, what we don’t, and how to move forward. Alzheimer’s Dement. 2020, 16, 229–243. [Google Scholar] [CrossRef]
- Cheng, D.L.; Thompson, L.; Snyder, P.J. A Potential Association Between Retinal Changes, Subjective Memory Impairment, and Anxiety in Older Adults at Risk for Alzheimer’s Disease: A 27-Month Pilot Study. Front. Aging Neurosci. 2019, 11, 288. [Google Scholar] [CrossRef]
- Van De Kreeke, J.A.; Nguyen, H.; Haan, J.D.; Konijnenberg, E.; Tomassen, J.; Braber, A.D.; Kate, M.T.; Collij, L.; Yaqub, M.; Van Berckel, B.; et al. Retinal layer thickness in preclinical Alzheimer’s disease. Acta Ophthalmol. 2019, 97, 798–804. [Google Scholar] [CrossRef]
- Santos, C.Y.; Johnson, L.N.; Sinoff, S.E.; Festa, E.K.; Heindel, W.C.; Snyder, P.J. Change in retinal structural anatomy during the preclinical stage of Alzheimer’s disease. Alzheimer’s Dement. 2018, 10, 196–209. [Google Scholar] [CrossRef]
- Shi, Z.; Cao, X.; Hu, J.; Jiang, L.; Mei, X.; Zheng, H.; Chen, Y.; Wang, M.; Cao, J.; Li, W.; et al. Retinal nerve fiber layer thickness is associated with hippocampus and lingual gyrus volumes in nondemented older adults. Prog. Neuro Psychopharmacol. Biol. Psychiatry 2020, 99, 109824. [Google Scholar] [CrossRef]
- Early Treatment Diabetic Retinopathy Study Group. Grading Diabetic Retinopathy from Stereoscopic Color Fundus Photographs—An Extension of the Modified Airlie House Classification: ETDRS Report Number 10. Ophthalmology 1991, 98, 786–806. [Google Scholar] [CrossRef]
- Golzan, M.; Goozee, K.; Georgevsky, D.; Avolio, A.P.; Chatterjee, P.; Shen, K.; Gupta, V.K.; Chung, R.; Savage, G.; Orr, C.; et al. Retinal vascular and structural changes are associated with amyloid burden in the elderly: Ophthalmic biomarkers of preclinical Alzheimer’s disease. Alzheimer’s Res. Ther. 2017, 9, 13. [Google Scholar] [CrossRef]
- Snyder, P.J.; Johnson, L.N.; Lim, Y.Y.; Santos, C.Y.; Alber, J.; Maruff, P.; Fernández, B. Nonvascular retinal imaging markers of preclinical Alzheimer’s disease. Alzheimer’s Dement. 2016, 4, 169–178. [Google Scholar] [CrossRef]
- Haan, J.D.; Van De Kreeke, J.A.; Van Berckel, B.N.; Barkhof, F.; Teunissen, C.E.; Scheltens, P.; Verbraak, F.D.; Bouwman, F.H. Is retinal vasculature a biomarker in amyloid proven Alzheimer’s disease? Alzheimer’s Dement. 2019, 11, 383–391. [Google Scholar] [CrossRef]
- Vegeto, E.; Villa, A.; Della, T.S.; Crippa, V.; Rusmini, P.; Cristofani, R.; Galbiati, M.; Maggi, A.; Poletti, A. The Role of Sex and Sex Hormones in Neurodegenerative Diseases. Endocr. Rev. 2019, 41, 273–319. [Google Scholar] [CrossRef]
- Seltzer, M.M.; Li, L.W. The dynamics of caregiving: Transitions during a three-year prospective study. Gerontologist 2000, 40, 165–178. [Google Scholar] [CrossRef]
- Jefferson, A.L.; Lambe, S.; Chaisson, C.; Palmisano, J.; Horvath, K.J.; Karlawish, J. Clinical Research Participation among Aging Adults Enrolled in an Alzheimer’s Disease Center Research Registry. J. Alzheimer’s Dis. 2011, 23, 443–452. [Google Scholar] [CrossRef]
- Frohman, E.M.; Dwyer, M.G.; Frohman, T.; Cox, J.L.; Salter, A.; Greenberg, B.M.; Hussein, S.; Conger, A.; Calabresi, P.; Balcer, L.J.; et al. Relationship of optic nerve and brain conventional and non-conventional MRI measures and retinal nerve fiber layer thickness, as assessed by OCT and GDx: A pilot study. J. Neurol. Sci. 2009, 282, 96–105. [Google Scholar] [CrossRef] [PubMed]
- Gao, L.; Liu, Y.; Li, X.; Bai, Q.; Liu, P. Abnormal retinal nerve fiber layer thickness and macula lutea in patients with mild cognitive impairment and Alzheimer’s disease. Arch. Gerontol. Geriatr. 2015, 60, 162–167. [Google Scholar] [CrossRef]
- Salobrar-García, E.; De Hoz, R.; Ramírez, A.I.; López-Cuenca, I.; Rojas, P.; Vazirani, R.; Amarante, C.; Yubero, R.; Gil, P.; Pinazo-Durán, M.D.; et al. Changes in visual function and retinal structure in the progression of Alzheimer’s disease. PLoS ONE 2019, 14, e0220535. [Google Scholar] [CrossRef]
- Salobrar-Garcia, E.; De Hoz, R.; Rojas, B.; Ramírez, A.I.; Salazar, J.J.; Yubero, R.; Gil, P.; Triviño, A.; Ramírez, J.M. Ophthalmologic Psychophysical Tests Support OCT Findings in Mild Alzheimer’s Disease. J. Ophthalmol. 2015, 2015, 1–10. [Google Scholar] [CrossRef]
- Shi, Z.; Zhu, Y.; Wang, M.; Wu, Y.; Cao, J.; Li, C.; Xie, Z.; Shen, Y. The Utilization of Retinal Nerve Fiber Layer Thickness to Predict Cognitive Deterioration. J. Alzheimer’s Dis. 2015, 49, 399–405. [Google Scholar] [CrossRef]
- Shi, Z.; Wu, Y.; Wang, M.; Cao, J.; Feng, W.; Cheng, Y.; Li, C.; Shen, Y. Greater Attenuation of Retinal Nerve Fiber Layer Thickness in Alzheimer’s Disease Patients. J. Alzheimer’s Dis. 2014, 40, 277–283. [Google Scholar] [CrossRef]
- Cunha, L.P.; Lopes, L.C.; Costa-Cunha, L.V.F.; Costa, C.F.; Pires, L.A.; Almeida, A.L.M.; Monteiro, M.L.R. Macular Thickness Measurements with Frequency Domain-OCT for Quantification of Retinal Neural Loss and its Correlation with Cognitive Impairment in Alzheimerʼs Disease. PLoS ONE 2016, 11, e0153830. [Google Scholar] [CrossRef]
- Salobrar-García, E.; Rojas, B.; Ramírez, A.I.; De Hoz, R.; Salazar, J.J.; Yubero, R.; Gil, P.; Triviño, A.; Ramírez, J.M. Macular Thickness as a Potential Biomarker of Mild Alzheimer’s Disease. Ophthalmology 2014, 121, 1149–1151.e3. [Google Scholar] [CrossRef]
- Yap, T.E.; Balendra, S.I.; Almonte, M.T.; Cordeiro, M.F. Retinal correlates of neurological disorders. Ther. Adv. Chronic Dis. 2019, 10. [Google Scholar] [CrossRef]
- Ascaso, F.J.; Cruz, N.; Modrego, P.J.; Lopez-Anton, R.; Santabárbara, J.; Pascual, L.F.; Lobo, A.; Cristóbal, J.A. Retinal alterations in mild cognitive impairment and Alzheimer’s disease: An optical coherence tomography study. J. Neurol. 2014, 261, 1522–1530. [Google Scholar] [CrossRef]
- Knoll, B.; Simonett, J.; Volpe, N.J.; Farsiu, S.; Ward, M.; Rademaker, A.; Weintraub, S.; Fawzi, A.A. Retinal nerve fiber layer thickness in amnestic mild cognitive impairment: Case-control study and meta-Analysis. Alzheimer’s Dement. 2016, 4, 85–93. [Google Scholar] [CrossRef]
- Garcia-Martin, E.; Bambo, M.P.; Marques, M.L.; Satue, M.; Otin, S.; Larrosa, J.M.; Polo, V.; Pablo, L. Ganglion cell layer measurements correlate with disease severity in patients with Alzheimer’s disease. Acta Ophthalmol. 2016, 94, e454–e459. [Google Scholar] [CrossRef]
- Cheung, C.Y.; Ong, Y.T.; Hilal, S.; Ikram, M.K.; Low, S.; Venketasubramanian, N.; Yap, P.; Seow, D.; Chen, C.L.H.; Wong, T.Y.; et al. Retinal Ganglion Cell Analysis Using High-Definition Optical Coherence Tomography in Patients with Mild Cognitive Impairment and Alzheimer’s Disease. J. Alzheimer’s Dis. 2015, 45, 45–56. [Google Scholar] [CrossRef]
- Beach, T.G.; Kuo, Y.-M.; Spiegel, K.; Emmerling, M.R.; Sue, L.I.; Kokjohn, K.; Roher, A.E. The Cholinergic Deficit Coincides with Aβ Deposition at the Earliest Histopathologic Stages of Alzheimer Disease. J. Neuropathol. Exp. Neurol. 2000, 59, 308–313. [Google Scholar] [CrossRef]
- Potter, P.E.; Rauschkolb, P.K.; Pandya, Y.; Sue, L.I.; Sabbagh, M.N.; Walker, U.G.; Beach, T.G. Pre- and post-synaptic cortical cholinergic deficits are proportional to amyloid plaque presence and density at preclinical stages of Alzheimer’s disease. Acta Neuropathol. 2011, 122, 49–60. [Google Scholar] [CrossRef]
- Jáñez-Escalada, L.; Jáñez-García, L.; Salobrar-García, E.; Santos-Mayo, A.; De Hoz, R.; Yubero, R.; Gil, P.; Ramírez, J.M. Spatial analysis of thickness changes in ten retinal layers of Alzheimer’s disease patients based on optical coherence tomography. Sci. Rep. 2019, 9, 13000–13014. [Google Scholar] [CrossRef]
- Salobrar-García, E.; Ramírez, J.M.; De Hoz, R.; Rojas, P.; Salazar, J.J.; Yubero, R.; Gil, P.; Triviño, A.; Ramírez, J.M. The Impact of the Eye in Dementia: The Eye and its Role in Diagnosis and Follow-Up. In Update on Dementia; InTechopen: London, UK, 2016. [Google Scholar]


| Do you use glasses? Yes/No Do you know if you have myopia, hypermetropy or astigmatism? Do you know how much diopters? Do you have any ocular pathology? Yes/No Do you have any type of ocular treatment? Yes/No Do you have any type of ocular surgery performed? Yes/No |
| Being free of ocular disease or posterior pole pathology Macular degeneration Drusen Glaucoma or suspicion Epiretinal membrane Congenital malformation Having a best corrected visual acuity more than 20/40. Having less than ± 5 spherocylindrical refractive error. Having intraocular pressure less than 20 mmHg. |
| FH+ ApoE ɛ4 Carriers | FH− ApoE ɛ4 Non-Carriers | p-Value | |
|---|---|---|---|
| Number of participants (n) | 35 | 29 | |
| Age (years) | 57.00 (54.00–61.00) | 59.00 (54.00–65.00) | 0.164 |
| Sex | 0.028 *,1/0.353 1 | ||
| Male/Female | 11/24 | 12/17 | |
| MMSE | 29.00 (29.00–29.00) | 29.00 (28.00–29.00) |
© 2020 by the authors. Licensee MDPI, Basel, Switzerland. This article is an open access article distributed under the terms and conditions of the Creative Commons Attribution (CC BY) license (http://creativecommons.org/licenses/by/4.0/).
Share and Cite
López-Cuenca, I.; de Hoz, R.; Salobrar-García, E.; Elvira-Hurtado, L.; Rojas, P.; Fernández-Albarral, J.A.; Barabash, A.; Salazar, J.J.; Ramírez, A.I.; Ramírez, J.M. Macular Thickness Decrease in Asymptomatic Subjects at High Genetic Risk of Developing Alzheimer’s Disease: An OCT Study. J. Clin. Med. 2020, 9, 1728. https://doi.org/10.3390/jcm9061728
López-Cuenca I, de Hoz R, Salobrar-García E, Elvira-Hurtado L, Rojas P, Fernández-Albarral JA, Barabash A, Salazar JJ, Ramírez AI, Ramírez JM. Macular Thickness Decrease in Asymptomatic Subjects at High Genetic Risk of Developing Alzheimer’s Disease: An OCT Study. Journal of Clinical Medicine. 2020; 9(6):1728. https://doi.org/10.3390/jcm9061728
Chicago/Turabian StyleLópez-Cuenca, Inés, Rosa de Hoz, Elena Salobrar-García, Lorena Elvira-Hurtado, Pilar Rojas, José A. Fernández-Albarral, Ana Barabash, Juan J. Salazar, Ana I. Ramírez, and José M. Ramírez. 2020. "Macular Thickness Decrease in Asymptomatic Subjects at High Genetic Risk of Developing Alzheimer’s Disease: An OCT Study" Journal of Clinical Medicine 9, no. 6: 1728. https://doi.org/10.3390/jcm9061728
APA StyleLópez-Cuenca, I., de Hoz, R., Salobrar-García, E., Elvira-Hurtado, L., Rojas, P., Fernández-Albarral, J. A., Barabash, A., Salazar, J. J., Ramírez, A. I., & Ramírez, J. M. (2020). Macular Thickness Decrease in Asymptomatic Subjects at High Genetic Risk of Developing Alzheimer’s Disease: An OCT Study. Journal of Clinical Medicine, 9(6), 1728. https://doi.org/10.3390/jcm9061728