Effect of Body Mass Index on Postoperative Nausea and Vomiting: Propensity Analysis

 , and
, and
Abstract
1. Introduction
2. Patients and Methods
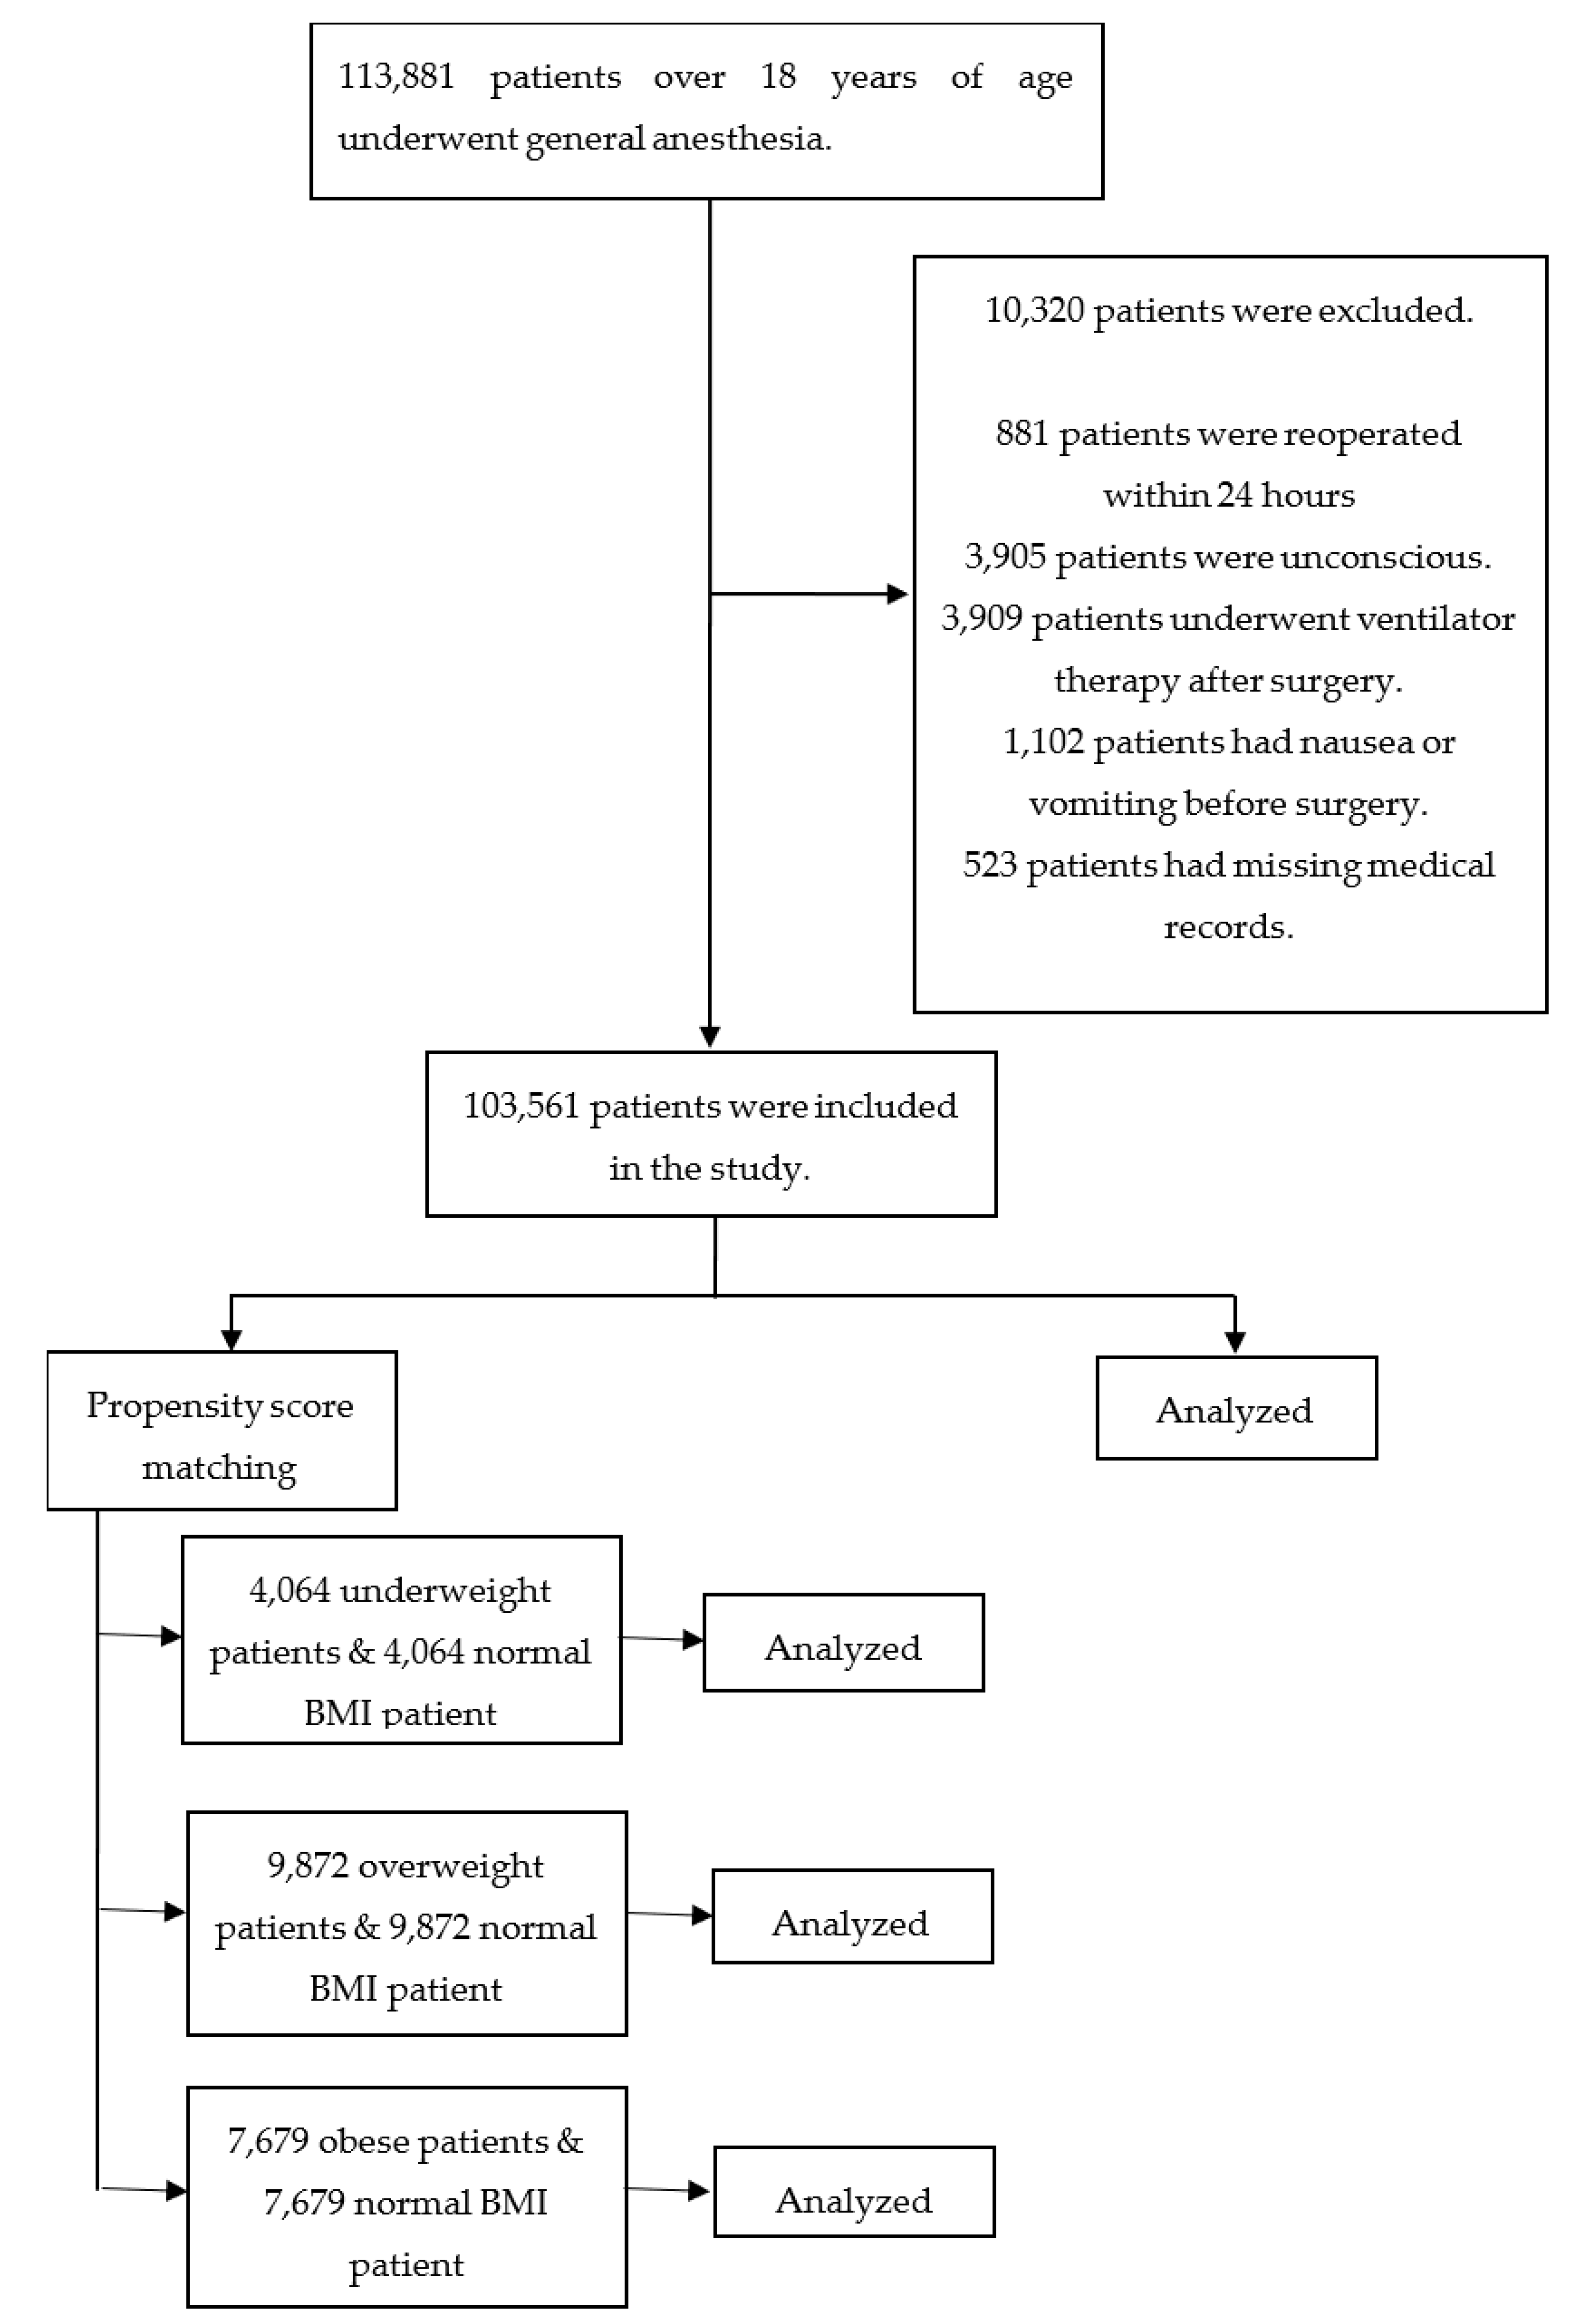
2.1. Patients
2.2. BMI, PONV, and Covariates
2.3. Statistics
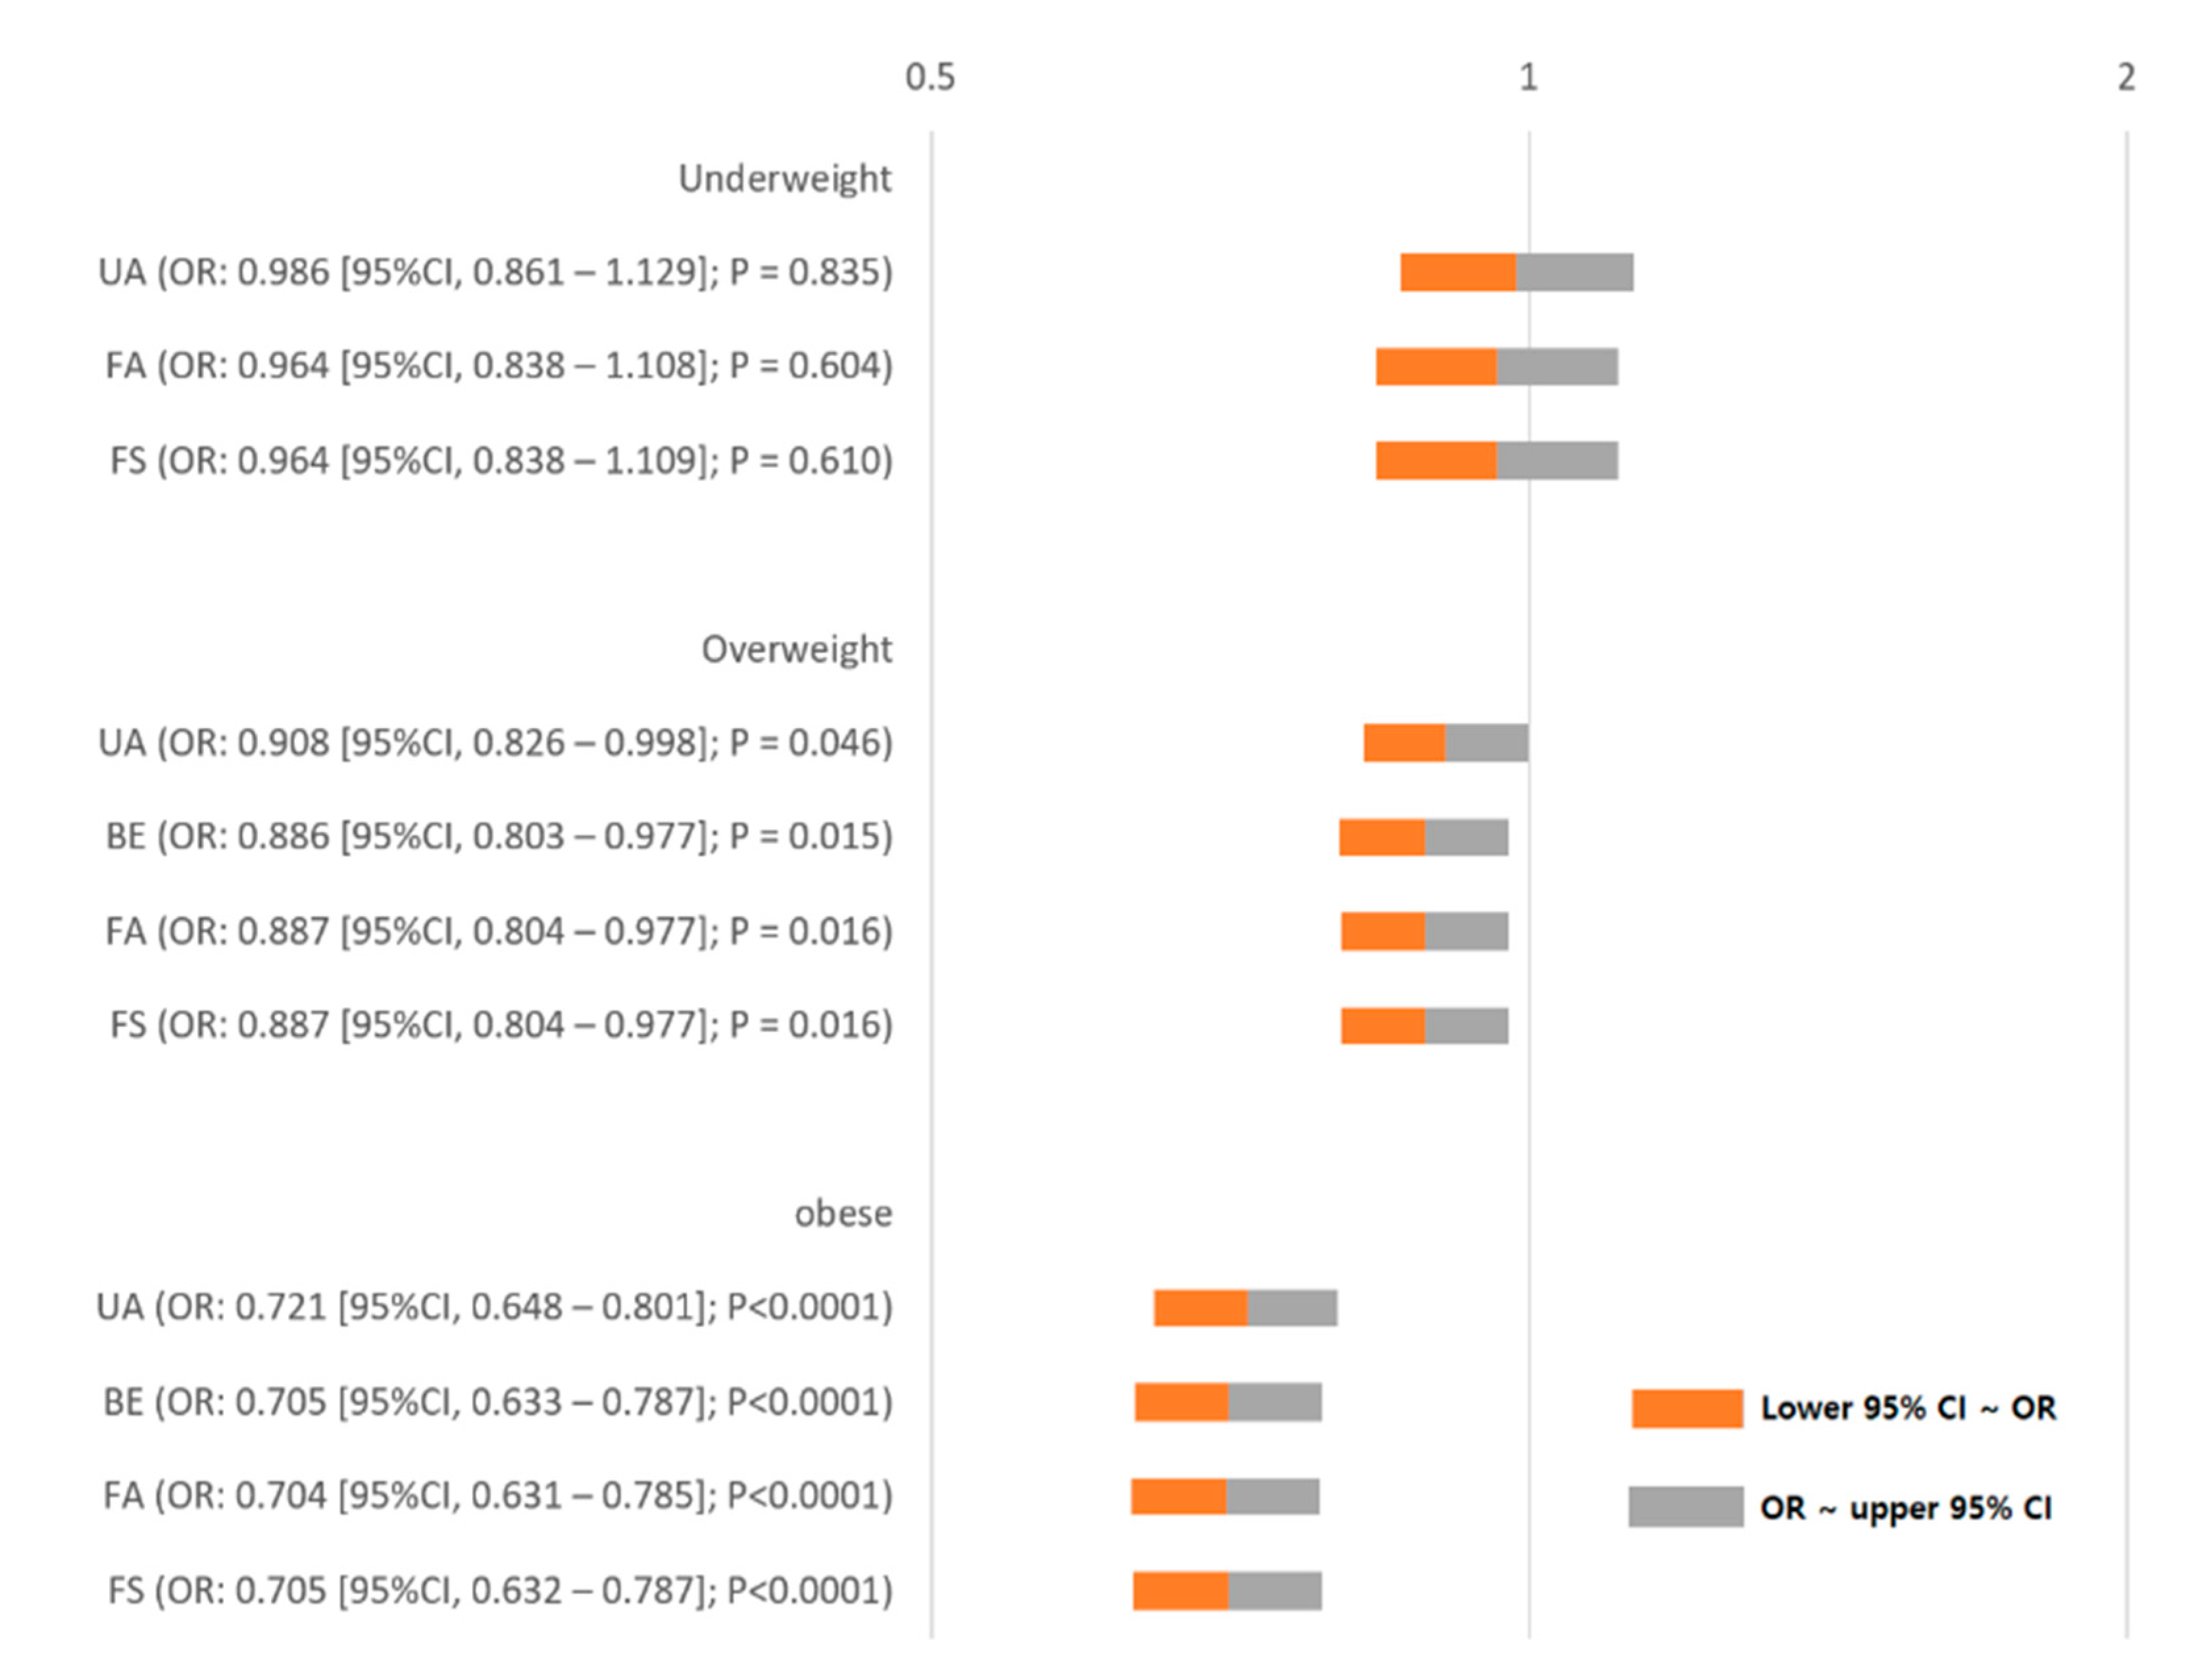
3. Results
Patient Characteristics
4. Discussion
5. Conclusions
Supplementary Materials
Author Contributions
Funding
Conflicts of Interest
References
- Eberhart, L.H.; Hogel, J.; Seeling, W.; Staack, A.M.; Geldner, G.; Georgieff, M. Evaluation of three risk scores to predict postoperative nausea and vomiting. Acta Anaesthesiol. Scand. 2000, 44, 480–488. [Google Scholar] [CrossRef] [PubMed]
- Gan, T.J. Postoperative nausea and vomiting—Can it be eliminated? JAMA 2002, 287, 1233–1236. [Google Scholar] [CrossRef] [PubMed]
- Macario, A.; Weinger, M.; Carney, S.; Kim, A. Which Clinical Anesthesia Outcomes Are Important to Avoid? The Perspective of Patients. Anesth. Analg. 1999, 89, 652. [Google Scholar] [CrossRef]
- Tramer, M.R. Treatment of postoperative nausea and vomiting. BMJ 2003, 327, 762–763. [Google Scholar] [CrossRef]
- Pierre, S.; Whelan, R. Nausea and vomiting after surgery. Contin. Educ. Anaesth. Crit. Care Pain 2013, 13, 28–32. [Google Scholar] [CrossRef]
- Apfel, C.C.; Kranke, P.; Katz, M.H.; Goepfert, C.; Papenfuss, T.; Rauch, S.; Heineck, R.; Greim, C.A.; Roewer, N. Volatile anaesthetics may be the main cause of early but not delayed postoperative vomiting: A randomized controlled trial of factorial design. Br. J. Anaesth. 2002, 88, 659–668. [Google Scholar] [CrossRef]
- Scuderi, P.E.; Conlay, L.A. Postoperative nausea and vomiting and outcome. Int. Anesthesiol. Clin. 2003, 41, 165–174. [Google Scholar] [CrossRef]
- Watcha, M.F.; White, P.F. Postoperative nausea and vomiting. Its etiology, treatment, and prevention. Anesthesiology 1992, 77, 162–184. [Google Scholar] [CrossRef]
- World Health Organization. Physical status: The use and interpretation of anthropometry. Report of a WHO Expert Committee. World Health Organ. Tech. Rep. Ser. 1995, 854, 1–452. [Google Scholar]
- Kwon, Y.S.; Choi, J.W.; Lee, H.S.; Kim, J.H.; Kim, Y.; Lee, J.J. Effect of a Preoperative Proton Pump Inhibitor and Gastroesophageal Reflux Disease on Postoperative Nausea and Vomiting. J. Clin. Med. 2020, 9, 825. [Google Scholar] [CrossRef]
- Eberhart, L.; Morin, A.; Felbinger, T.; Falkner, Y.; Georgieff, M.; Seeling, W. Results of a survey of anesthetists on postoperative nausea and vomiting. Anasthesiol. Intensivmed. Notf. Schmerzther. AINS 1998, 33, 545–551. [Google Scholar] [CrossRef]
- Apipan, B.; Rummasak, D.; Wongsirichat, N. Postoperative nausea and vomiting after general anesthesia for oral and maxillofacial surgery. J. Dent. Anesth. Pain Med. 2016, 16, 273–281. [Google Scholar] [CrossRef] [PubMed]
- Silva, A.C.; O’Ryan, F.; Poor, D.B. Postoperative nausea and vomiting (PONV) after orthognathic surgery: A retrospective study and literature review. J. Oral Maxillofac. Surg. 2006, 64, 1385–1397. [Google Scholar] [CrossRef]
- Nitahara, K.; Sugi, Y.; Shono, S.; Hamada, T.; Higa, K. Risk factors for nausea and vomiting following vitrectomyin adults. Eur. J. Anaesthesiol. 2007, 24, 166–170. [Google Scholar] [CrossRef]
- Kranke, P.; Apfel, C.; Papenfuss, T.; Rauch, S.; Löbmann, U.; Rübsam, B.; Greim, C.A.; Roewer, N. An increased body mass index is no risk factor for postoperative nausea and vomiting: A systematic review and results of original data Note. Acta Anaesthesiol. Scand. 2001, 45, 160–166. [Google Scholar] [CrossRef]
- Cohen, M.M.; Duncan, P.G.; DeBoer, D.P.; Tweed, W.A. The postoperative interview: Assessing risk factors for nausea and vomiting. Anesth. Analg. 1994, 78, 7–16. [Google Scholar] [CrossRef]
- Koivuranta, M.; Laara, E.; Snare, L.; Alahuhta, S. A survey of postoperative nausea and vomiting. Anaesthesia 1997, 52, 443–449. [Google Scholar] [CrossRef] [PubMed]
- Fabling, J.M.; Gan, T.J.; Guy, J.; Borel, C.O.; el-Moalem, H.E.; Warner, D.S. Postoperative nausea and vomiting. A retrospective analysis in patients undergoing elective craniotomy. J. Neurosurg. Anesthesiol. 1997, 9, 308–312. [Google Scholar] [CrossRef] [PubMed]
- Junger, A.; Hartmann, B.; Benson, M.; Schindler, E.; Dietrich, G.; Jost, A.; Beye-Basse, A.; Hempelmannn, G. The use of an anesthesia information management system for prediction of antiemetic rescue treatment at the postanesthesia care unit. Anesth. Analg. 2001, 92, 1203–1209. [Google Scholar] [CrossRef] [PubMed]
- Luellen, J.K.; Shadish, W.R.; Clark, M. Propensity scores: An introduction and experimental test. Eval. Rev. 2005, 29, 530–558. [Google Scholar] [CrossRef]
- Day, A.G. Why the Propensity for Propensity Scores? Crit. Care Med. 2015, 43, 2024–2026. [Google Scholar] [CrossRef] [PubMed]
- Sinclair, D.R.; Chung, F.; Mezei, G. Can postoperative nausea and vomiting be predicted? Anesthesiology 1999, 91, 109–118. [Google Scholar] [CrossRef] [PubMed]
- Palazzo, M.; Evans, R. Logistic regression analysis of fixed patient factors for postoperative sickness: A model for risk assessment. Br. J. Anaesth. 1993, 70, 135–140. [Google Scholar] [CrossRef]
- Van den Bosch, J.E.; Moons, K.G.; Bonsel, G.J.; Kalkman, C.J. Does measurement of preoperative anxiety have added value for predicting postoperative nausea and vomiting? Anesth. Analg. 2005, 100, 1525–1532. [Google Scholar] [CrossRef] [PubMed]
- Apfel, C.C.; Greim, C.A.; Haubitz, I.; Goepfert, C.; Usadel, J.; Sefrin, P.; Roewer, N. A risk score to predict the probability of postoperative vomiting in adults. Acta Anaesthesiol. Scand. 1998, 42, 495–501. [Google Scholar] [CrossRef]
- Apfel Christian, C.; Läärä, E.; Koivuranta, M.; Greim, C.-A.; Roewer, N. A Simplified Risk Score for Predicting Postoperative Nausea and Vomiting: Conclusions from Cross-validations between Two Centers. Anesthesiol. J. Am. Soc. Anesthesiol. 1999, 91, 693–700. [Google Scholar]
- Eberhart, L.H.; Geldner, G.; Kranke, P.; Morin, A.M.; Schauffelen, A.; Treiber, H.; Wulf, H. The development and validation of a risk score to predict the probability of postoperative vomiting in pediatric patients. Anesth. Analg. 2004, 99, 1630–1637. [Google Scholar] [CrossRef]
- Gan, T.J. Risk Factors for Postoperative Nausea and Vomiting. Anesth. Analg. 2006, 102, 1884–1898. [Google Scholar] [CrossRef] [PubMed]
- Szumilas, M. Explaining odds ratios. J. Can. Acad. Child Adolesc. Psychiatry 2010, 19, 227–229. [Google Scholar]
- Joffe, M.M.; Rosenbaum, P.R. Invited commentary: Propensity scores. Am. J. Epidemiol. 1999, 150, 327–333. [Google Scholar] [CrossRef]
- Brookhart, M.A.; Schneeweiss, S.; Rothman, K.J.; Glynn, R.J.; Avorn, J.; Stürmer, T. Variable selection for propensity score models. Am. J. Epidemiol. 2006, 163, 1149–1156. [Google Scholar] [CrossRef] [PubMed]
- Weber, J.; Schmidt, J.; Wirth, S.; Schumann, S.; Philip, J.H.; Eberhart, L.H.J. Context-sensitive decrement times for inhaled anesthetics in obese patients explored with Gas Man(R). J. Clin. Monit. Comput. 2020, 1–12. [Google Scholar] [CrossRef] [PubMed]
- Lee, H. Anesthetic management of the bariatric surgery. J. Korean Med. Assoc. /TaehanUisaHyophoe Chi 2012, 55, 10. [Google Scholar] [CrossRef][Green Version]
- Al-Goblan, A.S.; Al-Alfi, M.A.; Khan, M.Z. Mechanism linking diabetes mellitus and obesity. Diabetes Metab. Syndr. Obes. 2014, 7, 587–591. [Google Scholar] [CrossRef]
- El-Serag, H.B.; Graham, D.Y.; Satia, J.A.; Rabeneck, L. Obesity is an independent risk factor for GERD symptoms and erosive esophagitis. Am. J. Gastroenterol. 2005, 100, 1243–1250. [Google Scholar] [CrossRef]
- Lambert, D.M.; Marceau, S.; Forse, R.A. Intra-abdominal pressure in the morbidly obese. Obes. Surg. 2005, 15, 1225–1232. [Google Scholar] [CrossRef]
- Bellville, J.W.; Bross, I.; Howland, W.S. Postoperative nausea and vomiting. IV. Factors related to postoperative nausea and vomiting. Anesthesiology 1960, 21, 186–193. [Google Scholar] [CrossRef]
- McKie, B. Postoperative nausea and vomiting: A review of their incidence, causes and effects. Aust. N. Z. J. Surg. 1970, 39, 311–314. [Google Scholar] [CrossRef]
- Palazzo, M.; Strunin, L. Anaesthesiaand emesis. I: Etiology. Can. Anaesth. Soc. J. 1984, 31, 178–187. [Google Scholar] [CrossRef]
- Lerman, J. Surgical and patient factors involved in postoperative nausea and vomiting. Br. J. Anaesth. 1992, 69, 24S. [Google Scholar] [CrossRef]
- Muir, J.J.; Warner, M.A.; Offord, K.P.; Buck, C.F.; Harper, J.V.; Kunkel, S.E. Role of nitrous oxide and other factors in postoperative nausea and vomiting: A randomized and blinded prospective study. Anesthesiology 1987, 66, 513–518. [Google Scholar] [CrossRef] [PubMed]
- Butterworth, J.F.; Mackey, D.C.; Wasnick, J.D. Morgan and Mikhail’s Clinical Anesthesiology; McGraw-Hill Education: New York, NY, USA, 2018. [Google Scholar]
- Lemmens, H.J.M.; Saidman, L.J.; Eger, E.I.I.; Laster, M.J. Obesity Modestly Affects Inhaled Anesthetic Kinetics in Humans. Anesth. Analg. 2008, 107, 1864–1870. [Google Scholar] [CrossRef] [PubMed]
- Collis, T.; Devereux, R.B.; Roman, M.J.; de Simone, G.; Yeh, J.-L.; Howard, B.V.; Fabsitz, R.R.; Welty, T.K. Relations of stroke volume and cardiac output to body composition: The strong heart study. Circulation 2001, 103, 820–825. [Google Scholar] [CrossRef] [PubMed]
- Gallagher, D.; Belmonte, D.; Deurenberg, P.; Wang, Z.; Krasnow, N.; Pi-Sunyer, F.X.; Heymsfield, S.B. Organ-tissue mass measurement allows modeling of REE and metabolically active tissue mass. Am. J. Physiol. Endocrinol. Metab. 1998, 275, E249–E258. [Google Scholar] [CrossRef]
- Hanley, M.J.; Abernethy, D.R.; Greenblatt, D.J. Effect of obesity on the pharmacokinetics of drugs in humans. Clin. Pharmacokinet. 2010, 49, 71–87. [Google Scholar] [CrossRef] [PubMed]
- Blouin, R.A.; Warren, G.W. Pharmacokinetic considerations in obesity. J. Pharm. Sci. 1999, 88, 1–7. [Google Scholar] [CrossRef] [PubMed]
- Miller, R.D.; Eriksson, L.I.; Fleisher, L.A.; Wiener-Kronish, J.P.; Cohen, N.H.; Young, W.L. Miller’s Anesthesia E-Book; Philadelphia Elsevier Health Sciences: Amsterdam, The Netherlands, 2014. [Google Scholar]
- Gan, T.J.; Diemunsch, P.; Habib, A.S.; Kovac, A.; Kranke, P.; Meyer, T.A.; Watcha, M.; Chung, F.; Angus, S.; Apfel, C.C.; et al. Consensus Guidelines for the Management of Postoperative Nausea and Vomiting. Anesth. Analg. 2014, 118, 85–113. [Google Scholar] [CrossRef]
- Rodríguez-Morató, J.; Goday, A.; Langohr, K.; Pujadas, M.; Civit, E.; Pérez-Mañá, C.; Papaseit, E.; Ramon, J.M.; Benaiges, D.; Castañer, O.; et al. Short- and medium-term impact of bariatric surgery on the activities of CYP2D6, CYP3A4, CYP2C9, and CYP1A2 in morbid obesity. Sci. Rep. 2019, 9, 20405. [Google Scholar] [CrossRef]
- Jain, R.; Chung, S.; Jain, L.; Khurana, M.; Lau, S.; Lee, J.; Vaidyanathan, J.; Zadezensky, I.; Choe, S.; Sahajwalla, C. Implications of obesity for drug therapy: Limitations and challenges. Clin. Pharmacol. Ther. 2011, 90, 77–89. [Google Scholar] [CrossRef]
- Abernethy, D.R.; Greenblatt, D.J. Drug disposition in obese humans. Clin. Pharmacokinet. 1986, 11, 199–213. [Google Scholar] [CrossRef]
- Adams, J.; Murphy, P. Obesity in anaesthesia and intensive care. Br. J. Anaesth. 2000, 85, 91–108. [Google Scholar] [CrossRef]
- Cheymol, G. Clinical pharmacokinetics of drugs in obesity. Clin. Pharmacokinet. 1993, 25, 103–114. [Google Scholar] [CrossRef]
- Cheymol, G. Effects of obesity on pharmacokinetics. Clin. Pharmacokinet. 2000, 39, 215–231. [Google Scholar] [CrossRef] [PubMed]
- Kim, E.-G.; Park, H.J.; Kang, H.; Choi, J.; Lee, H.J. Antiemetic effect of propofol administered at the end of surgery in laparoscopic assisted vaginal hysterectomy. Korean J. Anesthesiol. 2014, 66, 210–215. [Google Scholar] [CrossRef] [PubMed]
- Gopalakrishnan, S.; Ganeshkumar, P. Systematic Reviews and Meta-analysis: Understanding the Best Evidence in Primary Healthcare. J. Family Med. Prim. Care 2013, 2, 9–14. [Google Scholar] [CrossRef] [PubMed]
- Shaikh, S.I.; Nagarekha, D.; Hegade, G.; Marutheesh, M. Postoperative nausea and vomiting: A simple yet complex problem. Anesth. Essays Res. 2016, 10, 388–396. [Google Scholar] [CrossRef]
- Jorgensen, E.A.; Knigge, U.; Warberg, J.; Kjaer, A. Histamine and the regulation of body weight. Neuroendocrinology 2007, 86, 210–214. [Google Scholar] [CrossRef] [PubMed]
- Boden, G.; Chen, X.; Mozzoli, M.; Ryan, I. Effect of fasting on serum leptin in normal human subjects. J. Clin. Endocrinol. Metab. 1996, 81, 3419–3423. [Google Scholar] [CrossRef]
- Moon, Y.E. Postoperative nausea and vomiting. Korean J. Anesthesiol. 2014, 67, 164–170. [Google Scholar] [CrossRef]
- Abercrombie, E.D.; Keefe, K.A.; DiFrischia, D.S.; Zigmond, M.J. Differential effect of stress on in vivo dopamine release in striatum, nucleus accumbens, and medial frontal cortex. J. Neurochem. 1989, 52, 1655–1658. [Google Scholar] [CrossRef]
- Volkow, N.D.; Wang, G.J.; Fowler, J.S.; Telang, F. Overlapping neuronal circuits in addiction and obesity: Evidence of systems pathology. Philos. Trans. R. Soc. Lond. Ser. B Biol. Sci. 2008, 363, 3191–3200. [Google Scholar] [CrossRef] [PubMed]
- Feinleib, J.; Kwan, L.H.; Yamani, A.; Davidson, A. Postoperative Nausea and Vomiting. UpToDate. 2018. Available online: https://www.uptodate.com/contents/postoperative-nausea-and-vomiting (accessed on 26 March 2020).
- Kranke, P.; Eberhart, L.H.; Toker, H.; Roewer, N.; Wulf, H.; Kiefer, P. A prospective evaluation of the POVOC score for the prediction of postoperative vomiting in children. Anesth. Analg. 2007, 105, 1592–1597. [Google Scholar] [CrossRef] [PubMed]
- Tramer, M.; Moore, A.; McQuay, H. Prevention of vomiting after paediatric strabismus surgery: A systematic review using the numbers-needed-to-treat method. Br. J. Anaesth. 1995, 75, 556–561. [Google Scholar] [CrossRef] [PubMed][Green Version]
- Ferrari, L.R.; Donlon, J.V. Metoclopramide reduces the incidence of vomiting after tonsillectomy in children. Anesth. Analg. 1992, 75, 351–354. [Google Scholar] [CrossRef]
- Villeret, I.; Laffon, M.; Duchalais, A.; Blond, M.H.; Lecuyer, A.I.; Mercier, C. Incidence of postoperative nausea and vomiting in paediatric ambulatory surgery. Paediatr. Anaesth. 2002, 12, 712–717. [Google Scholar] [CrossRef]
- Pocock, S.J.; Elbourne, D.R. Randomized trials or observational tribulations? N. Engl. J. Med. 2000, 342, 1907–1909. [Google Scholar] [CrossRef]
- Concato, J.; Shah, N.; Horwitz, R.I. Randomized, controlled trials, observational studies, and the hierarchy of research designs. N. Engl. J. Med. 2000, 342, 1887–1892. [Google Scholar] [CrossRef]
- Benson, K.; Hartz, A.J. A comparison of observational studies and randomized, controlled trials. N. Engl. J. Med. 2000, 342, 1878–1886. [Google Scholar] [CrossRef]
- Gum, P.A.; Thamilarasan, M.; Watanabe, J.; Blackstone, E.H.; Lauer, M.S. Aspirin use and all-cause mortality among patients being evaluated for known or suspected coronary artery disease: A propensity analysis. JAMA 2001, 286, 1187–1194. [Google Scholar] [CrossRef]
- Hainer, V.; Aldhoon-Hainerová, I. Obesity paradox does exist. Diabetes Care 2013, 36, S276–S281. [Google Scholar] [CrossRef]
- Nuttall, F.Q. Body Mass Index: Obesity, BMI, and Health: A Critical Review. Nutr. Today 2015, 50, 117–128. [Google Scholar] [CrossRef] [PubMed]


| PONV (+) n = 10,404 | PONV (−) n = 93,157 | p | ||
|---|---|---|---|---|
| Age (years, mean ± SD) | 50.7 ± 16.5 | 50.6 ± 17.1 | 0.538 | |
| Female (n, (%)) | 7561 (72.7) | 45,470 (48.8) | <0.0001 | |
| Height (cm, mean ± SD) | 160.5 ± 9.1 | 163.6 ± 9.4 | <0.0001 | |
| BMI (n, (%)) | <19.9 | 469 (4.5) | 3595 (3.9) | <0.0001 |
| 20–24.9 | 6250 (60.1) | 52,573 (56.4) | ||
| 25–29.9 | 3023 (29.1) | 29,972 (32.2) | ||
| ≤30 | 662 (6.4) | 7017 (7.5) | ||
| Operation time (h, mean ± SD) | 2.5 ± 1.5 | 2.1 ± 1.5 | <0.0001 | |
| ASA PS ≥ 3 (n, (%)) | 1540 (14.8) | 14,162 (15.2) | 0.280 | |
| N2O (n, (%)) | 1474 (14.2) | 16,357 (17.6) | <0.0001 | |
| PCA (n, (%)) | 7261 (69.8) | 40,869 (43.9) | <0.0001 | |
| DM (n, (%)) | 1184 (11.4) | 12,274 (13.2) | <0.0001 | |
| Smoking (n, (%)) | 899 (8.6) | 18,118 (19.4) | <0.0001 | |
| Opioids (n, (%)) | 9465 (91.0) | 81,974 (88.0) | <0.0001 | |
| Antiemetics (n, (%)) | 7563 (72.7) | 47,421 (50.9) | <0.0001 | |
| Neostigmine (n, (%)) | 3292 (31.6) | 23,380 (25.1) | <0.0001 | |
| PPI (n, (%)) | 709 (6.8) | 6599 (7.1) | 0.309 | |
| GERD (n, (%)) | 171 (1.6) | 1653 (1.8) | 0.336 | |
| Antibiotics (n, (%)) | 9150 (87.9) | 81,224 (87.2) | 0.028 | |
| Levin tube (n, (%)) | 227 (2.2) | 1743 (1.9) | 0.028 | |
| Laparoscopic surgery (n, (%)) | 3189 (30.7) | 21,657 (23.2) | <0.0001 | |
| Transfusion (n, (%)) | 455 (4.4) | 3425 (3.7) | <0.0001 |
| Unadjusted | Fully Adjusted | |||
|---|---|---|---|---|
| OR (95% CI) | p | OR (95% CI) | p | |
| Age | 1.00 (1.00–1.00) | 0.549 | 0.99 (0.99–1.00) | <0.0001 |
| Female | 2.79 (2.67–2.92) | <0.0001 | 2.21 (2.06–2.36) | <0.0001 |
| Height | 0.97 (0.96–0.97) | <0.0001 | 1.00 (0.99–1.00) | 0.039 |
| Operation time | 1.14 (1.12–1.15) | <0.0001 | 1.06 (1.04–1.07) | <0.0001 |
| ASA PS 3–5 vs. 1–2 | 0.97 (0.92–1.03) | 0.280 | 0.88 (0.83–0.95) | <0.0001 |
| N2O | 0.78 (0.73–0.82) | <0.0001 | 0.81 (0.76–0.87) | <0.0001 |
| PCA | 2.96 (2.83–3.09) | <0.0001 | 2.21 (2.05–2.39) | <0.0001 |
| Diabetes | 0.85 (0.79–0.90) | <0.0001 | 0.93 (0.87–1.00) | 0.049 |
| Smoking | 0.39 (0.37–0.42) | <0.0001 | 0.61 (0.56–0.65) | <0.0001 |
| Opioids | 1.38 (1.28–1.48) | <0.0001 | 1.10 (1.01–1.20) | 0.025 |
| Antiemetics | 2.57 (2.46–2.69) | <0.0001 | 1.47 (1.36–1.60) | <0.0001 |
| Neostigmine | 1.38 (1.32–1.44) | <0.0001 | 1.40 (1.33–1.47) | <0.0001 |
| Proton-pump inhibitor | 0.96 (0.89–1.04) | 0.310 | 0.84 (0.77–0. 92) | <0.0001 |
| GERD | 0.93 (0.79–1.08) | 0.336 | 1.14 (0.97–1.34) | 0.115 |
| Antibiotics | 1.07 (1.01–1.14) | 0.028 | 0.88 (0.83–0.95) | 0.001 |
| Levin tube | 1.17 (1.02–1.35) | 0.028 | 0.80 (0.70–0.93) | 0.003 |
| Laparoscopic surgery | 1.46 (1.40–1.53) | <0.0001 | 1.17 (1.12–1.23) | <0.0001 |
| Transfusion | 1.20 (1.08–1.32) | <0.0001 | 0.85 (0.77–0.94) | 0.002 |
| Underweight vs. normal BMI | 1.10 (0.99–1.21) | 0.068 | 1.05 (0.94–1.16) | 0.406 |
| Overweight vs. normal BMI | 0.85 (0.81–0.89) | <0.0001 | 0.91 (0.87–0.96) | <0.0001 |
| Obese vs. normal BMI | 0.79 (0.73–0.86) | <0.0001 | 0.77 (0.71–0.84) | <0.0001 |
| Before PSM | After PSM | |||||||
|---|---|---|---|---|---|---|---|---|
| Normal (n = 58,823) | UW (n = 4064) | D | p | Normal (n = 4064) | UW (n = 4064) | D | p | |
| Age | 50.3 (17.4) | 49.8 (21.9) | 0.02 | 0.147 | 50.1 (18.4) | 49.8 (21.9) | 0.01 | 0.598 |
| Height | 163.1 (9.0) | 162.5 (8.8) | 0.07 | <0.0001 | 162.3 (8.8) | 162.5 (8.8) | 0.01 | 0.535 |
| Female | 31,555 (53.6) | 2498 (61.5) | 0.18 | <0.0001 | 2501 (61.5) | 2498 (61.5) | 0.03 | 0.945 |
| Operation time | 2.1 (1.5) | 2.1 (1.4) | 0.01 | 0.630 | 2.1(1.4) | 2.1 (1.4) | 0.04 | 0.108 |
| ASA PS ≥ 3 | 8735 (14.8) | 953 (23.4) | 0.31 | <0.0001 | 983 (24.2) | 953 (23.4) | 0.02 | 0.435 |
| N2O | 10,127 (17.2) | 699 (17.2) | <0.01 | 0.797 | 749 (18.4) | 699 (17.2) | 0.05 | 0.147 |
| PCA | 27,337 (46.5) | 2002 (49.3) | 0.06 | 0.001 | 1942 (48.2) | 2002 (49.3) | 0.02 | 0.340 |
| Diabetes | 6567 (11.2) | 417 (10.3) | 0.05 | 0.076 | 423 (10.4) | 417 (10.3) | 0.01 | 0.827 |
| Smoking | 10,500(17.9) | 781 (19.2) | 0.05 | 0.028 | 796 (19.6) | 781 (19.2) | 0.03 | 0.293 |
| Opioids | 51,867 (88.2) | 3521 (86.6) | 0.08 | 0.003 | 3480 (85.6) | 3521 (86.6) | 0.05 | 0.188 |
| Antiemetics | 31,178 (53.0) | 2288 (56.3) | 0.07 | <0.0001 | 2272 (55.9) | 2288 (56.3) | 0.01 | 0.721 |
| Neostigmine | 15,374 (26.1) | 1059 (26.1) | <0.01 | 0.913 | 1023 (25.2) | 1059 (26.1) | 0.03 | 0.360 |
| PPI | 4268 (7.3) | 406 (10.0) | 0.19 | <0.0001 | 442 (10.9) | 406 (10.0) | 0.05 | 0.191 |
| GERD | 975 (1.7) | 63 (1.6) | 0.04 | 0.604 | 65 (1.6) | 63 (1.6) | 0.02 | 0.859 |
| Antibiotics | 51,372 (87.3) | 3533 (86.9) | 0.02 | 0.460 | 3527 (86.8) | 3533 (86.9) | 0.01 | 0.844 |
| Levin tube | 1184 (2.0) | 112 (2.8) | 0.18 | 0.001 | 99 (2.4) | 112 (2.8) | 0.07 | 0.365 |
| Laparoscopic surgery | 14,692 (25.0) | 990 (24.4) | 0.02 | 0.380 | 986 (24.3) | 990 (24.4) | <0.01 | 0.918 |
| Transfusion | 2380 (4.0) | 327 (8.0) | 0.40 | <0.0001 | 291 (7.2) | 327 (8.0) | 0.07 | 0.132 |
| Before PSM | After PSM | |||||||
|---|---|---|---|---|---|---|---|---|
| Normal (n = 58,823) | OW (n = 32,995) | D | p | Normal (n = 9872) | OW (n = 9872) | D | p | |
| Age | 50.3 (17.4) | 52.1 (15.7) | 0.11 | <0.0001 | 51.0 (17.1) | 50.6 (15.5) | 0.02 | 0.159 |
| Height | 163.1 (9.0) | 163.6 (9.8) | 0.05 | <0.0001 | 163.5 (9.6) | 163.4 (10.1) | 0.01 | 0.512 |
| Female | 31,555 (53.6) | 14,862 (45.0) | 0.19 | <0.0001 | 4806 (48.7) | 4939 (50.0) | 0.03 | 0.058 |
| Operation time | 2.1 (1.5) | 2.2 (1.5) | 0.04 | <0.0001 | 2.1 (1.4) | 2.1 (1.4) | 0.01 | 0.554 |
| ASA PS ≥ 3 | 8735 (14.8) | 4847 (14.7) | 0.01 | 0.514 | 1419 (14.4) | 1370 (13.9) | 0.02 | 0.317 |
| N2O | 10,127 (17.2) | 5739 (17.4) | 0.01 | 0.797 | 1801 (18.2) | 1728 (17.5) | 0.03 | 0.175 |
| PCA | 27,337 (46.5) | 15,281 (46.3) | <0.01 | 0.001 | 4512 (45.7) | 4491 (45.5) | <0.01 | 0.764 |
| Diabetes | 6567 (11.2) | 5049 (15.3) | 0.20 | <0.0001 | 889 (9.0) | 998 (10.1) | 0.07 | 0.008 |
| Smoking | 10,500 (17.9) | 6243 (18.9) | 0.04 | <0.0001 | 1965 (19.9) | 1865 (18.9) | 0.04 | 0.072 |
| Opioids | 51,867 (88.2) | 29,277 (88.7) | 0.03 | 0.012 | 8776 (88.9) | 8772 (88.9) | <0.01 | 0.928 |
| Antiemetics | 31,178 (53.0) | 17,474 (53.0) | <0.01 | 0.899 | 17,525 (53.1) | 17,474 (53.0) | 0.02 | 0.332 |
| Neostigmine | 15,374 (26.1) | 8411 (25.5) | 0.02 | 0.033 | 2693 (25.2) | 2585 (25.5) | 0.04 | 0.082 |
| PPI | 4268 (7.3) | 2215 (6.7) | 0.05 | 0.002 | 667 (6.8) | 182 (6.9) | 0.01 | 0.672 |
| GERD | 975 (1.7) | 655 (2.0) | 0.10 | <0.0001 | 165 (1.9) | 149 (2.0) | 0.06 | 0.363 |
| Antibiotics | 51,372 (87.3) | 28,781 (86.9) | 0.01 | 0.647 | 8647 (87.6) | 8632 (86.9) | 0.01 | 0.747 |
| Levin tube | 1184 (2.0) | 579 (1.8) | 0.08 | 0.006 | 175 (1.8) | 146 (1.5) | 0.10 | 0.103 |
| Laparoscopic surgery | 14,692 (25.0) | 7446 (22.6) | 0.07 | <0.0001 | 2180 (22.1) | 2277 (23.1) | 0.03 | 0.099 |
| Transfusion | 2380 (4.0) | 915 (2.8) | 0.22 | <0.0001 | 232 (2.4) | 184 (1.9) | 0.13 | 0.230 |
| Before PSM | After PSM | |||||||
|---|---|---|---|---|---|---|---|---|
| Normal (n = 58,823) | Obese (n = 7679) | D | p | Normal (n = 7679) | Obese (n = 7679) | D | p | |
| Age | 50.3 (17.4) | 46.4 (16.1) | 0.02 | 0.147 | 46.5 (16.8) | 46.4 (16.1) | 0.01 | 0.670 |
| Height | 163.1 (9.0) | 163.7 (10.4) | 0.06 | <0.0001 | 163.5 (9.0) | 163.7 (10.4) | 0.01 | 0.598 |
| Female | 31,555 (53.6) | 4119 (53.6) | 0.02 | 0.994 | 4114 (53.6) | 4119 (53.6) | <0.01 | 0.936 |
| Operation time | 2.1 (1.5) | 2.2 (1.5) | 0.04 | <0.0001 | 2.1 (1.4) | 2.2 (1.5) | <0.01 | 0.988 |
| ASA PS ≥ 3 | 8735 (14.8) | 1167 (15.2) | 0.31 | 0.421 | 1188 (15.5) | 1167 (15.2) | 0.01 | 0.638 |
| N2O | 10,127 (17.2) | 1266 (16.5) | 0.03 | 0.111 | 1301 (16.9) | 1266 (16.5) | 0.02 | 0.449 |
| PCA | 27,337 (46.5) | 3510 (45.7) | 0.02 | 0.207 | 3562 (46.4) | 3510 (45.7) | 0.02 | 0.400 |
| Diabetes | 6567 (11.2) | 1425 (18.6) | 0.33 | <0.0001 | 1422 (18.5) | 1425 (18.6) | <0.01 | 0.950 |
| Smoking | 10,500 (17.9) | 1493 (19.4) | 0.06 | 0.001 | 1485 (19.3) | 1493 (19.4) | <0.01 | 0.870 |
| Opioids | 51,867 (88.2) | 6774 (88.2) | <0.01 | 0.919 | 6775 (85.6) | 6774 (88.2) | <0.01 | 0.980 |
| Antiemetics | 31,178 (53.0) | 4044 (52.7) | 0.01 | 0.575 | 4110 (53.5) | 4044 (52.7) | 0.02 | 0.286 |
| Neostigmine | 15,374 (26.1) | 1828 (23.8) | 0.07 | <0.0001 | 1784 (25.2) | 1828 (23.8) | 0.02 | 0.403 |
| PPI | 4268 (7.3) | 419 (5.5) | 0.17 | <0.0001 | 442 (10.9) | 419 (5.5) | <0.01 | 0.943 |
| GERD | 975 (1.7) | 131 (1.7) | 0.02 | 0.755 | 144 (1.9) | 131 (1.7) | 0.05 | 0.429 |
| Antibiotics | 51,372 (87.3) | 6688 (87.1) | 0.01 | 0.555 | 6659 (86.7) | 6688 (87.1) | 0.02 | 0.488 |
| Levin tube | 1184 (2.0) | 95 (1.2) | 0.27 | <0.0001 | 97 (1.3) | 95 (1.2) | 0.01 | 0.885 |
| Laparoscopic surgery | 14,692 (25.0) | 1718 (22.4) | 0.08 | <0.0001 | 1709 (22.3) | 1718 (22.4) | <0.01 | 0.862 |
| Transfusion | 2380 (4.0) | 258 (3.4) | 0.11 | 0.004 | 253 (3.3) | 258 (3.4) | 0.01 | 0.822 |
© 2020 by the authors. Licensee MDPI, Basel, Switzerland. This article is an open access article distributed under the terms and conditions of the Creative Commons Attribution (CC BY) license (http://creativecommons.org/licenses/by/4.0/).
Share and Cite
Kim, J.H.; Hong, M.; Kim, Y.J.; Lee, H.S.; Kwon, Y.S.; Lee, J.J. Effect of Body Mass Index on Postoperative Nausea and Vomiting: Propensity Analysis. J. Clin. Med. 2020, 9, 1612. https://doi.org/10.3390/jcm9061612
Kim JH, Hong M, Kim YJ, Lee HS, Kwon YS, Lee JJ. Effect of Body Mass Index on Postoperative Nausea and Vomiting: Propensity Analysis. Journal of Clinical Medicine. 2020; 9(6):1612. https://doi.org/10.3390/jcm9061612
Chicago/Turabian StyleKim, Jong Ho, Mingi Hong, Young Joon Kim, Ho Seok Lee, Young Suk Kwon, and Jae Jun Lee. 2020. "Effect of Body Mass Index on Postoperative Nausea and Vomiting: Propensity Analysis" Journal of Clinical Medicine 9, no. 6: 1612. https://doi.org/10.3390/jcm9061612
APA StyleKim, J. H., Hong, M., Kim, Y. J., Lee, H. S., Kwon, Y. S., & Lee, J. J. (2020). Effect of Body Mass Index on Postoperative Nausea and Vomiting: Propensity Analysis. Journal of Clinical Medicine, 9(6), 1612. https://doi.org/10.3390/jcm9061612