Article

Dermatopontin, A Novel Adipokine Promoting Adipose Tissue Extracellular Matrix Remodelling and Inflammation in Obesity †

by
Xabier Unamuno
1,2,
Javier Gómez-Ambrosi
1,2,3,
Beatriz Ramírez
1,2,3,
Amaia Rodríguez
1,2,3,
Sara Becerril
1,2,3,
Víctor Valentí
2,3,4,
Rafael Moncada
2,3,5,
Camilo Silva
2,6,
Javier Salvador
2,6,
Gema Frühbeck
1,2,3,6,* and
Victoria Catalán
1,2,3,*
1
Metabolic Research Laboratory, Clínica Universidad de Navarra, 31008 Pamplona, Spain
2
CIBER Fisiopatología de la Obesidad y Nutrición (CIBEROBN), Instituto de Salud Carlos III, 31008 Pamplona, Spain
3
Obesity and Adipobiology Group. Instituto de Investigación Sanitaria de Navarra (IdiSNA), 31008 Pamplona, Spain
4
Department of Surgery, Clínica Universidad de Navarra, 31008 Pamplona, Spain
5
Department of Anesthesia, Clínica Universidad de Navarra, 31008 Pamplona, Spain
6
Department of Endocrinology & Nutrition, Clínica Universidad de Navarra, 31008 Pamplona, Spain
*
Authors to whom correspondence should be addressed.
Role of dermatopontin in adipose tissue inflammation and fibrosis.
J. Clin. Med. 2020, 9(4), 1069; https://doi.org/10.3390/jcm9041069
Submission received: 10 March 2020 / Revised: 27 March 2020 / Accepted: 7 April 2020 / Published: 9 April 2020
(This article belongs to the Section Endocrinology & Metabolism)

Abstract

:
Compelling evidence suggests that dermatopontin (DPT) regulates collagen and fibronectin fibril formation, the induction of cell adhesion and the prompting of wound healing. We aimed to evaluate the role of DPT on obesity and its associated metabolic alterations as well as its impact in visceral adipose tissue (VAT) inflammation and extracellular matrix (ECM) remodelling. Samples obtained from 54 subjects were used in a case-control study. Circulating and VAT expression levels of DPT as well as key ECM remodelling- and inflammation-related genes were analysed. The effect of pro- and anti-inflammatory mediators on the transcript levels of DPT in visceral adipocytes was explored. The impact of DPT on ECM remodelling and inflammation pathways was also evaluated in cultured adipocytes. We show that obesity and obesity-associated type 2 diabetes (T2D) increased (p < 0.05) circulating levels of DPT. In this line, DPT mRNA in VAT was increased (p < 0.05) in obese patients with and without T2D. Gene expression levels of DPT were enhanced (p < 0.05) in human visceral adipocytes after the treatment with lipopolysaccharide, tumour growth factor (TGF)-β and palmitic acid, whereas a downregulation (p < 0.05) was detected after the stimulation with interleukin (IL)-4 and IL-13, critical cytokines mediating anti-inflammatory pathways. Additionally, we revealed that DPT increased (p < 0.05) the expression of ECM- (COL6A3, ELN, MMP9, TNMD) and inflammation-related factors (IL6, IL8, TNF) in human visceral adipocytes. These findings provide, for the first time, evidence of a novel role of DPT in obesity and its associated comorbidities by influencing AT remodelling and inflammation.

Graphical Abstract

1. Introduction

During obesity, stiff matrix components are deposited in the adipose tissue (AT) extracellular matrix (ECM) modifying tissue biomechanics and tensile properties from its microenvironment. These abnormalities in the ECM structure disrupt the AT homeostasis promoting fibrosis, and hence, a reduction in the degree of plasticity of the ECM preventing AT from expanding in a healthy manner and leading to adverse metabolic consequences [1,2]. Moreover, obesity-associated low-grade chronic inflammation has been also proposed as a crucial promoter of changes in the ECM remodelling and composition of the AT [1]. Therefore, the study of molecules that can modulate the ECM is of significant interest, especially during obesity. Our group previously showed differentially-expressed genes involved in the immune function and inflammation pathways as well as in angiogenesis in the omental AT from patients with obesity obtained from microarray data [3]. Among these factors, we found an upregulation of dermatopontin (DPT), a 22-kDa protein with multiple physiological properties including collagen and fibronectin fibril formation, the induction of cell adhesion and the prompting of wound healing [4,5,6].
DPT, also known as tyrosine rich acidic matrix protein (TRAMP), is a noncollagenous protein of the ECM firstly discovered in the dermis [7]. DPT is clearly detected in several organs but the skin is considered to be the richest source. The relative richness of DPT (approximately 12–15 mg per kilogram of wet dermis weight) in the ECM suggests essential biological roles for this molecule [8,9]. DPT increases collagen fibrillogenesis but also reduces the collagen fibril thickness, the same as many other ECM molecules including decorin, lumican and fibromodulin [8]. Studies performed in Dpt-knockout mice also highlight the relevance of DPT in the regulation of ECM structure and fibrosis [10,11]. Dpt-null mice exhibited an Ehlers-Danlos syndrome phenotype characterised by fragile and elastic skin, a reduction in the accumulation of collagen in the ECM and an abnormal arrangement of collagen microfibrils [5,11,12]. Although no significant differences in anthropometric and metabolic characteristics were found in Dpt−/− mice compared with their wild type counterparts, Dpt deficiency protected the liver from chemically- and oxidative stress-induced fibrosis, inhibiting collagen deposition [10,11]. In this line, DPT expression has been shown to be upregulated in the liver of patients with nonalcoholic steatohepatitis (NASH) and fibrosis with its expression decreasing after gastric bypass in parallel with the reduction of the fibrosis stage [10].
The ECM not only provides a mechanical support for the great variety of cells that constitute the AT but also regulates physiological processes through a variety of signalling pathways [13,14]. In this sense, known functions of DPT include the binding to the cell surface receptor integrin α3β1 and syndecan-1 as well as the interaction and modulation of the activity of transforming growth factor (TGF)-β, decorin and fibronectin [15]. Considering the functional characteristics of TGF-β, DPT has been described to enhance its biological activity [16]. Reportedly, DPT is a potent cell adhesion molecule in diverse cell types including keratinocytes, fibroblasts and endothelial cells [17,18]. DPT has also been involved in inhibiting cell proliferation such as in murine C2C12 myoblasts, keratinocytes, osteosarcoma MG-63 cells or papillary thyroid cancer cells [4,19]. Moreover, DPT has been found in wound fluids as well as in the provisional matrix, a term to describe factors that appear coincident with epidermal cell migration during skin wound healing [4]. Taken together, these results suggest that DPT mediates communication between the ECM environments being directly involved in the wound healing process.
Although compelling evidence suggests that DPT regulates collagen fibrillogenesis, the role of DPT in regulating ECM remodelling and inflammation in VAT in a context of obesity remains unknown. Owing to the multiple roles of DPT during wound healing and ECM reassembly, we hypothesised a regulatory role of DPT in ECM remodelling and inflammation in human visceral adipocytes. Therefore, we first analysed whether obesity and its associated pathologies T2D and nonalcoholic fatty liver disease (NAFLD) influence the expression levels of DPT. In addition, the regulation of DPT by different inflammatory mediators was further explored in human visceral adipocytes.

2. Materials and Methods

2.1. Patient Selection

Blood and tissue samples were obtained from 54 volunteers attending the Departments of Endocrinology & Nutrition and Surgery at the Clínica Universidad de Navarra. Clinical assessment including medical history and physical examination as well as the evaluation of comorbidities and body composition analysis were performed by a multidisciplinary team. Body mass index (BMI) was calculated as weight in kilograms divided by the square of height in meters and total body fat (BF) was estimated by air-displacement-plethysmography (Bod-Pod®, Life Measurements, Concord, CA, USA). Normal-weight was defined as a BMI ≤ 25 kg/m2 and obesity as a BMI ≥ 30 kg/m2. The waist-to-hip ratio (WHR) was determined as the quotient between the circumference of the waist (at the midway level between the lowest palpable rib and the iliac crest) and the hip (around the widest portion of the trochanters). Patients with obesity were further subclassified into two groups (normoglycaemia (NG) or T2D) according to the criteria of the Expert Committee on the Diagnosis and Classification of Diabetes [20]. Patients with severe systemic disease not related to obesity, infectious/inflammatory diseases, cancer, liver disease or severe nephropathy, pharmacological treatments, pregnancy or lactation as well as patients with serious eating disorders and people whose freedom is under legal or administrative requirement were excluded. The study was approved, from an ethical and scientific standpoint, by the Clínica Universidad de Navarra’s Ethical Committee responsible for research (approval number 2017.126) and the written informed consent of participants was obtained.
Visceral adipose tissue (VAT) samples were collected from patients undergoing either Nissen fundoplication (for hiatus hernia repair in normal-weight volunteers) or Roux-en-Y gastric bypass (RYGB) (for the treatment of morbid obesity in obese volunteers) at the Clínica Universidad de Navarra. Additionally, a liver biopsy was obtained from the patients with obesity during the bariatric surgery to establish a histological diagnosis of the hepatic state as well as for the study of gene expression. Since this procedure is not clinically justified in lean subjects, liver samples were only obtained from patients with obesity. The diagnosis of NAFLD was established following the criteria of Kleiner and Brunt by an expert pathologist masked to all the results of the assays [21]. VAT and liver samples were immediately frozen in liquid nitrogen and stored at −80 °C for subsequent analyses.

2.2. Analytical Measurements

Blood samples were drawn after an overnight fasting. Glucose was analysed by an automated analyser (Hitachi Modular P800, Roche, Basel, Switzerland) and insulin was determined by an enzyme-amplified chemiluminescence assay (IMMULITE®, Diagnostic Products Corp., Los Angeles, CA, USA) with intra- and interassay coefficients of variation of 4.2% and 5.7%, respectively. The HOMA and QUICKI indices were calculated to examine insulin resistance and sensitivity, respectively. Lipid profile (triglycerides, total cholesterol, high-density lipoprotein cholesterol (HDL) and low-density lipoprotein cholesterol (LDL)) was evaluated as previously described [22,23]. Hepatic enzymes were measured by enzymatic tests in an automated analyser (Roche/Hitachi Modular P800) and the AST/ALT ratio was calculated as an indirect indicator of fatty liver disease [24]. The concentrations of the inflammatory markers fibrinogen, high-sensitivity C-reactive protein (CRP), homocysteine and von Willebrand factor antigen (vWF) were analysed as previously reported [22,23]. A double-antibody RIA method (Linco Research, Inc., St. Charles, MO) was used to determine leptin concentrations. The intra- and interassay coefficients of variation were 5.0% and 4.5%, respectively [25]. DPT levels were determined by a commercially available ELISA kit (Cusabio, Wuhan, China) with intra- and interassay coefficients of variation being 8% and 10%, respectively.

2.3. RNA Isolation and Real-Time PCR

Tissue samples were homogenised with an Ultra-Turrax® T25 basic (IKA® Werke Gmbh, Staugen, Germany) and RNA isolation was performed using QIAzol® Reagent (Qiagen, Hilden, Germany) for VAT and adipocytes and TRIzol® Reagent (Invitrogen, Carlsbad, CA, USA) for liver biopsies. The RNeasy Mini Lipid Kit (Qiagen) in VAT and adipocytes and the RNeasy Mini kit (Qiagen) in liver biopsies were used for RNA purification. All samples were treated with DNase I (RNase Free DNase set, Qiagen). RNA (2 μg) were reverse transcribed to cDNA according to standard procedures [26]. The mRNA levels for adiponectin (ADIPOQ), collagen (COL)-1A1, COL6A3, decorin (DCN), elastin (ELN), IL1B, IL6, IL8, IL18, kruppel-like factor 4 (KLF4), matrix metalloproteinase (MMP)-2, MMP9, TGFB1, tumour necrosis factor-α (TNF) and tenomodulin (TNMD) were quantified by Real-Time PCR (7300 Real Time PCR System, Applied Biosystems, Foster City, CA, USA) as previously described [26]. Primers and probes (Merck, Darmstadt, Germany) were designed using the software Primer Express 2.0 (Applied Biosystems, Foster City, CA, USA) (Supplementary Table S1). The cDNA was amplified as previously described [26]. The endogenous control gene 18S rRNA (Applied Biosystems) was the endogenous control for Real-Time PCR experiments and a relative quantification was obtained using the ΔΔCt formula. Relative gene expression was expressed as fold expression over the calibrator sample (average of gene expression corresponding to the normal-weight group or unstimulated adipocytes) [26]. Triplicates and positive and negative controls were included in all reactions.

2.4. Human Adipocyte Culture and Treatment

Human stromovascular fraction cells (SVFC) were isolated from VAT from patients with obesity as previously reported [27]. SVFC were seeded at 2 × 10⁵ cells/well and grown in adipocyte medium supplemented with 10% newborn calf serum (NCS). After 4 days, the medium was changed to adipocyte medium supplemented with 3% NCS, 0.5 mmol/L 3-isobutyl-1-methylxanthine (IBMX), 0.1 µmol/L dexamethasone, 1 µmol/L BRL49653 and 10 µg/mL insulin. Differentiated adipocytes (10th day of differentiation) were serum-starved for 24 h and then incubated with increasing concentrations of DPT (1, 10 and 100 ng/mL) (R & D systems, Minneapolis, MN), IL-4 (10, 100 and 1000 ng/mL) (R & D systems), IL-13 (10, 100 and 1000 ng/mL) (R & D systems), LPS (10, 100 and 1000 ng/mL) (Sigma), palmitic acid (100 and 200 nmol/L) (Sigma), TNF-α (1, 10 and 100 ng/mL) (Sigma) and TGF-β (1, 10 and 20 ng/mL) (R & D systems) for 24 h.

2.5. Statistical Analysis

Data are presented as mean ± standard error of the mean (SEM). Due to their nonparametric distribution, gene expression levels and C-reactive protein concentrations were logarithmically transformed. The other variables followed a normal distribution that was suitable for the application of parametric tests. Differences between groups were assessed by one-way ANOVA followed by Tukey’s or Dunnet’s post hoc tests as appropriate. Statistical analysis comparing gene expression levels of DPT and TGFB in liver as well as in VAT from patients with obesity classified according to suffering or not NAFLD was performed by two-tailed unpaired Student’s t tests. The relation between variables was evaluated by simple correlation (Pearson’s correlation coefficients (r)). Statistical analysis was performed using the SPSS version 15.0 statistical package (SPSS, Chicago, IL, USA). Levels of statistical significance were set at p value < 0.05.

3. Results

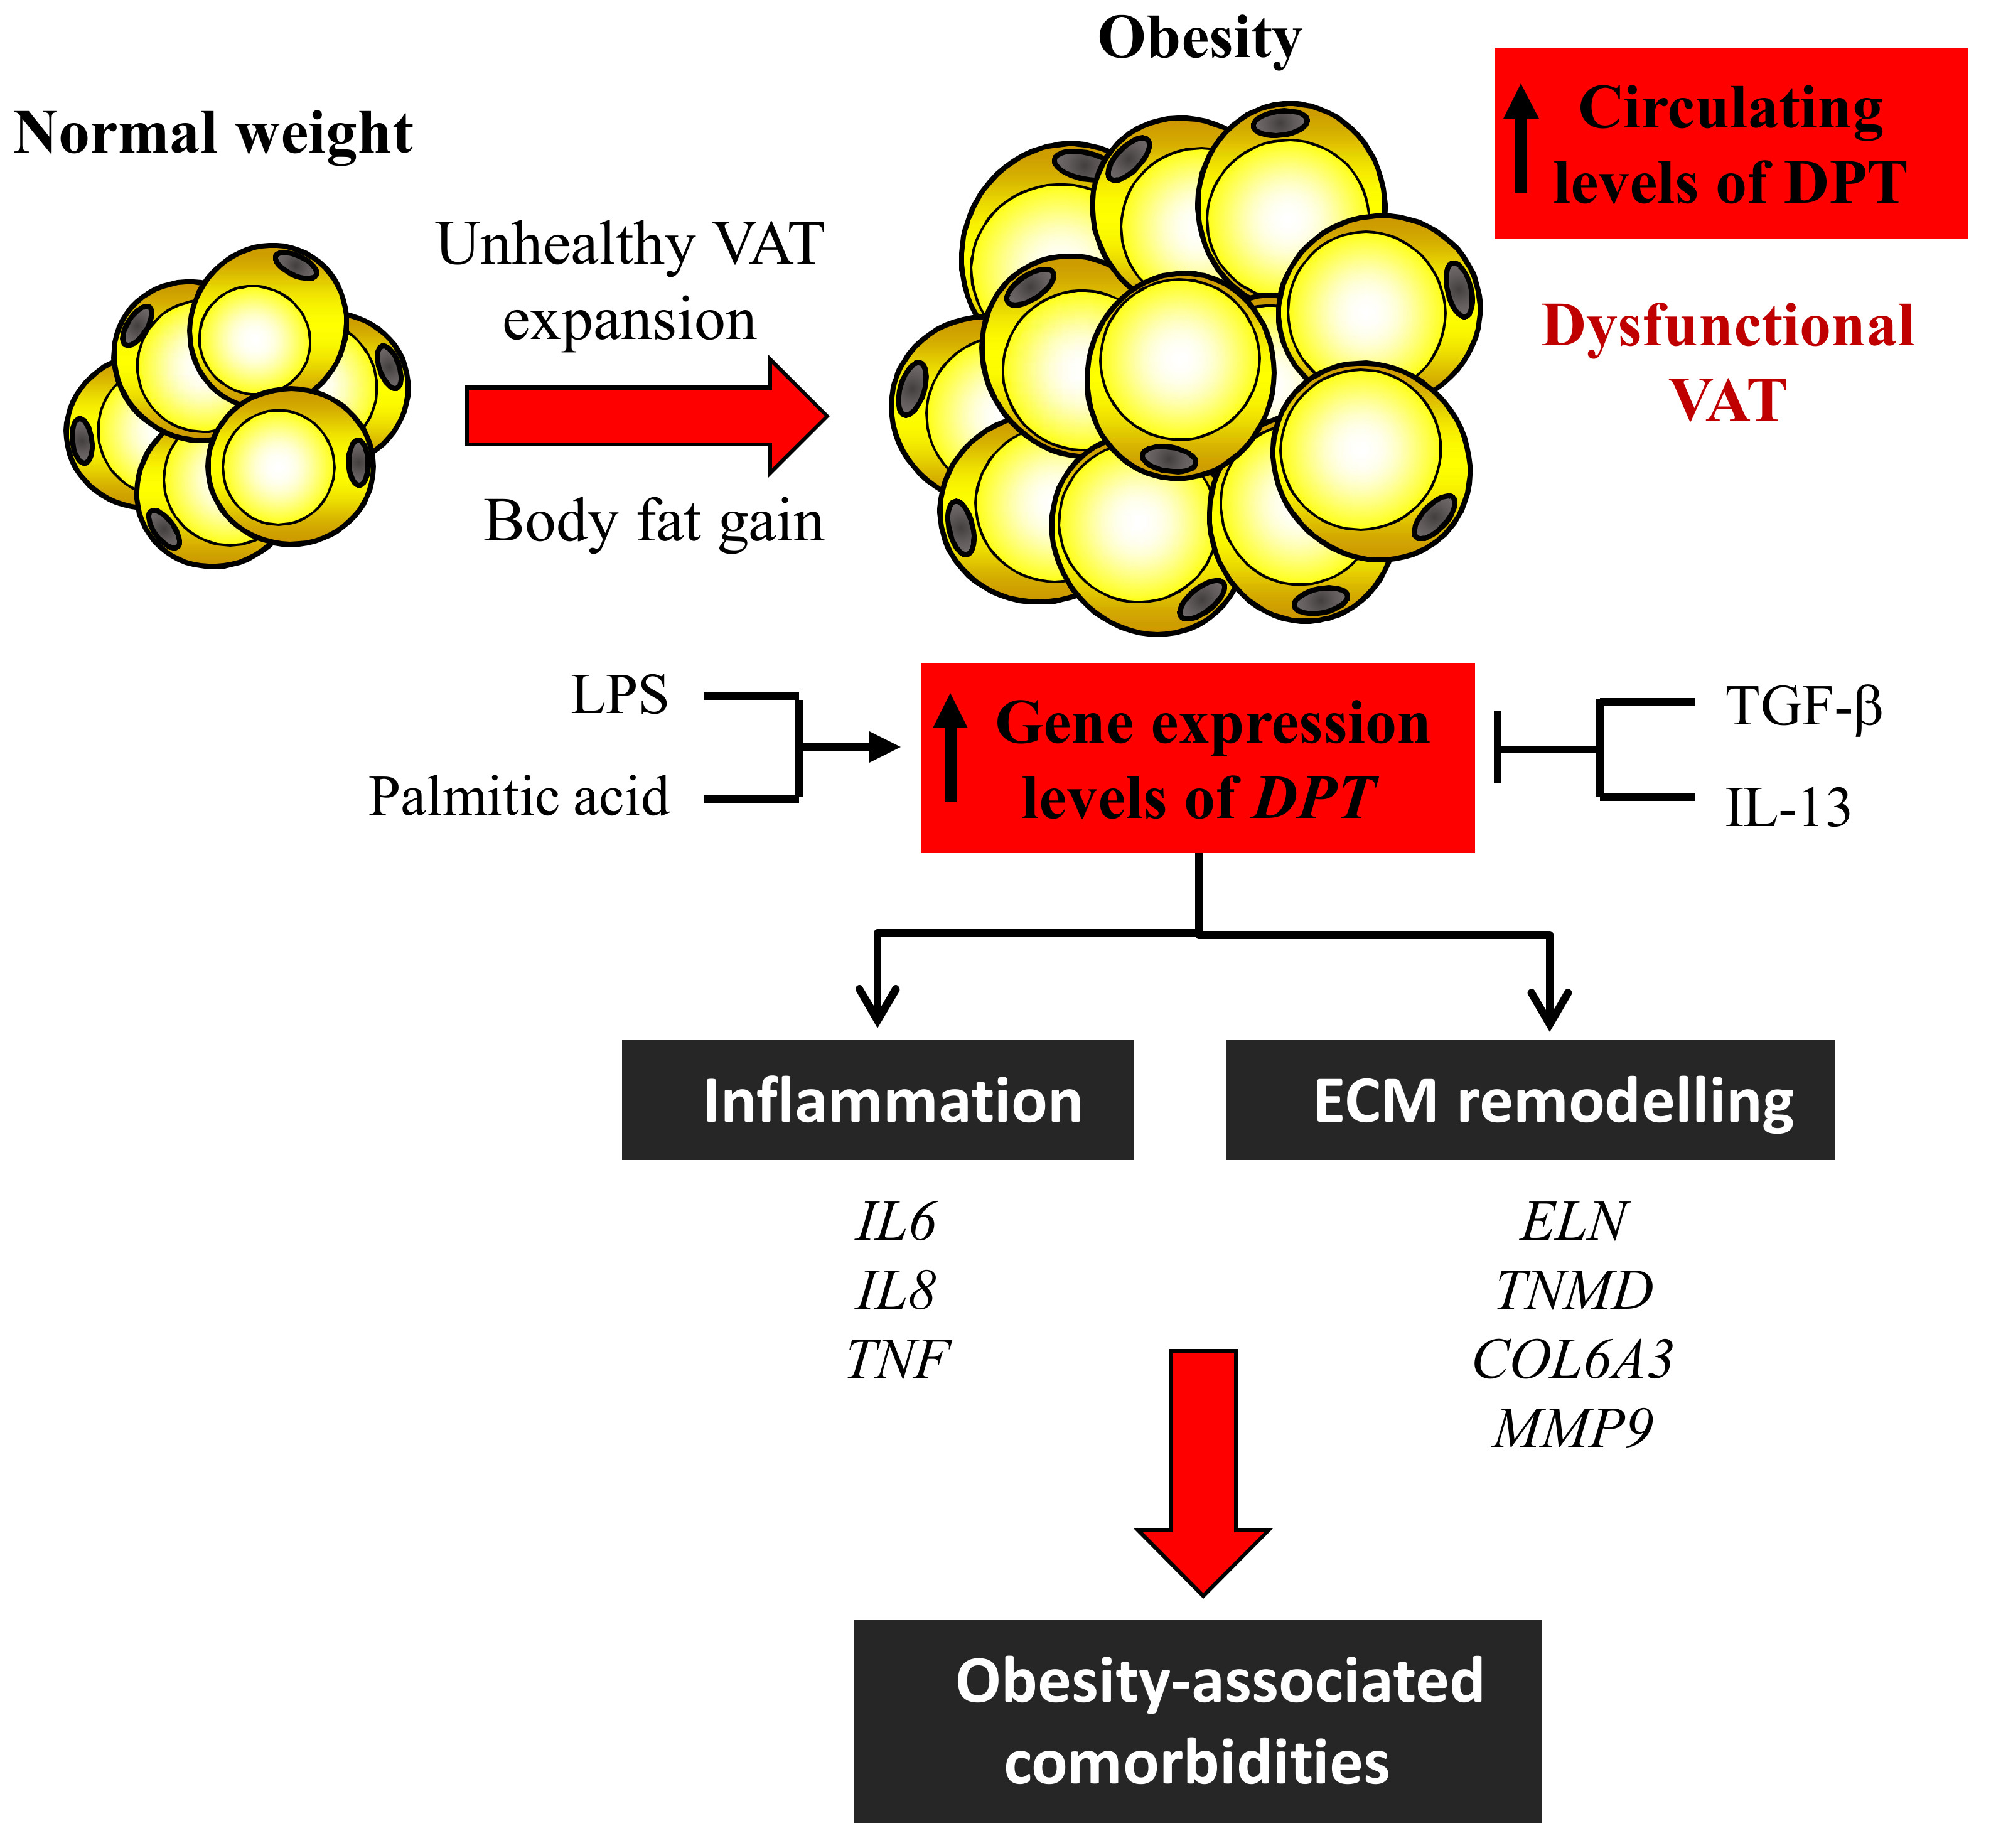
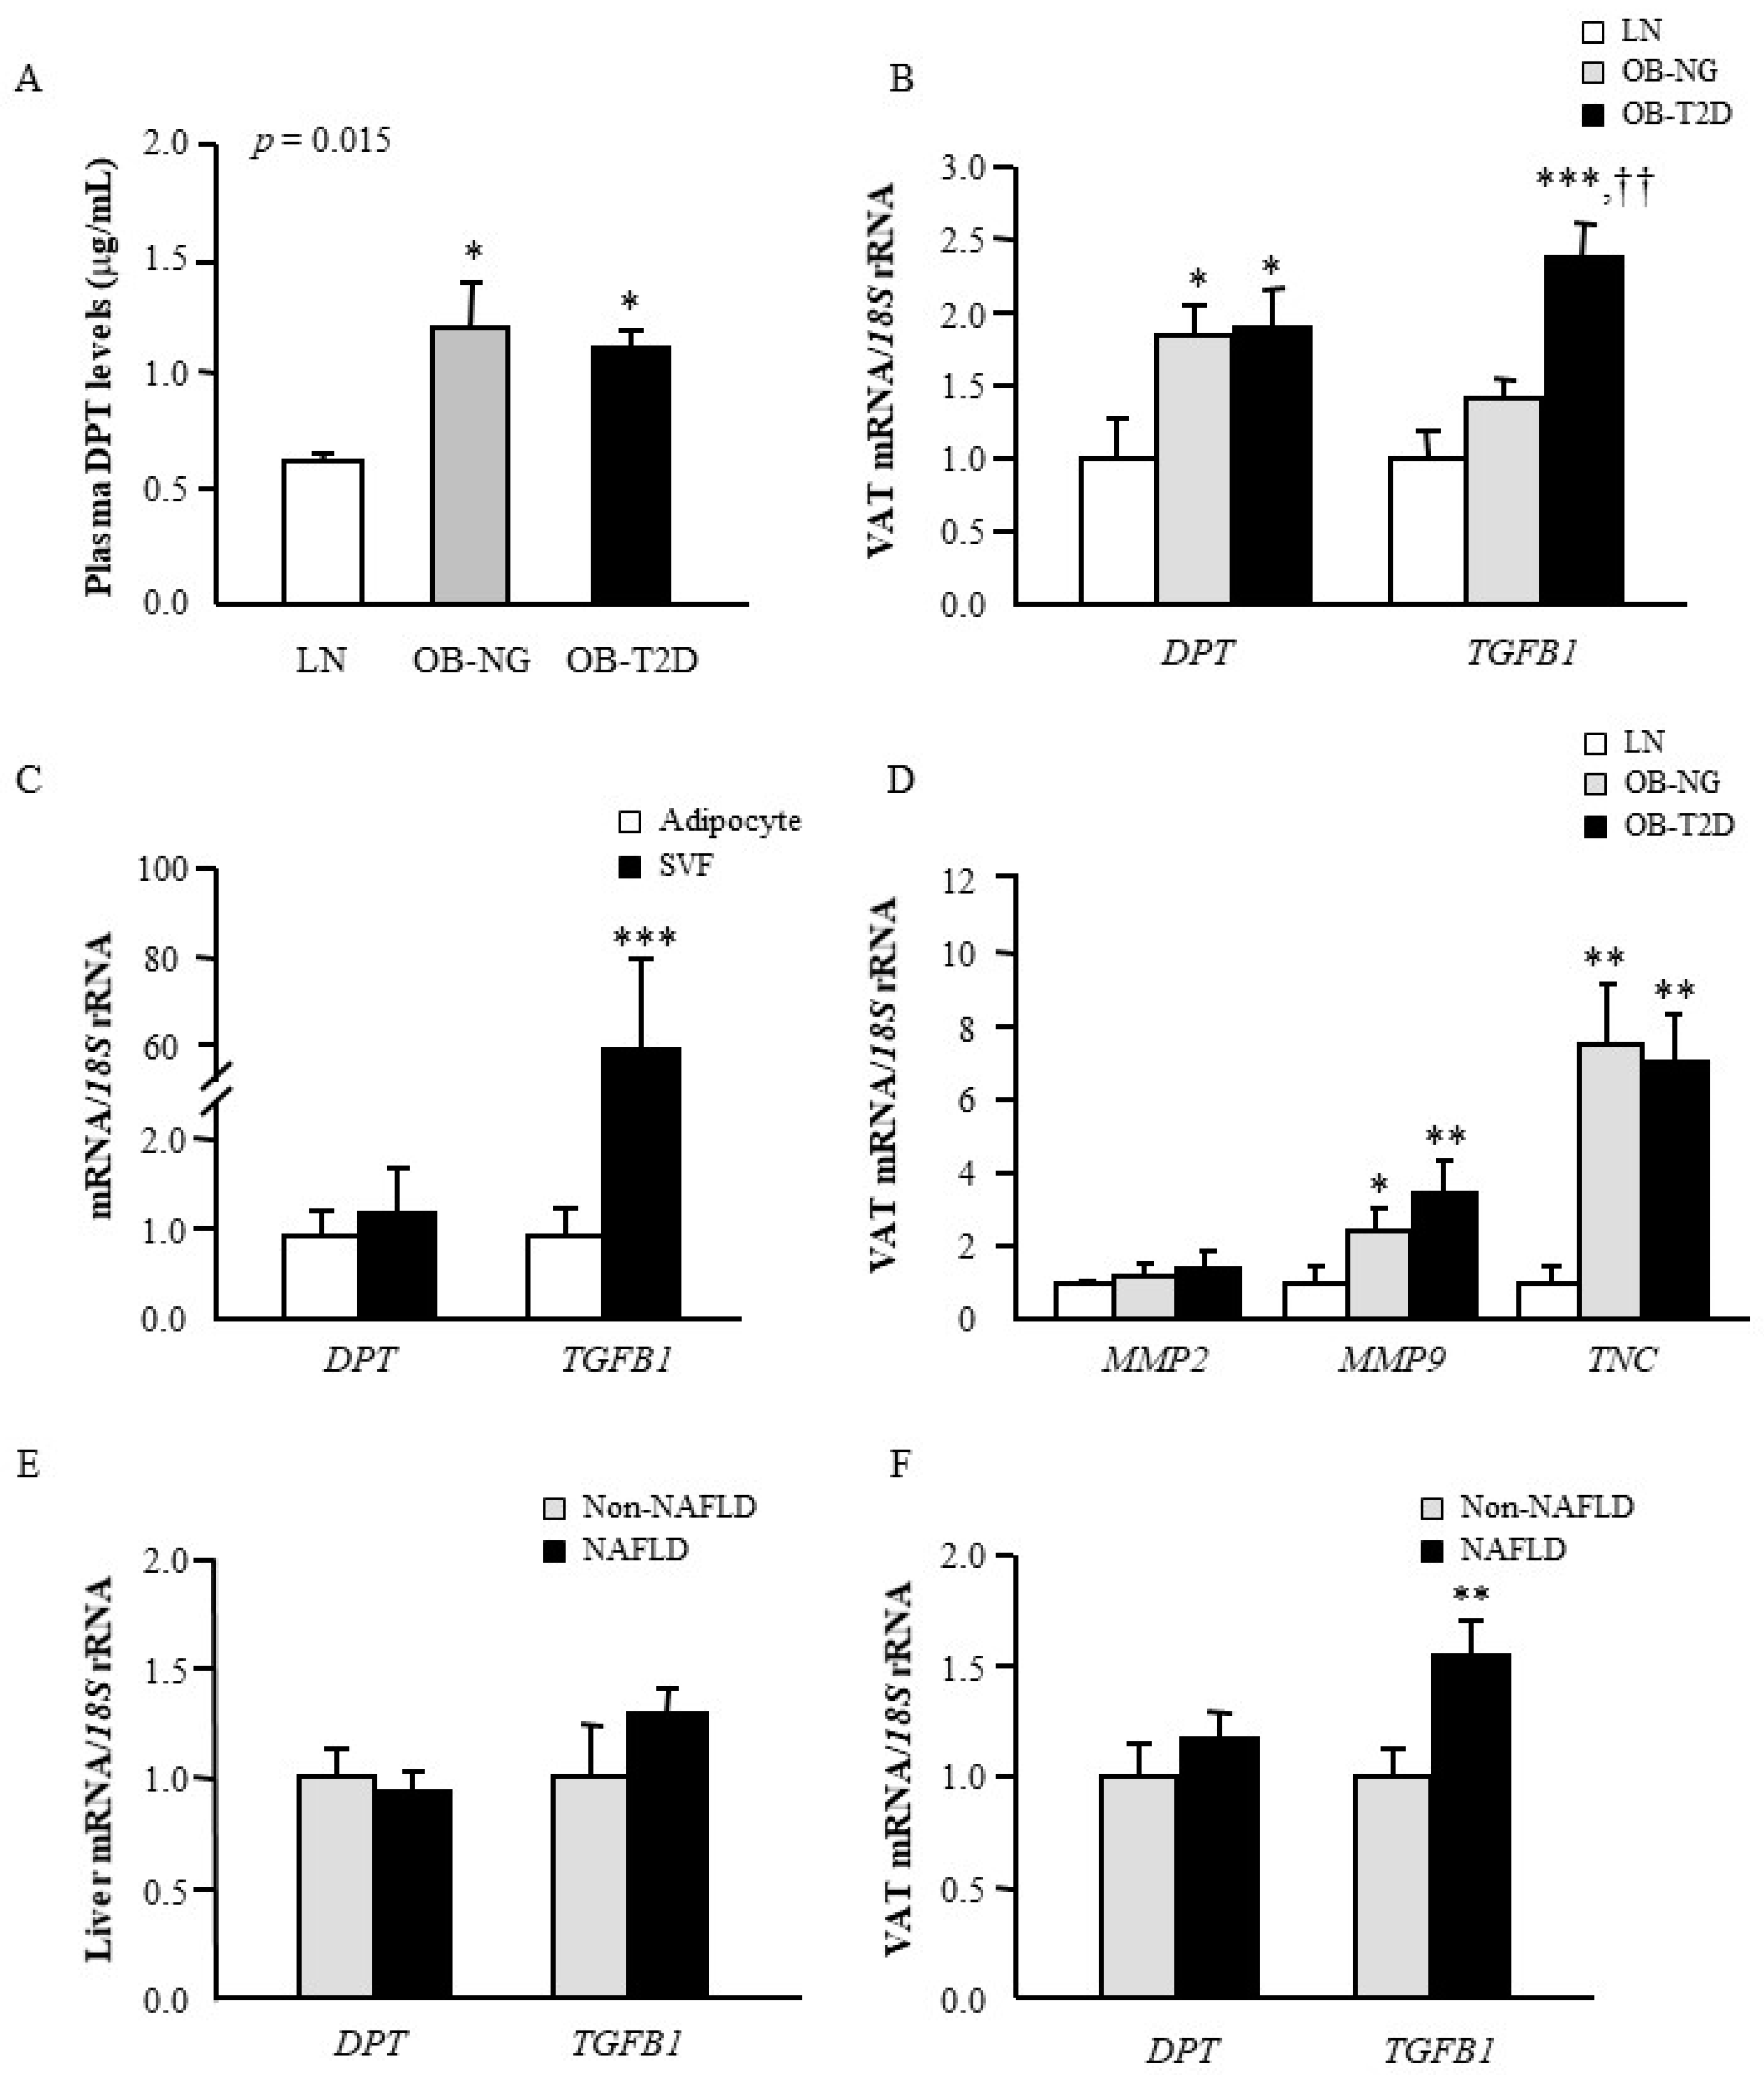
3.1. Circulating Levels of DPT are Increased in Obesity

Characteristics of the volunteers enrolled in the study are shown in Table 1. As expected, markers of adiposity were significantly higher (p < 0.001) in both groups of patients with obesity compared with lean volunteers. Patients with T2D were more insulin-resistant than lean and obese NG subjects, as evidenced by the increased concentrations of glucose (p < 0.001) and lower QUICKI index (p < 0.001). Noteworthy, individuals with obesity showed higher (p < 0.01) circulating levels of the inflammatory markers CRP and fibrinogen. Homocystein concentrations were significantly increased (p < 0.01) in patients with obesity and T2D. No differences were observed in the circulating levels of AST and ALP, but patients with T2D exhibited increased (p < 0.01) concentrations of ALT and γ-GT together with a decrease (p < 0.001) of the ratio AST/ALT.
Significant differences in circulating DPT concentrations among the experimental groups were found (p = 0.015) to be significantly increased in both groups of patients with obesity as compared to normal-weight volunteers (Figure 1A). Differences remained statistically significant after adjustment by age and sex (p = 0.010 and p = 0.002, respectively). In this regard, a significant positive correlation (p < 0.001) was observed between circulating DPT concentrations and all anthropometric measurements as well as with insulin levels (p = 0.005) and HOMA index (p = 0.032), whereas a negative correlation with HDL-cholesterol (p = 0.001) was found (Table 2). Importantly, a negative association between plasma DPT levels and the marker of liver fibrosis AST/ALT was also observed (p = 0.019) (Table 2).

3.2. Obesity and Obesity-Associated T2D Increase Gene Expression Levels of DPT in VAT

Since plasma levels of DPT are increased in patients with obesity and considering the contribution of VAT to obesity-associated inflammation and metabolic alterations, we analysed mRNA levels of DPT together with those of TGFB1 in this fat depot. Results showed higher gene expression levels of DPT (p < 0.01) in VAT in obesity and obesity-associated T2D (Figure 1B). In this sense, DPT mRNA levels were significantly associated with WHR (r = 0.31; p = 0.028). Moreover, gene expression levels of TGFB were significantly upregulated (p < 0.01) in obese patients with T2D compared to normal-weight and obese NG volunteers (Figure 1B). Notably, gene expression levels of DPT were positively correlated with mRNA levels of TGFB1 (r = 0.41; p = 0.002). Macrophages, fibroblasts and myofibroblasts are known as important sources of DPT. However, the expression of DPT by other cell types is poorly understood. To validate which cell type preferentially contributed to the expression levels of DPT in VAT, adipocytes and SVFC were isolated from VAT samples obtained from patients with obesity. Whereas expression levels of TGFB1 were highly upregulated (p < 0.0001) in SVFC compared to mature adipocytes, no differences in the mRNA levels of DPT were found (Figure 1C). We also detected an increase in the gene expression levels of the ECM-related genes MMP9 and TCN in both groups of patients with obesity compared with normal-weight subjects (Figure 1D). Although mRNA levels of MMP2 were higher in patients with obesity, differences were not statistically significant (p = 0.078). However, a positive association between the expression of DPT and MMP2 was found (r = 0.30; p = 0.026).
Given that the liver represents a main metabolic organ and that one of the best-recognized hepatic disorders related with obesity is NAFLD, our aim was to investigate the hepatic regulation of DPT and TGFB1 in this condition. No differences were detected between obese patients with or without NAFLD in the expression levels of DPT and TGFB1 in the liver (Figure 1E), while TGFB1 gene expression was significantly upregulated (p < 0.01) in obese patients with NAFLD in VAT (Figure 1F). Remarkably, a strong correlation (r = 0.56; p < 0.001) was found between mRNA levels of DPT and TGFB1 in the liver. We also observed a negative association (r = –0.33; p = 0.009) between gene expression of TGFB1 in the liver and the ratio AST/ALT.

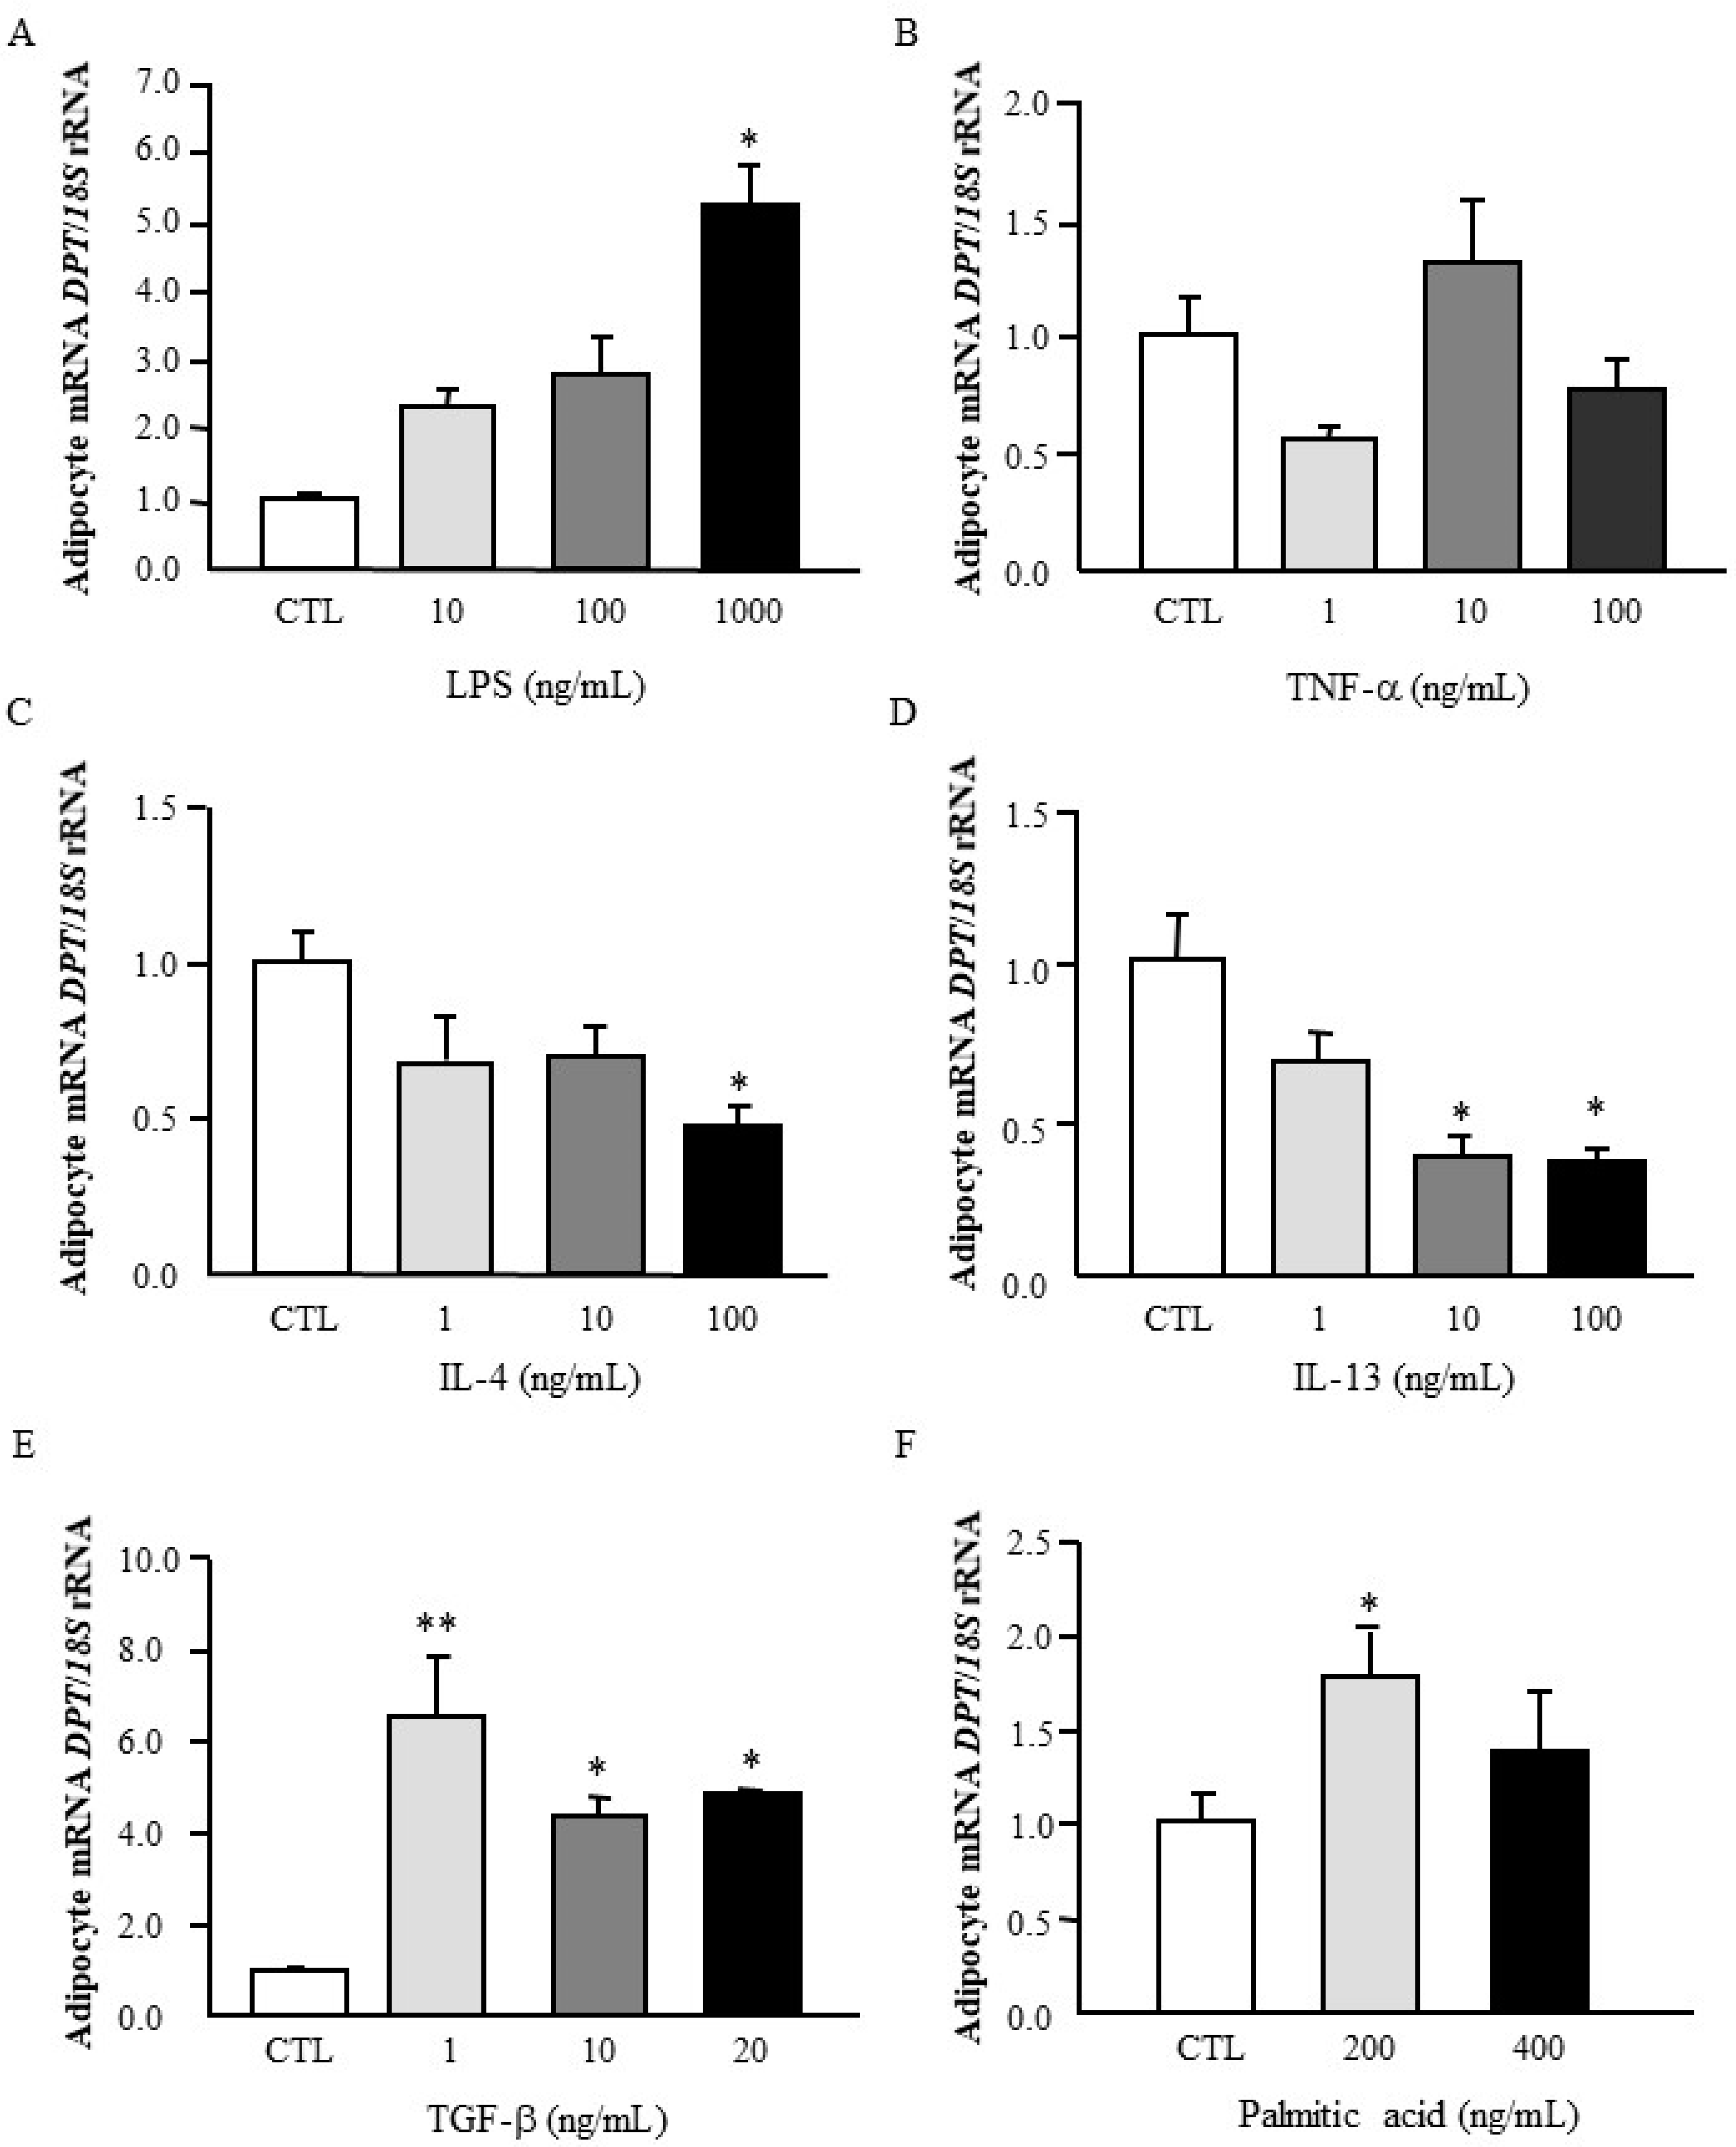
3.3. Effect of Inflammatory and Anti-Inflammatory Factors in DPT Expression in Visceral Adipocytes

Since unresolved inflammation and the inappropriate ECM remodelling are related processes that reflect a dysfunctional AT, human omental adipocytes were stimulated with different inflammation-related mediators to analyse their influence on DPT expression. As shown in Figure 2A, DPT mRNA levels were induced at the highest dose (p < 0.05) by LPS, a well-known exogenous inflammatory factor that initiates acute inflammatory responses, but no differences were found after the treatment with TNF-α, an endogenous inflammatory factor (Figure 2B). Oppositely, a significant downregulation (p < 0.05) of mRNA levels of DPT after the treatment with the anti-inflammatory cytokines IL-4 and IL-13 was observed in human visceral adipocytes (Figure 2C,D). TGF-β has been shown to enhance the expression of DPT on normal skin cultured fibroblasts [28]. Importantly, we also found an upregulation (p < 0.05) of DPT expression after the treatment with TGF-β in visceral adipocytes (Figure 2E). In vivo and in vitro studies have revealed that a chronic exposure to palmitate, a saturated free fatty acid, is associated with the induction of fibrosis [29,30]. In this sense, we found that palmitic acid enhanced (p < 0.05) the mRNA levels of DPT in adipocytes (Figure 2F).

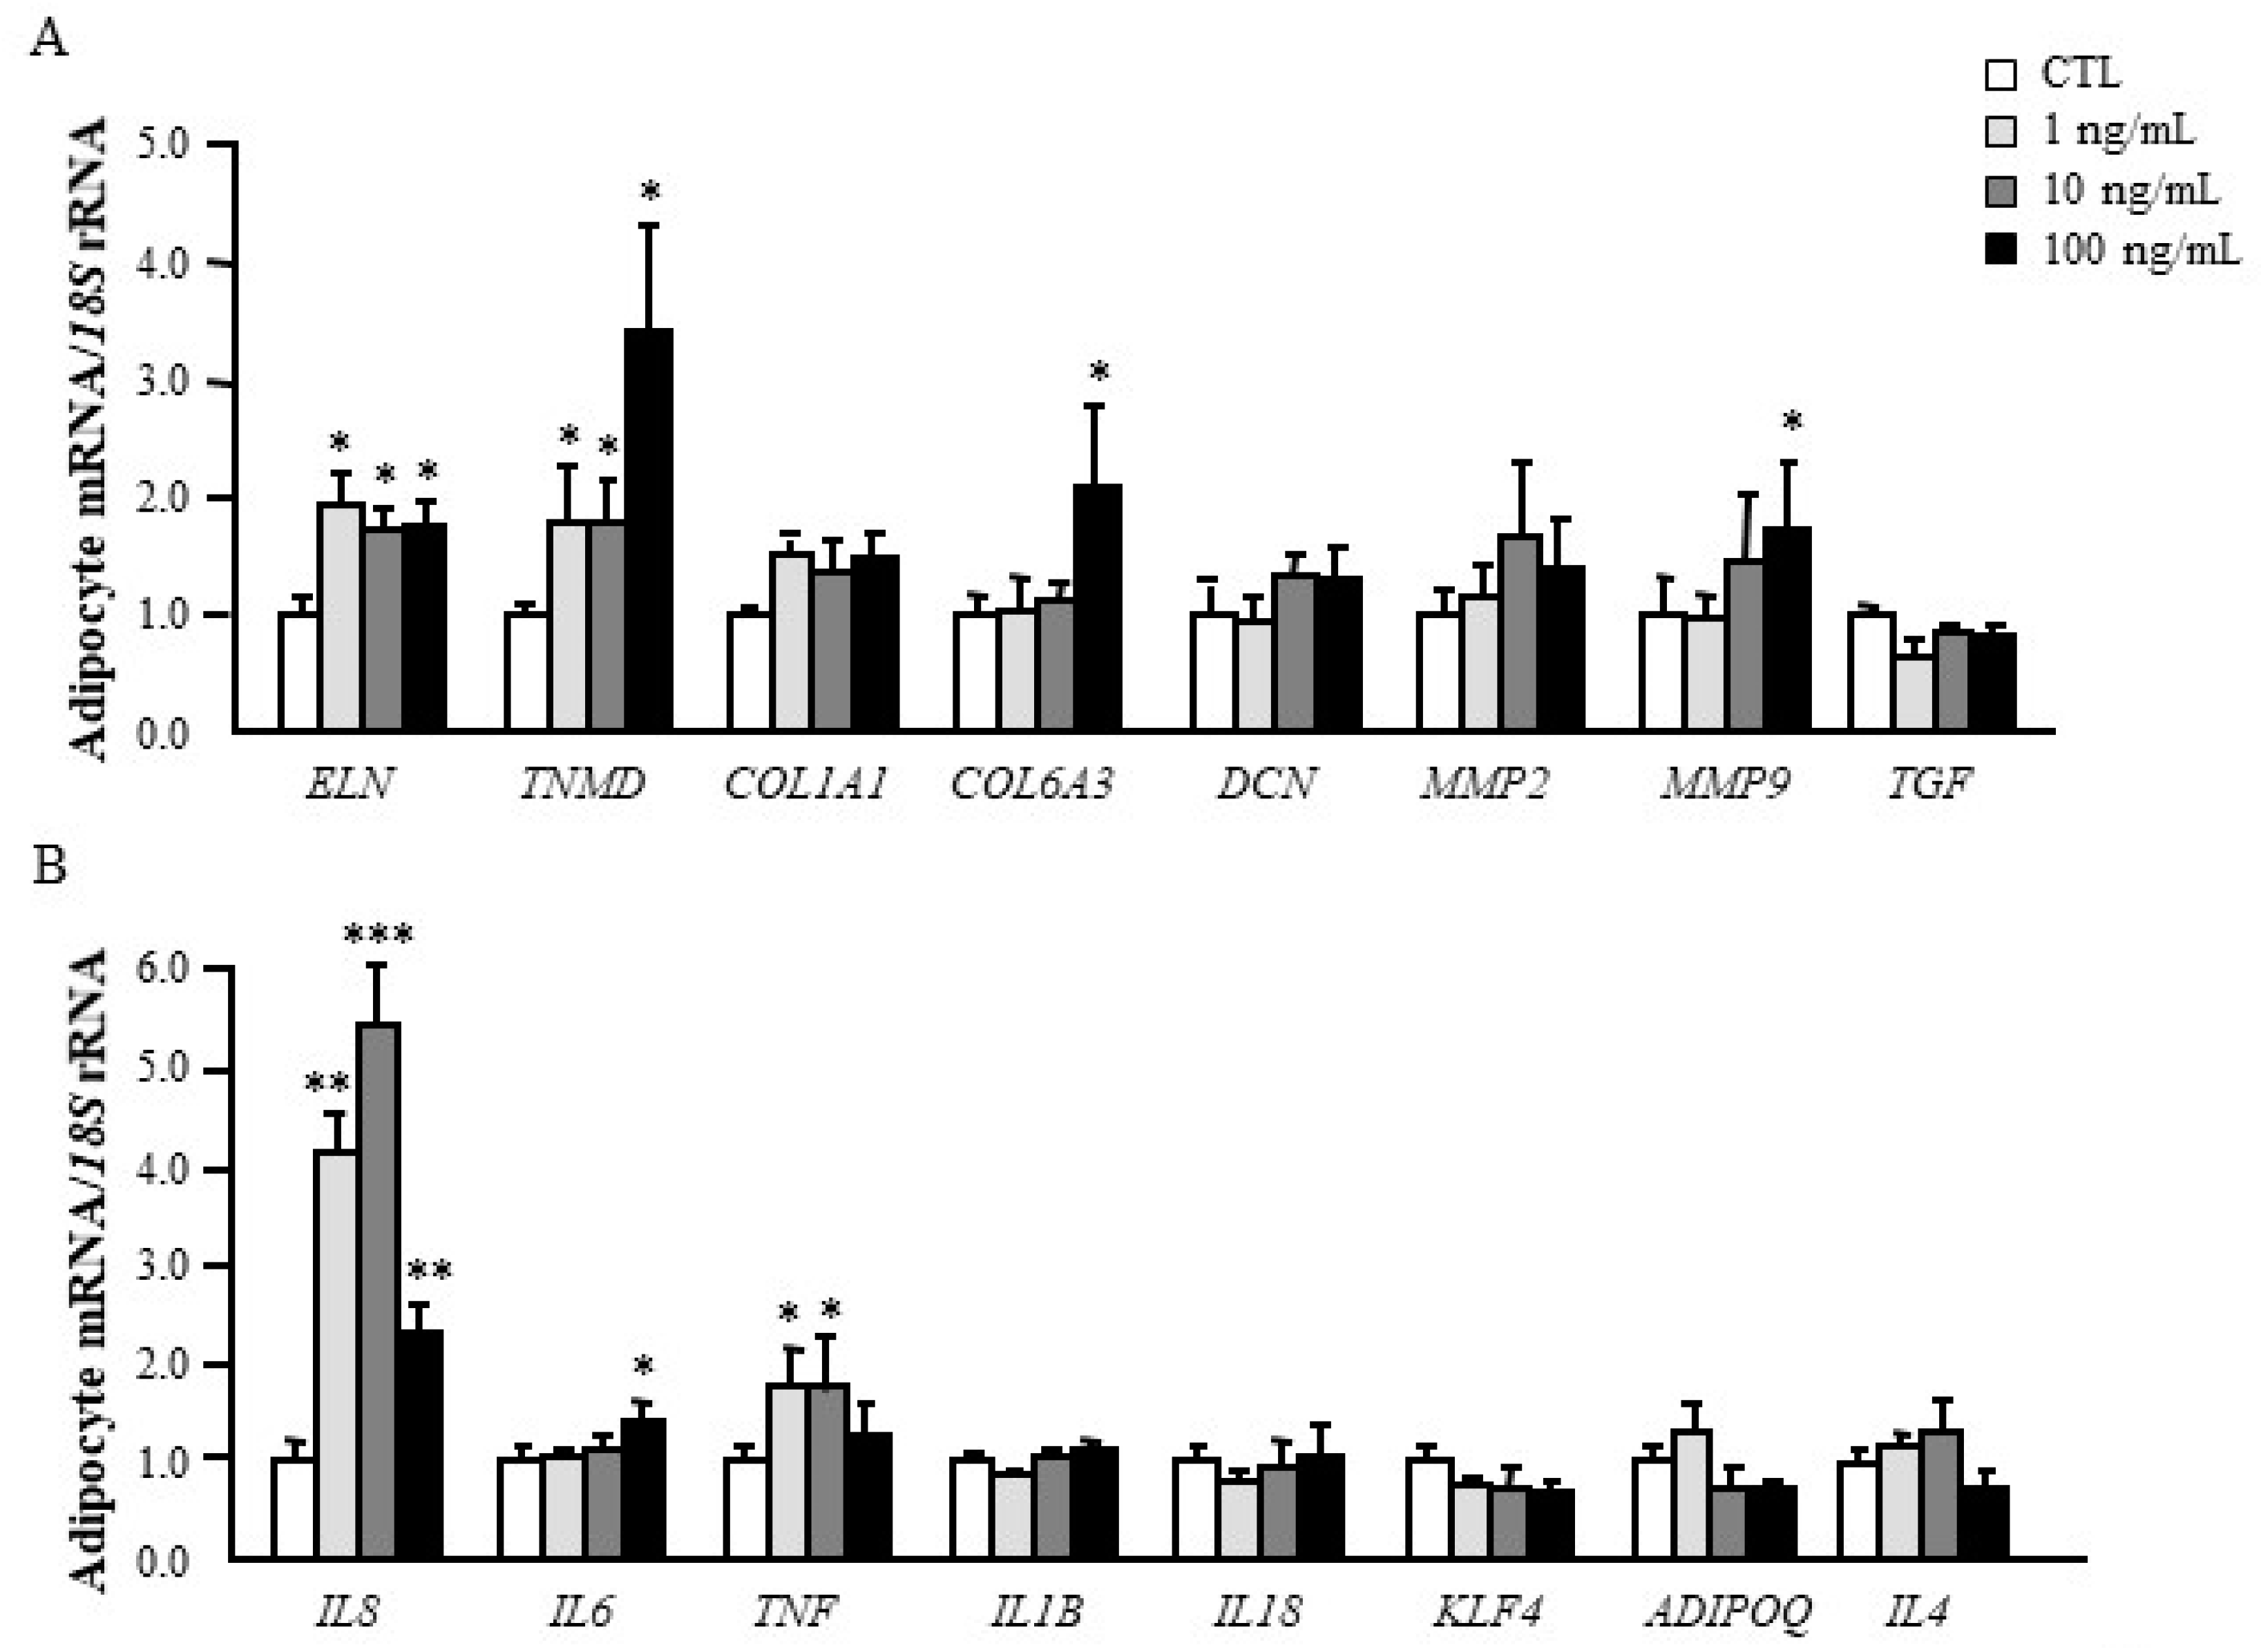
3.4. Dermatopontin Upregulates ECM Remodelling and Inflammation-Related Genes in Visceral Adipocytes

It is known that DPT acts as a potential contributor to liver fibrosis increasing collagen deposition [8]. Therefore, we assessed whether DPT can modify the expression of genes involved in the ECM remodelling and inflammatory response in human visceral adipocytes. Cells were stimulated with increasing concentrations of DPT for 24 h. As shown in Figure 3A, DPT treatment significantly upregulated (p < 0.05) the expression levels of genes closely related to ECM structure and remodelling (COL6A3, ELN, MMP9 and TNMD). Unexpectedly, no effect of the DPT treatment was found in the modulation of TGFB1 and DCN. We also detected an increase (p < 0.05) in the expression of the well-recognized inflammatory markers IL6, IL8 and TNF (Figure 3B).

4. Discussion

Alterations in the ECM composition of the AT can aberrantly activate signalling pathways that promote the development of obesity-associated comorbidities [31]. The excess deposition of main components of the ECM during obesity including structural proteins (collagens) and different types of adhesion proteins (fibronectin, laminin, elastins and proteoglycans) triggers not only a physical restriction on AT expansion but also the necrosis of adipocytes, inflammation and metabolic dysfunction [31,32]. In this sense, the study was designed to ascertain the role of DPT, a small protein with significant properties in collagen fibril formation, in regulating ECM remodelling and inflammation in VAT in the context of obesity. To our knowledge, this is the first study reporting that obesity and obesity-associated T2D increase circulating levels of DPT as well as its gene expression levels in VAT. In addition, we revealed that inflammation-related factors regulate mRNA levels of DPT. Consistently, we further unveiled the role of DPT in the regulation of ECM remodelling and inflammation in human visceral adipocytes.
The obesity-associated ECM remodelling of AT is greatly linked with elevated circulating levels of ECM proteins or ECM-derived peptides in parallel with increased levels of inflammatory cytokines. In the present study we report, for the first time, that circulating concentrations of DPT are increased in obese patients with and without T2D. A previous study also identified the presence of DPT in serum, although its relative amount was much lower than in the wound fluid [4]. The detection of DPT in the serum was unexpected and its function is not well-established. It has been suggested that DPT could function as a coagulation factor, since its invertebrate homologue acts as an agglutination factor [33]. We also found a positive association between circulating concentrations of DPT and all anthropometric measurements strengthening its involvement in obesity. Importantly, we demonstrated a positive correlation between DPT and insulin levels and HOMA, suggesting a link between DPT and insulin sensitivity. Increased levels of cholesterol in Dpt*** mice have been described [11] and accordingly, a negative association of DPT with HDL-cholesterol levels was detected in our study.
Tissue-specific distribution of Dpt has been previously evaluated in different mouse tissues, exhibiting a major expression in skin, adipose tissues and lungs [10]. The increased mRNA expression levels of DPT in VAT from obese patients compared to normal-weight volunteers is a novel finding, and this is the first observation that DPT may play a role in the VAT dysfunction in obesity. Although Dpt-knockout mice did not show clear anatomical abnormality or gross metabolic alterations, they showed an increased skin elasticity, a significant decrease in the relative thickness of the dermis and an impaired collagen fibrillogenesis [10,11]. These data indicate the critical role of DPT in collagen accumulation [11]. Recently, DPT was found associated with the degree of fibrosis in human liver disease with its hepatic expression being significantly decreased after gastric bypass [10]. The increased levels of DPT in the VAT from patients with obesity suggest a role of this protein in fibrogenesis, resulting in increased ECM deposition and hence, altering the ECM composition and favouring fibrosis. Reportedly, DPT interacts and increases TGF-β signalling [16] and, in this sense, we observed increased levels of TGFB1 mRNA in VAT from obese patients with T2D as well as a positive association of gene expression levels of DPT and TGFB1. TGF-β is a proangiogenic cytokine considered a master regulator of fibrosis in AT [34,35]. TGF-β increases the expression of multiple ECM components such as collagens, fibronectin and matrix metalloproteinases [13]. Our results indicate that TGF-β upregulated the expression levels of DPT in human visceral adipocytes. DPT expression was described as being inducible by TGF-β in the human stellate LX2 cell line as well as in normal skin cultured fibroblasts [10,28]. In accordance with previous results in fibroblasts [28], the anti-inflammatory factors IL-4 and IL-13 reduced the mRNA of DPT also in visceral adipocytes. Moreover, LPS and palmitic acid, both potential candidates in the development of AT inflammation, increased the expression of DPT. Adipocytes have been proposed as a crucial site for the response to LPS, one of the most potent exogenous inflammatory factors. Indeed, mature adipocytes are recognized as a key source of LPS-induced cytokines that are essential for the setting of the obesity-associated low-grade inflammation. We observed a stimulatory effect of LPS on the expression of DPT, suggesting the possible role of DPT in the inflammatory pathways associated to obesity. Therefore, our results suggest that the obesity-associated inflammation in AT enhances the expression of DPT.
The multiple effects of DPT in cell adhesion and proliferation as well as in ECM remodelling have been studied in different cell types but its role in adipocytes remains unknown. We found a significant increase in the expression of relevant ECM components (COL6A3, ELN, MMP9, TNMD) in adipocytes after DPT treatment. Collagens constitute the most abundant structural components of the ECM and compared to other components, collagen VI is the most highly expressed in mature adipocytes exhibiting an important metabolic role [13]. Moreover, expression of COL6 is increased in the VAT of patients with obesity [36,37]. We found that DPT increased the expression of COL6A3 in adipocytes, thereby stimulating transduction pathways involved in profibrotic responses as well as in the capacity of adipocytes to expand. We also found increased levels of ELN, another ECM protein found in almost all tissues, after DPT stimulation. Elastin-derived peptides have been shown to promote insulin resistance by inhibiting glucose uptake in AT and muscle [38]. Similar to COL6, elastin deposition is increased in VAT depots with obesity [39]. Moreover, ELN expression is downregulated in Col6-knockout mice which exhibited a less dense collagen matrix that allows adipocyte hypertrophy [13]. MMP expression in AT is significantly increased in patients with obesity, suggesting that these enzymes are involved in ECM remodelling during obesity [40,41]. Consistently, an increased expression of MMP9 in VAT was detected in patients with obesity and the treatment with DPT also increased its expression in adipocytes. The functions of MMPs during fibrosis are not limited to the degradation and turnover of most components of the ECM, they also influence cellular proliferation and survival, control different aspects of inflammation, activate fibroblasts and play a role in the control of adipocyte differentiation [40,42,43]. Specifically, MMP-9 has been associated with inflammation and fibrosis, mainly through the synthesis and deposition of collagen I in reactive fibrosis and its ability to activate TGF-β [44]. We also analysed the effects of DPT in the expression of TNMD due to its high and main expression in human AT [45] and because Tnmd-knockout mice showed disorganised collagen fibrils [46]. We detected an upregulation of TNMD after the treatment with DPT. A role of TNMD in promoting healthy AT expansion has been speculated since mice overexpressing Tnmd in AT displayed improved insulin sensitivity [47]. In this sense, the higher TNMD expression detected in insulin-resistant patients in the omental fat has been proposed as a compensatory mechanism to increase adipocyte replenishment in this condition [47]. However, the exact role of TNMD in ECM remodelling in obesity remains unknown. Unexpectedly, no differences in DCN and TGFB1 were found after DPT treatment, although it has been reported that DPT stimulates the expression of TGFB1 in other cell types and a tight association with decorin has been proposed [8,48].
AT fibrosis is associated with a stiff ECM inhibiting adipocyte expansion, promoting the necrosis of adipocytes and, finally, an enhanced inflammatory response. We evaluated the role of DPT in the expression of different inflammation-related factors showing an upregulation of IL6, IL8 and TNF. In this sense, loss of Dpt expression in mice triggers an increase in the expression of genes involved in the Clec7a/Dectin-1 pathway, responsible for suppressing Toll-like receptor (TLR)-4 signalling pathways and therefore favouring anti-inflammatory responses [10,49].
DPT is a noncollagenous protein with important biological functions in the ECM. We described for the first time that obesity and obesity-associated T2D increase circulating levels of DPT. We also report for the first time that DPT gene expression levels are increased in the VAT from patients with obesity as well as the role of DPT in the regulation of ECM remodelling and inflammation in human visceral adipocytes. Taken together, we proposed that DPT exerts an important role in the pathogenesis of ECM remodelling and inflammation during obesity and its associated comorbidities. Modulation of DPT as well as other ECM remodelling proteases and signalling molecules that mediate adipocyte-ECM interactions constitute promising pharmacological targets to improve obesity-associated comorbidities. However, further studies are needed to understand the exact role of DPT in orchestrating ECM remodelling in AT.

Supplementary Materials

The following are available online at https://www.mdpi.com/2077-0383/9/4/1069/s1, Table S1: Sequences of the primers and TaqMan® probes.

Author Contributions

Conceptualization, X.U., J.G.-A., G.F. and V.C.; Data curation, X.U., J.G.-A., B.R., A.R., S.B., V.V., R.M., J.S., G.F. and V.C.; Formal analysis, X.U., J.G.-A., B.R., A.R., R.M., C.S., J.S., G.F. and V.C.; Funding acquisition, J.G.-A., G.F. and V.C.; Investigation, V.V.; Methodology, X.U., B.R., S.B., R.M., C.S., J.S., G.F. and V.C.; Project administration, J.S.; Supervision, V.C.; Writing—original draft, X.U., G.F. and V.C.; Writing—review & editing, J.G.-A., B.R., A.R., S.B., V.V., R.M. and C.S. All authors have read and agreed to the published version of the manuscript.

Funding

This work was supported by Plan Estatal I+D+I from the Spanish Instituto de Salud Carlos III–Subdirección General de Evaluación y Fomento de la Investigación-FEDER (grants numbers PI17/02183, PI17/02188 and PI19/00785), by the Gobierno de Navarra (10/2018) and by CIBER Fisiopatología de la Obesidad y Nutrición (CIBEROBN), ISCIII, Spain.

Acknowledgments

The authors gratefully acknowledge the valuable collaboration of all the members of the Multidisciplinary Obesity Team, Clínica Universidad de Navarra, Pamplona, Spain.

Conflicts of Interest

The authors declare no conflict of interest.

Abbreviations

ADIPOQ, adiponectin; ALP, alkaline phosphatase; ALT, alanine aminotransferase; ARG1, arginase 1; AST, aspartate aminotransferase; AT, adipose tissue; BMI, body mass index; COL, collagen, CRP, C-reactive protein; DBP, diastolic blood pressure; DCN, decorin; DPT, dermatopontin; ECM, extracellular matrix; ELN, elastin; γ-GT, γ-glutamyltransferase; HOMA, homeostasis model assessment; IL, interleukin; KLF4, kruppel-like factor 4; LPS, lipopolysaccharide; MMP, matrix metalloproteinase; NAFLD nonalcoholic fatty liver disease; NG, normoglycaemic; OGTT, oral glucose tolerance test; QUICKI, quantitative insulin sensitivity check index; RYGB, Roux-en-Y gastric bypass; SBP, systolic blood pressure; SVFC, stroma-vascular fraction cells; TGFB1, tumour growth factor β; TNF, tumour necrosis factor-α; TNMD, tenomodulin; T2D, type 2 diabetes; VAT, visceral adipose tissue.

References

  1. Crewe, C.; An, Y.A.; Scherer, P.E. The ominous triad of adipose tissue dysfunction: Inflammation, fibrosis, and impaired angiogenesis. J. Clin. Invest. 2017, 127, 74–82. [Google Scholar] [CrossRef] [PubMed] [Green Version]
  2. Sun, K.; Tordjman, J.; Clement, K.; Scherer, P.E. Fibrosis and adipose tissue dysfunction. Cell Metab. 2013, 18, 470–477. [Google Scholar] [CrossRef] [PubMed] [Green Version]
  3. Gómez-Ambrosi, J.; Catalán, V.; Diez-Caballero, A.; Martínez-Cruz, L.A.; Gil, M.J.; García-Foncillas, J.; Cienfuegos, J.A.; Salvador, J.; Mato, J.M.; Frühbeck, G. Gene expression profile of omental adipose tissue in human obesity. FASEB J. 2004, 18, 215–217. [Google Scholar] [CrossRef] [PubMed]
  4. Kato, A.; Okamoto, O.; Ishikawa, K.; Sumiyoshi, H.; Matsuo, N.; Yoshioka, H.; Nomizu, M.; Shimada, T.; Fujiwara, S. Dermatopontin interacts with fibronectin, promotes fibronectin fibril formation, and enhances cell adhesion. J. Biol. Chem. 2011, 286, 14861–14869. [Google Scholar] [CrossRef] [Green Version]
  5. Kato, A.; Okamoto, O.; Wu, W.; Matsuo, N.; Kumai, J.; Yamada, Y.; Katagiri, F.; Nomizu, M.; Fujiwara, S. Identification of fibronectin binding sites in dermatopontin and their biological function. J. Dermatol. Sci. 2014, 76, 51–59. [Google Scholar] [CrossRef]
  6. Wu, W.; Okamoto, O.; Kato, A.; Matsuo, N.; Kumai, J.; Nomizu, M.; Fujiwara, S. Functional peptide of dermatopontin produces fibrinogen fibrils and modifies its biological activity. J. Dermatol. Sci. 2014, 76, 34–43. [Google Scholar] [CrossRef]
  7. MacBeath, J.R.; Shackleton, D.R.; Hulmes, D.J. Tyrosine-rich acidic matrix protein (TRAMP) accelerates collagen fibril formation in vitro. J. Biol. Chem. 1993, 268, 19826–19832. [Google Scholar]
  8. Okamoto, O.; Fujiwara, S. Dermatopontin, a novel player in the biology of the extracellular matrix. Connect. Tissue Res. 2006, 47, 177–189. [Google Scholar] [CrossRef]
  9. Okamoto, O.; Suzuki, Y.; Kimura, S.; Shinkai, H. Extracellular matrix 22-kDa protein interacts with decorin core protein and is expressed in cutaneous fibrosis. J. Biochem. 1996, 119, 106–114. [Google Scholar] [CrossRef]
  10. Lefebvre, P.; Lalloyer, F.; Bauge, E.; Pawlak, M.; Gheeraert, C.; Dehondt, H.; Vanhoutte, J.; Woitrain, E.; Hennuyer, N.; Mazuy, C.; et al. Interspecies NASH disease activity whole-genome profiling identifies a fibrogenic role of PPARa-regulated dermatopontin. JCI Insight 2017, 2, e92264. [Google Scholar] [CrossRef]
  11. Takeda, U.; Utani, A.; Wu, J.; Adachi, E.; Koseki, H.; Taniguchi, M.; Matsumoto, T.; Ohashi, T.; Sato, M.; Shinkai, H. Targeted disruption of dermatopontin causes abnormal collagen fibrillogenesis. J. Invest. Dermatol. 2002, 119, 678–683. [Google Scholar] [CrossRef] [PubMed] [Green Version]
  12. Cooper, L.J.; Bentley, A.J.; Nieduszynski, I.A.; Talabani, S.; Thomson, A.; Utani, A.; Shinkai, H.; Fullwood, N.J.; Brown, G.M. The role of dermatopontin in the stromal organization of the cornea. Invest. Ophthalmol. Vis. Sci. 2006, 47, 3303–3310. [Google Scholar] [CrossRef] [PubMed]
  13. Khan, T.; Muise, E.S.; Iyengar, P.; Wang, Z.V.; Chandalia, M.; Abate, N.; Zhang, B.B.; Bonaldo, P.; Chua, S.; Scherer, P.E. Metabolic dysregulation and adipose tissue fibrosis: Role of collagen VI. Mol. Cell. Biol. 2009, 29, 1575–1591. [Google Scholar] [CrossRef] [PubMed] [Green Version]
  14. Sun, K.; Kusminski, C.M.; Scherer, P.E. Adipose tissue remodeling and obesity. J. Clin. Invest. 2011, 121, 2094–2101. [Google Scholar] [CrossRef] [Green Version]
  15. Krishnaswamy, V.R.; Manikandan, M.; Munirajan, A.K.; Vijayaraghavan, D.; Korrapati, P.S. Expression and integrity of dermatopontin in chronic cutaneous wounds: A crucial factor in impaired wound healing. Cell Tissue Res. 2014, 358, 833–841. [Google Scholar] [CrossRef]
  16. Okamoto, O.; Fujiwara, S.; Abe, M.; Sato, Y. Dermatopontin interacts with transforming growth factor b and enhances its biological activity. Biochem. J. 1999, 337, 537–541. [Google Scholar] [CrossRef]
  17. Liu, X.; Meng, L.; Shi, Q.; Liu, S.; Cui, C.; Hu, S.; Wei, Y. Dermatopontin promotes adhesion, spreading and migration of cardiac fibroblasts in vitro. Matrix Biol. 2013, 32, 23–31. [Google Scholar] [CrossRef]
  18. Okamoto, O.; Hozumi, K.; Katagiri, F.; Takahashi, N.; Sumiyoshi, H.; Matsuo, N.; Yoshioka, H.; Nomizu, M.; Fujiwara, S. Dermatopontin promotes epidermal keratinocyte adhesion via a3b1 integrin and a proteoglycan receptor. Biochemistry 2010, 49, 147–155. [Google Scholar] [CrossRef]
  19. Kim, T.; Ahmad, K.; Shaikh, S.; Jan, A.T.; Seo, M.G.; Lee, E.J.; Choi, I. Dermatopontin in skeletal muscle extracellular matrix regulates myogenesis. Cells 2019, 8, 332. [Google Scholar] [CrossRef] [Green Version]
  20. American Diabetes Association. Classification and diagnosis of diabetes: Standards of medical care in diabetes-2019. Diabetes Care 2019, 42, S13–S28. [Google Scholar] [CrossRef] [Green Version]
  21. Kleiner, D.E.; Brunt, E.M. Nonalcoholic fatty liver disease: Pathologic patterns and biopsy evaluation in clinical research. Semin. Liver Dis. 2012, 32, 3–13. [Google Scholar] [CrossRef] [PubMed] [Green Version]
  22. Gómez-Ambrosi, J.; Catalán, V.; Rodríguez, A.; Andrada, P.; Ramírez, B.; Ibañez, P.; Vila, N.; Romero, S.; Margall, M.A.; Gil, M.J.; et al. Increased cardiometabolic risk factors and inflammation in adipose tissue in obese subjects classified as metabolically healthy. Diabetes Care 2014, 37, 2813–2821. [Google Scholar] [CrossRef] [PubMed] [Green Version]
  23. Gómez-Ambrosi, J.; Rodríguez, A.; Catalán, V.; Ramírez, B.; Silva, C.; Rotellar, F.; Gil, M.J.; Salvador, J.; Frühbeck, G. Serum retinol-binding protein 4 is not increased in obesity or obesity-associated type 2 diabetes mellitus, but is reduced after relevant reductions in body fat following gastric bypass. Clin. Endocrinol. 2008, 69, 208–215. [Google Scholar] [CrossRef] [PubMed]
  24. Angulo, P.; Keach, J.C.; Batts, K.P.; Lindor, K.D. Independent predictors of liver fibrosis in patients with nonalcoholic steatohepatitis. Hepatology 1999, 30, 1356–1362. [Google Scholar] [CrossRef]
  25. Muruzabal, F.J.; Frühbeck, G.; Gómez-Ambrosi, J.; Archanco, M.; Burrell, M.A. Immunocytochemical detection of leptin in non-mammalian vertebrate stomach. Gen. Comp. Endocrinol. 2002, 128, 149–152. [Google Scholar] [CrossRef]
  26. Catalán, V.; Gómez-Ambrosi, J.; Rodríguez, A.; Ramírez, B.; Valentí, V.; Moncada, R.; Landecho, M.F.; Silva, C.; Salvador, J.; Frühbeck, G. Increased interleukin-32 levels in obesity promote adipose tissue inflammation and extracellular matrix remodeling: Effect of weight loss. Diabetes 2016, 65, 3636–3648. [Google Scholar] [CrossRef] [Green Version]
  27. Rodríguez, A.; Gómez-Ambrosi, J.; Catalán, V.; Gil, M.J.; Becerril, S.; Sainz, N.; Silva, C.; Salvador, J.; Colina, I.; Frühbeck, G. Acylated and desacyl ghrelin stimulate lipid accumulation in human visceral adipocytes. Int. J. Obes. 2009, 33, 541–552. [Google Scholar] [CrossRef] [Green Version]
  28. Kuroda, K.; Okamoto, O.; Shinkai, H. Dermatopontin expression is decreased in hypertrophic scar and systemic sclerosis skin fibroblasts and is regulated by transforming growth factor-b1, interleukin-4, and matrix collagen. J. Invest. Dermatol. 1999, 112, 706–710. [Google Scholar] [CrossRef] [Green Version]
  29. Cansancao, K.; Silva Monteiro, L.; Carvalho Leite, N.; Davalos, A.; Tavares do Carmo, M.D.G.; Arantes Ferreira Peres, W. Advanced liver fibrosis is independently associated with palmitic acid and insulin levels in patients with non-alcoholic fatty liver disease. Nutrients 2018, 10, 1586. [Google Scholar] [CrossRef] [Green Version]
  30. Ogawa, Y.; Imajo, K.; Honda, Y.; Kessoku, T.; Tomeno, W.; Kato, S.; Fujita, K.; Yoneda, M.; Saito, S.; Saigusa, Y.; et al. Palmitate-induced lipotoxicity is crucial for the pathogenesis of nonalcoholic fatty liver disease in cooperation with gut-derived endotoxin. Sci. Rep. 2018, 8, 11365. [Google Scholar] [CrossRef] [Green Version]
  31. Lin Chun, T.H.; Kang, L. Adipose extracellular matrix remodelling in obesity and insulin resistance. Biochem. Pharmacol. 2016, 119, 8–16. [Google Scholar]
  32. Divoux, A.; Clément, K. Architecture and the extracellular matrix: The still unappreciated components of the adipose tissue. Obes. Rev. 2011, 12, e494–e503. [Google Scholar] [CrossRef] [PubMed]
  33. Fujii, N.; Minetti, C.A.; Nakhasi, H.L.; Chen, S.W.; Barbehenn, E.; Nunes, P.H.; Nguyen, N.Y. Isolation, cDNA cloning, and characterization of an 18-kDa hemagglutinin and amebocyte aggregation factor from Limulus polyphemus. J. Biol. Chem. 1992, 267, 22452–22459. [Google Scholar] [PubMed]
  34. Datta, R.; Podolsky, M.J.; Atabai, K. Fat fibrosis: Friend or foe? JCI Insight 2018, 3, 122289. [Google Scholar] [CrossRef]
  35. Le Dour, C.; Wu, W.; Bereziat, V.; Capeau, J.; Vigouroux, C.; Worman, H.J. Extracellular matrix remodeling and transforming growth factor-b signaling abnormalities induced by lamin A/C variants that cause lipodystrophy. J. Lipid Res. 2017, 58, 151–163. [Google Scholar] [CrossRef] [Green Version]
  36. Pasarica, M.; Gowronska-Kozak, B.; Burk, D.; Remedios, I.; Hymel, D.; Gimble, J.; Ravussin, E.; Bray, G.A.; Smith, S.R. Adipose tissue collagen VI in obesity. J. Clin. Endocrinol. Metab. 2009, 94, 5155–5162. [Google Scholar] [CrossRef] [Green Version]
  37. Sun, K.; Park, J.; Gupta, O.T.; Holland, W.L.; Auerbach, P.; Zhang, N.; Goncalves Marangoni, R.; Nicoloro, S.M.; Czech, M.P.; Varga, J.; et al. Endotrophin triggers adipose tissue fibrosis and metabolic dysfunction. Nat. Commun. 2014, 5, 1–12. [Google Scholar] [CrossRef] [Green Version]
  38. Blaise, S.; Romier, B.; Kawecki, C.; Ghirardi, M.; Rabenoelina, F.; Baud, S.; Duca, L.; Maurice, P.; Heinz, A.; Schmelzer, C.E.; et al. Elastin-derived peptides are new regulators of insulin resistance development in mice. Diabetes 2013, 62, 3807–3816. [Google Scholar] [CrossRef]
  39. Martínez-Santibañez, G.; Singer, K.; Cho, K.W.; Del Proposto, J.L.; Mergian, T.; Lumeng, C.N. Obesity-induced remodeling of the adipose tissue elastin network is independent of the metalloelastase MMP-12. Adipocyte 2015, 4, 264–272. [Google Scholar] [CrossRef] [Green Version]
  40. Bouloumié, A.; Sengenes, C.; Portolan, G.; Galitzky, J.; Lafontan, M. Adipocyte produces matrix metalloproteinases 2 and 9: Involvement in adipose differentiation. Diabetes 2001, 50, 2080–2086. [Google Scholar] [CrossRef] [Green Version]
  41. Catalán, V.; Gómez-Ambrosi, J.; Rodríguez, A.; Ramírez, B.; Silva, C.; Rotellar, F.; Gil, M.J.; Cienfuegos, J.A.; Salvador, J.; Frühbeck, G. Increased adipose tissue expression of lipocalin-2 in obesity is related to inflammation and matrix metalloproteinase-2 and metalloproteinase-9 activities in humans. J. Mol. Med. 2009, 87, 803–813. [Google Scholar] [CrossRef] [PubMed]
  42. Giannandrea, M.; Parks, W.C. Diverse functions of matrix metalloproteinases during fibrosis. Dis. Model. Mech. 2014, 7, 193–203. [Google Scholar] [CrossRef] [PubMed] [Green Version]
  43. Lancha, A.; Rodríguez, A.; Catalán, V.; Becerril, S.; Sainz, N.; Ramírez, B.; Burrell, M.A.; Salvador, J.; Frühbeck, G.; Gómez-Ambrosi, J. Osteopontin deletion prevents the development of obesity and hepatic steatosis via impaired adipose tissue matrix remodeling and reduced inflammation and fibrosis in adipose tissue and liver in mice. PLoS ONE 2014, 9, e98398. [Google Scholar] [CrossRef] [PubMed]
  44. Talman, V.; Ruskoaho, H. Cardiac fibrosis in myocardial infarction-from repair and remodeling to regeneration. Cell Tissue Res. 2016, 365, 563–581. [Google Scholar] [CrossRef] [PubMed] [Green Version]
  45. Saiki, A.; Olsson, M.; Jernas, M.; Gummesson, A.; McTernan, P.G.; Andersson, J.; Jacobson, P.; Sjoholm, K.; Olsson, B.; Yamamura, S.; et al. Tenomodulin is highly expressed in adipose tissue, increased in obesity, and down-regulated during diet-induced weight loss. J. Clin. Endocrinol. Metab. 2009, 94, 3987–3994. [Google Scholar] [CrossRef] [PubMed] [Green Version]
  46. Docheva, D.; Hunziker, E.B.; Fassler, R.; Brandau, O. Tenomodulin is necessary for tenocyte proliferation and tendon maturation. Mol. Cell. Biol. 2005, 25, 699–705. [Google Scholar] [CrossRef] [PubMed] [Green Version]
  47. Senol-Cosar, O.; Flach, R.J.; DiStefano, M.; Chawla, A.; Nicoloro, S.; Straubhaar, J.; Hardy, O.T.; Noh, H.L.; Kim, J.K.; Wabitsch, M.; et al. Tenomodulin promotes human adipocyte differentiation and beneficial visceral adipose tissue expansion. Nat. Commun. 2016, 7, 1–13. [Google Scholar] [CrossRef] [Green Version]
  48. Krishnaswamy, V.R.; Balaguru, U.M.; Chatterjee, S.; Korrapati, P.S. Dermatopontin augments angiogenesis and modulates the expression of transforming growth factor b1 and integrin a3 b1 in endothelial cells. Eur. J. Cell Biol. 2017, 96, 266–275. [Google Scholar] [CrossRef]
  49. Seifert, L.; Deutsch, M.; Alothman, S.; Alqunaibit, D.; Werba, G.; Pansari, M.; Pergamo, M.; Ochi, A.; Torres-Hernandez, A.; Levie, E.; et al. Dectin-1 regulates hepatic fibrosis and hepatocarcinogenesis by suppressing TLR4 signaling pathways. Cell Rep. 2015, 13, 1909–1921. [Google Scholar] [CrossRef] [Green Version]
Figure 1. Circulating concentrations and gene expression levels of dermatopontin (DPT) in obesity, obesity-associated type 2 diabetes (T2D) and non-alcoholic fatty liver disease (NAFLD). (A) Fasting plasma concentrations of DPT in lean (LN) volunteers, obese normoglycemic (NG) subjects and obese patients with T2D. (B) Bar graphs show the mRNA levels of DPT and tumour growth factor-β (TGFB1) in visceral adipose tissue (VAT) from lean volunteers, obese NG subjects and obese patients with T2D as well as in (C) adipocytes and stromovascular fraction (SVF) cells. (D) Bar graphs show the mRNA levels of metalloproteinase (MMP)-2, MMP9 and tenascin C (TNC) in VAT from lean volunteers, obese NG subjects and obese patients with T2D Gene expression levels of DPT and TGFB1 in liver (E) and VAT (F) from obese volunteers classified according to the presence or not of NAFLD. Bars represent the mean ± SEM. Differences between groups were analysed by one-way ANOVA followed by Tukey’s tests as well as by paired or unpaired two-tailed Student’s t tests, where appropriate. * p < 0.05, ** p < 0.01 and *** p < 0.001 vs. LN subjects, adipocytes or nonNAFLD. †† p < 0.01 vs. obese NG volunteers.
Jcm 09 01069 g001
Figure 2. Effect of inflammation-related factors on mRNA levels of DPT. Gene expression levels of DPT in cultured human visceral adipocytes incubated during 24 h with (A) LPS, (B) TNF-α, (C) IL-4, (D) IL-13, (E) TGF-β and (F) palmitic acid. Gene expression levels in unstimulated cells were assumed to be 1. Values are the mean ± SEM (n = 6 per group). Differences between groups were analysed by one-way ANOVA followed by Dunnett’s tests. * p < 0.05 and ** p < 0.01 vs. unstimulated cells.
Jcm 09 01069 g002
Figure 3. DPT induces the expression of ECM- and inflammation-related factors in human visceral adipocytes. Gene expression levels of extracellular matrix remodelling-related molecules (A) as well as inflammatory factors (B) in human visceral adipocytes stimulated with recombinant DPT (1, 10 and 100 ng/mL) for 24 h. Gene expression levels in unstimulated cells were assumed to be 1. Values are the mean ± SEM (n = 6 per group). Differences between groups were analysed by one-way ANOVA followed by Dunnet’s post hoc tests. * p < 0.05, ** p < 0.01 and *** p < 0.001 vs. unstimulated cells.
Jcm 09 01069 g003
Table 1. Anthropometric and biochemical characteristics of subjects included in the study.
LeanObese NGObese T2D
n (males, females)13 (5, 8)21 (6, 15)20 (8, 12)
Age (years)38 ± 241 ± 342 ± 3
BMI (kg/m2)21.8 ± 0.941.6 ± 1.3 **46.5 ± 1.3 ***,††
Body fat (%)22.6 ± 2.153.2 ± 1.4 ***52.1 ± 2.1 ***
Waist circumference (cm)75 ± 3119 ± 3 ***129 ± 2 ***,†
Hip circumference (cm)94 ± 1127 ± 2 ***136 ± 3 ***,†
Waist-to-hip ratio0.79 ± 0.020.94 ± 0.02 ***0.96 ± 0.02 ***
Neck circumference (cm)34 ± 138 ± 1 **42 ± 1 **,††
Fasting glucose (mg/dL)85 ± 686 ± 2123 ± 6 **,†††
2h OGTT glucose (mg/dL)112 ± 3196 ± 14 †††
Fasting insulin (µU/mL)7.2 ± 1.317.1 ± 1.422.2 ± 3.8
2h OGTT insulin (µU/mL)72.7 ± 8.6140.0 ± 18.1 †††
HOMA1.6 ± 0.44.0 ± 1.16.3 ± 1.3
QUICKI0.369 ± 0.0160.334 ± 0.0100.305 ± 0.007 **
Triglycerides (mg/dL)67 ± 1297 ± 7143 ± 13 **,††
Cholesterol (mg/dL)171 ± 8195 ± 10189 ± 7
LDL-cholesterol (mg/dL)88 ± 5119 ± 7113 ± 6
HDL-cholesterol (mg/dL)69 ± 56 ± 547 ± 3 *
Leptin (ng/mL)8.9 ± 2.458.2 ± 5.9 ***40.8 ± 8.4 **
CRP (mg/L)0.53 ± 0.089.0 ± 2.1 ***8.1 ± 1.8 ***
Fibrinogen (mg/dL)194 ± 12402 ± 18 ***354 ± 23 ***
von Willebrand factor (%)57 ± 10143 ± 15 **131 ± 14 **
Homocysteine (µmol/L)6.6 ± 0.59.4 ± 0.810.4 ± 0.6 **
AST (U/L)12 ± 118 ± 416 ± 4
ALT (U/L)6 ± 322 ± 328 ± 2 **
AST/ALT2.24 ± 0.140.87 ± 0.08 ***0.67 ± 0.06 ***
ALP (U/L)74 ± 690 ± 692 ± 7
γ-GT (U/L)13 ± 319 ± 330 ± 5
ALP, alkaline phosphatase; ALT, alanine aminotransferase; AST, aspartate aminotransferase; BMI, body mass index; CRP, C-reactive protein; γ-GT, γ-glutamyltransferase; HOMA, homeostatic model assessment; NG, normoglycemic; OGTT, oral glucose tolerance test; QUICKI, quantitative insulin sensitivity check index; T2D, type 2 diabetes. Data are mean ± SEM. CRP concentrations were logarithmically transformed for statistical analysis. Differences between groups were analysed by one-way ANOVA followed by Tukey’s post hoc tests or by unpaired two-tailed Student’s t tests, where appropriate. **p < 0.05, ***p < 0.01 and ****p < 0.001 vs. lean. p < 0.05, †† p < 0.01 and ††† p < 0.01 vs. obese NG.
Table 2. Univariate analysis of the correlations between circulating levels of dermatopontin (DPT) with anthropometric measurement and biochemical parameters.
Circulating Levels of DPT
rp
Age0.170.224
BMI0.44<0.001
BF0.350.009
Waist circumference0.53<0.001
Hip circumference0.360.008
Waist-to-hip ratio0.53<0.001
Neck circumference0.49<0.001
Fasting glucose0.010.934
Fasting insulin0.430.005
HOMA0.340.032
QUICKI–0.260.106
Triglycerides0.310.052
Cholesterol0.180.262
LDL-cholesterol0.050.741
HDL-cholesterol–0.49<0.001
Leptin0.270.122
CRP0.060.706
Fibrinogen0.010.933
von Willebrand factor0.160.357
Homocystein0.460.006
AST0.090.555
ALT0.020.907
AST/ALT–0.360.019
ALP0.090.549
γ-GT0.020.882
ALP, alkaline phosphatase; ALT, alanine aminotransferase; AST, aspartate aminotransferase; BMI, body mass index; CRP, C-reactive protein; γ-GT, γ-glutamyltransferase; DPT, dermatopontin; HOMA, homeostatic model assessment; QUICKI, quantitative insulin sensitivity check index. Differences between groups were analysed by Pearson’s correlation coefficients. Bold figures highlight statistically significant differences.

