Alcohol Hangover Differentially Modulates the Processing of Relevant and Irrelevant Information


Abstract
1. Introduction
2. Experimental Section
2.1. Participants
2.2. Experimental Design
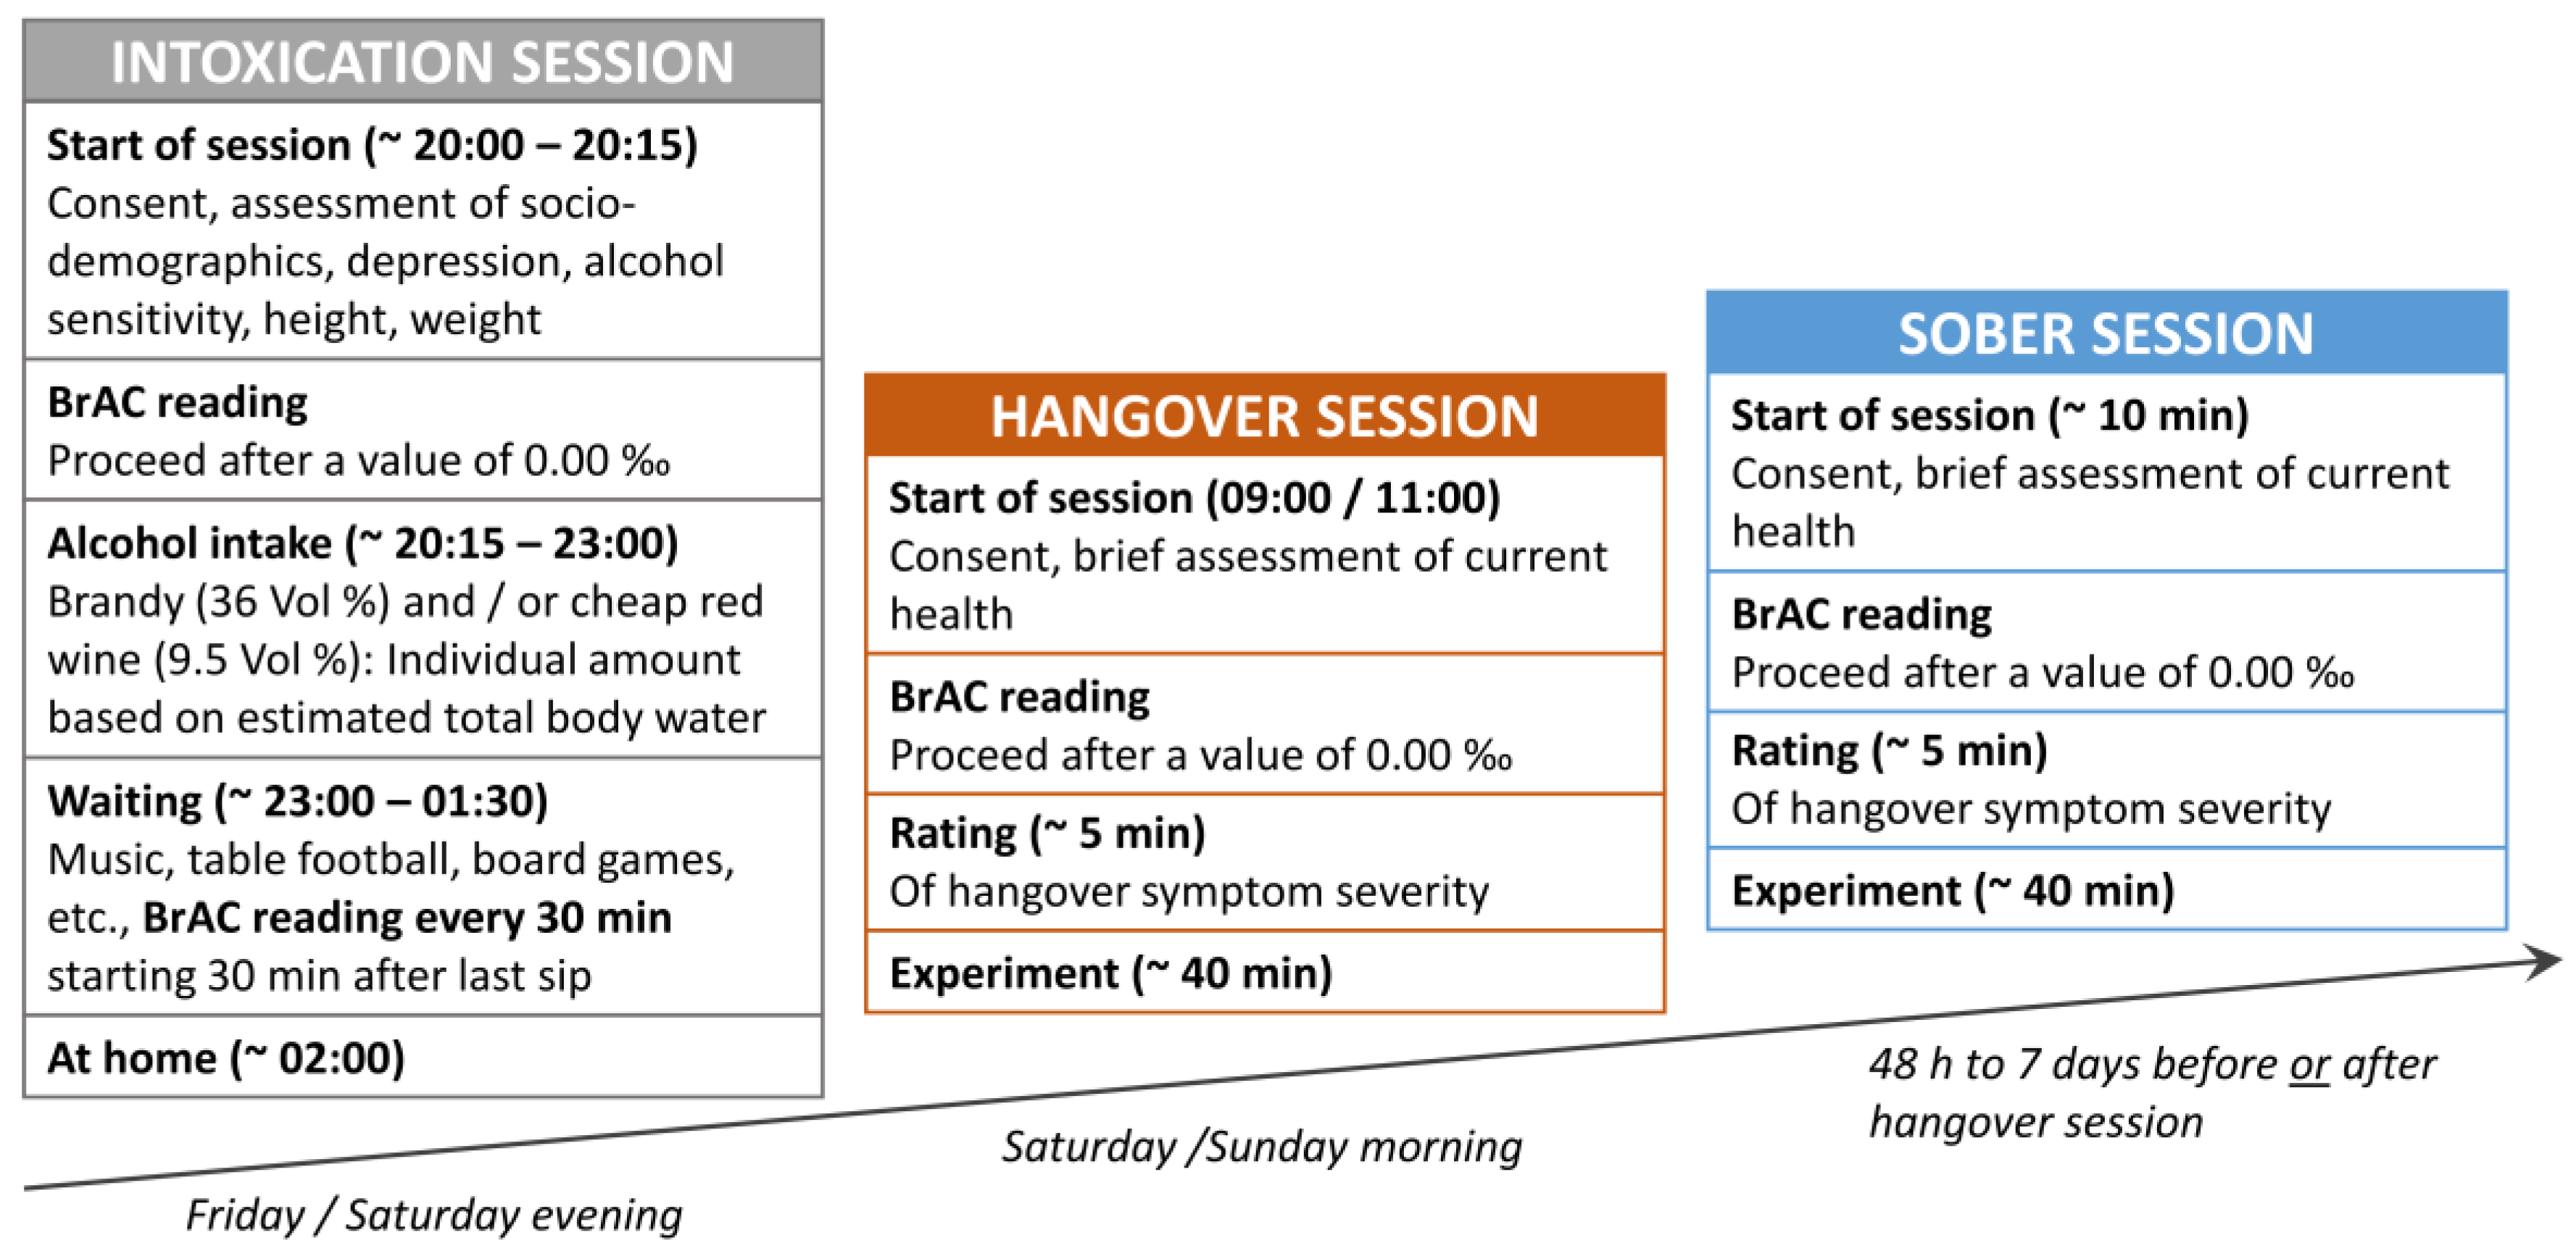
2.3. Experimental Intoxication Procedure
2.4. Questionnaires
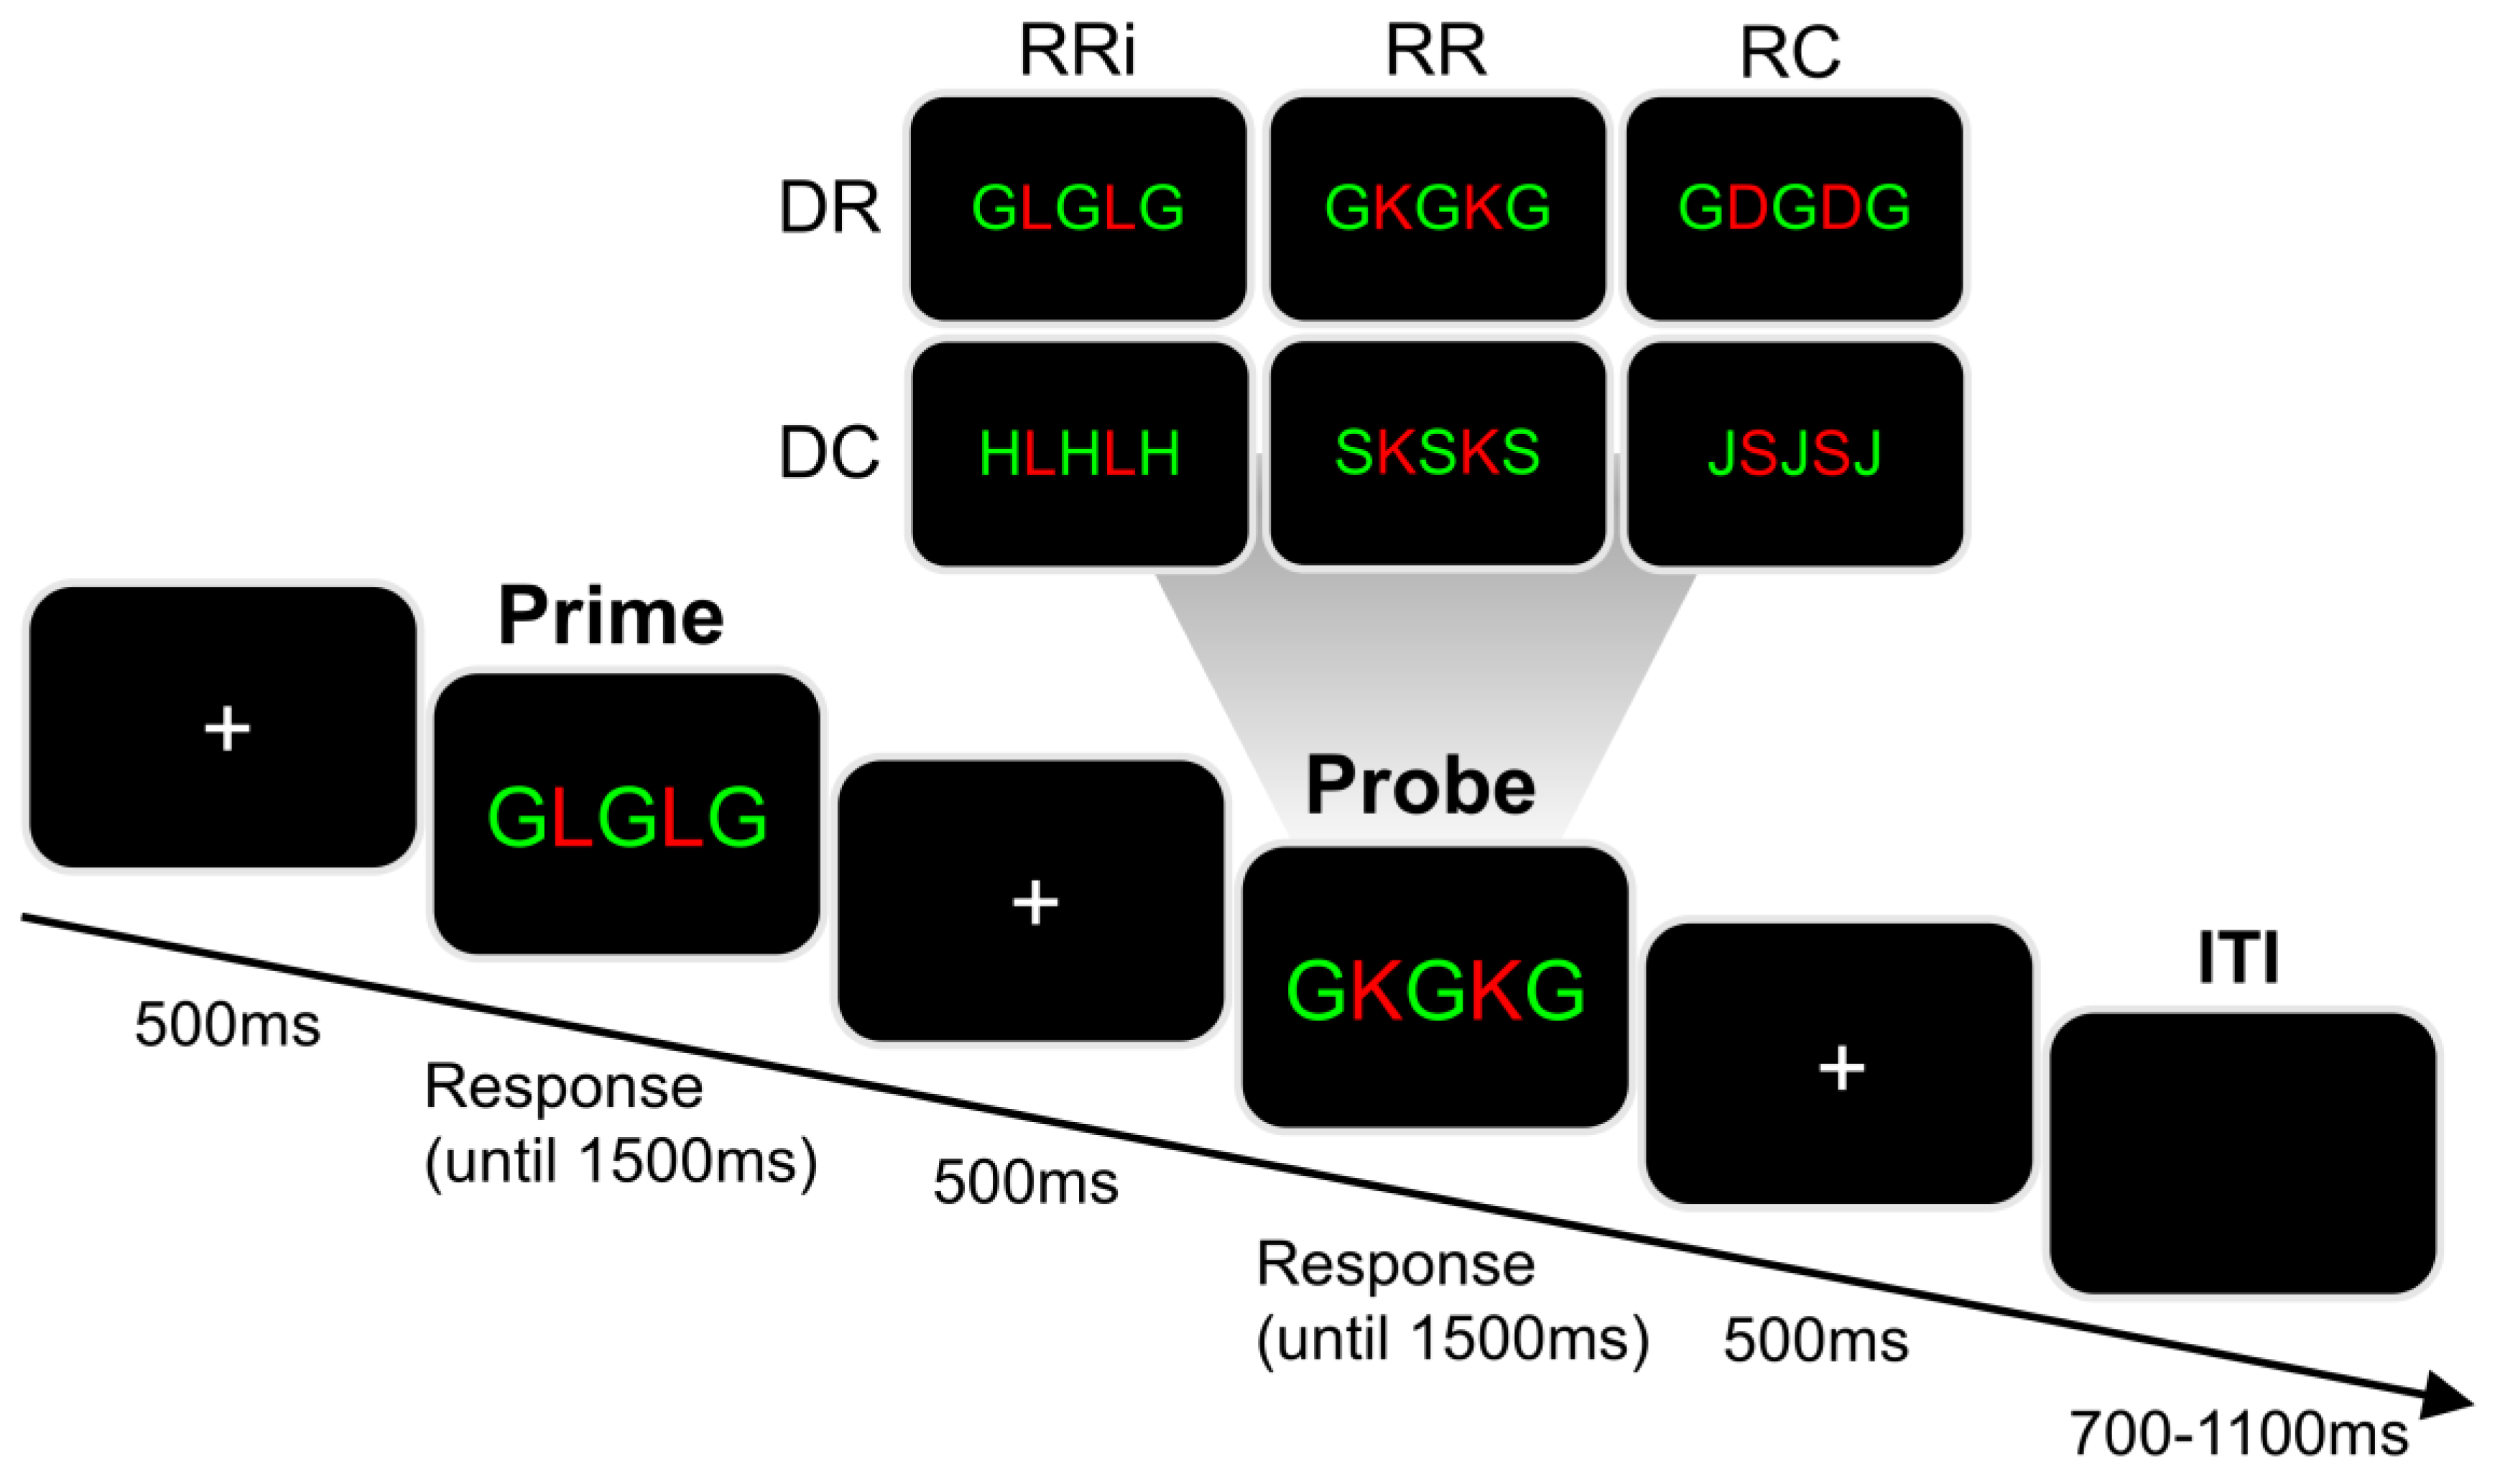
2.5. Task
2.6. Statistical Analyses
3. Results
3.1. Sample
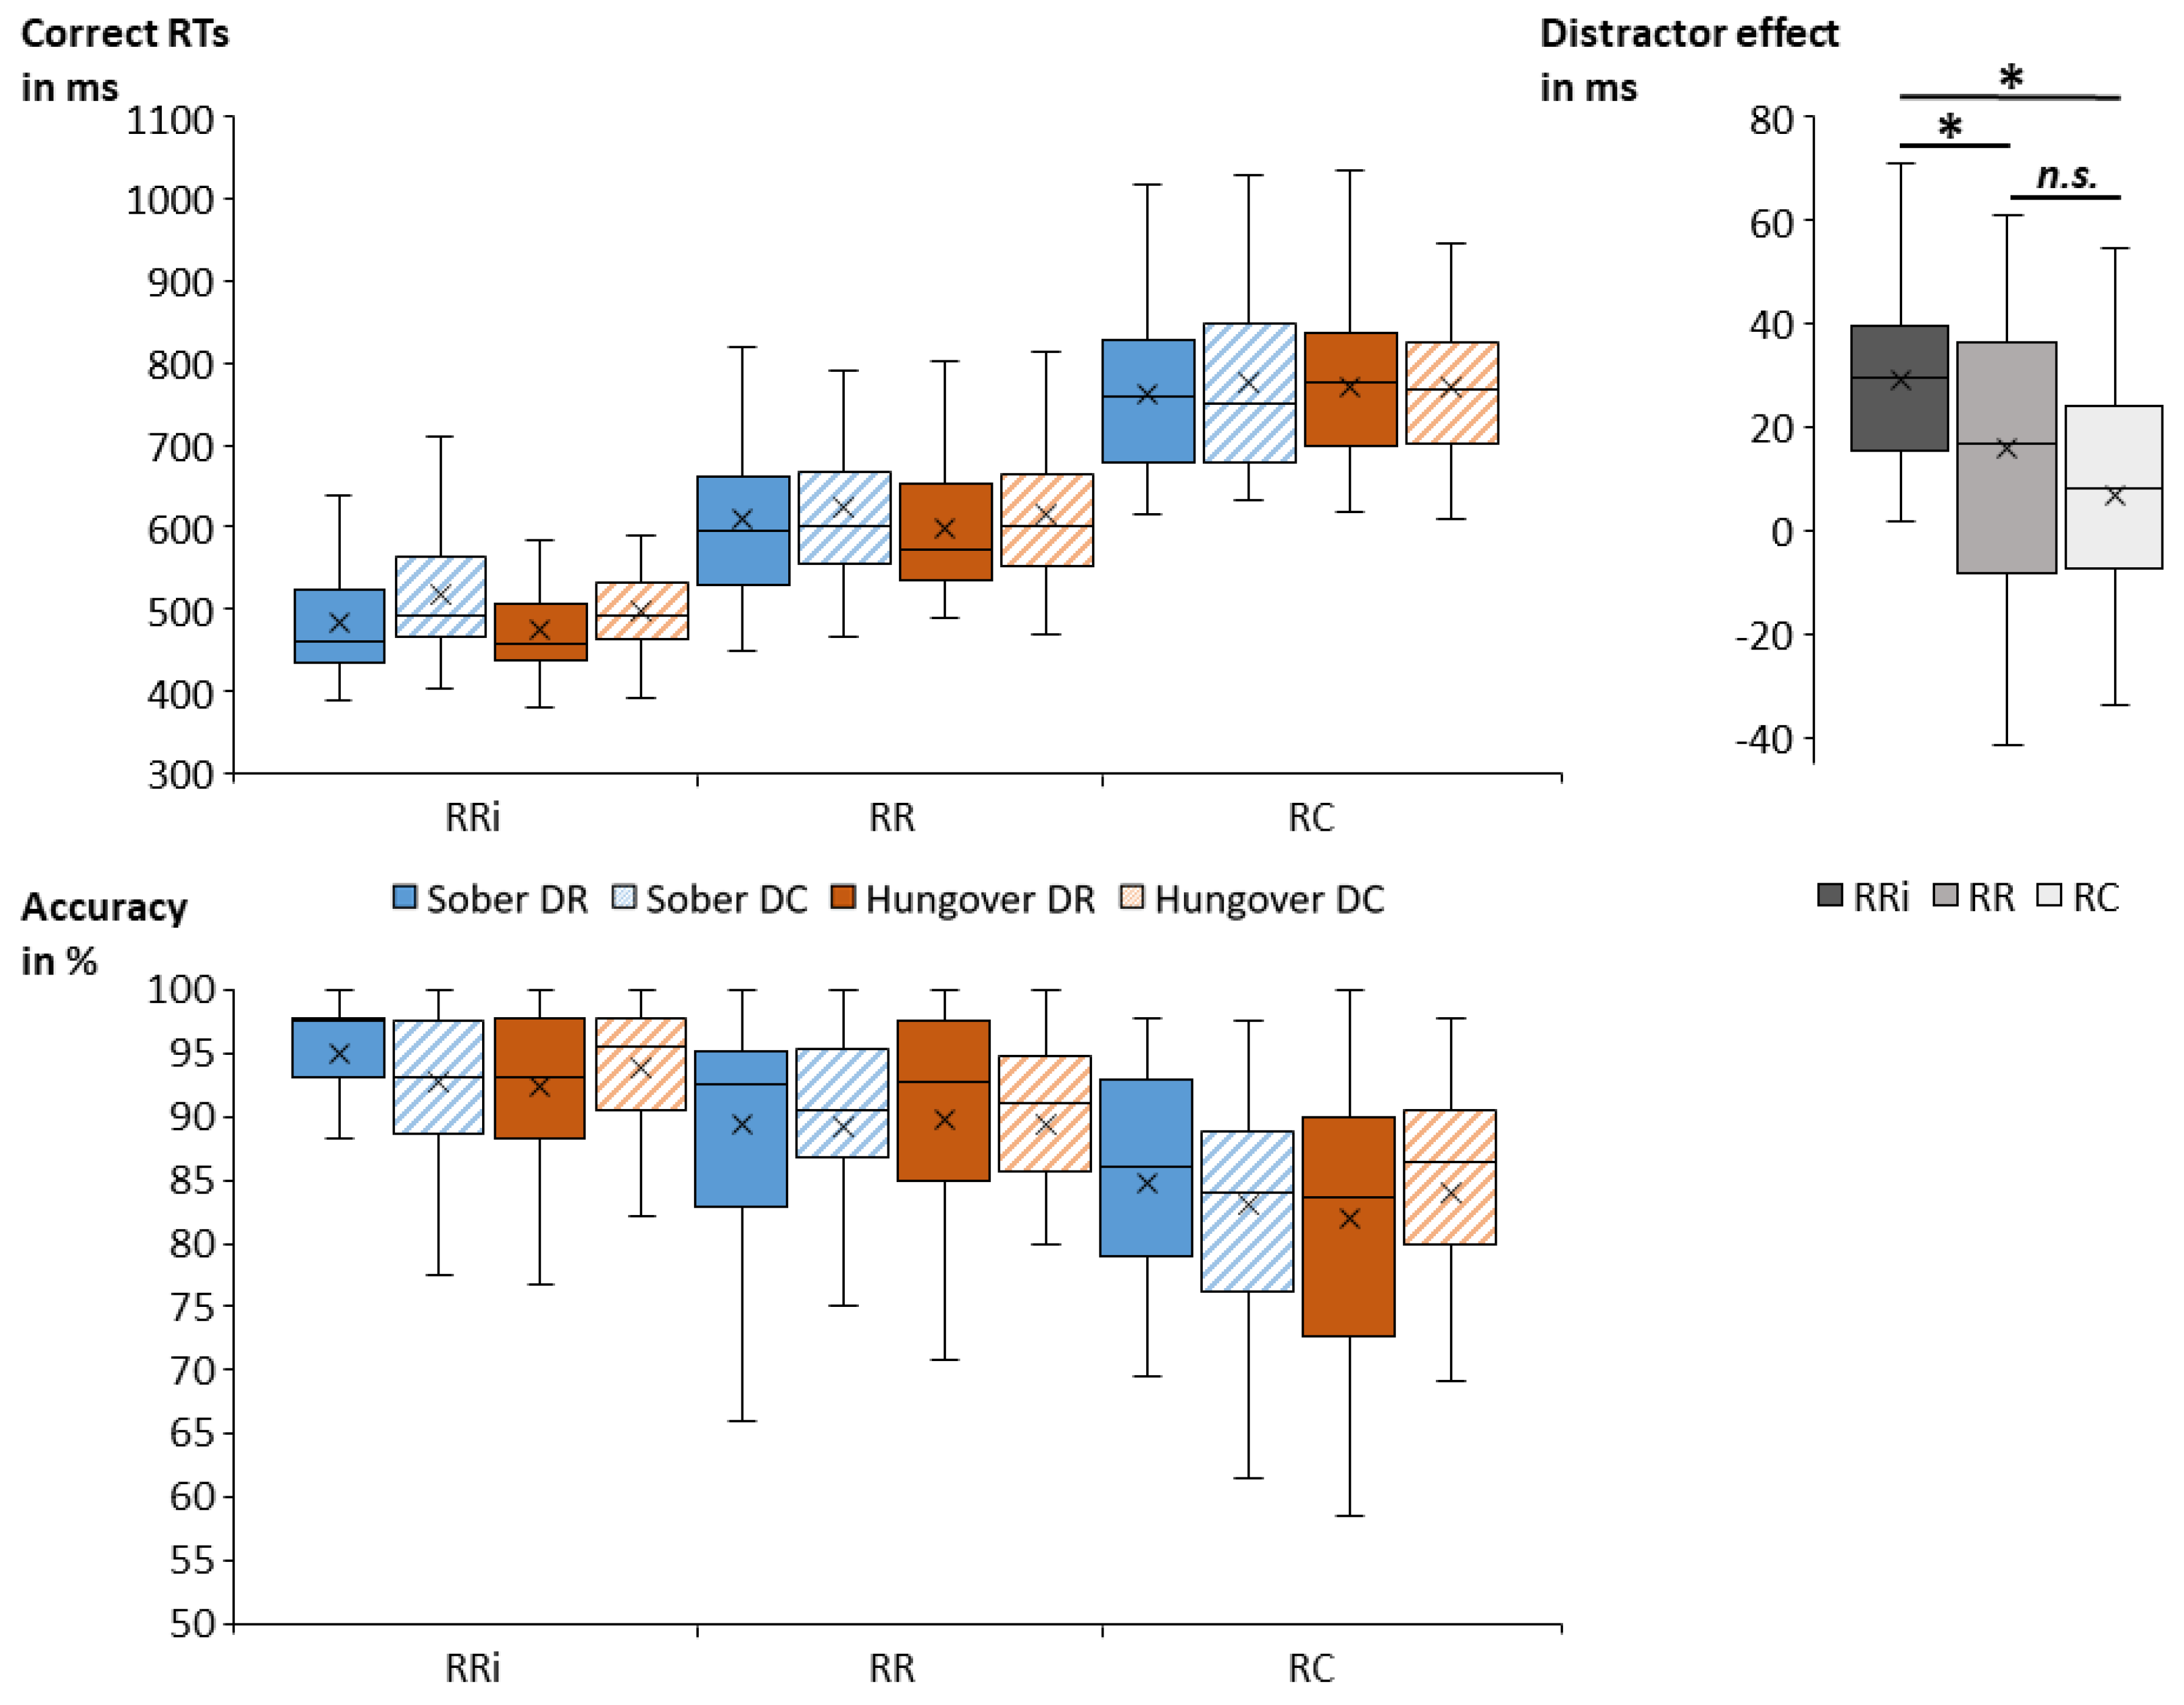
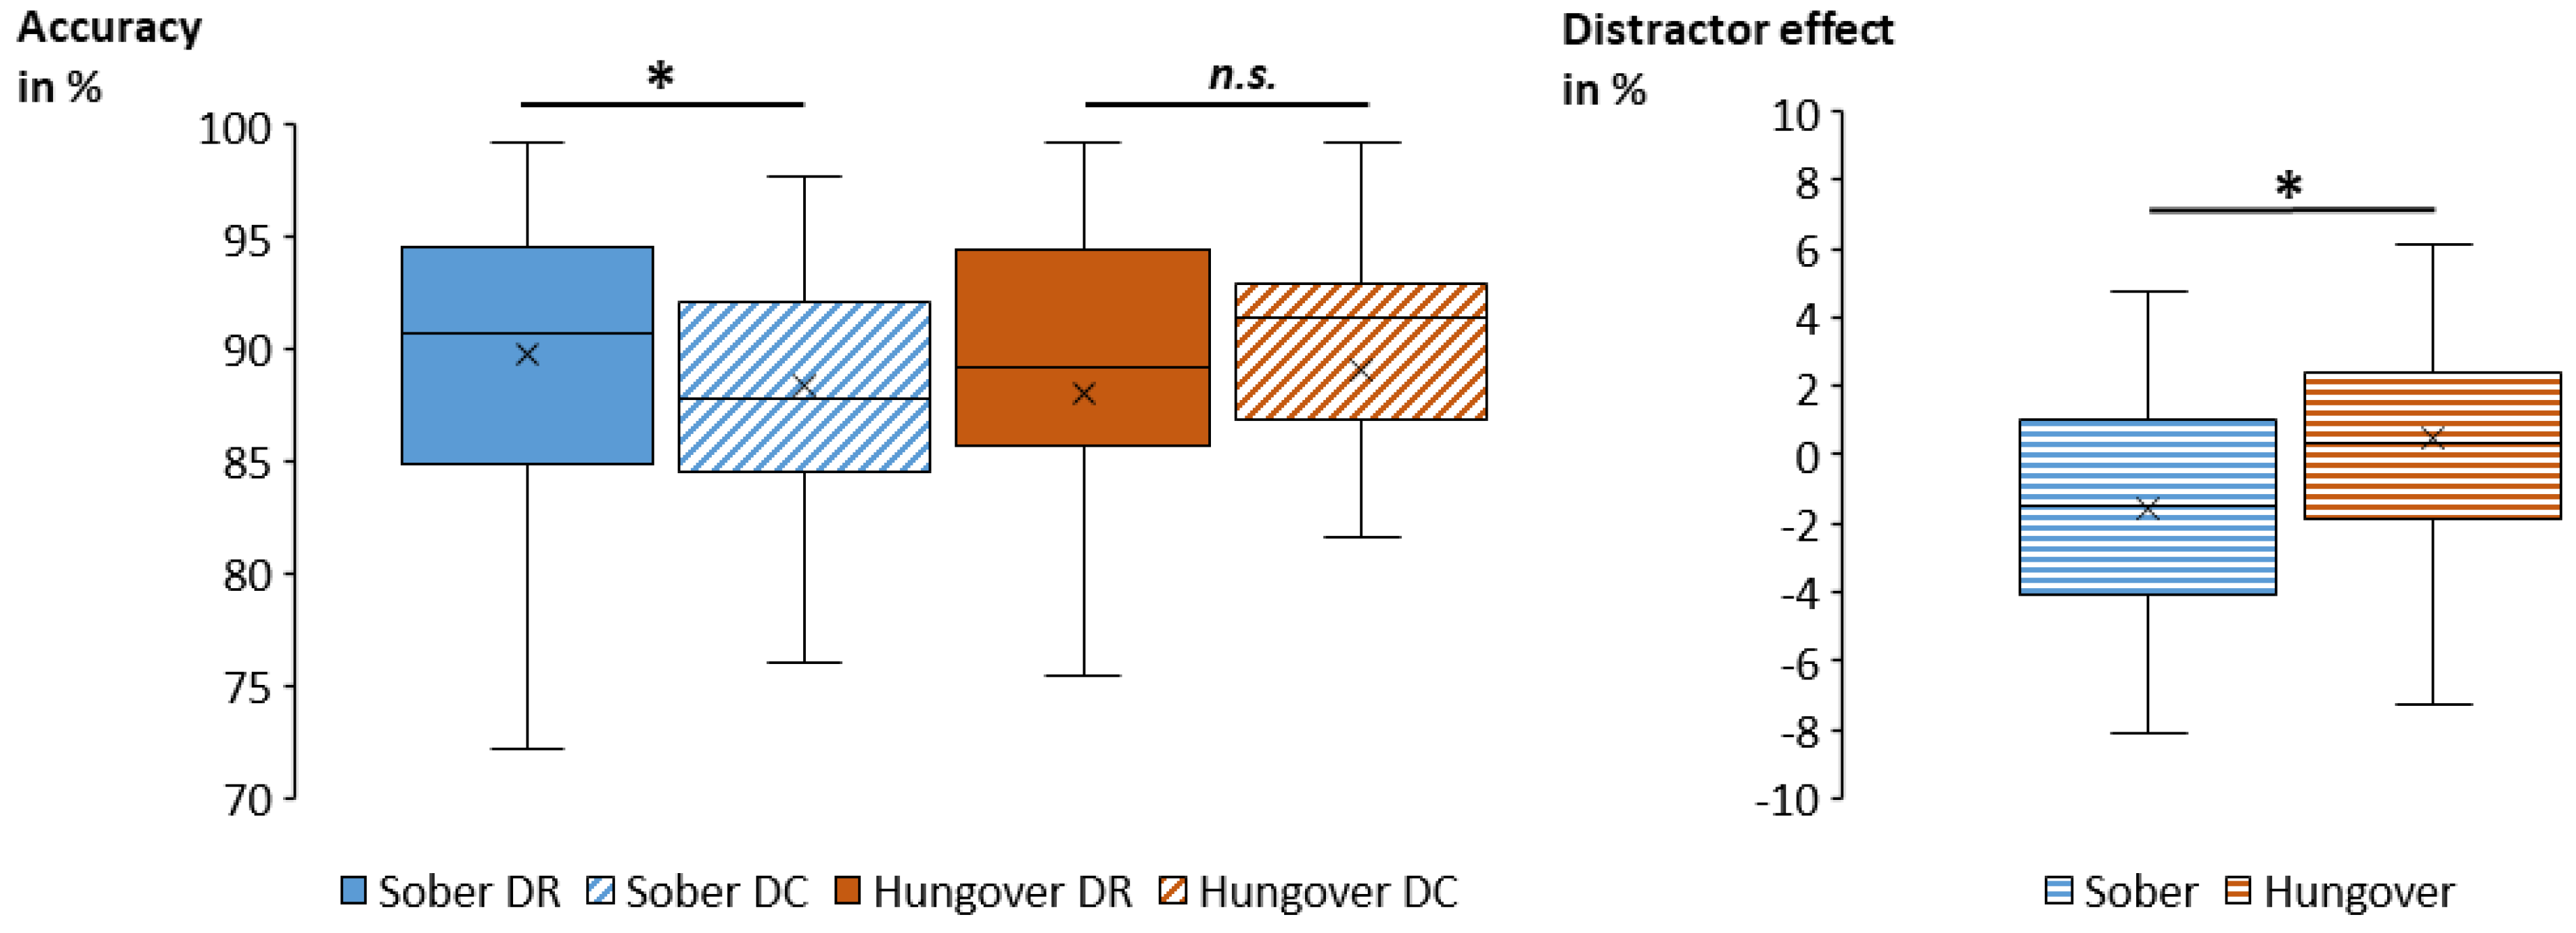
3.2. Behavioral Data
4. Discussion
Limitations
5. Conclusions
Supplementary Materials
Author Contributions
Funding
Acknowledgments
Conflicts of Interest
References
- Fell, J.C. Approaches for reducing alcohol-impaired driving: Evidence-based legislation, law enforcement strategies, sanctions, and alcohol-control policies. Forensic Sci. Rev. 2019, 31, 161–184. [Google Scholar] [PubMed]
- Ogden, E.J.D.; Moskowitz, H. Effects of alcohol and other drugs on driver performance. Traffic Inj. Prev. 2004, 5, 185–198. [Google Scholar] [CrossRef] [PubMed]
- Lefio, Á.; Bachelet, V.C.; Jiménez-Paneque, R.; Gomolán, P.; Rivas, K. A systematic review of the effectiveness of interventions to reduce motor vehicle crashes and their injuries among the general and working populations. Rev. Panam. Salud Publica Pan Am. J. Public Health 2018, 42, e60. [Google Scholar] [CrossRef]
- Rezaee-Zavareh, M.S.; Salamati, P.; Ramezani-Binabaj, M.; Saeidnejad, M.; Rousta, M.; Shokraneh, F.; Rahimi-Movaghar, V. Alcohol consumption for simulated driving performance: A systematic review. Chin. J. Traumatol. Zhonghua Chuang Shang Za Zhi 2017, 20, 166–172. [Google Scholar] [CrossRef] [PubMed]
- Verster, J.C.; van de Loo, A.J.A.E.; Downey, L.A. Driving while hungover: The necessity of biomarkers of the alcohol hangover state. Curr. Drug Abuse Rev. 2014, 7, 1–2. [Google Scholar] [CrossRef]
- Seppälä, T.; Leino, T.; Linnoila, M.; Huttunen, M.; Ylikahri, R. Effects of hangover on psychomotor skills related to driving: Modification by fructose and glucose. Acta Pharmacol. Toxicol. (Copenh.) 1976, 38, 209–218. [Google Scholar] [CrossRef]
- Rohsenow, D.J.; Howland, J.; Arnedt, J.T.; Almeida, A.B.; Greece, J.; Minsky, S.; Kempler, C.S.; Sales, S. Intoxication with Bourbon Versus Vodka: Effects on Hangover, Sleep, and Next-Day Neurocognitive Performance in Young Adults. Alcohol. Clin. Exp. Res. 2010, 34, 509–518. [Google Scholar] [CrossRef]
- Verster, J.C.; Maarel, M.A.V.D.; McKinney, A.; Olivier, B.; Haan, L.D. Driving During Alcohol Hangover Among Dutch Professional Truck Drivers. Traffic Inj. Prev. 2014, 15, 434–438. [Google Scholar] [CrossRef]
- Verster, J.C.; Bervoets, A.C.; de Klerk, S.; Vreman, R.A.; Olivier, B.; Roth, T.; Brookhuis, K.A. Effects of alcohol hangover on simulated highway driving performance. Psychopharmacology (Berl.) 2014, 231, 2999–3008. [Google Scholar] [CrossRef]
- Høiseth, G.; Fosen, J.T.; Liane, V.; Bogstrand, S.T.; Mørland, J. Alcohol hangover as a cause of impairment in apprehended drivers. Traffic Inj. Prev. 2015, 16, 323–328. [Google Scholar] [CrossRef]
- Mackus, M.; Griffin, C.; Munafò, M.R.; Adams, S. A systematic review of the next-day effects of heavy alcohol consumption on cognitive performance. Addiction 2018, 113, 2182–2193. [Google Scholar]
- Mackus, M.; van de Loo, A.J.A.E.; Raasveld, S.J.; Hogewoning, A.; Sastre Toraño, J.; Flesch, F.M.; Korte-Bouws, G.A.H.; van Neer, R.H.P.; Wang, X.; Nguyen, T.T.; et al. Biomarkers of the alcohol hangover state: Ethyl glucuronide (EtG) and ethyl sulfate (EtS). Hum. Psychopharmacol. Clin. Exp. 2017, 32, e2624. [Google Scholar] [CrossRef]
- van Schrojenstein Lantman, M.; van de Loo, A.; Mackus, M.; Verster, J. Development of a Definition for the Alcohol Hangover: Consumer Descriptions and Expert Consensus. Curr. Drug Abuse Rev. 2017, 9, 148–154. [Google Scholar] [CrossRef]
- McKinney, A.; Coyle, K.; Verster, J. Direct comparison of the cognitive effects of acute alcohol with the morning after a normal night’s drinking. Hum. Psychopharmacol. 2012, 27, 295–304. [Google Scholar] [CrossRef] [PubMed]
- Karadayian, A.G.; Cutrera, R.A. Alcohol hangover: Type and time-extension of motor function impairments. Behav. Brain Res. 2013, 247, 165–173. [Google Scholar] [CrossRef]
- Shiferaw, B.; Stough, C.; Downey, L. Drivers’ visual scanning impairment under the influences of alcohol and distraction: A literature review. Curr. Drug Abuse Rev. 2014, 7, 174–182. [Google Scholar] [CrossRef]
- Stock, A.-K.; Hoffmann, S.; Beste, C. Effects of binge drinking and hangover on response selection sub-processes-a study using EEG and drift diffusion modeling: Binge-drinking and hangover. Addict. Biol. 2017, 22, 1355–1365. [Google Scholar] [CrossRef]
- Zink, N.; Bensmann, W.; Beste, C.; Stock, A.-K. Alcohol Hangover Increases Conflict Load via Faster Processing of Subliminal Information. Front. Hum. Neurosci. 2018, 12, 316. [Google Scholar] [CrossRef]
- Opitz, A.; Hubert, J.; Beste, C.; Stock, A.-K. Alcohol Hangover Slightly Impairs Response Selection but not Response Inhibition. J. Clin. Med. 2019, 8, 1317. [Google Scholar] [CrossRef]
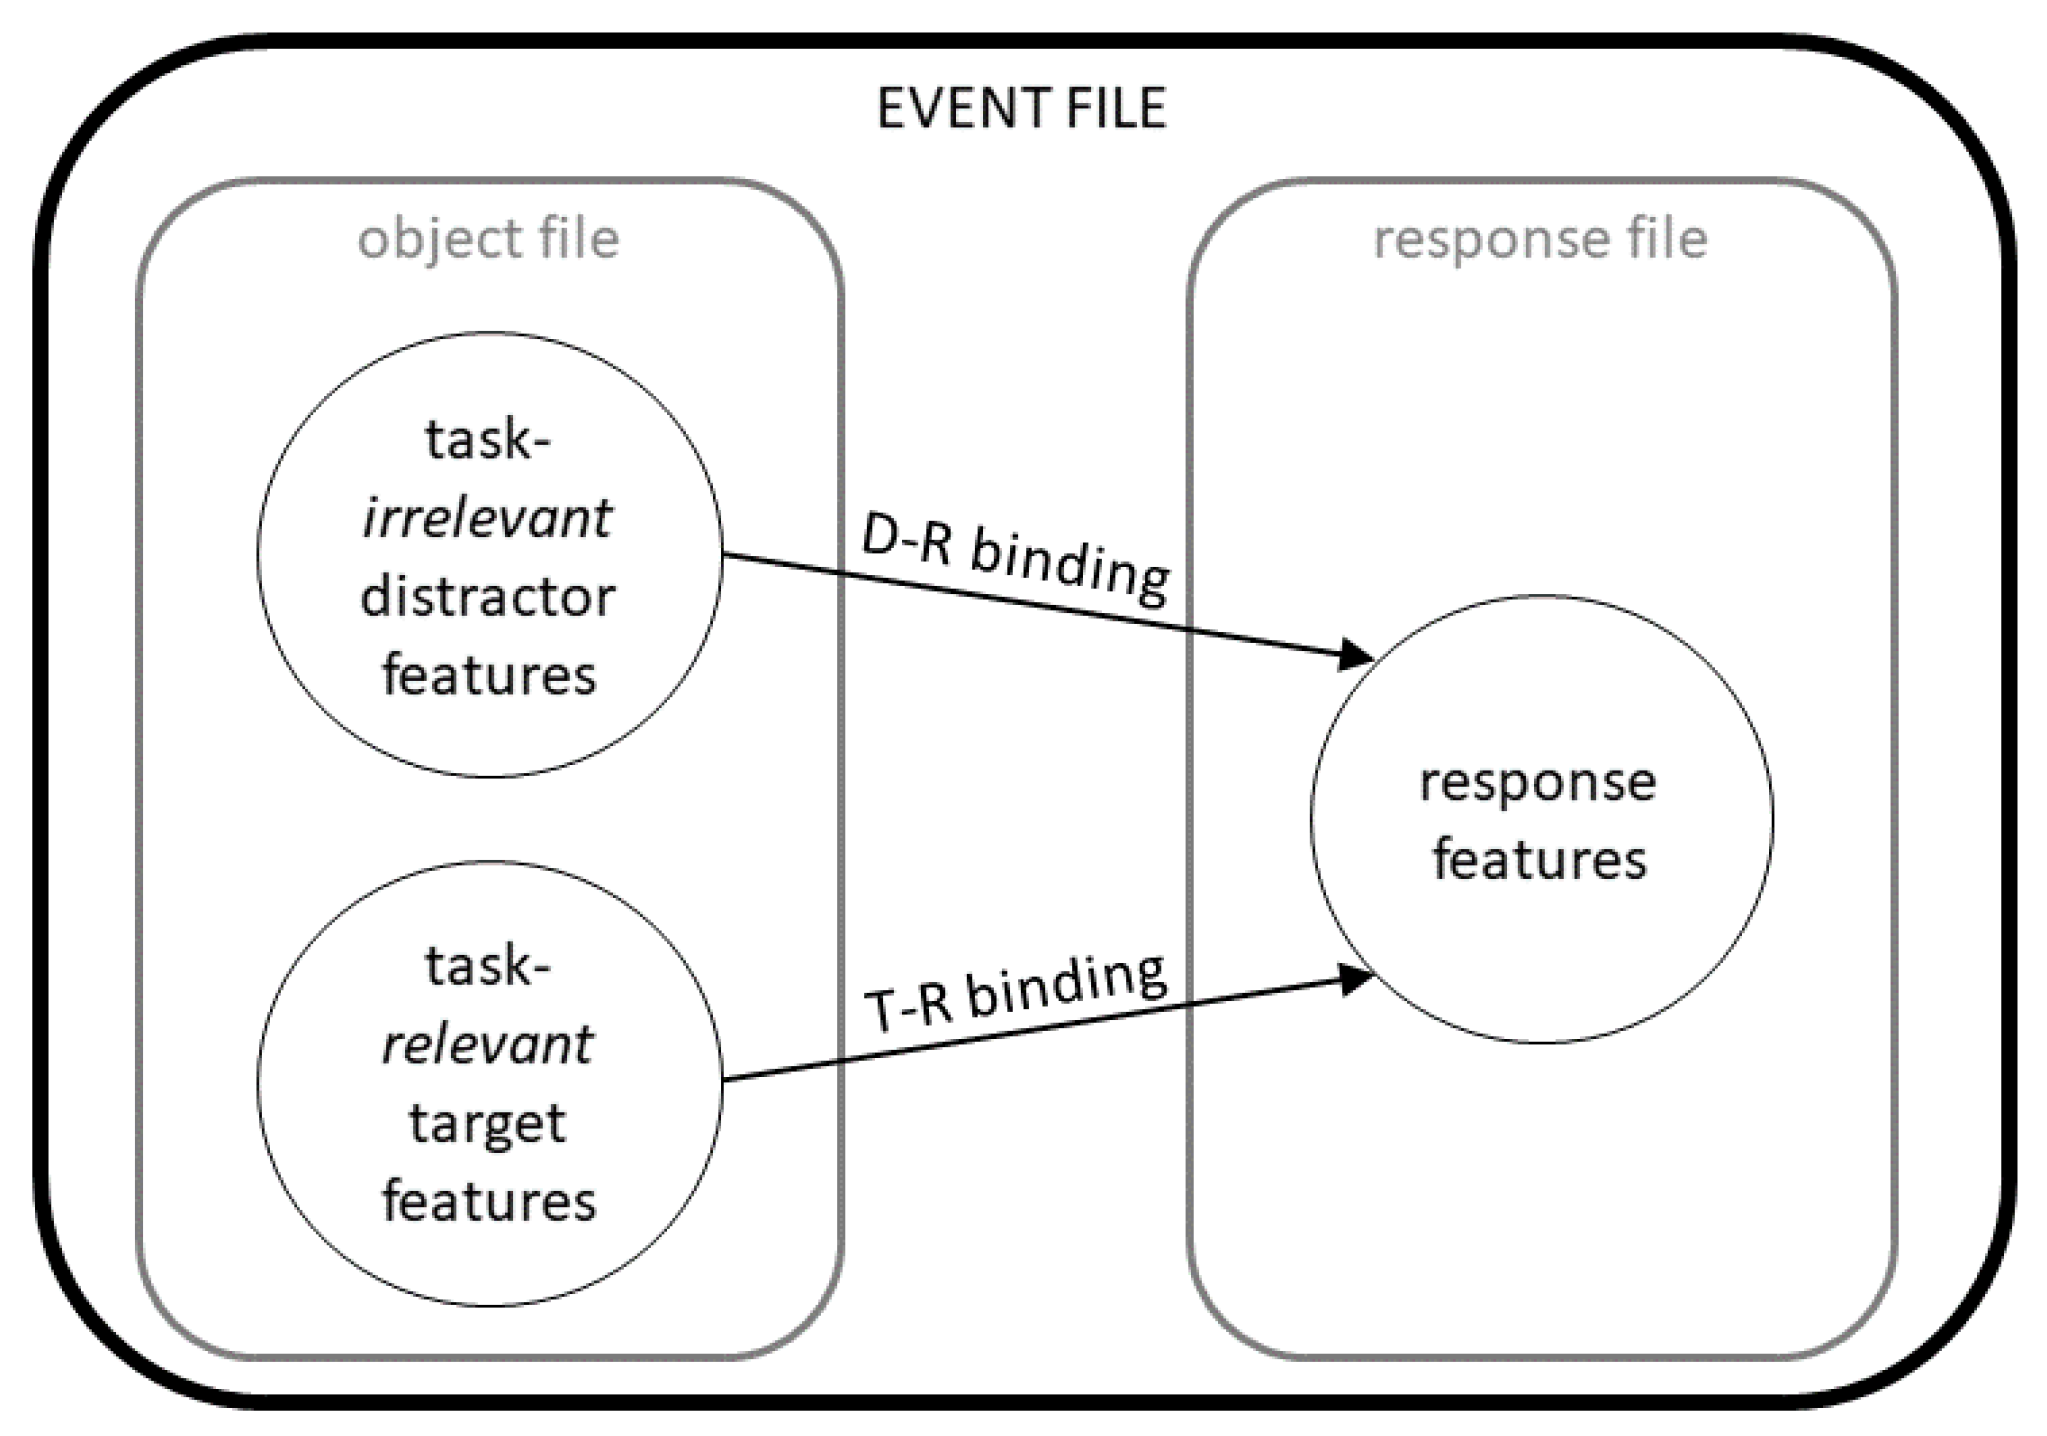
- Hommel, B. Action control according to TEC (theory of event coding). Psychol. Res. Psychol. Forsch. 2009, 73, 512–526. [Google Scholar] [CrossRef]
- Hommel, B. How Much Attention Does an Event File Need? J. Exp. Psychol. Hum. Percept. Perform. 2005, 31, 1067–1082. [Google Scholar] [CrossRef]
- Stock, A.-K.; Bensmann, W.; Zink, N.; Münchau, A.; Beste, C. Automatic aspects of response selection remain unchanged during high-dose alcohol intoxication. Addict. Biol. 2019, e12852. [Google Scholar] [CrossRef]
- Martí-Prats, L.; Sánchez-Catalán, M.J.; Orrico, A.; Zornoza, T.; Polache, A.; Granero, L. Opposite motor responses elicited by ethanol in the posterior VTA: The role of acetaldehyde and the non-metabolized fraction of ethanol. Neuropharmacology 2013, 72, 204–214. [Google Scholar] [CrossRef] [PubMed]
- Prat, G.; Adan, A.; Sánchez-Turet, M. Alcohol hangover: A critical review of explanatory factors. Hum. Psychopharmacol. Clin. Exp. 2009, 24, 259–267. [Google Scholar] [CrossRef]
- Wiese, J.G.; Shlipak, M.G.; Browner, W.S. The alcohol hangover. Ann. Intern. Med. 2000, 132, 897–902. [Google Scholar] [CrossRef]
- Le Daré, B.; Lagente, V.; Gicquel, T. Ethanol and its metabolites: Update on toxicity, benefits, and focus on immunomodulatory effects. Drug Metab. Rev. 2019, 51, 545–561. [Google Scholar] [CrossRef]
- Tipple, C.T.; Benson, S.; Scholey, A. A Review of the Physiological Factors Associated with Alcohol Hangover. Curr. Drug Abuse Rev. 2017, 9, 93–98. [Google Scholar] [CrossRef]
- Klapp, S.T. One version of direct response priming requires automatization of the relevant associations but not awareness of the prime. Conscious. Cogn. 2015, 34, 163–175. [Google Scholar] [CrossRef]
- Moeller, B.; Schächinger, H.; Frings, C. Irrelevant Stimuli and Action Control: Analyzing the Influence of Ignored Stimuli via the Distractor-Response Binding Paradigm. J. Vis. Exp. 2014, 51571. [Google Scholar] [CrossRef]
- Opitz, A.; Beste, C.; Stock, A.-K. Using temporal EEG signal decomposition to identify specific neurophysiological correlates of distractor-response bindings proposed by the theory of event coding. NeuroImage 2020, 209, 116524. [Google Scholar] [CrossRef]
- World Health Organization. AUDIT: The Alcohol Use Disorders Identification Test: Guidelines for use in primary care/Thomas F. Babor... [et al.], 2nd ed. Available online: https://apps.who.int/iris/handle/10665/67205 (accessed on 5 March 2020).
- Dybek, I.; Bischof, G.; Grothues, J.; Reinhardt, S.; Meyer, C.; Hapke, U.; John, U.; Broocks, A.; Hohagen, F.; Rumpf, H.-J. The Reliability and Validity of the Alcohol Use Disorders Identification Test (AUDIT) in a German General Practice Population Sample. J. Stud. Alcohol 2006, 67, 473–481. [Google Scholar] [CrossRef]
- Montgomery, C.; Fisk, J.E.; Murphy, P.N.; Ryland, I.; Hilton, J. The effects of heavy social drinking on executive function: A systematic review and meta-analytic study of existing literature and new empirical findings: EXECUTIVE FUNCTION AND ALCOHOL USE. Hum. Psychopharmacol. Clin. Exp. 2012, 27, 187–199. [Google Scholar] [CrossRef] [PubMed]
- Bensmann, W.; Kayali, Ö.F.; Beste, C.; Stock, A.-K. Young frequent binge drinkers show no behavioral deficits in inhibitory control and cognitive flexibility. Prog. Neuropsychopharmacol. Biol. Psychiatry 2019, 93, 93–101. [Google Scholar] [CrossRef]
- van Schrojenstein Lantman, M.; Mackus, M.; Roth, T.; Verster, J. Total sleep time, alcohol consumption, and the duration and severity of alcohol hangover. Nat. Sci. Sleep 2017, 9, 181–186. [Google Scholar] [CrossRef]
- Widmark, E.M.P. Die Theoretischen Grundlagen Und Die Praktische Verwendbarkeit Der Gerichtlich-Medizinischen Alkoholbestimmung; Urban und Schwarzenberg: Berlin, Germany, 1932. [Google Scholar]
- Watson, P.E.; Watson, I.D.; Batt, R.D. Total body water volumes for adult males and females estimated from simple anthropometric measurements. Am. J. Clin. Nutr. 1980, 33, 27–39. [Google Scholar] [CrossRef] [PubMed]
- Epler, A.J.; Tomko, R.L.; Piasecki, T.M.; Wood, P.K.; Sher, K.J.; Shiffman, S.; Heath, A.C. Does Hangover Influence the Time to Next Drink? An Investigation Using Ecological Momentary Assessment. Alcohol. Clin. Exp. Res. 2014, 38, 1461–1469. [Google Scholar] [CrossRef] [PubMed][Green Version]
- Jackson, K.M.; Rohsenow, D.J.; Piasecki, T.M.; Howland, J.; Richardson, A.E. Role of Tobacco Smoking in Hangover Symptoms Among University Students. J. Stud. Alcohol Drugs 2013, 74, 41–49. [Google Scholar] [CrossRef]
- Beck, A.T. An Inventory for Measuring Depression. Arch. Gen. Psychiatry 1961, 4, 561. [Google Scholar] [CrossRef]
- Fleming, K.A.; Bartholow, B.D.; Hilgard, J.; McCarthy, D.M.; O’Neill, S.E.; Steinley, D.; Sher, K.J. The Alcohol Sensitivity Questionnaire: Evidence for Construct Validity. Alcohol. Clin. Exp. Res. 2016, 40, 880–888. [Google Scholar] [CrossRef]
- Colzato, L.S.; Warrens, M.J.; Hommel, B. Priming and binding in and across perception and action: A correlational analysis of the internal structure of event files. Q. J. Exp. Psychol. 2006, 59, 1785–1804. [Google Scholar] [CrossRef]
- Hommel, B.; Müsseler, J.; Aschersleben, G.; Prinz, W. The Theory of Event Coding (TEC): A framework for perception and action planning. Behav. Brain Sci. 2001, 24, 849–937. [Google Scholar] [CrossRef] [PubMed]
- Frings, C.; Rothermund, K.; Wentura, D. Distractor repetitions retrieve previous responses to targets. Q. J. Exp. Psychol. 2007, 60, 1367–1377. [Google Scholar] [CrossRef] [PubMed]
- Hommel, B.; Colzato, L. Visual attention and the temporal dynamics of feature integration. Vis. Cogn. 2004, 11, 483–521. [Google Scholar] [CrossRef]
- Petruo, V.A.; Stock, A.-K.; Münchau, A.; Beste, C. A systems neurophysiology approach to voluntary event coding. NeuroImage 2016, 135, 324–332. [Google Scholar] [CrossRef]
- Devenney, L.E.; Coyle, K.B.; Verster, J.C. Memory and attention during an alcohol hangover. Hum. Psychopharmacol. Clin. Exp. 2019, 34, e2701. [Google Scholar] [CrossRef]
- McKinney, A.; Coyle, K.; Penning, R.; Verster, J.C. Next day effects of naturalistic alcohol consumption on tasks of attention. Hum. Psychopharmacol. Clin. Exp. 2012, 27, 587–594. [Google Scholar] [CrossRef]
- Verster, J.C.; van de Loo, A.J.A.E.; Adams, S.; Stock, A.-K.; Benson, S.; Scholey, A.; Alford, C.; Bruce, G. Advantages and Limitations of Naturalistic Study Designs and Their Implementation in Alcohol Hangover Research. J. Clin. Med. 2019, 8, 2160. [Google Scholar] [CrossRef]
- van Lawick van Pabst, A.E.; Devenney, L.E.; Verster, J.C. Sex Differences in the Presence and Severity of Alcohol Hangover Symptoms. J. Clin. Med. 2019, 8, 867. [Google Scholar] [CrossRef]
- Tolstrup, J.S.; Stephens, R.; Grønbaek, M. Does the Severity of Hangovers Decline with Age? Survey of the Incidence of Hangover in Different Age Groups. Alcohol. Clin. Exp. Res. 2014, 38, 466–470. [Google Scholar] [CrossRef]
- Thumin, F.; Wims, E. The Perception of the Common Cold, and other Ailments and Discomforts, as Related to Age. Int. J. Aging Hum. Dev. 1975, 6, 43–49. [Google Scholar] [CrossRef]


| Characteristic | Included Sample (n = 35) |
|---|---|
| Age in years | 23.14 ± 0.47 (19–28) |
| Height in cm | 181.89 ± 0.98 (170–195) |
| Weight in kg | 76.87 ± 1.69 (63–105) |
| Cigarettes smoked per day | 0.78 ± 0.37 (0–10) |
| Hours of sport per week | 4.63 ± 0.56 (0–16) |
| BDI score | 3.37 ± 0.69 (0–19) |
| AUDIT score | 10.26 ± 0.58 (5–19) |
| ASQ total score | 8.23 ± 0.40 (3.25–13.29) |
| ASQlight score | 5.16 ± 0.30 (1.63–9.25) |
| ASQheavy score | 13.17 ± 0.78 (5.20–24.0) |
| Individual alcohol amount indicated in mL of brandy (36 vol %) | 418.00 ± 5.81 (369–516) |
| Alcohol consumption duration in minutes | 181.43 ± 4.29 (111–243) |
| BrAC 30 min after end of consumption | 1.32 ± 0.03 (1.05–1.69) |
| BrAC 60 min after end of consumption | 1.24 ± 0.02 (1.01–1.56) |
| BrAC 90 min after end of consumption | 1.15 ± 0.02 (0.91–1.40) |
| BrAC 120 min after end of consumption | 1.08 ± 0.03 (0.83–1.43) |
| Symptom | Sober | Hangover | Presence at Hangover Session | Difference |
|---|---|---|---|---|
| Hours of sleep in previous night | 7.40 ± 0.15 (5.5–9) | 5.54 ± 0.19 (4–8) | - | p < 0.001 ** |
| Overall hangover severity | 0 ± 0 (0–0) | 3.63 ± 0.39 (0–10) | 94.3% | p < 0.001 ** |
| Thirst | 0.91 ± 0.28 (0–7) | 3.46 ± 0.37 (0–8) | 91.4% | p < 0.001 ** |
| Concentration problems | 0.61 ± 0.18 (0–4) | 3.11 ± 0.37 (0–8) | 88.6% | p < 0.001 ** |
| Tired | 1.12 ± 0.21 (0–4) | 4.57 ± 0.39 (1–10) | 88.6% | p < 0.001 ** |
| Sleepiness | 1.00 ± 0.23 (0–4) | 3.71 ± 0.42 (0–9) | 85.7% | p < 0.001 ** |
| Weakness | 0.30 ± 0.11 (0–2) | 2.31 ± 0.34 (0–10) | 85.7% | p < 0.001 ** |
| Headache | 0.06 ± 0.04 (0–1) | 2.69 ± 0.38 (0–8) | 82.9% | p < 0.001 ** |
| Clumsy | 0.39 ± 0.15 (0–3) | 1.97 ± 0.32 (0–6) | 71.4% | p < 0.001 ** |
| Dizziness | 0.03 ± 0.03 (0–1) | 1.69 ± 0.27 (0–6) | 71.4% | p < 0.001 ** |
| Sensitivity to light | 0.24 ± 0.12 (0–3) | 1.57 ± 0.32 (0–8) | 60% | p < 0.001 ** |
| Reduced appetite | 0.21 ± 0.16 (0–5) | 1.97 ± 0.41 (0–9) | 57.1% | p = 0.001 ** |
| Sweating | 1.18 ± 0.33 (0–7) | 1.09 ± 0.21 (0–4) | 51.4% | p = 0.784 |
| Nausea | 0.03 ± 0.03 (0–1) | 1.46 ± 0.35 (0–7) | 48.6% | p < 0.001 ** |
| Apathy | 0 ± 0 (0–0) | 0.89 ± 0.20 (0–4) | 48.6% | p < 0.001 ** |
| Shivering | 0.36 ± 0.13 (0–3) | 1.20 ± 0.29 (0–6) | 45.7% | p = 0.010 * |
| Confusion | 0.15 ± 0.08 (0–2) | 0.91 ± 0.22 (0–5) | 45.7% | p < 0.001 ** |
| Heart pounding | 0.30 ± 0.10 (0–2) | 0.94 ± 0.23 (0–5) | 42.9% | p = 0.012 * |
| Stomach pain | 0.24 ± 0.16 (0–5) | 1.06 ± 0.32 (0–7) | 40% | p = 0.012 * |
| Anxiety | 0.39 ± 0.14 (0–3) | 0.94 ± 0.25 (0–5) | 40% | p = 0.028 * |
| Regret | 0.12 ± 0.12 (0–4) | 0.83 ± 0.31 (0–10) | 37.1% | p = 0.003 ** |
| Sleeping problems | 0.21 ± 0.14 (0–4) | 0.91 ± 0.32 (0–8) | 31.4% | p = 0.027 * |
| Depression | 0.21 ± 0.16 (0–5) | 0.66 ± 0.28 (0–9) | 28.6% | p = 0.021 * |
| Vomiting | 0.03 ± 0.03 (0–1) | 0.60 ± 0.28 (0–9) | 22.9% | p = 0.055 |
| Heart racing | 0.15 ± 0.08 (0–2) | 0.57 ± 0.25 (0–6) | 22.9% | p = 0.138 |
© 2020 by the authors. Licensee MDPI, Basel, Switzerland. This article is an open access article distributed under the terms and conditions of the Creative Commons Attribution (CC BY) license (http://creativecommons.org/licenses/by/4.0/).
Share and Cite
Opitz, A.; Beste, C.; Stock, A.-K. Alcohol Hangover Differentially Modulates the Processing of Relevant and Irrelevant Information. J. Clin. Med. 2020, 9, 778. https://doi.org/10.3390/jcm9030778
Opitz A, Beste C, Stock A-K. Alcohol Hangover Differentially Modulates the Processing of Relevant and Irrelevant Information. Journal of Clinical Medicine. 2020; 9(3):778. https://doi.org/10.3390/jcm9030778
Chicago/Turabian StyleOpitz, Antje, Christian Beste, and Ann-Kathrin Stock. 2020. "Alcohol Hangover Differentially Modulates the Processing of Relevant and Irrelevant Information" Journal of Clinical Medicine 9, no. 3: 778. https://doi.org/10.3390/jcm9030778
APA StyleOpitz, A., Beste, C., & Stock, A.-K. (2020). Alcohol Hangover Differentially Modulates the Processing of Relevant and Irrelevant Information. Journal of Clinical Medicine, 9(3), 778. https://doi.org/10.3390/jcm9030778