Deregulation of the Purine Pathway in Pre-Transplant Liver Biopsies Is Associated with Graft Function and Survival after Transplantation

 , ,
, ,
Abstract
1. Introduction
2. Materials and Methods
2.1. Patients and Samples
2.2. Sample Treatment
2.3. Statistics
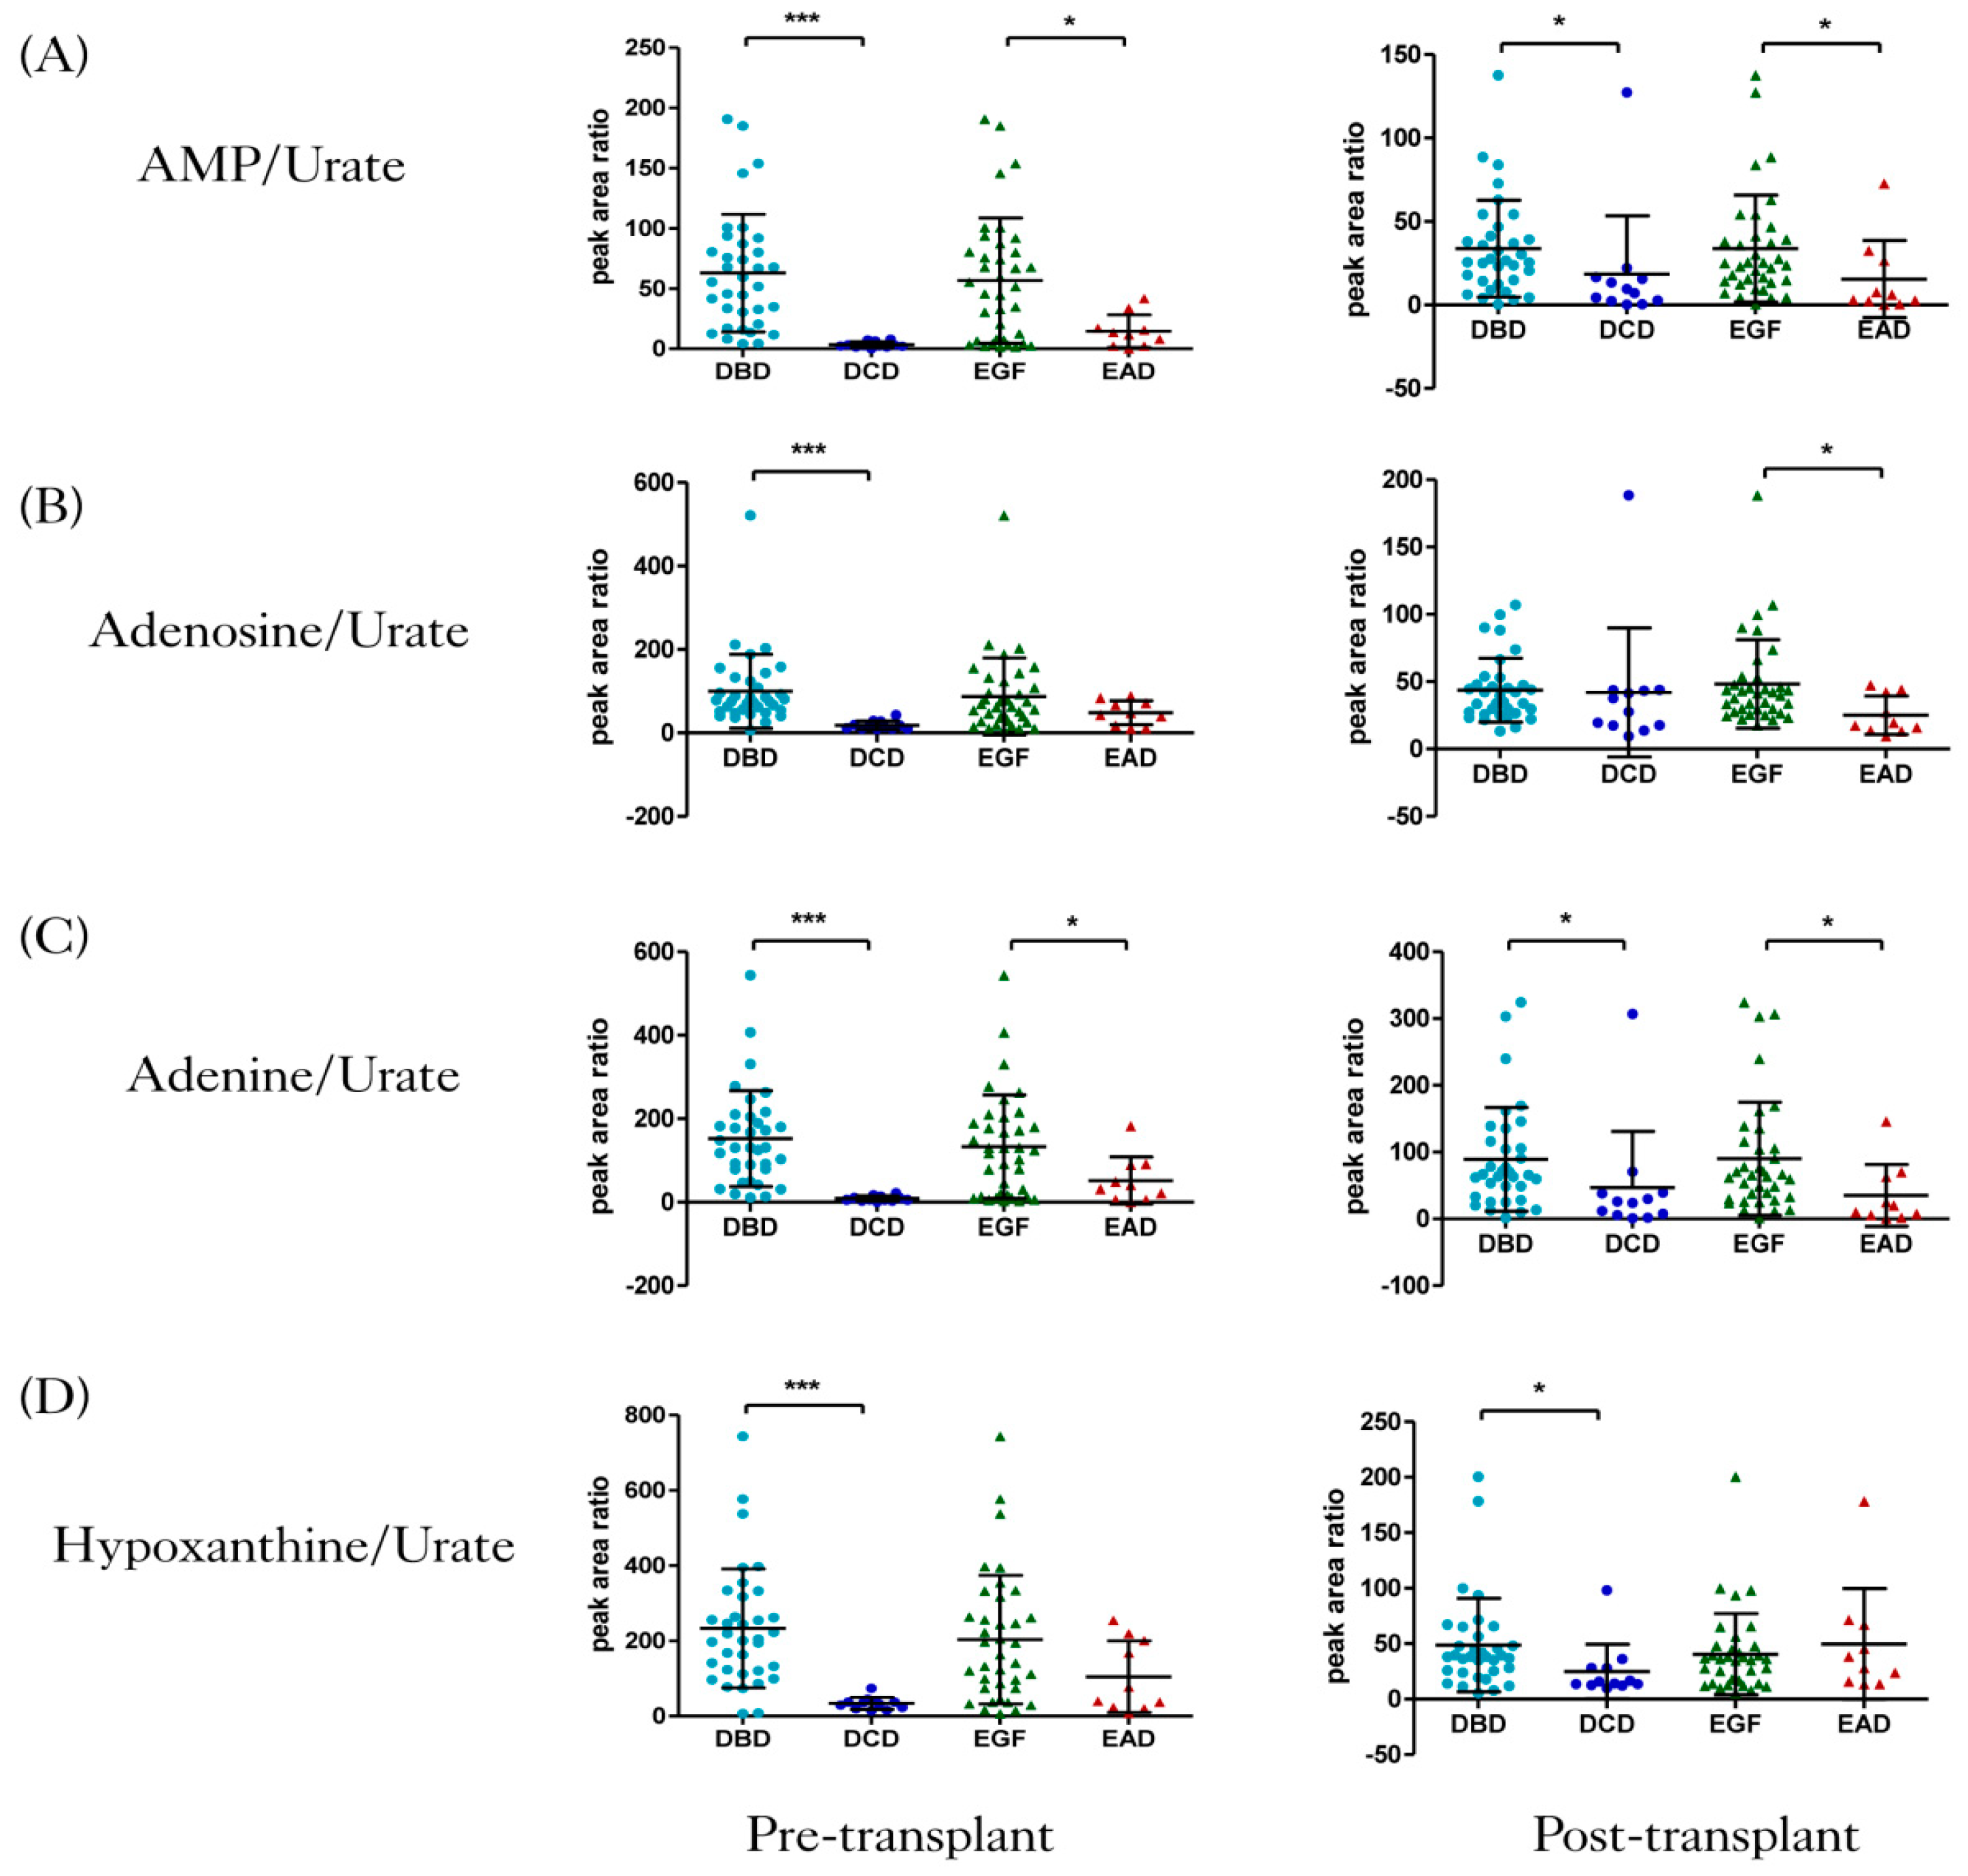
3. Results
3.1. Clinical Outcomes
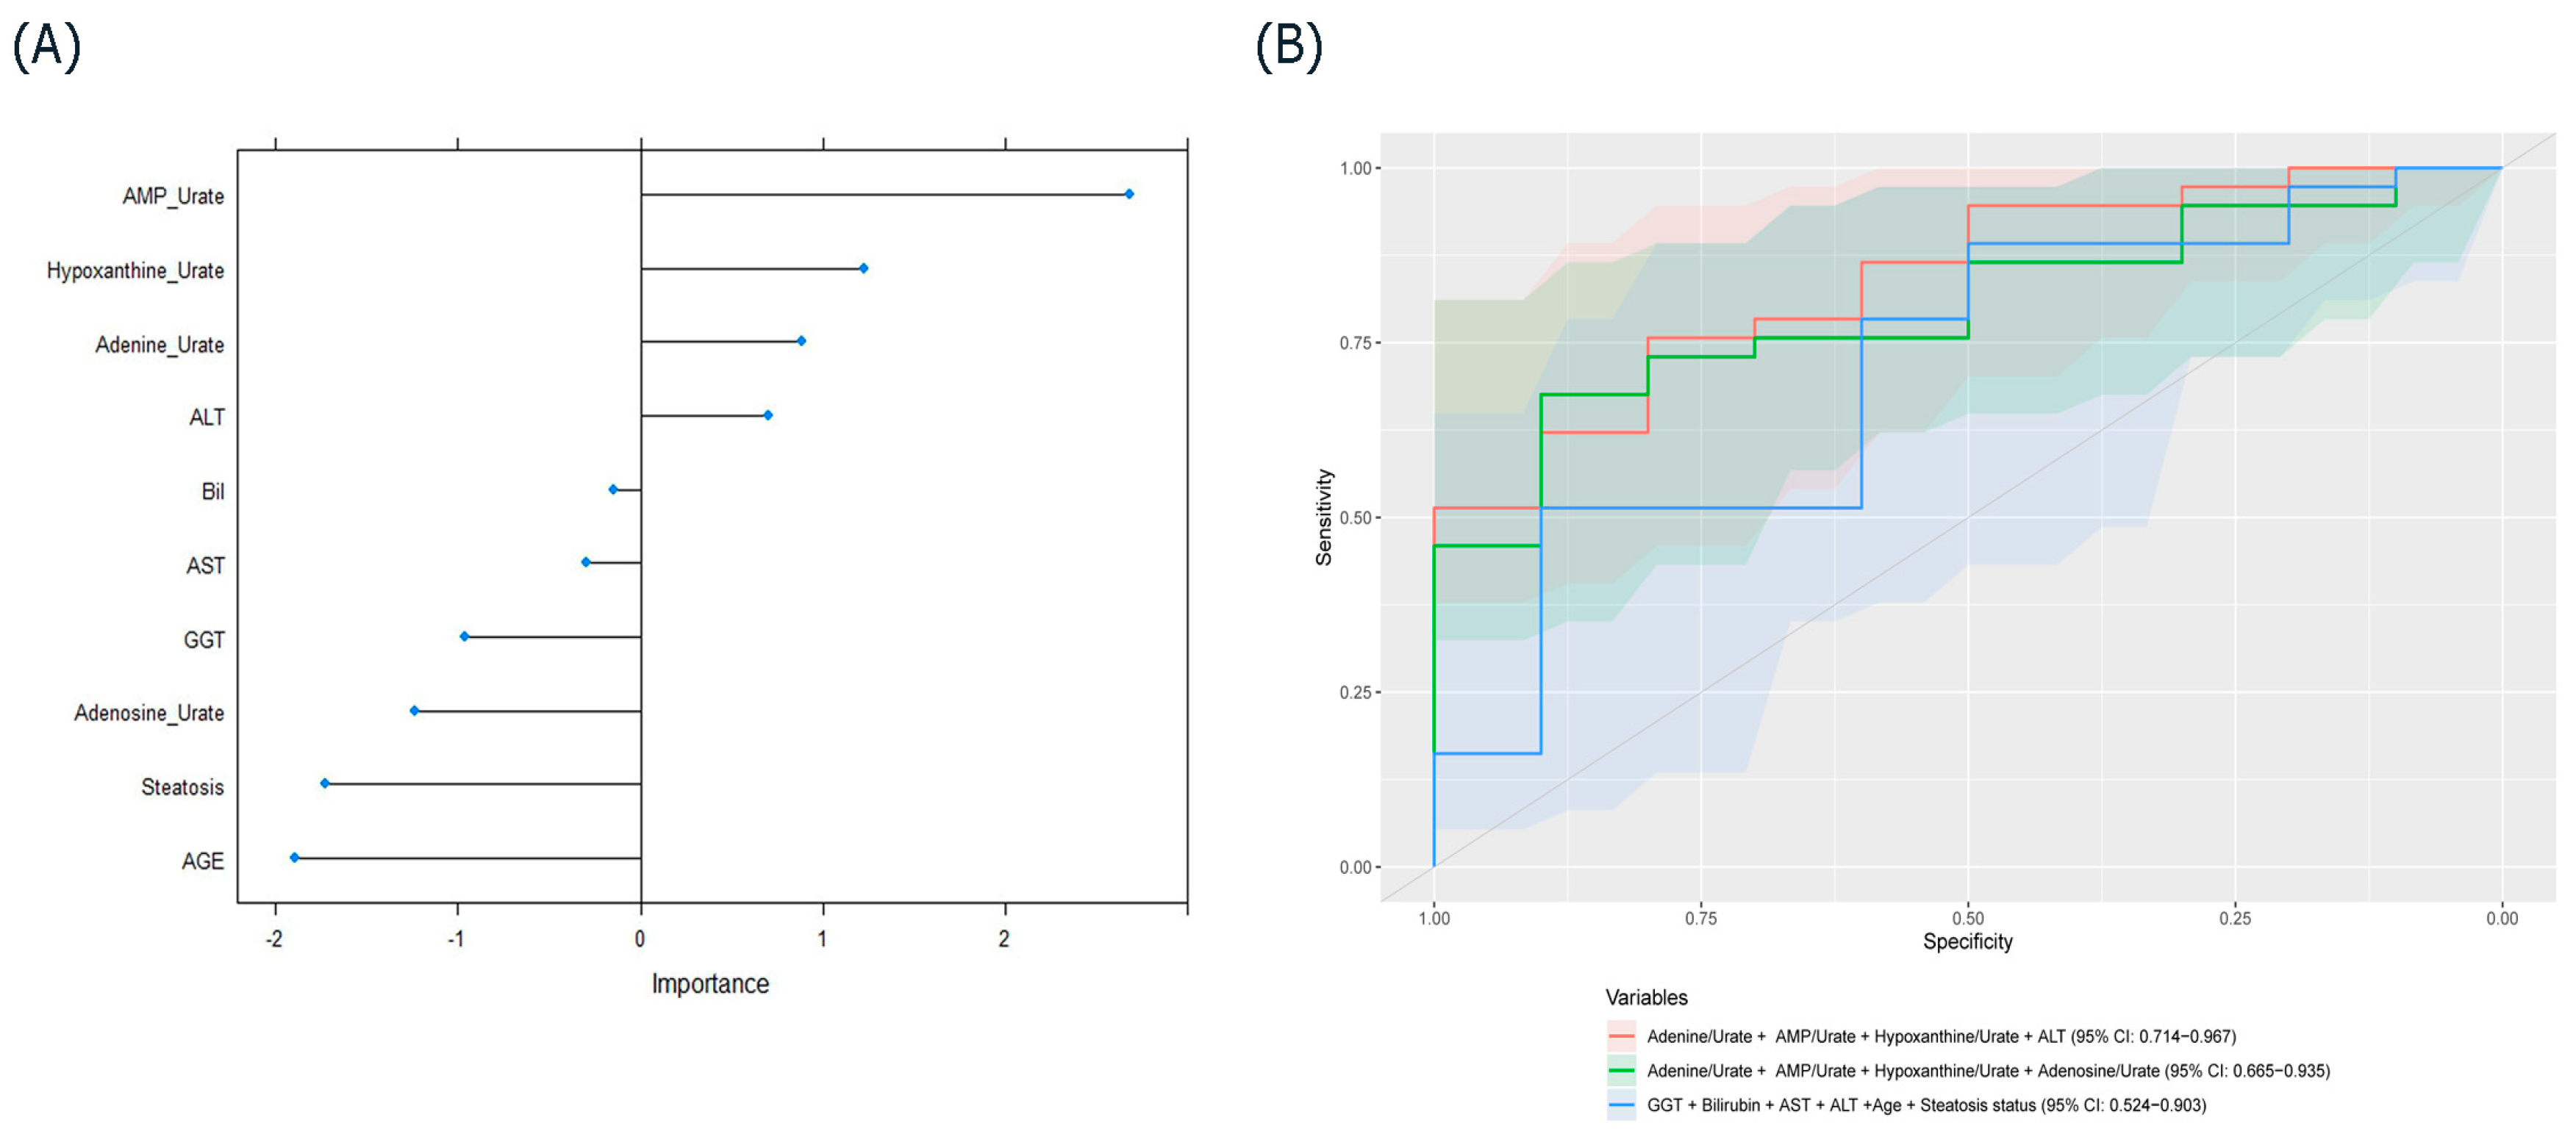
3.2. Multivariate Model and Feature Selection
3.3. Random Forest with Metabolites and Clinical Variables
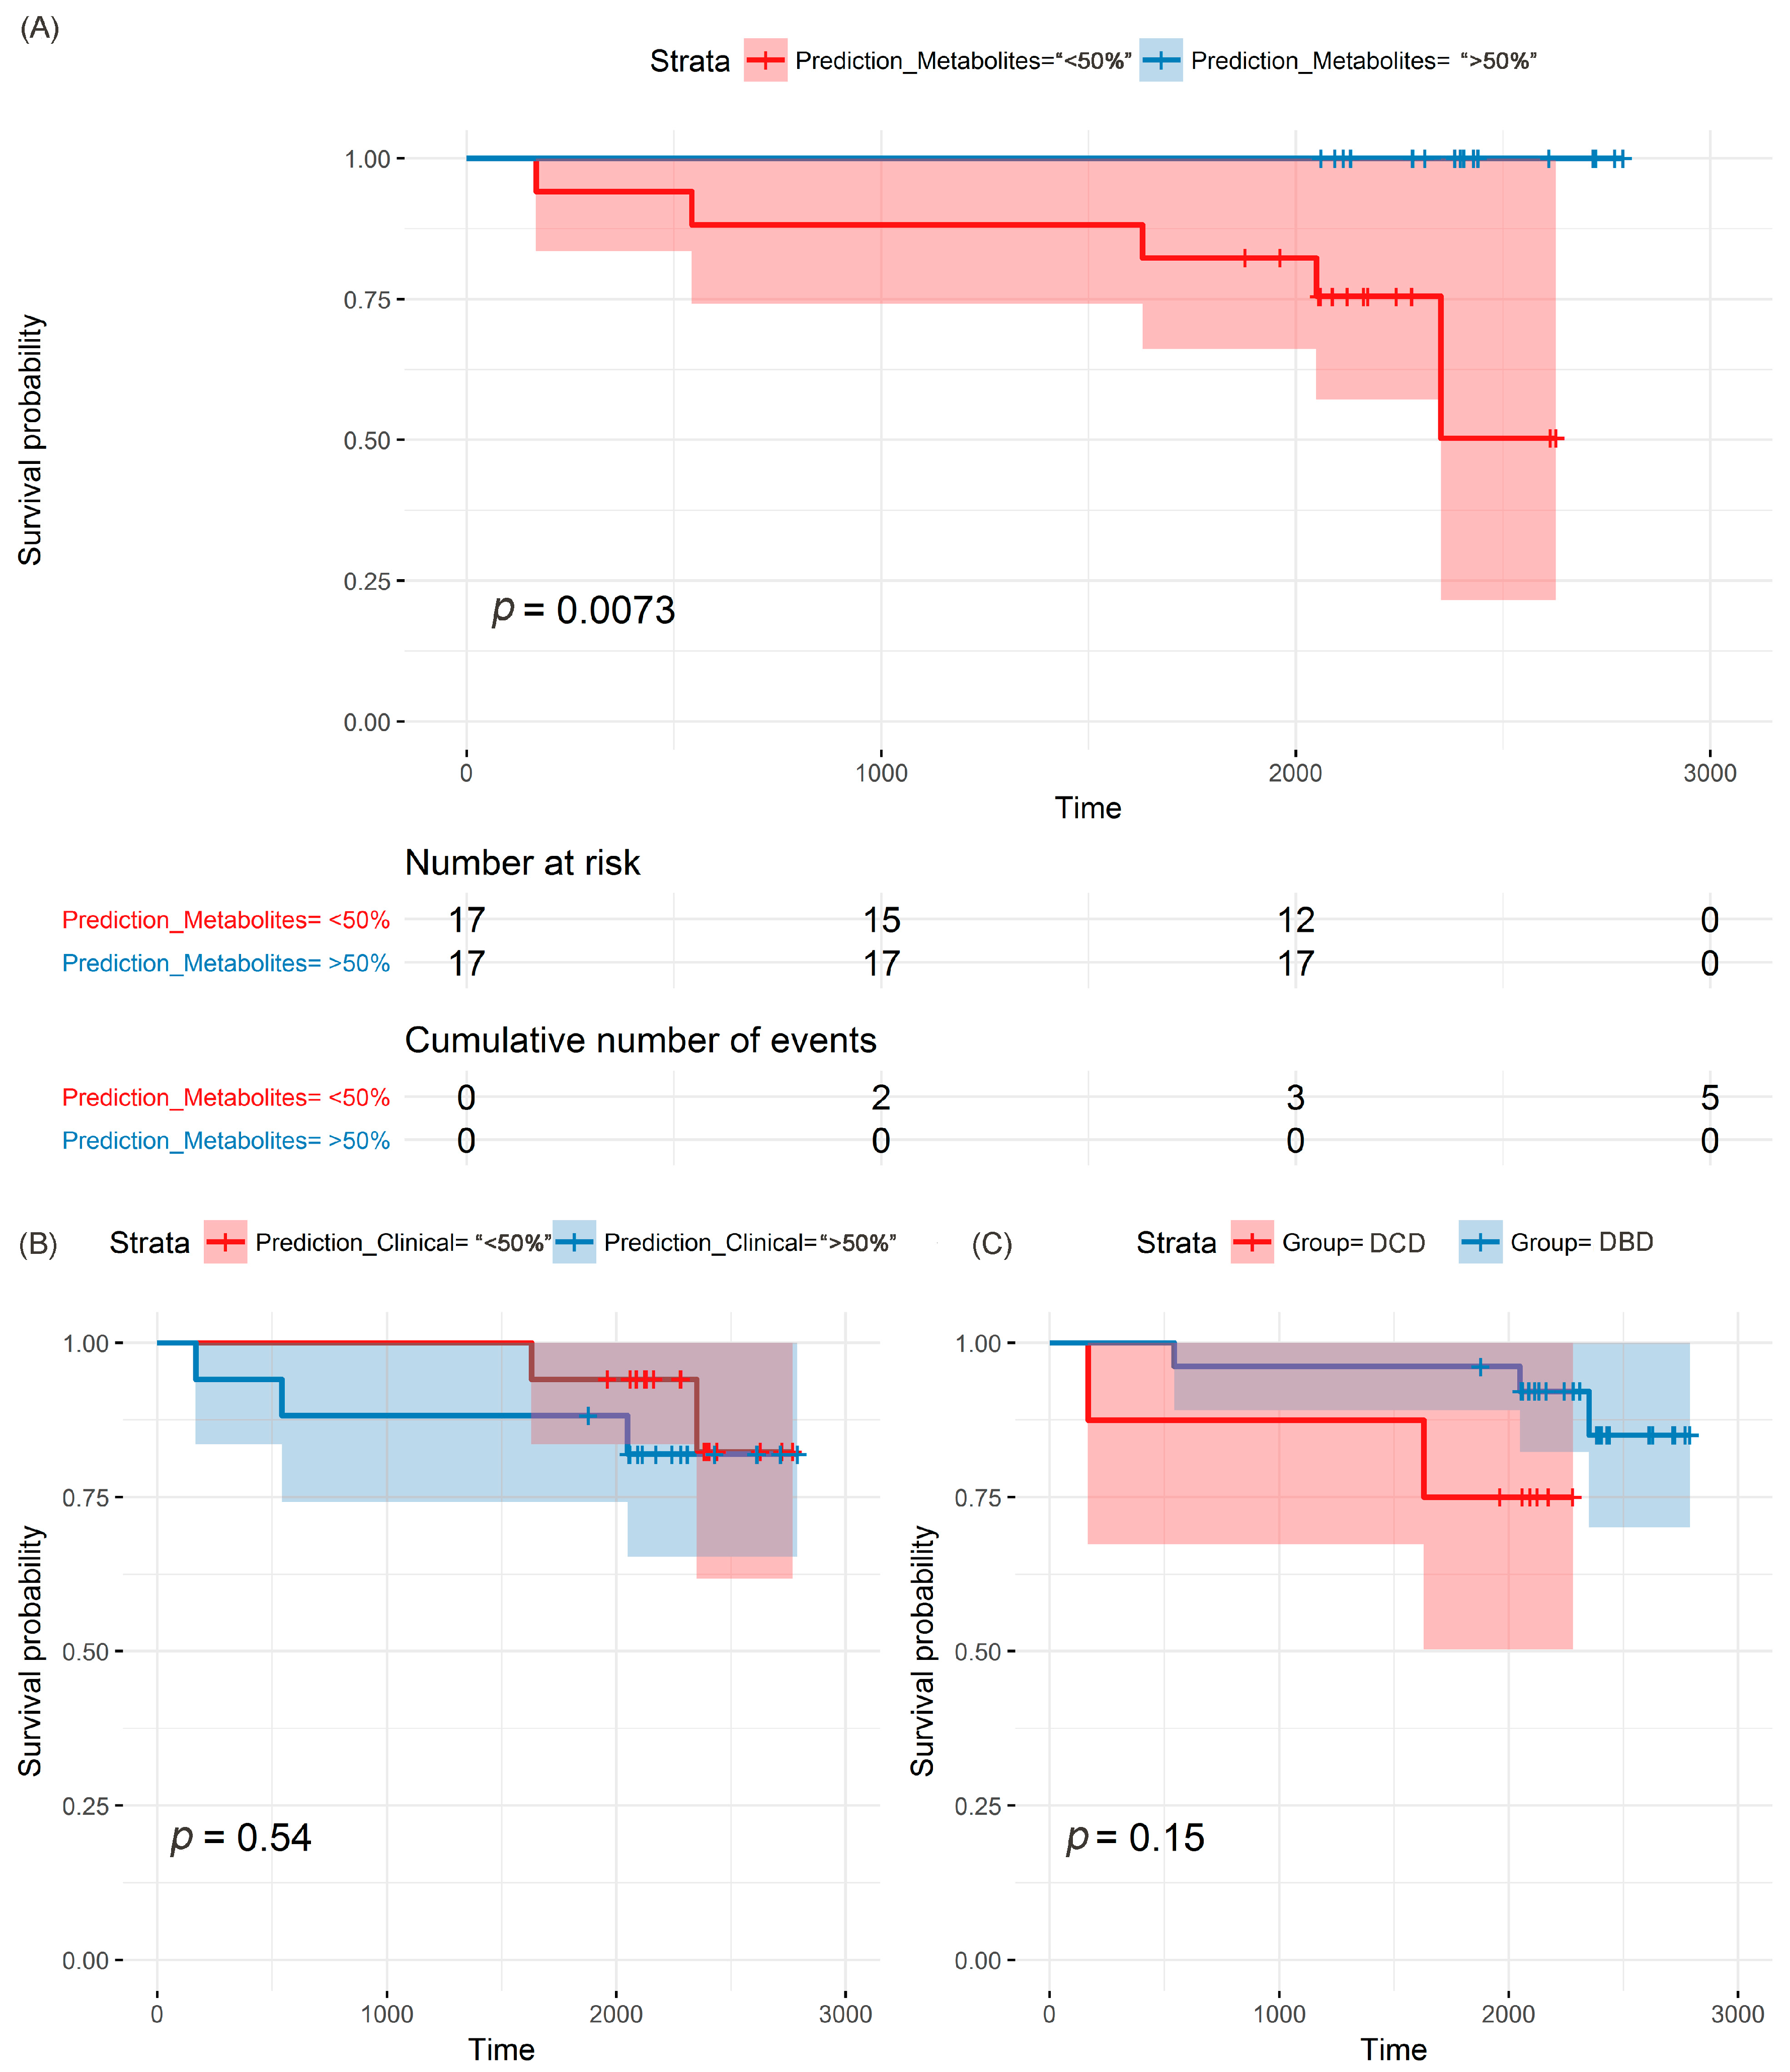
3.4. Survival Analysis Based on Purines, Clinical Variables and Donation Groups
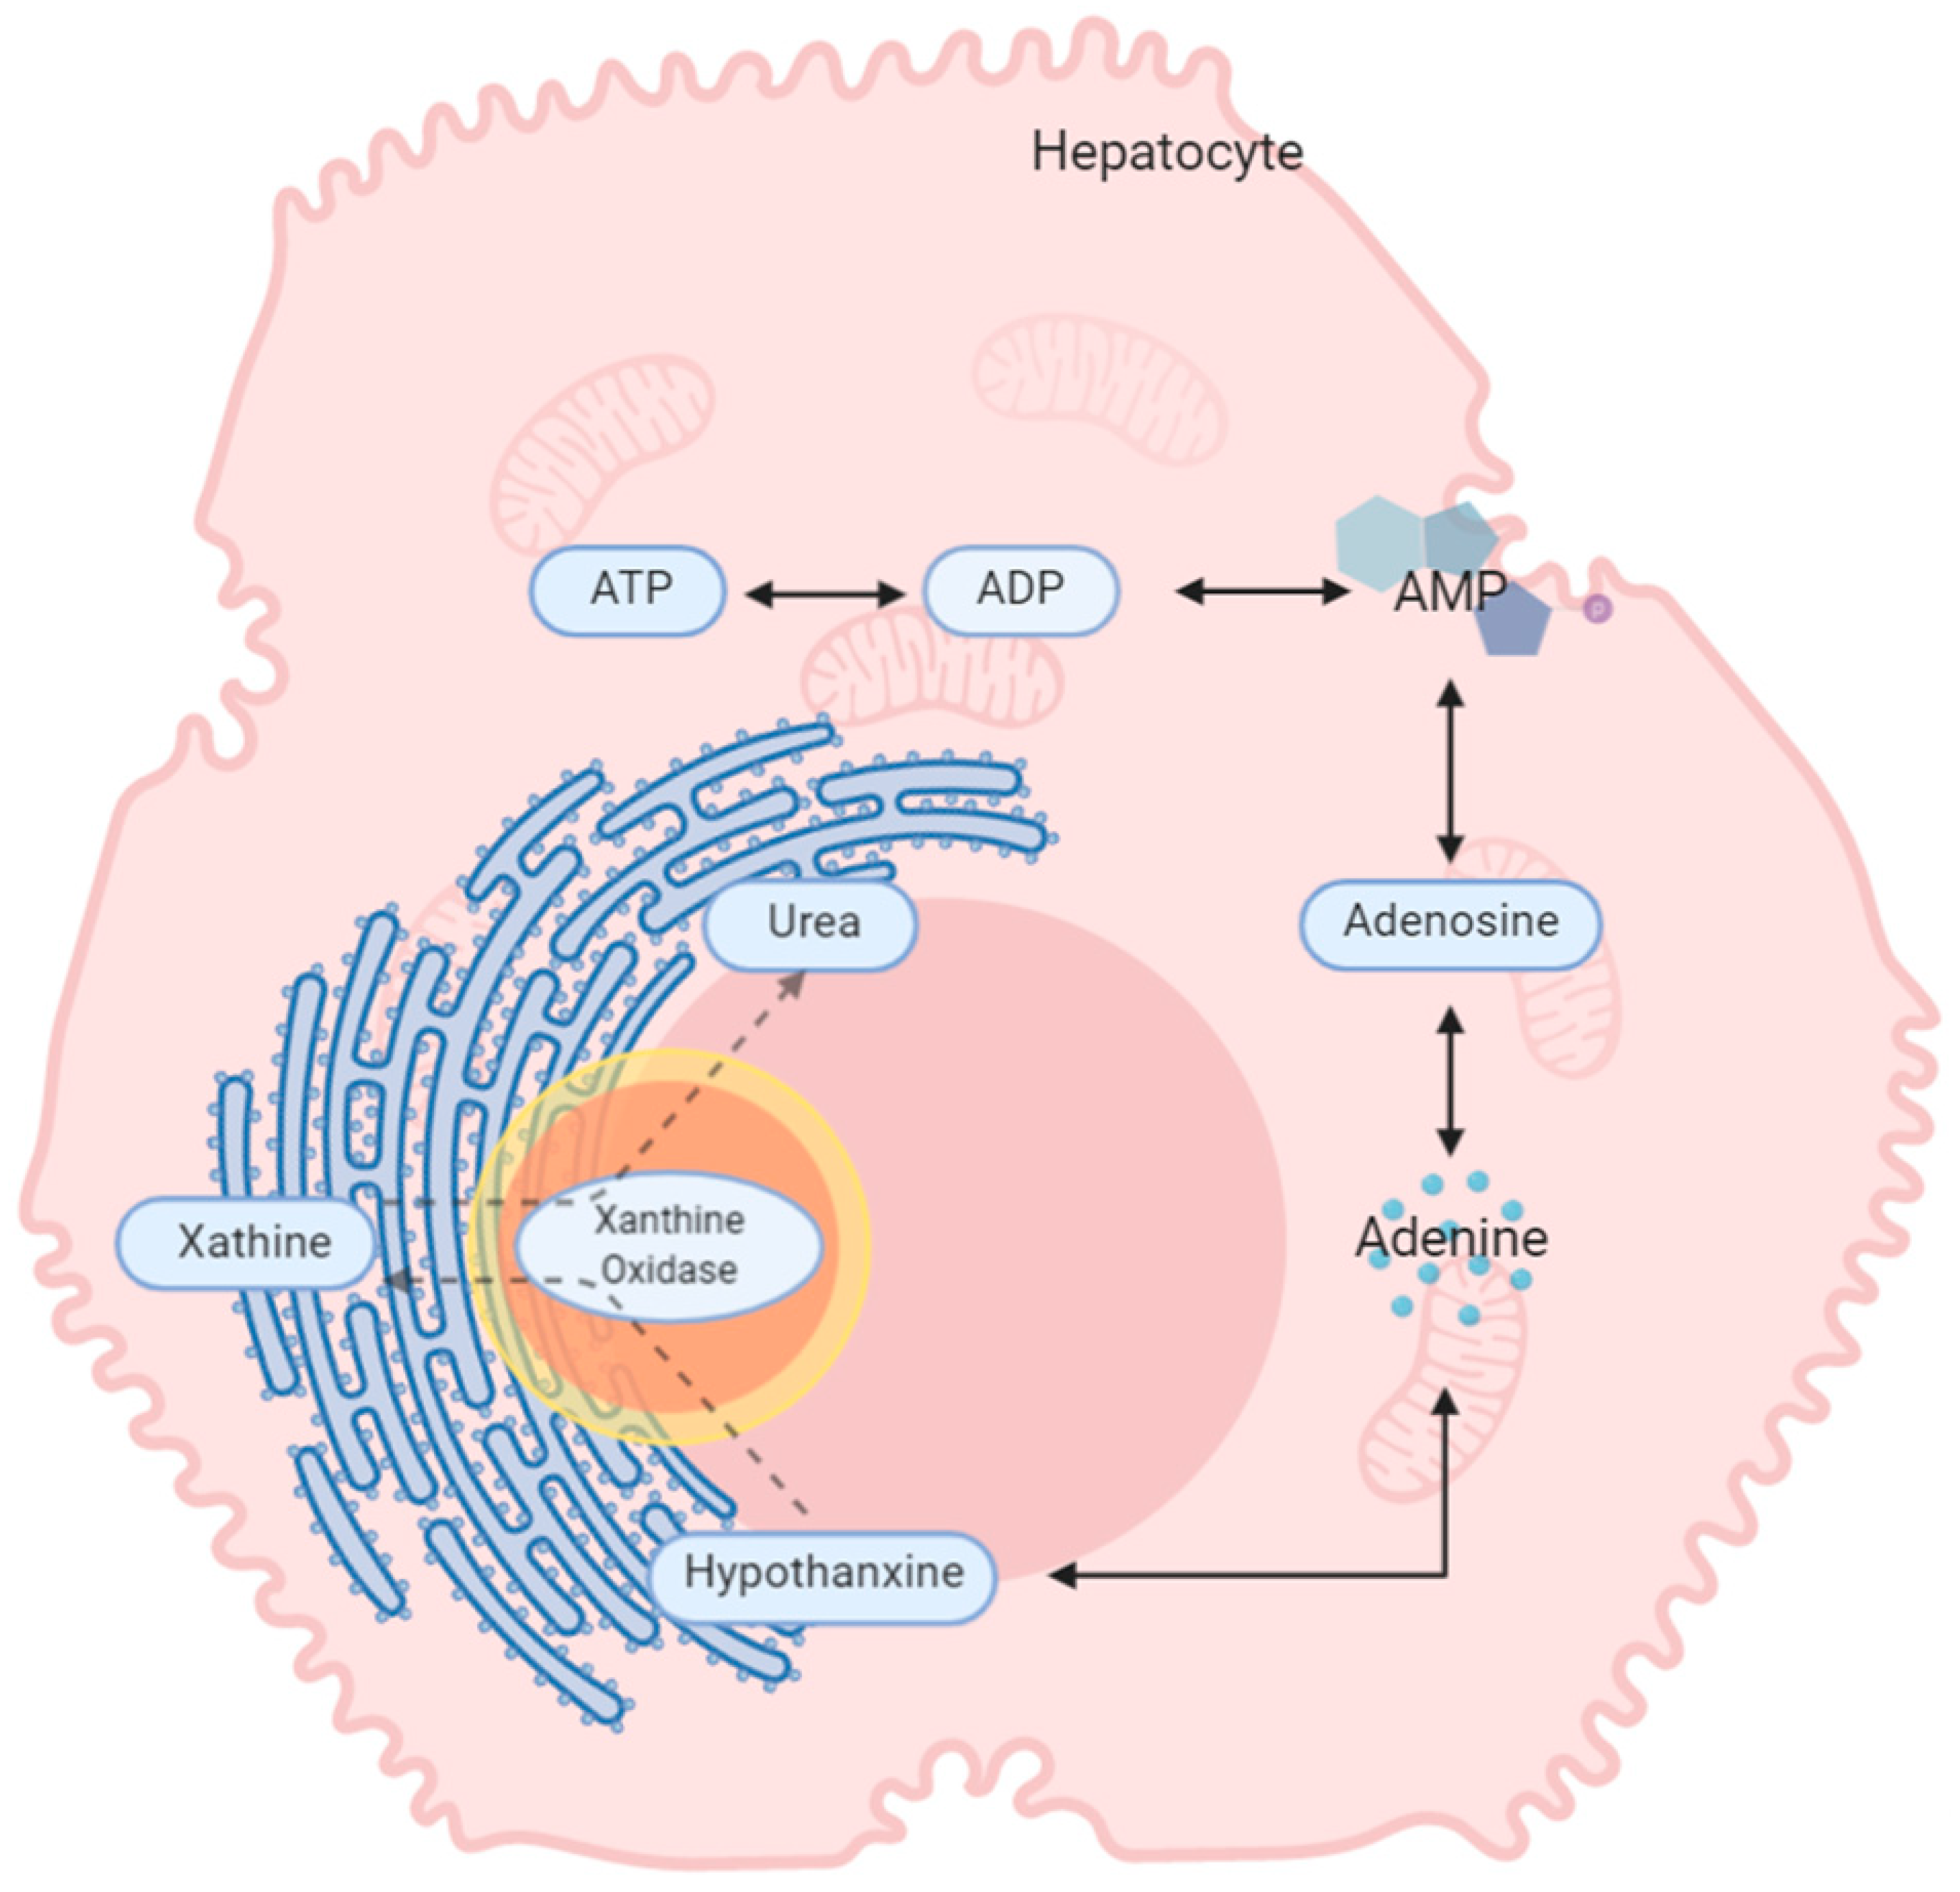
4. Discussion
5. Conclusions
Supplementary Materials
Author Contributions
Conflicts of Interest
References
- Kaserman, D.L. Fifty years of organ transplants: The successes and the failures. Issues Law Med. 2007, 23, 45. [Google Scholar] [PubMed]
- Nasralla, D.; Coussios, C.C.; Mergental, H.; Akhtar, M.Z.; Butler, A.J.; Ceresa, C.D.L.; Chiocchia, V.; Dutton, S.J.; Garcia-Valdecasas, J.C.; Heaton, N.; et al. A randomized trial of normothermic preservation in liver transplantation. Nature 2018, 557, 50–56. [Google Scholar] [CrossRef] [PubMed]
- Transplantation Activity Data. Available online: https://www.organdonation.nhs.uk/helping-you-to-decide/about-organ-donation/statistics-about-organ-donation/transplant-activity-report/ (accessed on 19 April 2019).
- Hirschfield, G.M.; Gibbs, P.; Griffiths, W.J.H. Adult liver transplantation: What non-specialists need to know. Brit. Med. J. 2009, 338. [Google Scholar] [CrossRef] [PubMed]
- Deceased Donation. Available online: https://www.odt.nhs.uk/deceased-donation/ (accessed on 19 April 2019).
- Orman, E.S.; Barritt, A.S.; Wheeler, S.B.; Hayashi, P.H. Declining liver utilization for transplantation in the United States and the impact of donation after cardiac death. Liver Transpl. 2013, 19, 59–68. [Google Scholar] [CrossRef]
- Saidi, R.; Kenari, S.H. Challenges of organ shortage for transplantation: Solutions and opportunities. Int. J. Organ Transpl. Med. 2014, 5, 87. [Google Scholar]
- DuBay, D.A.; Redden, D.T.; Bryant, M.K.; Dorn, D.P.; Fouad, M.N.; Gray, S.H.; White, J.A.; Locke, J.E.; Meeks, C.B.; Taylor, G.C. Resource utilization associated with procurement of transplantable organs from donors that do not meet OPTN eligible death criteria. Transplantation 2014, 97, 1043. [Google Scholar] [CrossRef]
- Theal, R.; Scott, K. Evaluating asymptomatic patients with abnormal liver function test results. Am. Fam. Physician 1996, 53, 2111–2119. [Google Scholar]
- Hill, P.; Sammons, H. An assessment of 5′-nucleotidase as a liver-function test. QJM 1967, 36, 457–468. [Google Scholar]
- Nanji, A.A.; Anderson, F.H. Sensitivity and specificity of liver function tests in the detection of parenteral nutrition-associated cholestasis. J. Parenter. Enter. Nutr. 1985, 9, 307–308. [Google Scholar] [CrossRef]
- Richman, S.M.; Delman, A.J.; Grob, D. Alterations in indices of liver function in congestive heart failure with particular reference to serum enzymes. Am. J. Med. 1961, 30, 211–225. [Google Scholar] [CrossRef]
- Bathum, L.; Petersen, H.C.; Rosholm, J.-U.; Petersen, P.H.; Vaupel, J.; Christensen, K. Evidence for a substantial genetic influence on biochemical liver function tests: Results from a population-based Danish twin study. Clin. Chem. 2001, 47, 81–87. [Google Scholar] [CrossRef] [PubMed]
- Clough, A.R.; Bailie, R.S.; Currie, B. Liver function test abnormalities in users of aqueous kava extracts. J. Toxicol. Clin. Toxicol. 2003, 41, 821–829. [Google Scholar] [CrossRef] [PubMed]
- Naesens, M.; Sarwal, M.M. Molecular diagnostics in transplantation. Nat. Rev. Nephrol. 2010, 6, 614–628. [Google Scholar] [CrossRef] [PubMed]
- Cano, A.; Alonso, C. Deciphering non-alcoholic fatty liver disease through metabolomics. Biochem. Soc. Trans. 2014, 42, 1447–1452. [Google Scholar] [CrossRef] [PubMed]
- Attard, J.A.; Dunn, W.B.; Mergental, H.; Mirza, D.F.; Afford, S.C.; Perera, M.T.P.R. Systematic Review: Clinical Metabolomics to Forecast Outcomes in Liver Transplantation Surgery. OMICS 2019, 23, 463–476. [Google Scholar] [CrossRef] [PubMed]
- Cortes, M.; Pareja, E.; Garcia-Canaveras, J.C.; Teresa Donato, M.; Montero, S.; Mir, J.; Castell, J.V.; Lahoz, A. Metabolomics discloses donor liver biomarkers associated with early allograft dysfunction. J. Hepatol. 2014, 61, 564–574. [Google Scholar] [CrossRef]
- Duarte, I.F.; Stanley, E.G.; Holmes, E.; Lindon, J.C.; Gil, A.M.; Tang, H.R.; Ferdinand, R.; McKee, C.G.; Nicholson, J.K.; Vilca-Melendez, H.; et al. Metabolic assessment of human liver transplants from biopsy samples at the donor and recipient stages using high-resolution magic angle spinning H-1 NMR spectroscopy. Anal. Chem. 2005, 77, 5570–5578. [Google Scholar] [CrossRef]
- Xu, J.; Casas-Ferreira, A.M.; Ma, Y.; Sen, A.; Kim, M.; Proitsi, P.; Shkodra, M.; Tena, M.; Srinivasan, P.; Heaton, N. Lipidomics comparing DCD and DBD liver allografts uncovers lysophospholipids elevated in recipients undergoing early allograft dysfunction. Sci. Rep. 2015, 5, 17737. [Google Scholar] [CrossRef]
- Hrydziuszko, O.; Silva, M.A.; Perera, M.T.; Richards, D.A.; Murphy, N.; Mirza, D.; Viant, M.R. Application of metabolomics to investigate the process of human orthotopic liver transplantation: A proof-of-principle study. OMICS 2010, 14, 143–150. [Google Scholar] [CrossRef]
- Hrydziuszko, O.; Perera, M.T.; Laing, R.; Kirwan, J.; Silva, M.A.; Richards, D.A.; Murphy, N.; Mirza, D.F.; Viant, M.R. Mass Spectrometry Based Metabolomics Comparison of Liver Grafts from Donors after Circulatory Death (DCD) and Donors after Brain Death (DBD) Used in Human Orthotopic Liver Transplantation. PLoS ONE 2016, 11, e0165884. [Google Scholar] [CrossRef]
- Olthoff, K.M.; Kulik, L.; Samstein, B.; Kaminski, M.; Abecassis, M.; Emond, J.; Shaked, A.; Christie, J.D. Validation of a current definition of early allograft dysfunction in liver transplant recipients and analysis of risk factors. Liver Transpl. 2010, 16, 943–949. [Google Scholar] [CrossRef] [PubMed]
- Whiley, L.; Godzien, J.; Ruperez, F.J.; Legido-Quigley, C.; Barbas, C. In-vial dual extraction for direct LC-MS analysis of plasma for comprehensive and highly reproducible metabolic fingerprinting. Anal. Chem. 2012, 84, 5992–5999. [Google Scholar] [CrossRef] [PubMed]
- Ebshiana, A.A.; Snowden, S.G.; Thambisetty, M.; Parsons, R.; Hye, A.; Legido-Quigley, C. Metabolomic Method: UPLC-q-ToF Polar and Non-Polar Metabolites in the Healthy Rat Cerebellum Using an In-Vial Dual Extraction. PLoS ONE 2015, 10, e0122883. [Google Scholar] [CrossRef] [PubMed]
- Smith, C.A.; O’Maille, G.; Want, E.J.; Qin, C.; Trauger, S.A.; Brandon, T.R.; Custodio, D.E.; Abagyan, R.; Siuzdak, G. METLIN: A metabolite mass spectral database. Ther. Drug Monit. 2005, 27, 747–751. [Google Scholar] [CrossRef]
- Wishart, D.S.; Knox, C.; Guo, A.C.; Eisner, R.; Young, N.; Gautam, B.; Hau, D.D.; Psychogios, N.; Dong, E.; Bouatra, S.; et al. HMDB: A knowledgebase for the human metabolome. Nucleic Acids Res. 2009, 37, 603–610. [Google Scholar] [CrossRef]
- Fahy, E.; Sud, M.; Cotter, D.; Subramaniam, S. LIPID MAPS online tools for lipid research. Nucleic Acids Res. 2007, 35, 606–612. [Google Scholar] [CrossRef]
- Cooper, G.M. The Cell: A Molecular Approach, 2nd ed.; Sinauer Associates: Sunderland, MA, USA, 2000. [Google Scholar]
- Born, G. Aggregation of blood platelets by adenosine diphosphate and its reversal. Nature 1962, 194, 927–929. [Google Scholar] [CrossRef]
- Vajdová, K.; Graf, R.; Clavien, P.A. ATP-supplies in the cold-preserved liver: A long-neglected factor of organ viability. Hepatology 2002, 36, 1543–1552. [Google Scholar] [CrossRef]
- Kamiike, W.; Watanabe, F.; Hashimoto, T.; Tagawa, K.; Ikeda, Y.; Nakao, K.; Kawashima, Y. Changes in cellular levels of ATP and its catabolites in ischemic rat liver. J. Biochem. 1982, 91, 1349–1356. [Google Scholar] [CrossRef]
- Marubayashi, S.; Takenaka, M.; Dohi, K.; Ezaki, H.; Kawasaki, T. Adenine nucleotide metabolism during hepatic ischemia and subsequent blood reflow periods and its relation to organ viability. Transplantation 1980, 30, 294–296. [Google Scholar] [CrossRef]
- Masuzaki, R.; Yu, H.; Kingsley, P.; Marnett, L.; Zhao, Z.; Karp, S.J. Functional Implications of Biochemical and Molecular Characteristics of Donation After Circulatory Death Livers. Transpl. Direct 2015, 1, 18. [Google Scholar] [CrossRef] [PubMed]
- LeRoy, E.; Ager, A.; Gordon, J.L. Effects of neutrophil elastase and other proteases on porcine aortic endothelial prostaglandin I2 production, adenine nucleotide release, and responses to vasoactive agents. J. Clin. Investig. 1984, 74, 1003. [Google Scholar] [CrossRef] [PubMed]
- Cronstein, B.N. Purines and inflammation: Neutrophils possess P1 and P2 purine receptors. In Adenosine and Adenine Nucleotides as Regulators of Cellular Function; Phillis, J.W., Ed.; CRC Press: Boca Raton, FL, USA, 1991. [Google Scholar]
- Jassem, W.; Koo, D.D.; Cerundolo, L.; Rela, M.; Heaton, N.D.; Fuggle, S.V. Cadaveric versus living-donor livers: Differences in inflammatory markers after transplantation. Transplantation 2003, 76, 1599–1603. [Google Scholar] [CrossRef] [PubMed]
- Jassem, W.; Koo, D.D.; Cerundolo, L.; Rela, M.; Heaton, N.D.; Fuggle, S.V. Leukocyte infiltration and inflammatory antigen expression in cadaveric and living-donor livers before transplant. Transplantation 2003, 75, 2001–2007. [Google Scholar] [CrossRef]
- Lennon, P.F.; Taylor, C.T.; Stahl, G.L.; Colgan, S.P. Neutrophil-derived 5′-adenosine monophosphate promotes endothelial barrier function via CD73-mediated conversion to adenosine and endothelial A2B receptor activation. J. Exp. Med. 1998, 188, 1433–1443. [Google Scholar] [CrossRef]
- Roy, H.; Moudrianakis, E.N. Interactions between ADP and the coupling factor of photophosphorylation. Proc. Natl. Acad. Sci. USA 1971, 68, 464–468. [Google Scholar] [CrossRef]
- LeMond, G.; Hom, M. Power. The Science of Fitness: Performance, and Endurance, 1st ed.; Elesiver: London, UK, 2014. [Google Scholar]
- Minor, T.; Klauke, H.; Nagelschmidt, M.; Isselhard, W. Reduction of proteolysis by venous-systemic oxygen persufflation during rat liver preservation and improved functional outcome after transplantation. Transplantation 1997, 63, 365–368. [Google Scholar] [CrossRef]
- Zimmerman, M.A.; Kam, I.; Eltzschig, H.; Grenz, A. Biological implications of extracellular adenosine in hepatic ischemia and reperfusion injury. Am. J. Transplant. 2013, 13, 2524–2529. [Google Scholar] [CrossRef]
- Balkwill, D.L.; Leach, F.R.; Wilson, J.T.; McNabb, J.F.; White, D.C. Equivalence of microbial biomass measures based on membrane lipid and cell wall components, adenosine triphosphate, and direct counts in subsurface aquifer sediments. Microb. Ecol. 1988, 16, 73–84. [Google Scholar] [CrossRef]
- Kartha, S.; Toback, F.G. Adenine nucleotides stimulate migration in wounded cultures of kidney epithelial cells. J. Clin. Investig. 1992, 90, 288. [Google Scholar] [CrossRef]
- Wyatt, D.; Ely, S.; Lasley, R.; Walsh, R.; Mainwaring, R.; Berne, R.; Mentzer, R., Jr. Purine-enriched asanguineous cardioplegia retards adenosine triphosphate degradation during ischemia and improves postischemic ventricular function. J. Thorac. Cardiovasc. Surg. 1989, 97, 771–778. [Google Scholar] [CrossRef]
- Rosenbloom, F.M.; Kelley, W.N.; Miller, J.; Henderson, J.F.; Seegmiller, J.E. Inherited disorder of purine metabolism: Correlation between central nervous system dysfunction and biochemical defects. JAMA 1967, 202, 175–177. [Google Scholar] [CrossRef] [PubMed]
- Layton, M.E.; Wood, J.G.; Yan, Z.Y.; Forster, J. Ischemia/reperfusion alters uric acid and ascorbic acid levels in liver. J. Surg. Res. 1996, 64, 1–5. [Google Scholar] [CrossRef] [PubMed]
- Glantzounis, G.; Tsimoyiannis, E.; Kappas, A.; Galaris, D. Uric acid and oxidative stress. Curr. Pharm. Des. 2005, 11, 4145–4151. [Google Scholar] [CrossRef]
- Mateo, R.; Cho, Y.; Singh, G.; Stapfer, M.; Donovan, J.; Kahn, J.; Fong, T.L.; Sher, L.; Jabbour, N.; Aswad, S. Risk factors for graft survival after liver transplantation from donation after cardiac death donors: An analysis of OPTN/UNOS data. Am. J. Transplant. 2006, 6, 791–796. [Google Scholar] [CrossRef]


| Donor | DBD (n = 35) | DCD (n = 12) | p-Value b | |
| Age (years) | 53 (25–82) | 56 (35–76) | 0.526 | |
| Gender (female/male) | 19/16 | 6/6 | 1 | |
| Hepatic steatosis | No | 14 | 7 | |
| Mild (<30%) | 18 | 3 | 0.305 | |
| Moderate (30–60%) | 3 | 2 | ||
| GGT (IU/L) a | 52 (6–208) | 92 (21–315) | 0.342 | |
| AST (IU/L) a | 85 (22–517) | 161 (15–392) | 0.139 | |
| ALT (IU/L) a | 72 (12–268) | 97 (13–201) | 0.623 | |
| Bilirubin (μmoL/L) a | 11 (3–37) | 12 (4–26) | 0.695 | |
| ITU stay (days) | 4 (1–28) | 4 (1–10) | 0.168 | |
| Inotrop support (Y/N) | 19/16 | 6/6 | 1 | |
| Functional WIT (min) | NA | 21 (9–33) | NA | |
| CIT (min) | 504 (210–840) | 457 (270–720) | 0.212 | |
| Recipient | DBD (n = 35) | DCD (n = 12) | p-Value b | |
| Age (years) | 44 (20–65) | 54 (46–70) | 0.029 | |
| Gender (female/male) | 13/22 | 5/7 | 1 | |
| BMI (kg/m2) | 25.8 (18.4–34.6) | 27.3 (22.1–35.8) | 0.277 | |
| MELD Score | 14.3 (2–34) | 10.7 (4–18) | 0.208 | |
| UKELD Score | 53.3 (40–77) | 51.3 (44–61) | 0.571 | |
| ALD | 9 | 3 | NA | |
| PSC | 5 | 0 | ||
| HCV | 1 | 2 | ||
| HCC | 1 | 2 | ||
| PHCC | 2 | 1 | ||
| Others d | 17 | 4 | ||
| AST (IU/L) a | 480 (10–7485) | 613 (18–5307) | 0.494 | |
| Bilirubin day 7 (μmoL/L) | 56 (7–258) | 52 (12–103) | 0.772 | |
| INR day 7 | 1.04 (0.85–1.21) | 1.06 (0.92–1.3) | 0.909 | |
| EAD/EGF | 6/29 | 4/8 | 0.251 | |
| Censored/Dead c | 22/3 | 7/2 | NA | |
| Indicators | AUC | Accuracy | Sensitivity | Specificity |
|---|---|---|---|---|
| adenine/urate + AMP/urate + hypoxanthine/urate + ALT | 0.84 | 0.68 | 0.65 | 0.80 |
| adenine/urate + adenosine/urate + AMP/urate + hypoxanthine/urate | 0.80 | 0.70 | 0.65 | 0.90 |
| AMP/urate | 0.75 | 0.66 | 0.62 | 0.80 |
| GGT + bilirubin + AST + ALT + age + steatosis status | 0.71 | 0.57 | 0.57 | 0.60 |
| adenine/urate | 0.70 | 0.64 | 0.60 | 0.80 |
| hypoxanthine/urate | 0.68 | 0.53 | 0.51 | 0.60 |
| bilirubin | 0.65 | 0.68 | 0.67 | 0.70 |
| AST | 0.63 | 0.51 | 0.50 | 0.70 |
| adenosine/urate | 0.62 | 0.53 | 0.49 | 0.70 |
| ALT | 0.59 | 0.36 | 0.27 | 0.70 |
| steatosis status | 0.55 | 0.49 | 0.46 | 0.60 |
| age | 0.55 | 0.45 | 0.38 | 0.70 |
| GGT | 0.47 | 0.79 | 1 | 0 |
| Metabolites | AST | Bilirubin | GGT | |
|---|---|---|---|---|
| Adenine | Coefficient | −0.045 | −0.122 | −0.134 |
| p-value | 0.968 | 0.321 | 0.275 | |
| q-value | 0.968 | 0.482 | 0.825 | |
| Adenosine | Coefficient | −0.005 | −0.274 | −0.084 |
| p-value | 0.967 | 0.024 * | 0.496 | |
| q-value | 0.967 | 0.072 | 0.744 | |
| AMP | Coefficient | −0.009 | −0.097 | −0.106 |
| p-value | 0.945 | 0.430 | 0.390 | |
| q-value | 0.945 | 0.645 | 1 | |
| Hypoxanthine | Coefficient | −0.189 | −0.320 | −0.039 |
| p-value | 0.122 | 0.008 ** | 0.752 | |
| q-value | 0.183 | 0.024 * | 0.752 | |
| Urate | Coefficient | 0.042 | −0.019 | 0.204 |
| p-value | 0.733 | 0.875 | 0.095 | |
| q-value | 1 | 0.875 | 0.285 | |
© 2020 by the authors. Licensee MDPI, Basel, Switzerland. This article is an open access article distributed under the terms and conditions of the Creative Commons Attribution (CC BY) license (http://creativecommons.org/licenses/by/4.0/).
Share and Cite
Xu, J.; Hassan-Ally, M.; Casas-Ferreira, A.M.; Suvitaival, T.; Ma, Y.; Vilca-Melendez, H.; Rela, M.; Heaton, N.; Jassem, W.; Legido-Quigley, C. Deregulation of the Purine Pathway in Pre-Transplant Liver Biopsies Is Associated with Graft Function and Survival after Transplantation. J. Clin. Med. 2020, 9, 711. https://doi.org/10.3390/jcm9030711
Xu J, Hassan-Ally M, Casas-Ferreira AM, Suvitaival T, Ma Y, Vilca-Melendez H, Rela M, Heaton N, Jassem W, Legido-Quigley C. Deregulation of the Purine Pathway in Pre-Transplant Liver Biopsies Is Associated with Graft Function and Survival after Transplantation. Journal of Clinical Medicine. 2020; 9(3):711. https://doi.org/10.3390/jcm9030711
Chicago/Turabian StyleXu, Jin, Mohammad Hassan-Ally, Ana María Casas-Ferreira, Tommi Suvitaival, Yun Ma, Hector Vilca-Melendez, Mohamed Rela, Nigel Heaton, Wayel Jassem, and Cristina Legido-Quigley. 2020. "Deregulation of the Purine Pathway in Pre-Transplant Liver Biopsies Is Associated with Graft Function and Survival after Transplantation" Journal of Clinical Medicine 9, no. 3: 711. https://doi.org/10.3390/jcm9030711
APA StyleXu, J., Hassan-Ally, M., Casas-Ferreira, A. M., Suvitaival, T., Ma, Y., Vilca-Melendez, H., Rela, M., Heaton, N., Jassem, W., & Legido-Quigley, C. (2020). Deregulation of the Purine Pathway in Pre-Transplant Liver Biopsies Is Associated with Graft Function and Survival after Transplantation. Journal of Clinical Medicine, 9(3), 711. https://doi.org/10.3390/jcm9030711