Incremental Value of ePLAR—The Echocardiographic Pulmonary to Left Atrial Ratio in the Assessment of Sub-Massive Pulmonary Emboli


Abstract
1. Background
2. Methods
2.1. Patient Inclusion
2.2. Echocardiographic Methods
2.3. Statistical Methods
3. Results
4. Discussion
5. Limitations
6. Conclusions
Author Contributions
Funding
Conflicts of Interest
Abbreviations
| PE | Pulmonary Embolus |
| RV | Right ventricle |
| TAPSE | Tricuspid annular plane systolic excursion |
| RV S’ | Right ventricular DTI systolic velocity (measured at the tricuspid annulus) |
| PAP | Pulmonary artery pressure |
| LAP | Left atrial pressure |
| TPG | Trans-pulmonary gradient |
| RVSP | Right ventricular systolic pressure |
| TRVmax | Tricuspid regurgitation maximum continuous-wave Doppler velocity |
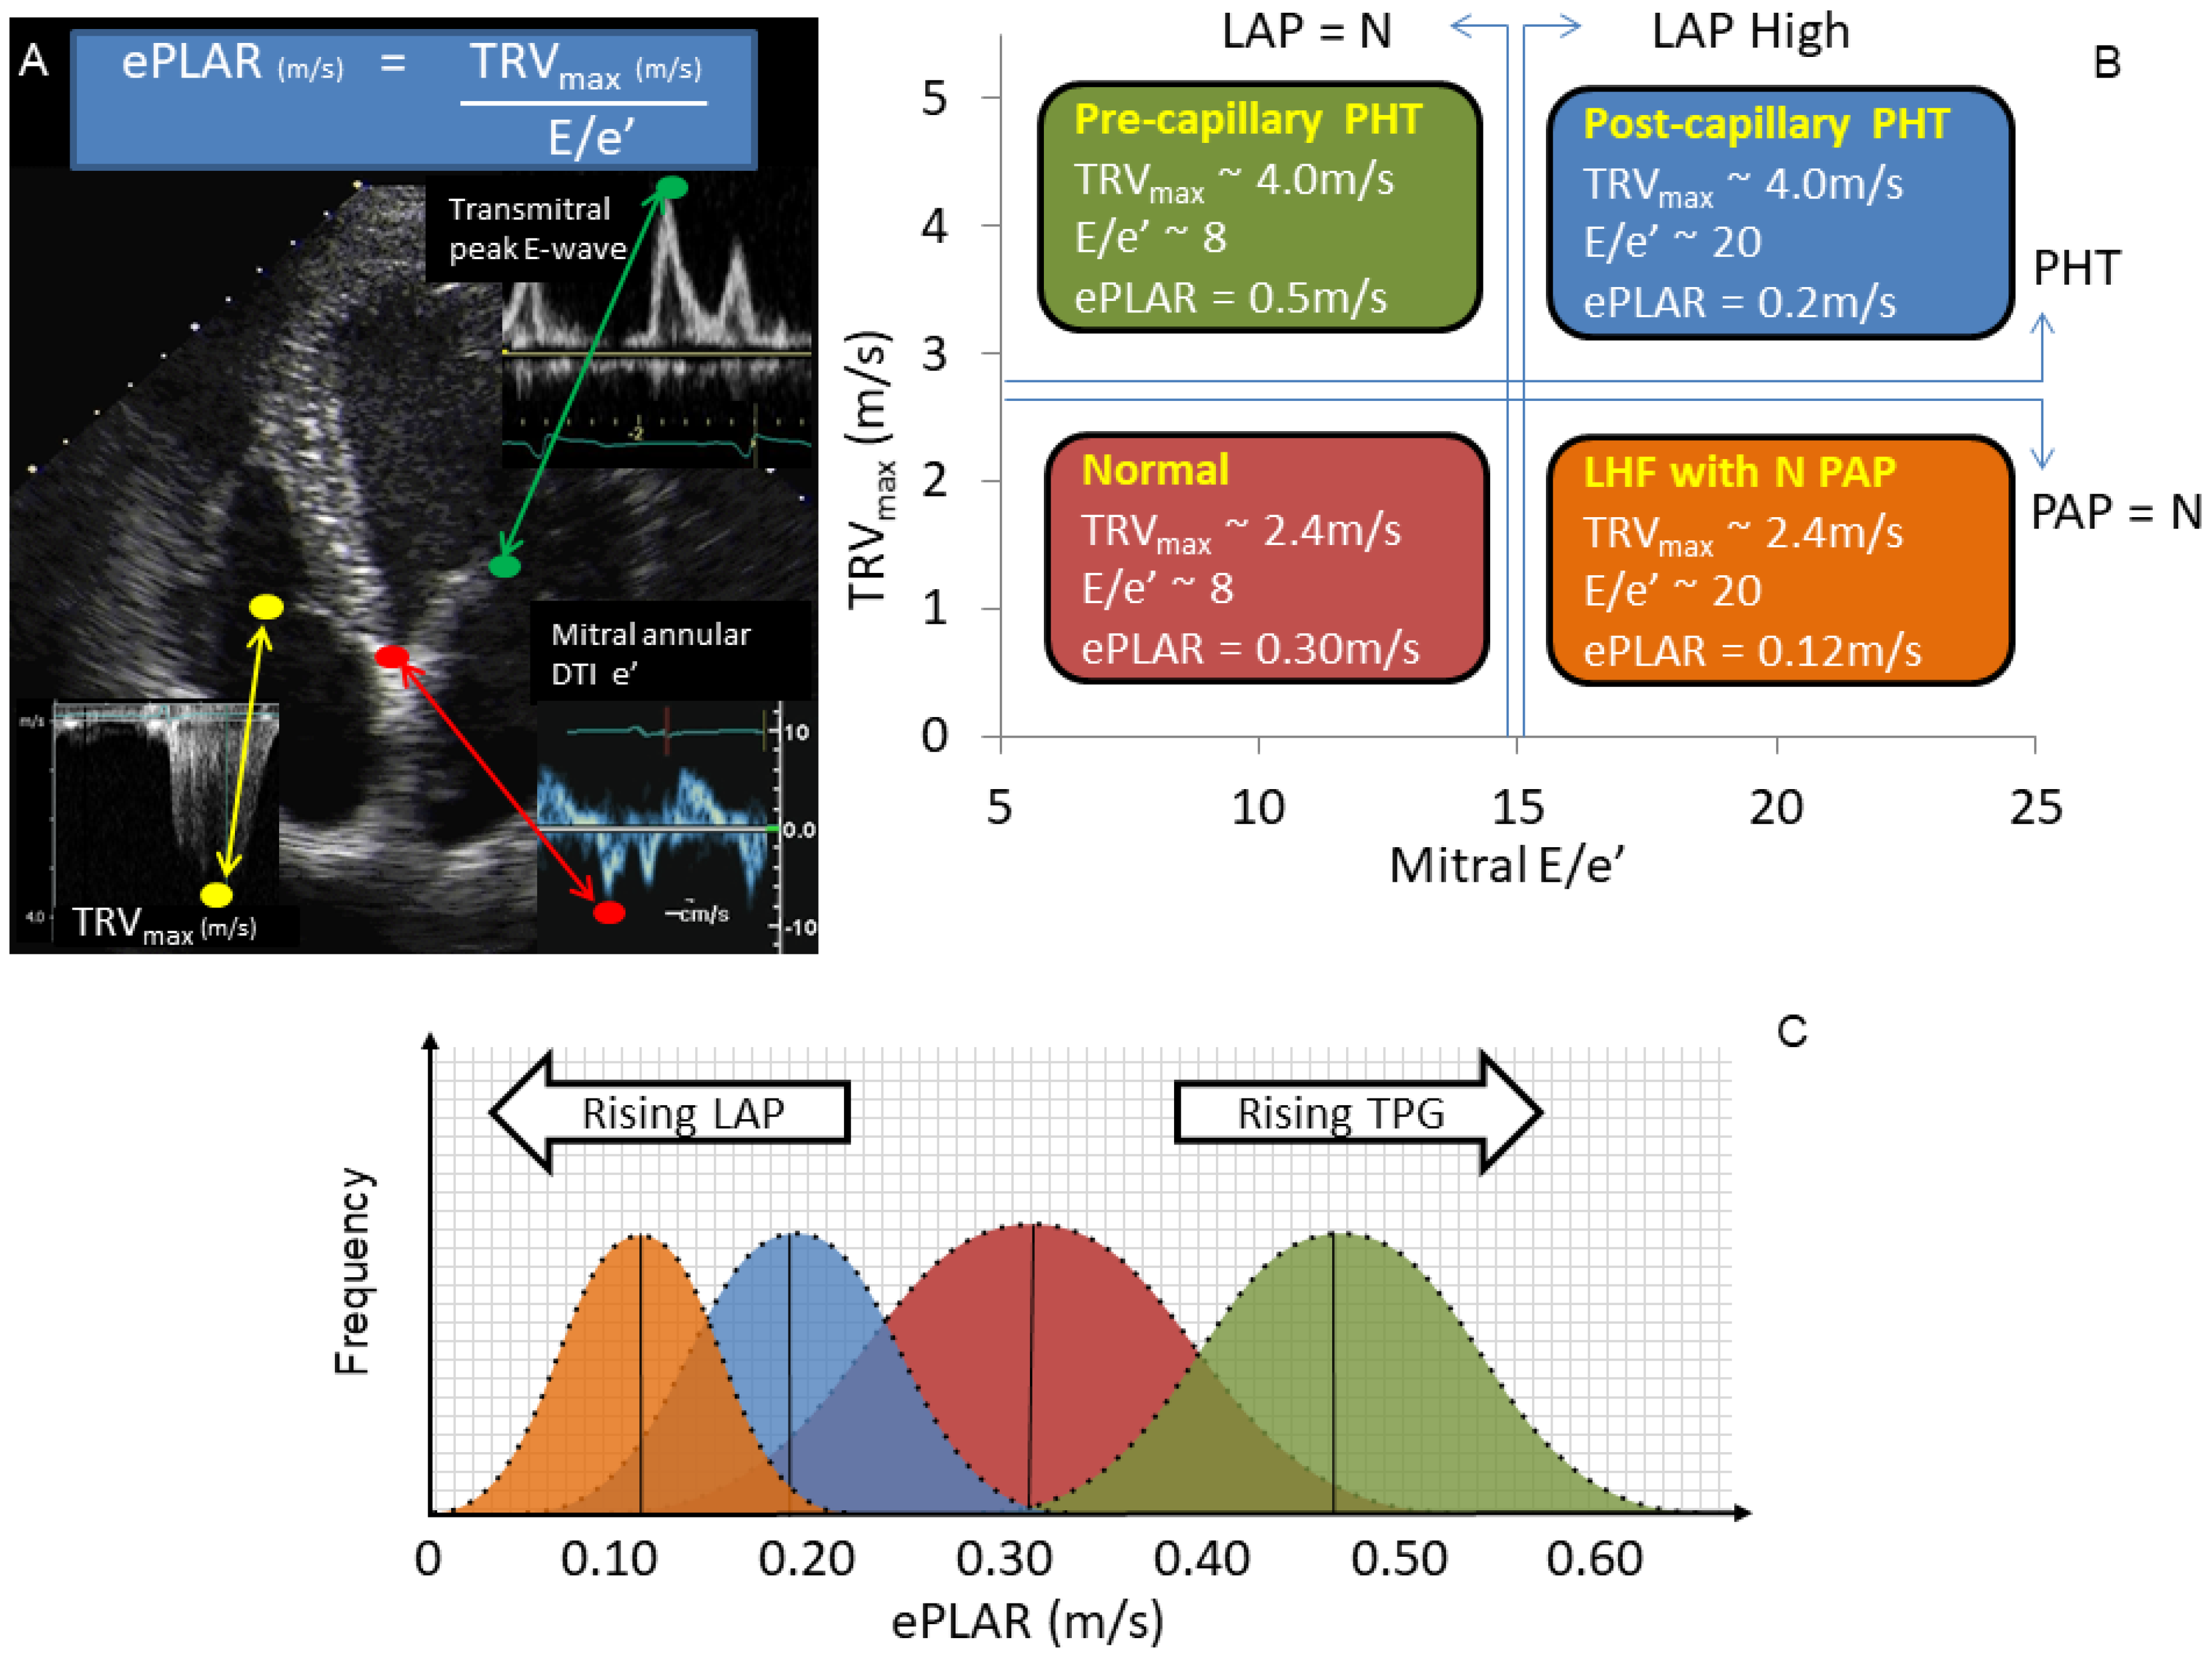
| ePLAR | echocardiographic Pulmonary to Left Atrial Ratio |
| CTPA | Computed tomography pulmonary angiogram |
| DTI | Doppler Tissue Imaging |
| Mitral E/e’ | Pulsed wave Doppler peak trans-mitral e-wave velocity/DTI mitral annular e’-wave velocity |
References
- Mookadam, F.; Jiamsripong, P.; Goel, R.; Warsame, T.A.; Emani, U.R.; Khandheria, B.K. Critical appraisal on the utility of echocardiography in the management of acute pulmonary embolism. Cardiol. Rev. 2010, 18, 29–37. [Google Scholar] [CrossRef] [PubMed]
- Steering Committee. Single-bolus tenecteplase plus heparin compared with heparin alone for normotensive patients with acute pulmonary embolism who have evidence of right ventricular dysfunction and myocardial injury: Rationale and design of the Pulmonary Embolism Thrombolysis (PEITHO) trial. Am. Heart J. 2012, 163, 33–38 e1. [Google Scholar]
- Stein, P.D.; Fowler, S.E.; Goodman, L.R.; Gottschalk, A.; Hales, C.A.; Hull, R.D.; Leeper, K.V., Jr.; Popovich, J., Jr.; Quinn, D.A.; Sos, T.A.; et al. Multidetector computed tomography for acute pulmonary embolism. N. Engl. J. Med. 2006, 354, 2317–2327. [Google Scholar] [CrossRef] [PubMed]
- Anderson, D.R.; Kahn, S.R.; Rodger, M.A.; Kovacs, M.J.; Morris, T.; Hirsch, A.; Lang, E.; Stiell, I.; Kovacs, G.; Dreyer, J.; et al. Computed tomographic pulmonary angiography vs. ventilation-perfusion lung scanning in patients with suspected pulmonary embolism: A randomized controlled trial. JAMA 2007, 298, 2743–2753. [Google Scholar] [CrossRef]
- Pruszczyk, P.; Goliszek, S.; Lichodziejewska, B.; Kostrubiec, M.; Ciurzyński, M.; Kurnicka, K.; Dzikowska-Diduch, O.; Palczewski, P.; Wyzgal, A. Prognostic value of echocardiography in normotensive patients with acute pulmonary embolism. JACC Cardiovasc. Imaging 2014, 7, 553–560. [Google Scholar] [CrossRef]
- Hsiao, S.H.; Chang, S.M.; Lee, C.Y.; Yang, S.H.; Lin, S.K.; Chiou, K.R. Usefulness of tissue doppler parameters for identifying pulmonary embolism in patients with signs of pulmonary hypertension. Am. J. Cardiol. 2006, 98, 685–690. [Google Scholar] [CrossRef]
- Konstantinides, S.V.; Torbicki, A.; Agnelli, G.; Danchin, N.; Fitzmaurice, D.; Galie, N.; Gibbs, J.S.; Huisman, M.V.; Humbert, M.; Kucher, N.; et al. 2014 ESC guidelines on the diagnosis and management of acute pulmonary embolism. Eur. Heart J. 2014, 35, 3033–3073. [Google Scholar] [CrossRef]
- McConnell, M.V.; Solomon, S.D.; Rayan, M.E.; Come, P.C.; Goldhaber, S.Z.; Lee, R.T. Regional right ventricular dysfunction detected by echocardiography in acute pulmonary embolism. Am. J. Cardiol. 1996, 78, 469–473. [Google Scholar] [CrossRef]
- Kucher, N.; Rossi, E.; De Rosa, M.; Goldhaber, S.Z. Prognostic role of echocardiography among patients with acute pulmonary embolism and a systolic arterial pressure of 90 mm Hg or higher. Arch. Intern. Med. 2005, 165, 1777–1781. [Google Scholar] [CrossRef]
- Hsiao, S.H.; Lee, C.Y.; Chang, S.M.; Yang, S.H.; Lin, S.K.; Huang, W.C. Pulmonary embolism and right heart function: Insights from myocardial Doppler tissue imaging. J. Am. Soc. Echocardiogr. Off. Publ. Am. Soc. Echocardiogr. 2006, 19, 822–828. [Google Scholar] [CrossRef]
- Lee, J.H.; Park, J.H. Strain Analysis of the right ventricle using two-dimensional echocardiography. J. Cardiovasc. Imaging 2018, 26, 111–124. [Google Scholar] [CrossRef] [PubMed]
- Carroll, B.J.; Heidinger, B.H.; Dabreo, D.C.; Matos, J.D.; Mohebali, D.; Feldman, S.A.; McCormick, I.; Litmanovich, D.; Manning, W.J. Multimodality assessment of right ventricular strain in patients with acute pulmonary embolism. Am. J. Cardiol. 2018, 122, 175–181. [Google Scholar] [CrossRef] [PubMed]
- Sanchez, O.; Trinquart, L.; Planquette, B.; Couturaud, F.; Verschuren, F.; Caille, V.; Meneveau, N.; Pacouret, G.; Roy, P.M.; Righini, M.; et al. Echocardiography and pulmonary embolism severity index have independent prognostic roles in pulmonary embolism. Eur. Respir. J. 2013, 42, 681–688. [Google Scholar] [CrossRef] [PubMed]
- Scalia, G.M.; Scalia, I.G.; Kierle, R.; Beaumont, R.; Cross, D.B.; Feenstra, J.; Burstow, D.J.; Fitzgerald, B.T.; Platts, D.G. ePLAR—The echocardiographic pulmonary to left atrial ratio—A novel non-invasive parameter to differentiate pre-capillary and post-capillary pulmonary hypertension. Int. J. Cardiol. 2016, 212, 379–386. [Google Scholar] [CrossRef]
- Mitchell, C.; Rahko, P.S.; Blauwet, L.A.; Canaday, B.; Finstuen, J.A.; Foster, M.C.; Horton, K.; Ogunyankin, K.O.; Palma, R.A.; Velazquez, E.J. Guidelines for performing a comprehensive transthoracic echocardiographic examination in adults: Recommendations from the American society of echocardiography. J. Am. Soc. Echocardiogr. Off. Publ. Am. Soc. Echocardiogr. 2019, 32, 1–64. [Google Scholar] [CrossRef]
- Lang, R.M.; Badano, L.P.; Mor-Avi, V.; Afilalo, J.; Armstrong, A.; Ernande, L.; Flachskampf, F.A.; Foster, E.; Goldstein, S.A.; Kuznetsova, T.; et al. Recommendations for cardiac chamber quantification by echocardiography in adults: An update from the American society of echocardiography and the European association of cardiovascular imaging. J. Am. Soc. Echocardiogr. Off. Publ. Am. Soc. Echocardiogr. 2015, 28, 1–39 e14. [Google Scholar] [CrossRef]
- Jimenez, D.; Aujesky, D.; Moores, L.; Gomez, V.; Marti, D.; Briongos, S.; Monreal, M.; Barrios, V.; Konstantinides, S.; Yusen, R.D. Combinations of prognostic tools for identification of high-risk normotensive patients with acute symptomatic pulmonary embolism. Thorax 2011, 66, 75–81. [Google Scholar] [CrossRef]
- Bova, C.; Greco, F.; Misuraca, G.; Serafini, O.; Crocco, F.; Greco, A.; Noto, A. Diagnostic utility of echocardiography in patients with suspected pulmonary embolism. Am. J. Emerg. Med. 2003, 21, 180–183. [Google Scholar] [CrossRef]
- Kearon, C.; Akl, E.A.; Comerota, A.J.; Prandoni, P.; Bounameaux, H.; Goldhaber, S.Z.; Nelson, M.E.; Wells, P.S.; Gould, M.K.; Dentali, F.; et al. Antithrombotic therapy for VTE disease: Antithrombotic therapy and prevention of thrombosis, 9th ed: American college of chest physicians evidence-based clinical practice guidelines. Chest 2012, 141, e419S–e496S. [Google Scholar] [CrossRef]
- Patel, B.; Shah, M.; Garg, L.; Agarwal, M.; Martinez, M.; Dusaj, R. Trends in the use of echocardiography in pulmonary embolism. Medicine 2018, 97, e12104. [Google Scholar] [CrossRef]
- Waldie, A.M.; Eliadis, P.E.; Fraser, J.F.; Little, S.G.; Scalia, I.G.; Scalia, G.M. Acute life-threatening reversible pulmonary vasoconstrictive reaction to bleomycin chemotherapy demonstrating the clinical application of ePLAR—Echocardiographic Pulmonary to Left Atrial Ratio. Int. J. Cardiol. 2016, 215, 438–440. [Google Scholar] [CrossRef] [PubMed]
- Tran, M.; Kwon, A.; Holt, D.; Kierle, R.; Fitzgerald, B.; Scalia, I.; Scalia, W.; Holt, G.; Scalia, G. Echocardiographic Pulmonary to Left Atrial Ratio (ePLAR): A comparison study between ironman athletes, age matched controls and a general community cohort. J. Clin. Med. 2019, 8, 1756. [Google Scholar] [CrossRef] [PubMed]
- Scalia, I.G.; Riha, A.Z.; Kwon, A.; Newbigin, K.; Scalia, G.M. Dramatic normalization of the echocardiographic pulmonary-to-left atrial ratio with thrombolysis in a case of life-threatening submassive pulmonary emboli. Case 2017, 1, 124–127. [Google Scholar] [CrossRef] [PubMed]


| PE Patients | Age-Matched Controls | Significance (p < 0.05) | |
|---|---|---|---|
| n | 110 | 110 | - |
| Age (years) | 57.4 ± 17.6 | 58.1 ± 17.8 | 0.76 |
| Male (%) | 58 | 60 | - |
| BSA (m2) | 2.1 ± 0.3 | 1.98 ± 0.27 | 0.01 |
| Systolic blood pressure (mmHg) | 124.9 ± 15.7 | 121.5 ± 20.6 | 0.42 |
| Diastolic blood pressure (mmHg) | 74.3 ± 8.5 | 74.2 ± 7.4 | 0.93 |
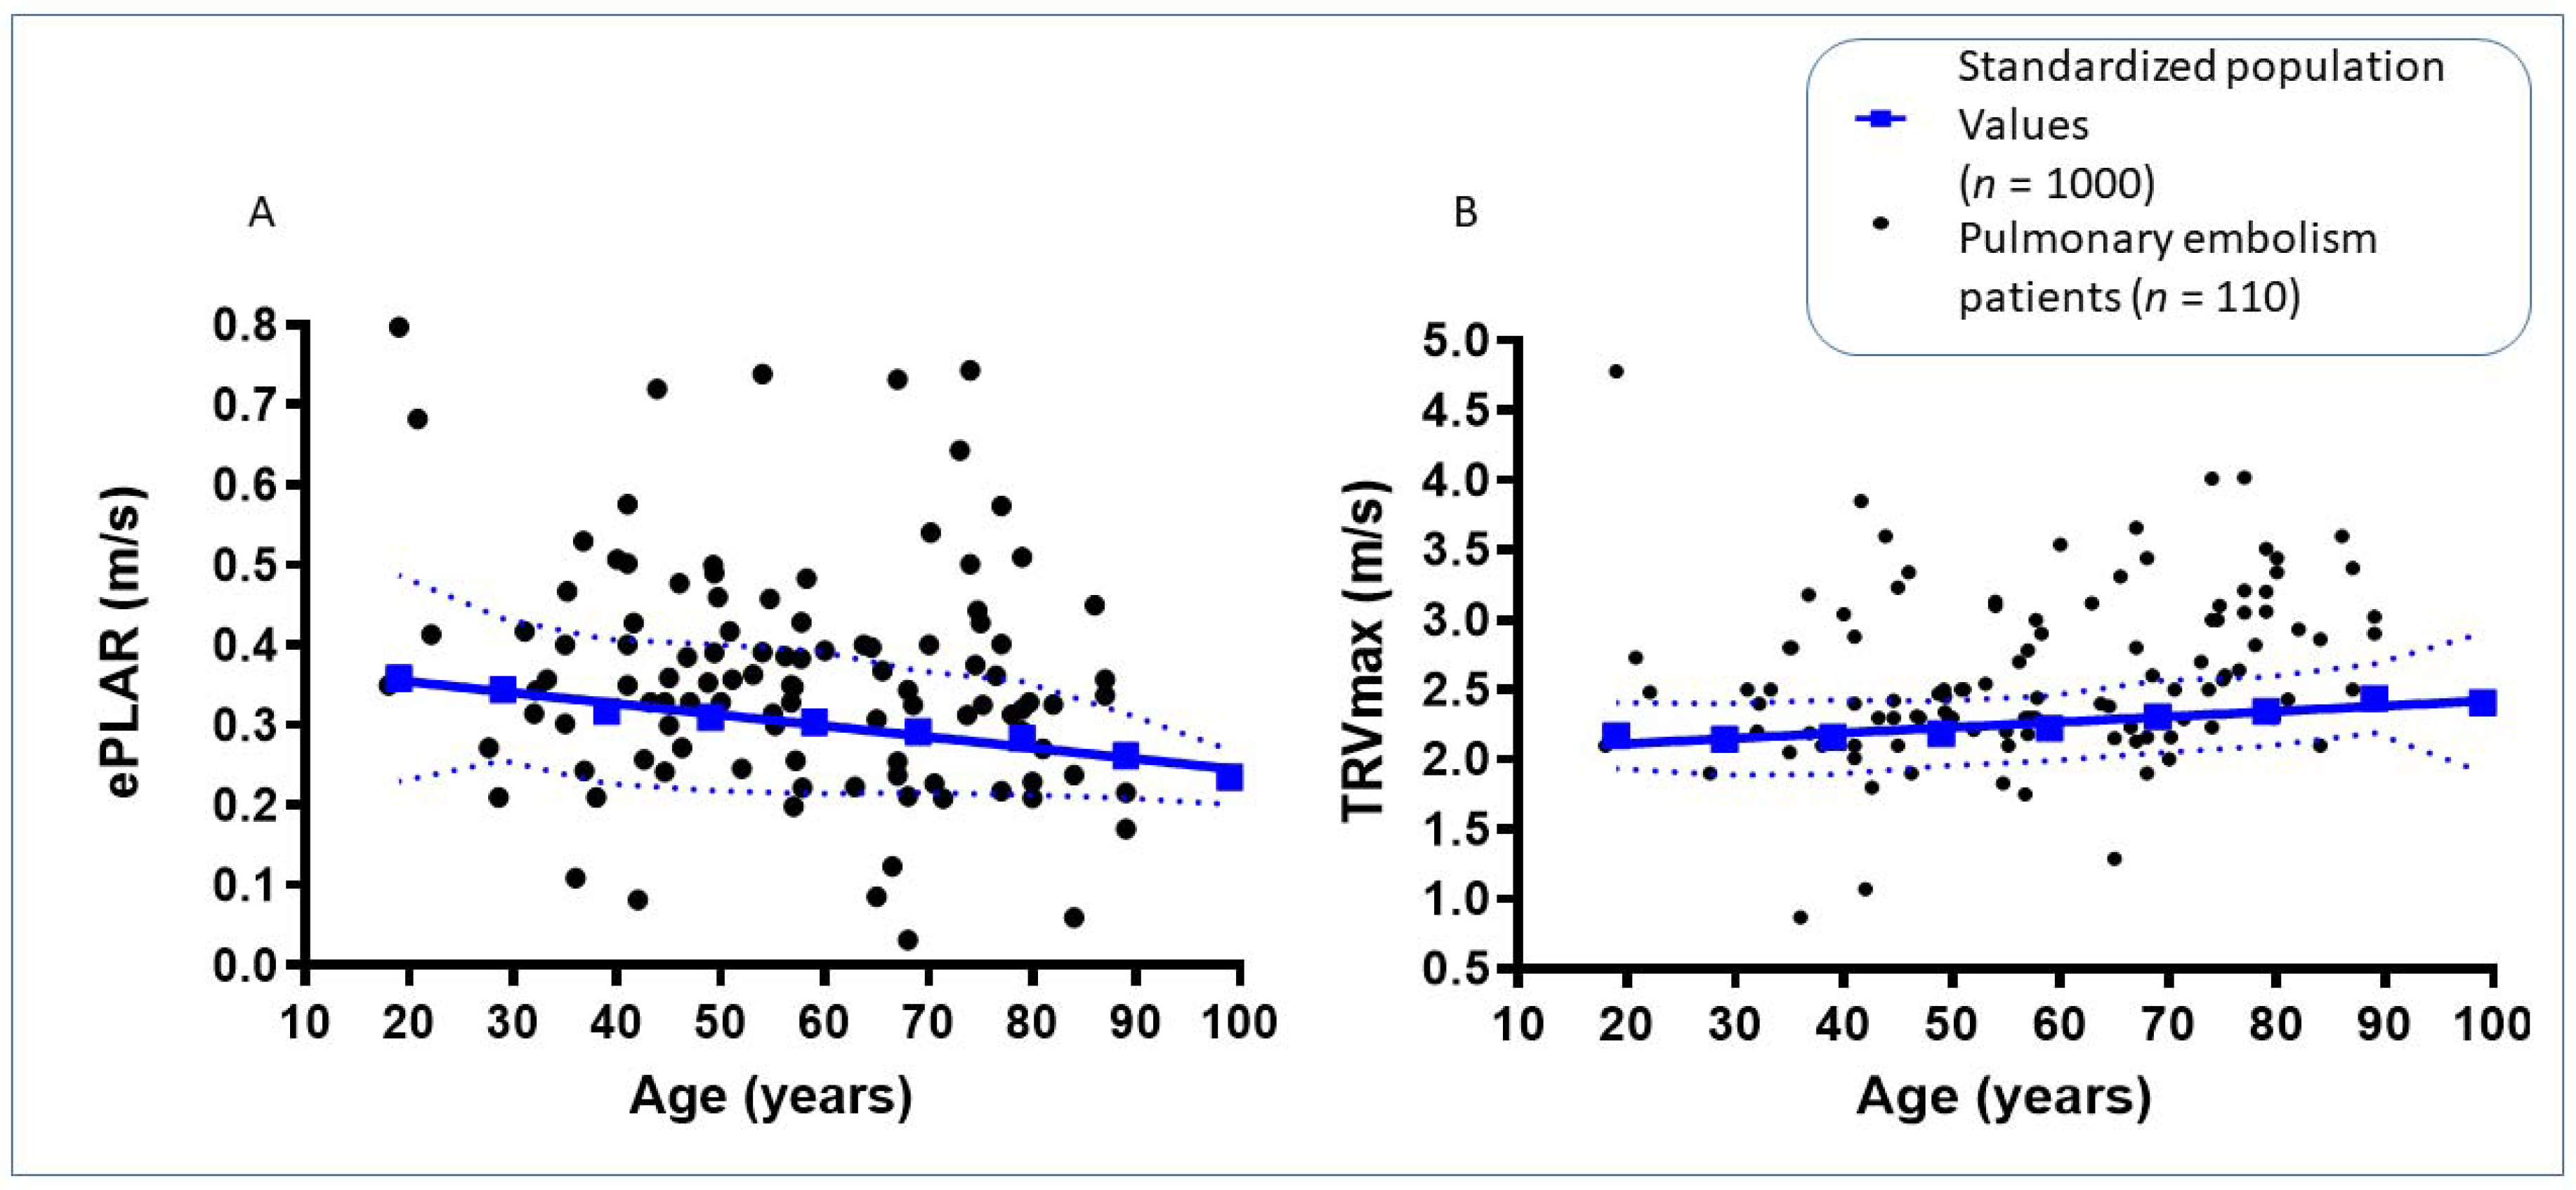
| TRVmax (m/s) | 2.61 ± 0.61 | 2.36 ± 0.28 | 0.0001 |
| ePLAR (m/s) | 0.36 ± 0.14 | 0.26 ± 0.10 | <0.0001 |
| RVSP (mmHg) | 34.18 ± 13.49 | 25 ± 5.3 | <0.0001 |
| TAPSE (mm) | 21.08 ± 6.31 | 20.60 ± 5.91 | 0.60 |
| RV S’ (cm/s) | 13.49 ± 3.58 | 12.6 ± 3.3 | <0.0001 |
| Mitral E/e’ | 8.2 ± 3.8 | 10.8 ± 5.1 | 0.01 |
| Group 1 | Group 2 | Group 3 | Group 4 | |
|---|---|---|---|---|
| N | 27 | 48 | 5 | 30 |
| Age (years) | 62.95 ± 17.54 | 54.89 ± 16.03 | 77.77 ± 9.47 | 53.02 ± 18.31 |
| Male (%) | 63 | 60 | 20 | 57 |
| BSA (m2) | 2.14 ± 0.34 | 2.10 ± 0.27 | 1.97 ± 0.3 | 2.08 ± 0.42 |
| Baseline HR (bpm) | 76.8 ± 20.7 | 75.2 ± 11.84 | 66.0 ± 9.2 | 67.74 ± 18.31 |
| Time to echo (days) | 0.22 ± 1.09 | 0.23 ± 0.66 | 0.60 ± 0.89 | 0.53 ± 1.04 |
| TRVmax (m/s) | 3.38 ± 0.42 | 2.42 ± 0.26 | 3.19 ± 0.19 | 2.11 ± 0.44 |
| ePLAR (m/s) | 0.48 ± 0.08 | 0.42 ± 0.13 | 0.20 ± 0.08 | 0.20 ± 0.07 |
| TAPSE (mm) | 18.17 ± 5.46 | 24.23 ± 6.57 | 18.25 ± 3.87 | 19.79 ± 6.43 |
| S’(cm/s) | 12.68 ± 3.50 | 14.44 ± 3.95 | 12.00 ± 3.87 | 13.17 ± 2.85 |
| Group 1 | Group 2 | Group 3 | Group 4 | |
|---|---|---|---|---|
| N | 5 | 47 | 6 | 18 |
| Age (years) | 72.64 ± 7.81 | 54.59 ± 18.28 | 59.50 ± 19.67 | 60.82 ± 19.41 |
| Male (%) | 20 | 55 | 67 | 44 |
| BSA (m2) | 2.08 ± 0.3 | 2.09 ± 0.35 | 1.97 ± 0.31 | 1.98 ± 0.34 |
| Baseline HR (bpm) | 68.0 ± 9.1 | 73.1 ± 10.26 | 66.0 ± 8.0 | 62.8 ± 8.18 |
| Time to echo (days) | 0.20 ± 2.17 | 0.32 ± 0.81 | 0.00 ± 0.3 | 1.06 ± 1.21 |
| TRVmax (m/s) | 3.20 ± 0.69 | 2.72 ± 0.59 | 2.39 ± 0.48 | 2.22 ± 0.72 |
| ePLAR (m/s) | 0.47 ± 0.14 | 0.40 ± 0.10 | 0.22 ± 0.01 | 0.21 ± 0.08 |
| TAPSE (mm) | 10.80 ± 3.03 | 23.30 ± 4.66 | 9.17 ± 2.79 | 22.11 ± 4.07 |
| S’ (cm/s) | 9.80 ± 1.79 | 14.48 ± 3.43 | 8.00 ± 1.73 | 13.67 ± 2.91 |
| Group 1 | Group 2 | Group 3 | Group 4 | |
|---|---|---|---|---|
| N | 4 | 51 | 6 | 18 |
| Age (years) | 62.75 ± 17.86 | 54.76 ± 18.26 | 64.17 ± 20.83 | 61.32 ± 20.03 |
| Male (%) | 25 | 53 | 67 | 44 |
| BSA (m2) | 2.14 ± 0.32 | 2.07 ± 0.33 | 1.97 ± 0.3 | 1.98 ± 0.34 |
| Baseline HR (bpm) | 76.8 ± 20.7 | 75.2 ± 14.93 | 66.0 ± 9.1 | 71.3 ± 8.18 |
| Time to echo (days) | −0.25 ± 1.89 | 0.33 ± 0.86 | 0.33 ± 0.82 | 0.94 ± 1.21 |
| TRVmax (m/s) | 3.26 ± 0.54 | 2.72 ± 0.59 | 2.60 ± 0.63 | 2.19 ± 0.68 |
| ePLAR (m/s) | 0.46 ± 0.10 | 0.42 ± 0.13 | 0.19 ± 0.08 | 0.20 ± 0.07 |
| TAPSE (mm) | 13.0 ± 6.68 | 22.8 ± 5.17 | 10.7 ± 4.13 | 22.4 ± 3.99 |
| S’ (cm/s) | 8.5 ± 0.58 | 14.3 ± 3.32 | 7.8 ± 1.60 | 14.1 ± 2.40 |
| Percentage (95% CI) | Sensitivity | Specificity | Positive Predictive Value | Negative Predictive Value |
|---|---|---|---|---|
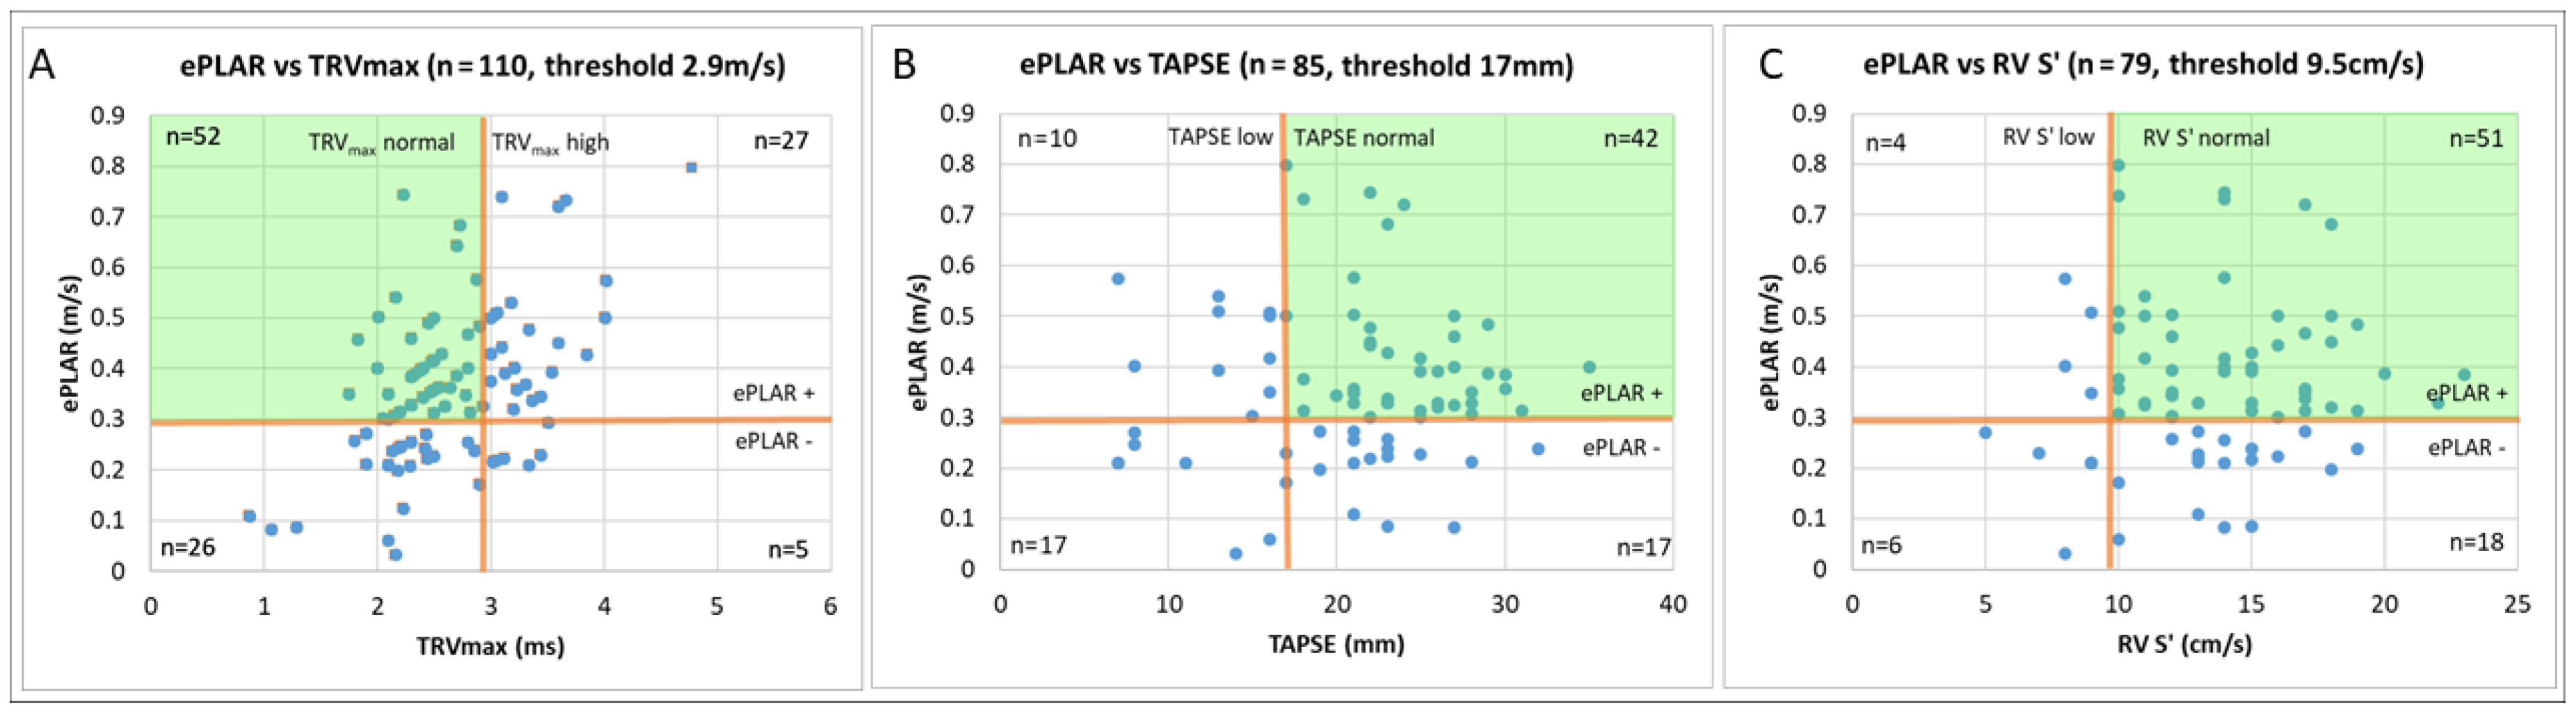
| ePLAR | 72% (62–80%) | 66% (57–75%) | 68% (62–74%) | 70% (63–75%) |
| TRVmax | 29% (21–39%) | 98% (94–100%) | 94% (80–98%) | 58% (57–70%) |
| TAPSE | 22% (14–33%) | 85% (77–91%) | 52% (36–66%) | 61% (58–65%) |
| RV S’ | 13% (6–22%) | 85% (76–91%) | 37% (22–55%) | 57% (55–60%) |
© 2020 by the authors. Licensee MDPI, Basel, Switzerland. This article is an open access article distributed under the terms and conditions of the Creative Commons Attribution (CC BY) license (http://creativecommons.org/licenses/by/4.0/).
Share and Cite
Scalia, I.G.; Scalia, W.M.; Hunter, J.; Riha, A.Z.; Wong, D.; Celermajer, Y.; Platts, D.G.; Fitzgerald, B.T.; Scalia, G.M. Incremental Value of ePLAR—The Echocardiographic Pulmonary to Left Atrial Ratio in the Assessment of Sub-Massive Pulmonary Emboli. J. Clin. Med. 2020, 9, 247. https://doi.org/10.3390/jcm9010247
Scalia IG, Scalia WM, Hunter J, Riha AZ, Wong D, Celermajer Y, Platts DG, Fitzgerald BT, Scalia GM. Incremental Value of ePLAR—The Echocardiographic Pulmonary to Left Atrial Ratio in the Assessment of Sub-Massive Pulmonary Emboli. Journal of Clinical Medicine. 2020; 9(1):247. https://doi.org/10.3390/jcm9010247
Chicago/Turabian StyleScalia, Isabel G., William M. Scalia, Jonathon Hunter, Andrea Z. Riha, David Wong, Yael Celermajer, David G. Platts, Benjamin T. Fitzgerald, and Gregory M. Scalia. 2020. "Incremental Value of ePLAR—The Echocardiographic Pulmonary to Left Atrial Ratio in the Assessment of Sub-Massive Pulmonary Emboli" Journal of Clinical Medicine 9, no. 1: 247. https://doi.org/10.3390/jcm9010247
APA StyleScalia, I. G., Scalia, W. M., Hunter, J., Riha, A. Z., Wong, D., Celermajer, Y., Platts, D. G., Fitzgerald, B. T., & Scalia, G. M. (2020). Incremental Value of ePLAR—The Echocardiographic Pulmonary to Left Atrial Ratio in the Assessment of Sub-Massive Pulmonary Emboli. Journal of Clinical Medicine, 9(1), 247. https://doi.org/10.3390/jcm9010247