Article

Association between Sarcopenia and Depression in Patients with Chronic Liver Diseases

Division of Hepatobiliary and Pancreatic disease, Department of Internal Medicine, Hyogo College of Medicine, Nishinomiya, Hyogo 663-8501, Japan
*
Author to whom correspondence should be addressed.
J. Clin. Med. 2019, 8(5), 634; https://doi.org/10.3390/jcm8050634
Submission received: 17 April 2019 / Revised: 7 May 2019 / Accepted: 7 May 2019 / Published: 8 May 2019
(This article belongs to the Section Mental Health)

Abstract

:
Association between sarcopenia, as evaluated by grip strength (GS) and skeletal muscle mass (SMM), and depression, as evaluated by Beck Depression Inventory-2nd edition (BDI-II) in chronic liver diseases (CLDs, n = 414, average age = 61.5 years), was investigated. Study subjects were classified into four groups: Group A (n = 60), lower GS and lower SMM (sarcopenia); group B (n = 44), lower GS and higher SMM; group C (n = 100), higher GS and lower SMM; group D (n = 210), higher GS and higher SMM. Factors associated with BDI-II score ≥11 were examined. BDI-II score 0–10 (normal) was found in 284 (68.6%), 11–16 (minimal) in 76 (18.4%), 17–20 (mild) in 24 (5.8%), 21–30 (moderate) in 15 (3.6%), and ≥31 (severe) in 15 (3.6%). The average ± standard deviation BDI-II score in liver cirrhosis (LC) patients (10.2 ± 9.6, n = 152) was significantly higher than that in non-LC patients (7.4 ± 7.2, n = 262) (p = 0.0058). Univariate analysis identified three factors to be significantly associated with BDI-I score ≥11: Our classification (groups of A, B, C, and D) (p = 0.0259), serum albumin (p = 0.0445), and the presence of LC (p = 0.0157). Multivariate analysis revealed that only group A (p = 0.0074, group D as a reference) was significant. In conclusion, sarcopenia can be an independent predictor for depression in CLDs.

1. Introduction

Depression is common in patients with chronic liver diseases (CLDs) [1,2,3,4,5,6,7,8]. Even in CLD patients with an earlier liver fibrotic stage, depressive symptoms can be frequently observed compared with healthy persons [7]. In chronic hepatitis C patients, depression, anxiety, and fatigue are shown to be at the top of the list of psychiatric disorders [9]. Impaired quality of life (QOL) and increasing health care costs have been reported for CLD patients with depression [4,10]. In liver cirrhosis (LC) patients, depression can be associated with substantial morbidity and mortality, however, it is under-diagnosed and this topic is not given full attention in current practice guidelines [1]. The Beck Depression Inventory-2nd edition (BDI-II) is one of the most extensively used screening tools for depression and its usefulness has been well validated [11].
Sarcopenia is a clinical sign characterized by diminished skeletal muscle mass (SMM) and poor muscle function, resulting in frailty, cachexia, osteoporosis, and thereby all-cause mortality [12,13,14,15,16,17,18,19,20,21,22,23,24,25]. The pathophysiology of sarcopenia includes daily life inactivity, bedridden condition, poor nutrition, hormone deficiency and chronic inflammation [26]. Alterations in nutritional metabolism, nutritional requirements, and reduced dietary intake are common in CLDs and sarcopenia can also be linked to worse patient QOL, poor prognosis, and higher health care costs in CLDs [15,17,19]. Sarcopenia can be a contributor of malnutrition or a consequence of malnutrition and primarily responsible for the unfavorable clinical consequences observed in CLD patients [15,17,19]. In Japan, 10–70% of CLD patients have sarcopenia. This prompted the Japan Society of Hepatology (JSH) to create guidelines for the diagnosis of sarcopenia in liver disease (first edition) in 2016 [14,18]. The JSH criteria adopts grip strength (GS) for the evaluation of muscle strength and bioimpedance analysis (BIA) and/or computed tomography for the evaluation of SMM, while unlike the Asian criteria for sarcopenia, age restriction (i.e., 65 years old or more) is not set in the JSH criteria for the assessment of sarcopenia because CLD patients can present diminished SMM due to impaired protein synthesis regardless of age [14,18].
However, data for the relevance between sarcopenia and depression in CLD patients remain limited, although recent studies demonstrated that sarcopenia was independently associated with depression in middle-aged or elderly individuals [27,28,29,30,31]. In the current study, we sought to investigate whether an independent association exists between sarcopenia and depression, as evaluated by BDI-II in patients with CLDs.

2. Experimental Section

2.1. Patients

A total of 435 CLD patients with data for GS, SMM using BIA and the BDI-II available were admitted to our hospital between November 2013 and August 2018. Fifteen patients with underlying diseases such as overt hepatic encephalopathy, advanced malignancies, severe inflammatory diseases, or liver-unrelated psychiatric diseases were excluded because they potentially affected the interpretation of BDI-II score. As overestimates could occur for the calculation of skeletal muscle mass index (SMI) using BIA in patients with massive ascites, 6 subjects with severe ascites were also excluded from the study [15]. A total of four-hundred and fourteen patients were thus analyzed. The diagnosis of LC was based on laboratory data, radiographic findings (presence or absence of varices, deformity of the liver or ascites), and/or liver biopsy data (F4 or not).

2.2. Questionnaire Survey

The BDI-II is a globally used screening tool for evaluating the severity of depression [32,33]. The BDI-II has good psychometric properties, high reliability and internal consistency and it is a self-administered questionnaire that comprises 21 items, and individual answers are evaluated on a four-point scale (0 to 3 points) [32,34]. Higher BDI-II scores suggest a more severe depression state. Our study subjects were categorized as normal (BDI-II score, 0–10), and the severity of depression state as minimal (BDI-II score, 11–16), mild (BDI-II score, 17–20), moderate (BDI-II score, 21–30), and severe (BDI-II score ≥31) [33,35,36,37].

2.3. Measurement of GS and SMI and Our Study

GS was measured according to the current guidelines [14]. Two measurements of GS were done on both the left and right sides. The better measurement on each side is utilized, and GS was calculated as the mean values of these. SMI was defined as “appendicular SMM/height squared (m2)” by BIA. Based on the current guidelines, patients with lower GS (L-GS) were defined as those with GS less than 26 kg for men and less than 18 kg for women and those with higher GS (H-GS) were defined as those with GS 26 kg or more for men and 18 kg or more for women [14]. Likewise, patients with lower SMM (L-SMM) were defined as those with SMI)less than 7.0 kg/m2 for men and less than 5.7 kg/m2 for women and those with higher SMM (H-SMM) were defined as those with SMI 7.0 kg/m2 or more for men and 5.7 kg/m2 or more for women [14]. (Table 1) In male, patients with GS less than 26 kg and SMI less than 7.0 kg/m2 were classified as group A (sarcopenia), those with GS less than 26 kg and SMI 7.0 kg/m2 or more as group B, those with GS 26 kg or more and SMI less than 7.0 kg/m2 as group C, and those with GS 26 kg or more and SMI 7.0 kg/m2 or more as group D. In female, patients with GS less than 18 kg and SMI less than 5.7 kg/m2 were classified as group A, those with GS less than 18 kg and SMI 5.7 kg/m2 or more as group B, those with GS 18 kg or more and SMI less than 5.7 kg/m2 as group C, and those with GS 18 kg or more and SMI 5.7 kg/m2 or more as group D.
Impacts of GS and SMM on depression state as evaluated by BDI-II were investigated for all cases and several subgroups according to the LC status, gender and age. BDI-II scores among 4 groups (group A, B, C and D) were also compared. Next, factors associated with BDI-II score ≥11 (minimal, mild, moderate or severe depression state) were examined using univariate and multivariate analyses. We received the ethical approval from ethics committee of our hospital (approval no, 2296). The protocol in the study strictly observed all regulations of the Declaration of Helsinki.

2.4. Statistical Considerations

As for continuous parameters, Student’s t test, Mann-Whitney U test, Pearson’s correlation test, analysis of variance or Kruskal-Wallis test were employed to estimate between-group difference, as applicable. In categorical parameters, Fisher’s exact tests or Pearson χ2 test was employed to estimate between-group difference, as applicable. Factors with p < 0.05 linked to BDI-II score ≥11 in the univariate analysis were subjected to the multivariate logistic regression analysis to identify candidate parameters. Unless otherwise stated, data are presented as average ± standard deviation (SD) (interquartile range (IQR)). The threshold for statistical significance was set at p < 0.05. The JMP 13.2 (SAS Institute Inc., Cary, NC, USA) was employed to carry out statistical analysis.

3. Results

3.1. Patient Baseline Characteristics

Baseline characteristics in our study (n = 414, 198 males and 216 females, average ± SD (IQR) age = 61.5 ± 12.7 (52, 71) years) are presented in Table 2. The average ± SD (IQR) BDI-II score was 8.4 ± 8.3 [2,13]. BDI-II score 0–10 (normal) was found in 284 (68.6%), 11–16 (minimal depression) in 76 (18.4%), 17–20 (mild depression) in 24 (5.8%), 21–30 (moderate depression) in 15 (3.6%) and ≥31 (severe depression) in 15 (3.6%) [32]. Depression with BDI-II score ≥11 was thus observed in 130 patients (31.4%). Sarcopenia (i.e., group A), as defined by the JSH criteria, was found in 26 male patients (13.1%) and 34 female patients (15.7%) [14]. Among groups of A (n = 60), B (n = 44), C (n = 100), and D (n = 210), overall differences were identified with statistical significance in terms of age (p < 0.0001), gender (p = 0.0019), presence of LC (p = 0.0007), body mass index (BMI) (p < 0.0001), serum albumin (p < 0.0001), prothrombin time (p = 0.0004), platelet count (p = 0.0013), total cholesterol (p = 0.0085), estimated glomerular filtration rate (p = 0.0495), and BDI-II score (p < 0.0001). There were 152 LC patients (36.7%, Child-Pugh A in 113, Child-Pugh B in 37 and Child-Pugh C in 2). The average ± SD (IQR) BDI-II score in LC patients (10.2 ± 9.6 (3, 13.75)) was significantly higher than that in non-LC patients (7.4 ± 7.2 (2, 12)) (p = 0.0058), suggesting the more serious depression state in LC patients vs. non-LC patients. FIB-4 index significantly correlated with BDI-II score (r = 0.100, p = 0.0413). In our study subjects, there were no sarcopenic obesity patients as defined by sarcopenia and BMI >30 kg/m2 [12,15,17]. At baseline, 82 (31.9%) out of 257 patients with hepatitis C virus (HCV) had undetectable HCV-RNA. The BDI-II score in patients with undetectable HCV-RNA was significantly lower than that in patients without undetectable HCV-RNA (average ± SD: 6.9 ± 7.4 vs. 9.7 ± 8.7, p = 0.0116). At baseline, 37 (60.7%) out of 61 patients with hepatitis B virus (HBV) had undetectable HBV-DNA. The BDI-II score in patients with undetectable HBV-DNA was not significantly lower than that in patients without undetectable HBV-DNA (average ± SD: 8.1 ± 9.0 vs. 7.8 ± 7.4, p = 0.9055).

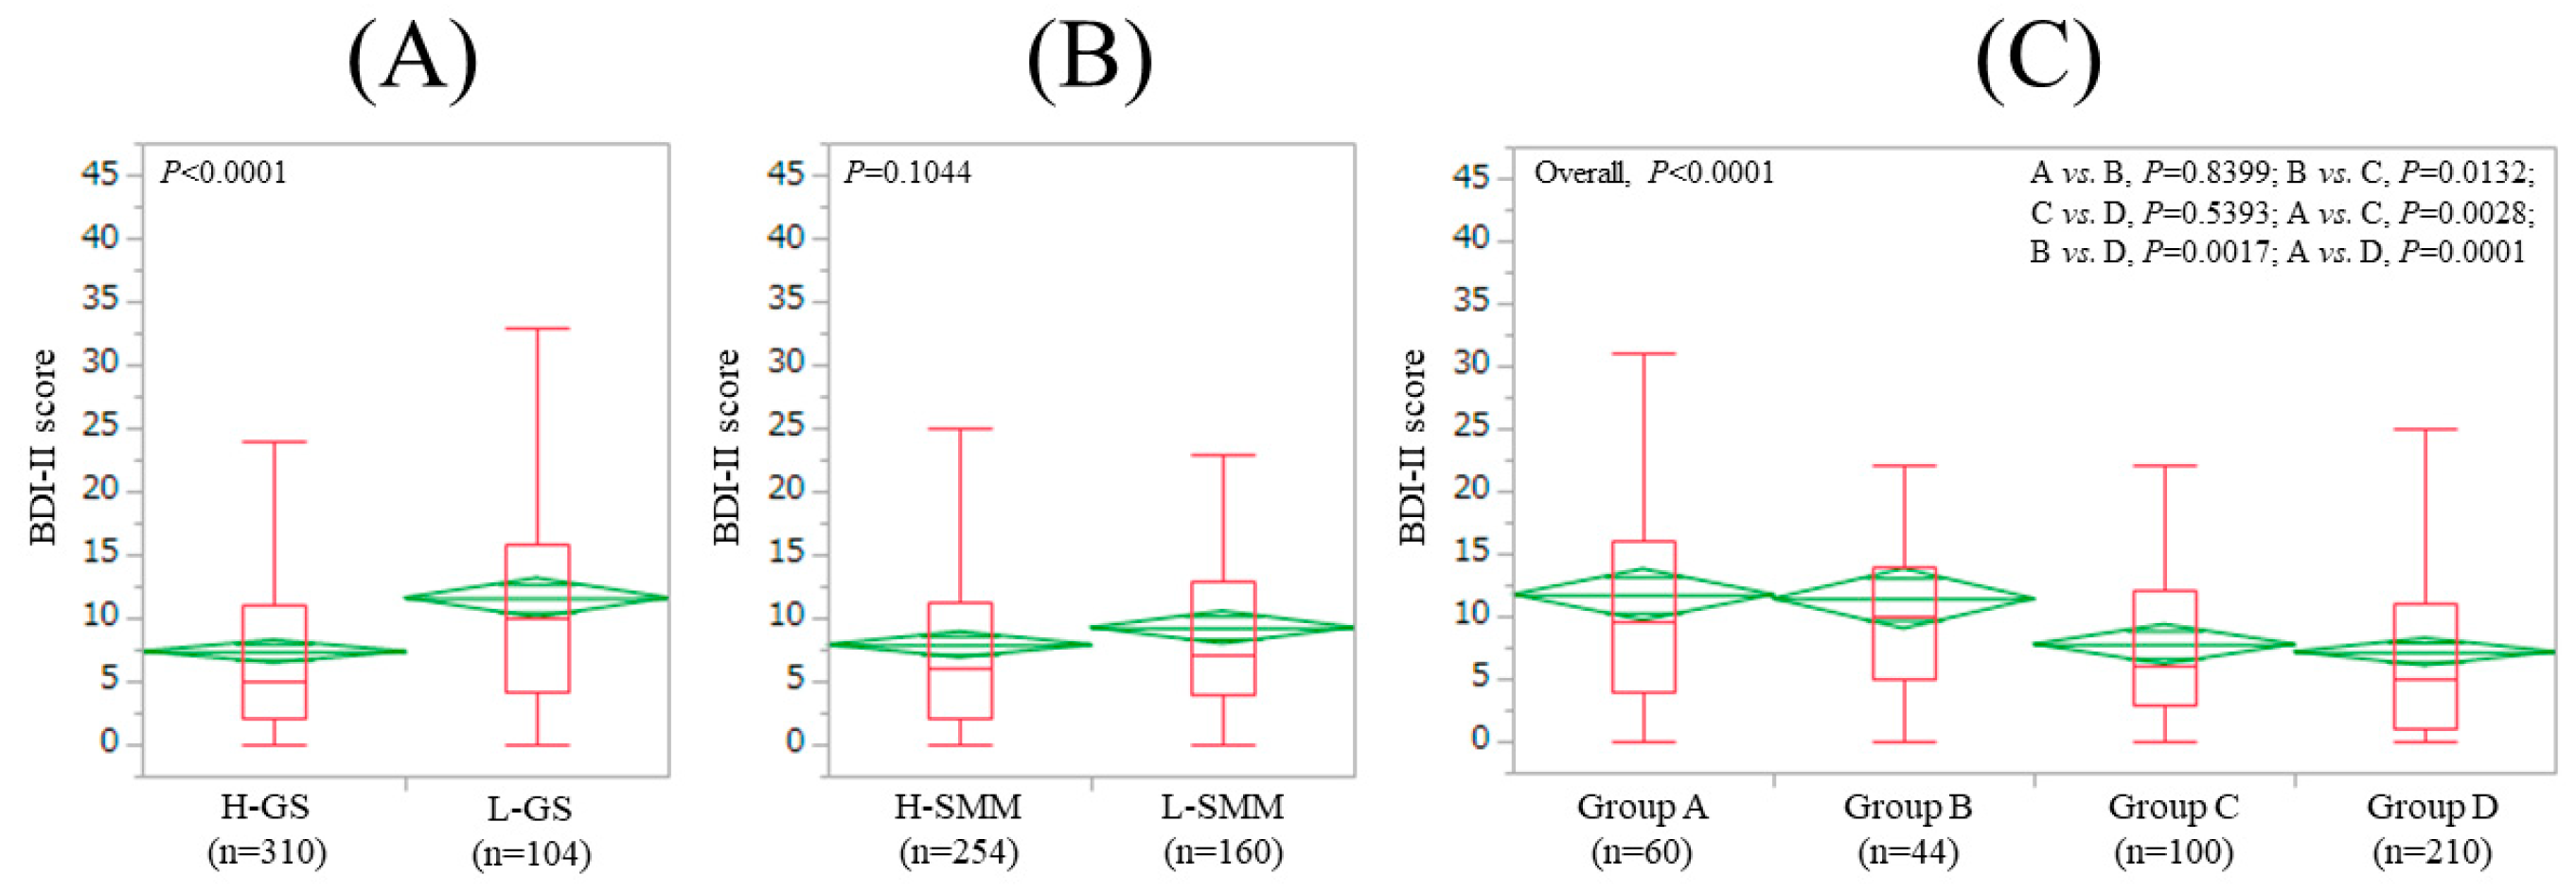
3.2. Impact of GS and SMM on BDI-II Score for All Cases (n = 414)

The average ± SD (IQR) BDI-II score in the L-GS (11.6 ± 9.7(4.25, 15.75), n = 104) was significantly higher than that in the H-GS (7.4 ± 7.4 (2,11), n = 310) (p < 0.0001) (Figure 1A). The average ± SD (IQR) BDI-II score in the L-SMM (9.3 ± 8.3 (4, 13), n = 160) was similar to that in the H-SMM (7.9 ± 8.2 (2, 11.25), n = 254) (p = 0.1044) (Figure 1B). In comparison among four groups, the overall difference was observed with significance (p < 0.0001) (Figure 1C).

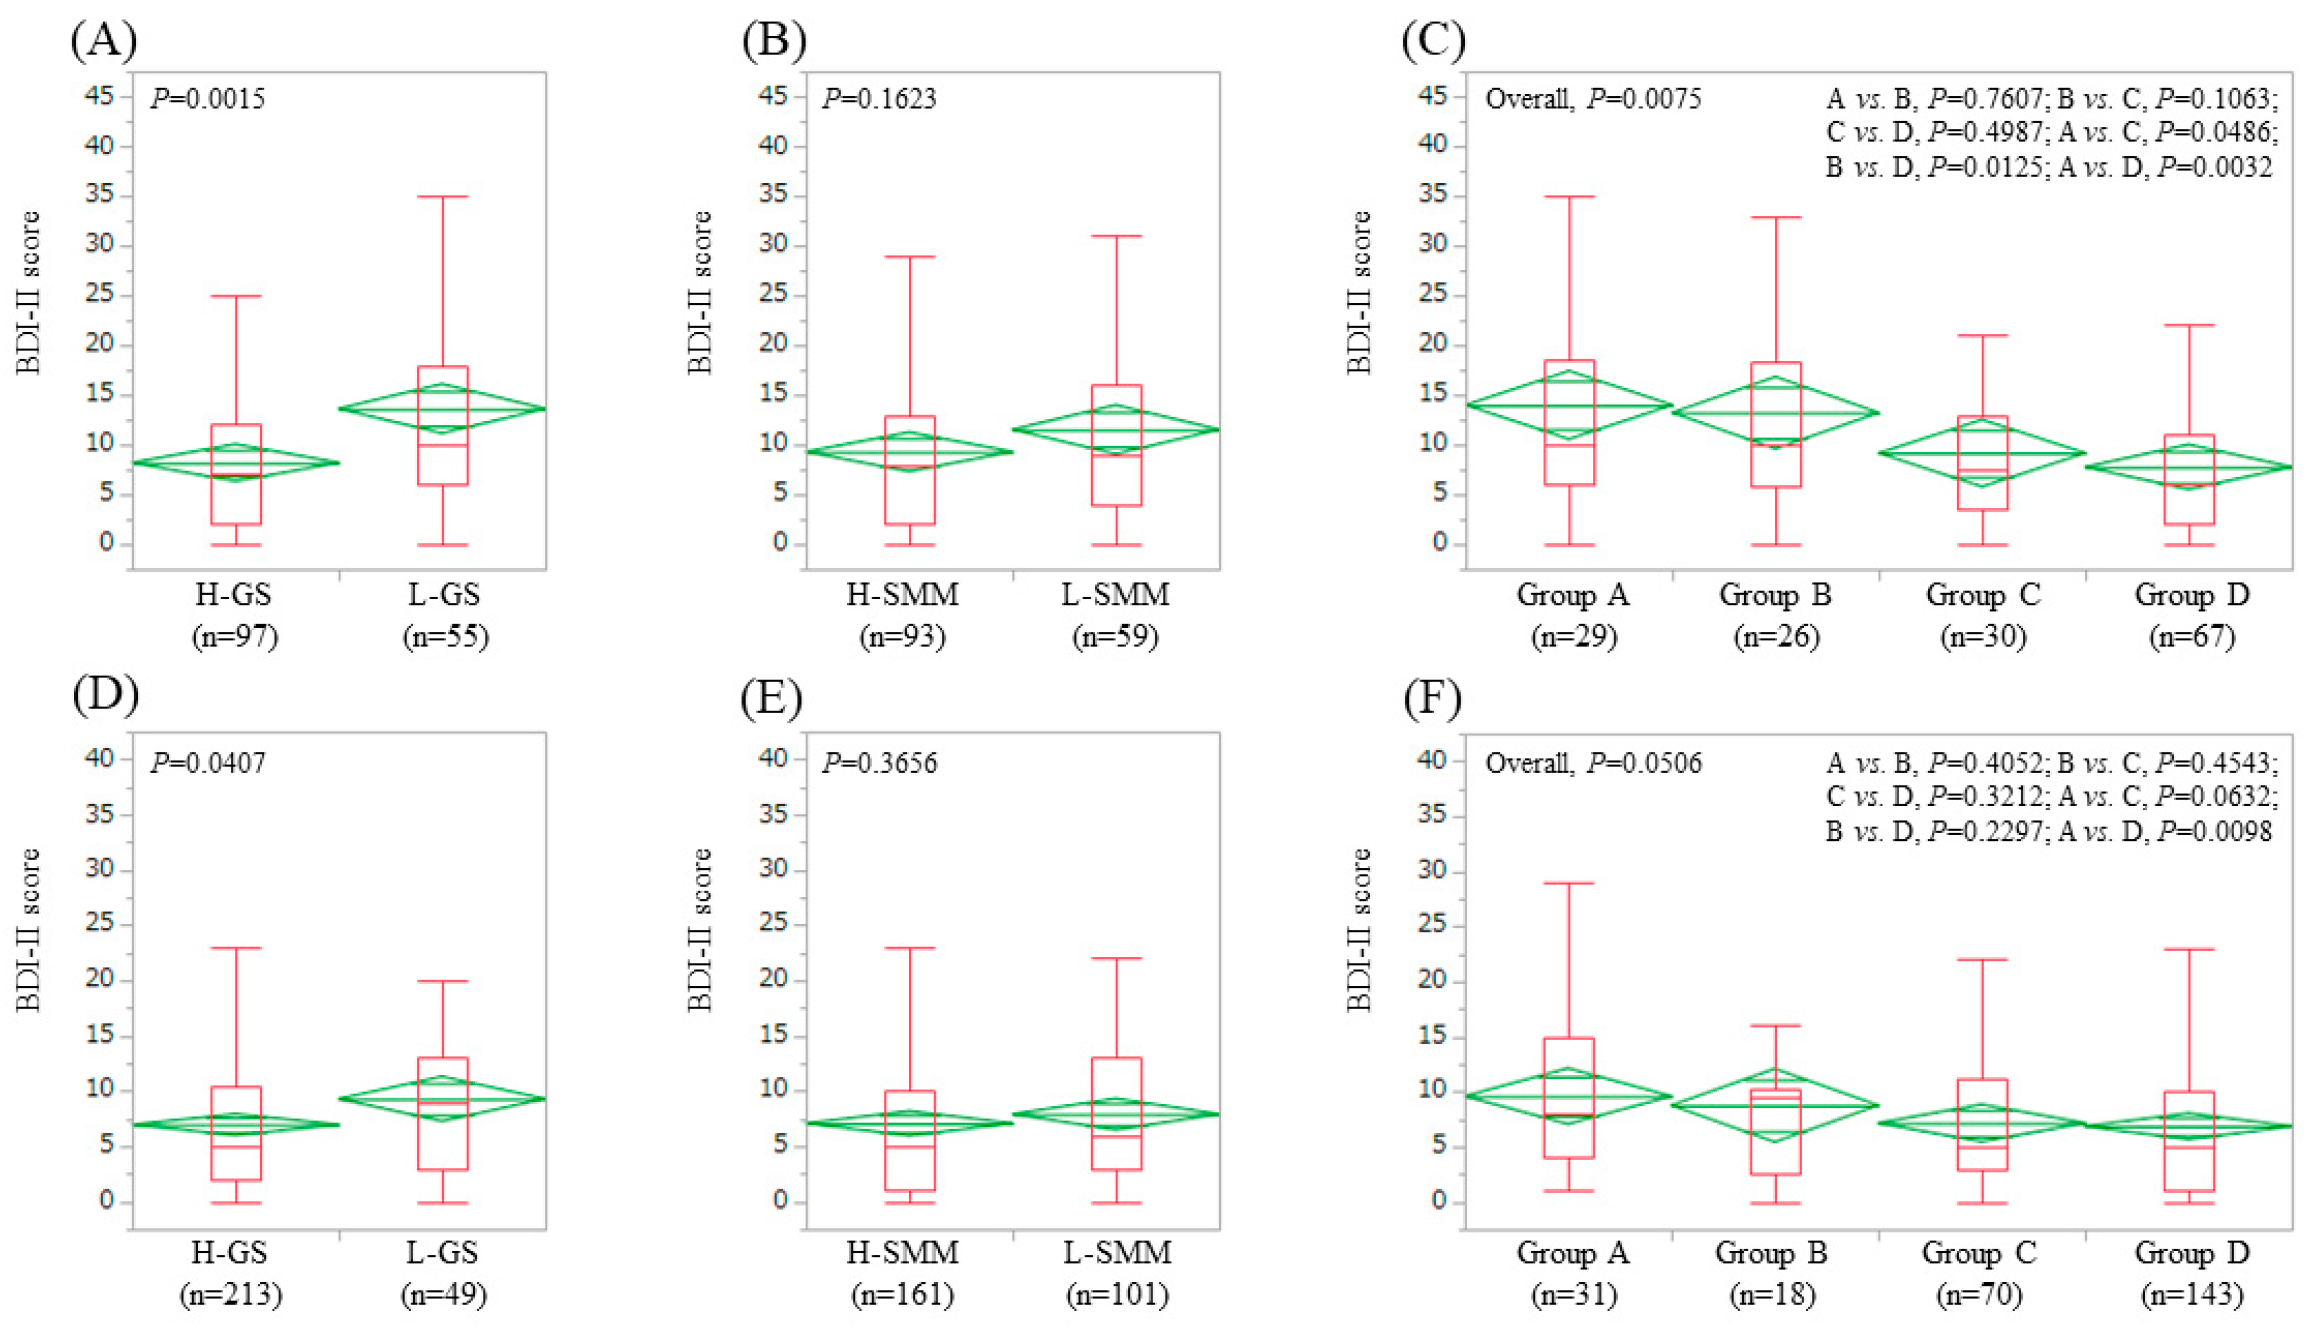
3.3. Impact of GS and SMM on BDI-II Score for LC Patients (n = 152) and Non-LC Patients (n = 262)

In LC patients, the average ± SD (IQR) BDI-II score in the L-GS (13.6 ± 11.1 (6, 18), n = 55) was significantly higher than that in the H-GS (8.2 ± 8.1 (2, 12), n = 97) (p = 0.0015) (Figure 2A). The average ± SD (IQR) BDI-II score in the L-SMM (11.5 ± 10.1 (4, 16), n = 59) was similar to that in the H-SMM (9.3 ± 9.2 (2, 13), n = 93) (p = 0.1623) (Figure 2B) In comparison among four groups, the overall difference was noted with significance (p = 0.0075) (Figure 2C).
In non-LC patients, the average ± SD (IQR) BDI-II score in the L-GS (9.3 ± 7.3 (3, 13), n = 49) was significantly higher than that in the H-GS (7.0 ± 7.1 (2, 10.5), n = 213) (p = 0.0407) (Figure 2D). The average ± SD (IQR) BDI-II score in the L-SMM (7.9 ± 6.6 (3, 13), n = 101) was identical to that in the H-SMM (7.1 ± 7.5 (1, 10), n = 161) (p = 0.3656) (Figure 2E). In comparison among four groups, the overall difference was noted with trend for significance (p = 0.0506) (Figure 2F).

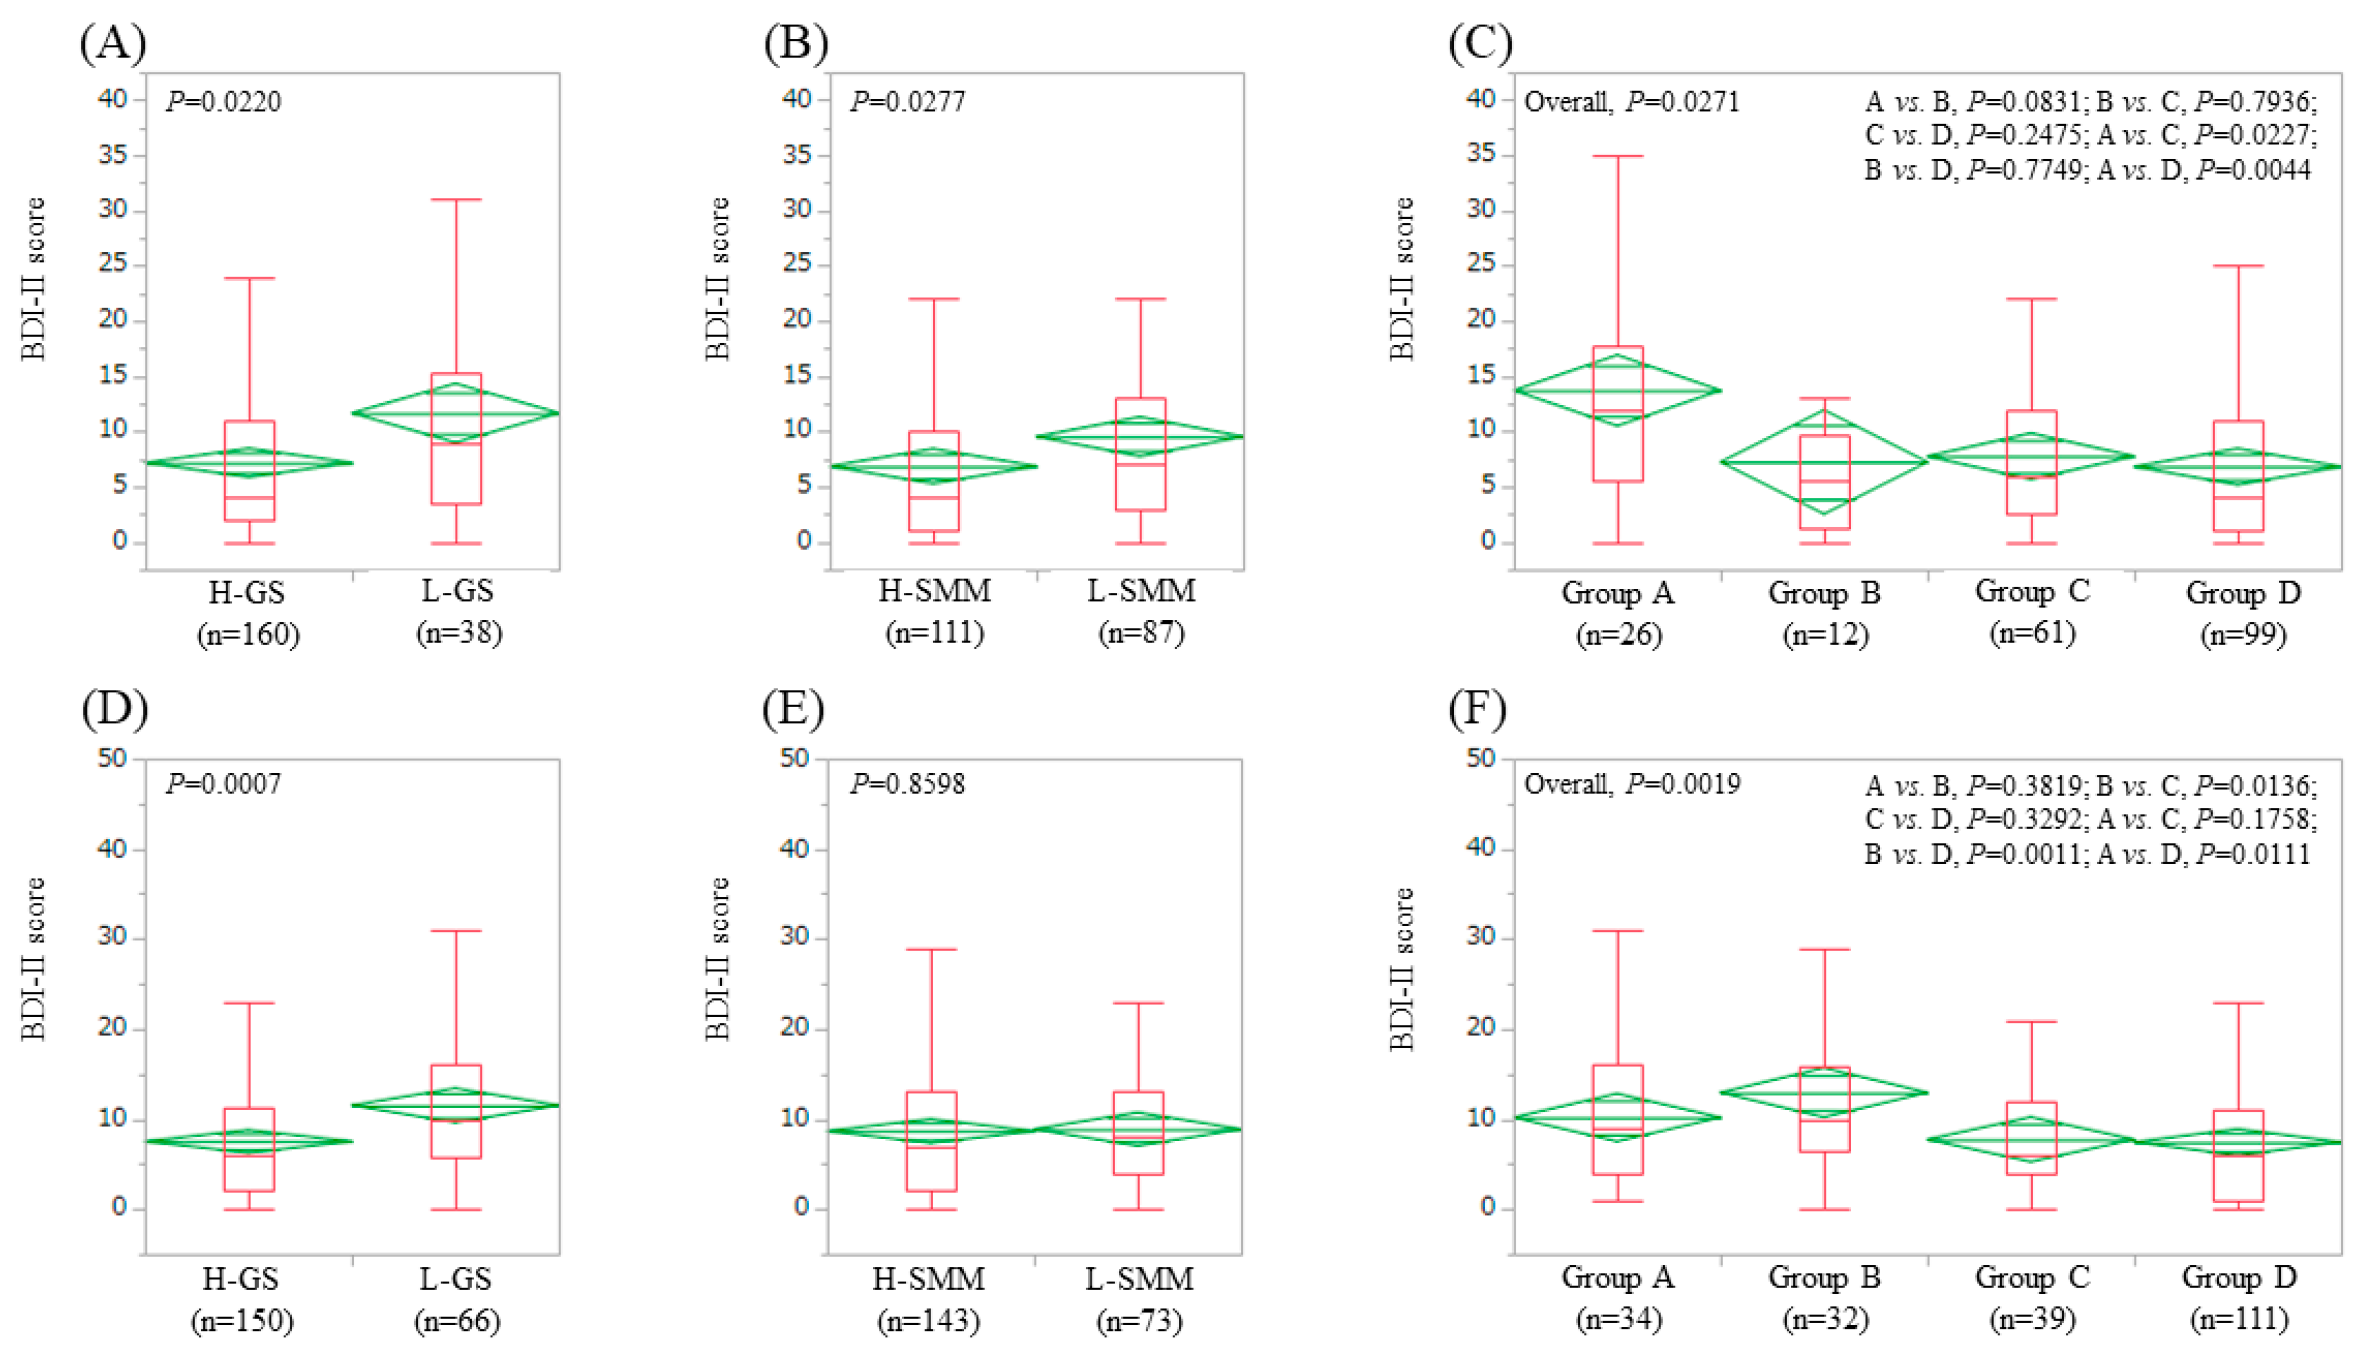
3.4. Impact of GS and SMM on BDI-II Score for Male Patients (n = 198) and Female Patients (n = 216)

In male patients, the average ± SD (IQR) BDI-II score in the L-GS (11.7 ± 11.2 (3.5, 15.25), n = 38) was significantly higher than that in the H-GS (7.2 ± 7.5 (2, 11), n = 160) (p = 0.0220) (Figure 3A). The average ± SD (IQR) BDI-II score in the L-SMM (9.6 ± 9.5 (3, 13), n = 87) was significantly higher than that in the H-SMM (6.9 ± 7.5 (1, 10), n = 111) (p = 0.0277) (Figure 3B). In comparison among four groups, the overall difference was noted with significance (p = 0.0271) (Figure 3C).
In female patients, the average ± SD (IQR) BDI-II score in the L-GS (11.5 ± 8.8 (5.75, 16), n = 66) was significantly higher than that in the H-GS (7.5 ± 7.4 (2, 11.25), n = 150) (p = 0.0007) (Figure 3D). The average ± SD (IQR) BDI-II score in the L-SMM (8.9 ± 6.5 (4, 13), n = 73) was identical to that in the H-SMM (8.7 ± 8.8 (2, 13), n = 143) (p = 0.8598) (Figure 3E). In comparison among four groups, the overall difference was noted with significance (p = 0.0019) (Figure 3F).

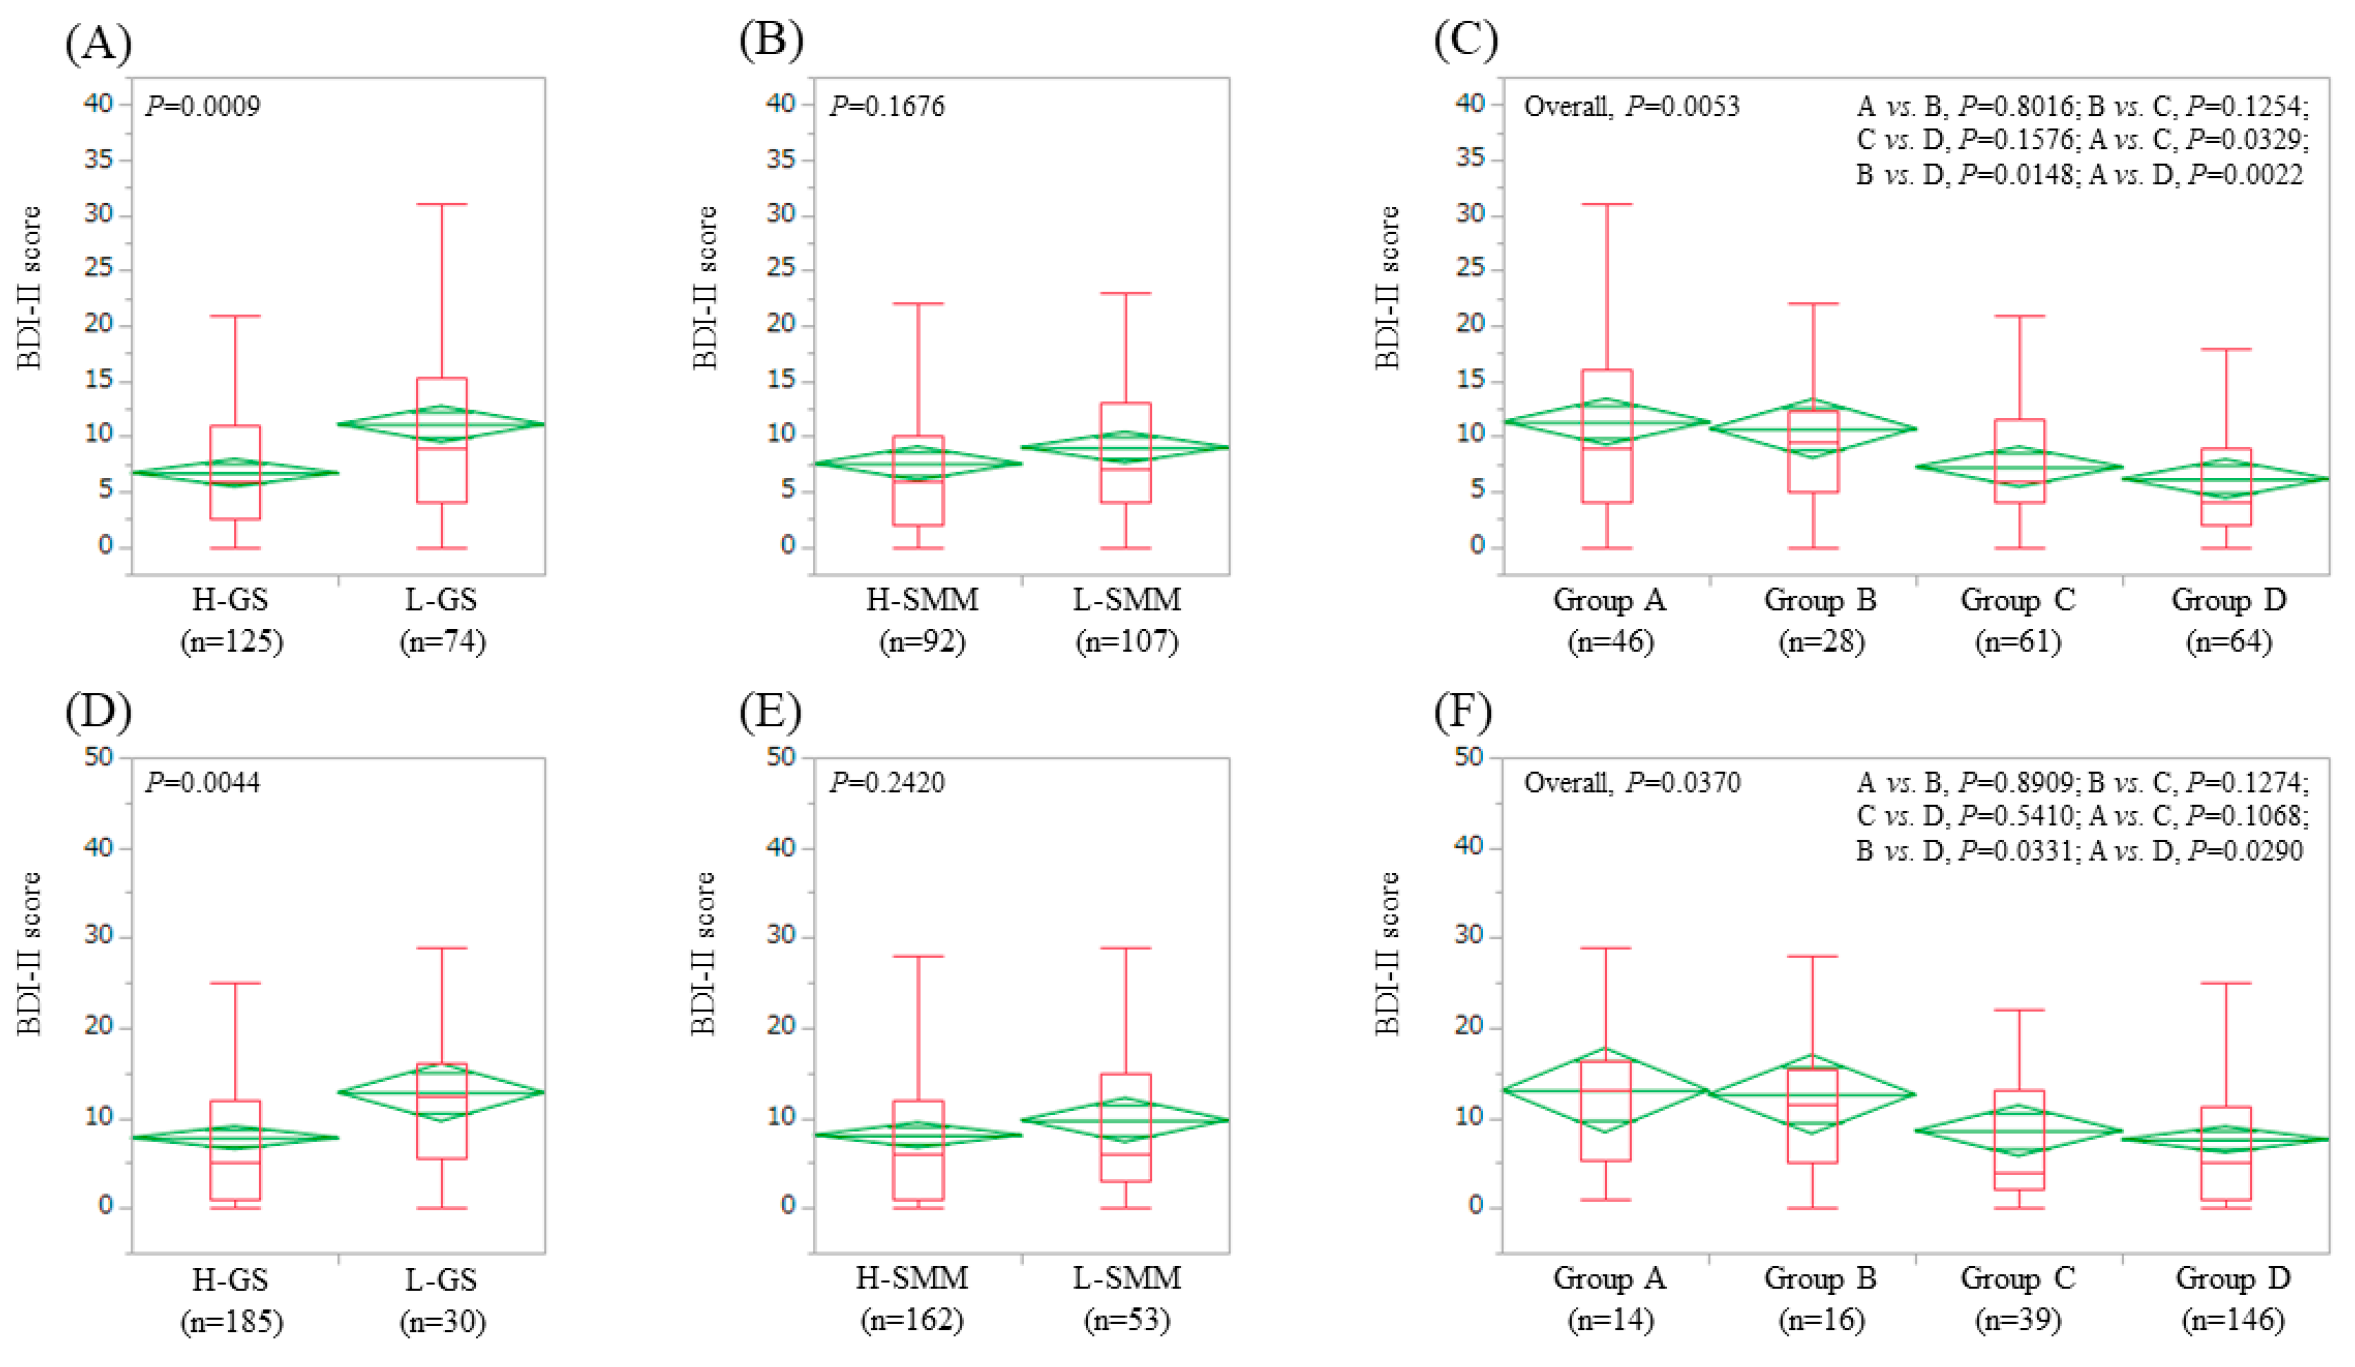
3.5. Impact of GS and SMM on BDI-II Score for Patients Aged ≥65 Years (n = 199) and Patients Aged <65 Years (n = 215)

In patients aged ≥65 years, the average ± SD (IQR) BDI-II score in the L-GS (11.1 ± 9.4 (4, 15.25), n = 74) was significantly higher than that in the H-GS (6.7 ± 5.3 (2.5, 11), n = 125) (p = 0.0009) (Figure 4A). The average ± SD (IQR) BDI-II score in the L-SMM (9.0 ± 7.7 (4, 13), n = 107) was similar to that in the H-SMM (7.5 ± 7.1 (2, 10), n = 92) (p = 0.1676) (Figure 4B). In comparison among four groups, the overall difference was noted with significance (p = 0.0053) (Figure 4C)
In patients aged <65 years, the average ± SD (IQR) BDI-II score in the L-GS (12.8 ± 10.3 (5.5, 16), n = 30) was significantly higher than that in the H-GS (7.8 ± 8.6 (1, 12), n = 185) (p = 0.0044) (Figure 4D). The average ± SD (IQR) BDI-II score in the L-SMM (9.8 ± 9.4 (3, 15), n = 53) was identical to that in the H-SMM (8.1 ± 8.9 (1, 12), n = 162) (p = 0.2420) (Figure 4E). In comparison among four groups, the overall difference was noted with significance (p = 0.0370) (Figure 4F).

3.6. Univariate and Multivariate Analyses of Factors Associated with BDI-II Score ≥11

Univariate analysis identified three factors to be significantly associated with BDI-II score ≥11: our classification (groups of A, B, C and D) (p = 0.0259), serum albumin level (p = 0.0445) and the presence of LC (p = 0.0157). (Table 3) Multivariate analysis for the three factors (p < 0.05 in the univariate analyses) revealed that only group A (p = 0.0074, group D as a reference) was a significant factor linked to BDI-II score ≥11. (Table 4) Hazard ratios and 95% confidence intervals are listed in Table 3.

3.7. Correlation between BDI-II Score and GS and SMI in Male and Female

In male, GS (r = −0.0973, p = 0.1976) and SMI (r = −0.0930, p = 0.1927) did not significantly correlate with BDI-II score. In female, GS significantly correlated with BDI-II score (r = −0.194, p = 0.006), while SMI did not (r = 0.0136, p = 0.8420).

4. Discussion

The majority of CLD patients with depression remain under-diagnosed and there is growing interest for sarcopenia in CLDs. To examine the association between sarcopenia and depression in CLD patients is therefore clinically of great importance. Regarding reasons why the high prevalence of CLD patients with depression is observed, the following aspects should be considered: (a) The long-term suffering caused by CLD itself, worry about disease progression and fear of infection; (b) social pressure for studying and working; and (c) economic pressure including high cost for expected medical treatments such as antiviral therapies [5].
Our study findings revealed a significant association between sarcopenia and depression in CLD patients, independent of age, gender and LC status. These results were identical to the findings of previous longitudinal or cross-sectional studies on the association between depressive symptoms and sarcopenia. A recent prospective study (n = 691) demonstrated that the incidence of depressive symptoms increased with some chronic diseases including sarcopenia, type 2 diabetes mellitus and cardiovascular disease and SMM was the most relevant protective factor among SMM, muscle strength and physical performance [38]. A meta-analysis comprising 15 observational studies denoted that sarcopenic patients were likely to present with depressive symptoms [31]. Liver disease-related sarcopenia is a secondary sarcopenia due to chronic inflammation etc, while most previous studies on sarcopenia cover elderly persons because primary sarcopenia is a disease entity in an aging population [14,15,16,17,18]. In this respect, our study appears to be clinically of importance. On the other hand, patients with a depressive mood are likely to have daily life inactivity, which is a well-recognized cause of sarcopenia, and thus the close association between sarcopenia and depression is not so surprising [39].
Numerous studies also examined the relationship between SMM, GS, and depressive symptoms; however, the definitive conclusion has not been reached. A previous study reported that depression in elderly Koreans was closely linked to lower SMM and sarcopenia, especially in men [40]. Decline in GS was shown to be associated with a higher risk for incidence of depression [41]. Wu, et al. demonstrated that SMM and GS were both inversely associated with depressive symptoms in elderly Chinese [42]. While in our multivariate analyses, group B (L-GS and H-SMM) and group C (H-GS and L-SMM) were not significant linked to BDI-II score ≥11, although L-GS certainly affected BDI-II score reviewing Figure 1A, Figure 2A,D, Figure 3A,D and Figure 4A,D. It seems likely that at least several similar underlying mechanisms exist between sarcopenia and depressive symptoms. Regarding comparison of the effect of GS and SMM on depression, GS rather than SMM affected depression in this study. In our previous investigation, we reported that GS rather than SMM was associated with health-related QOL in CLD patients [43]. Poorer QOL can lead to daily life inactivity and subsequent depression. These observations may be linked to our current results.
Previous studies have found an increased prevalence of depressive symptoms in patients with metabolic disorders [44,45,46]. Depression is twice as frequent in diabetic patients compared with non-diabetic patients [46]. Psychiatric conditions are characterized by an increased risk of metabolic syndrome including dyslipidemia, obesity, hypertension, and hyperglycemia [45]. However, in our data, metabolic parameters such as HbA1c, BMI, and total cholesterol level were not significant factors associated with BDI-II ≥11. When the cutoff levels of BDI-II scores were set to a higher score (21 points or 31 points), similar results were obtained. In CLD patients, liver disease itself rather than metabolic disorders may affect depressive state.
LC places a substantial psychological burden. In our analysis, presence of LC was a significant factor related to BDI-II ≥11 in the univariate analysis, although did not reach significance in the multivariate analysis (p = 0.1101). As mentioned earlier, impact of psychological distress on LC patients is not given full attention in current practice guidelines [1]. Not only LC-related complications such as varices, ascites and hepatocellular carcinoma, but also psychological disorders should be emphasized in LC patients. Clinicians are encouraged to pay more attention to the psychological status of LC patients in their filed practice.
A previous Japanese study reported that in elderly functionally-independent and community-dwelling 1731 persons, sarcopenic obesity was closely linked to depression whereas either sarcopenia or obesity alone was not linked depression [47]. Sarcopenic obesity can be an adverse predictor for CLD patients [48]. While in our study, there were no sarcopenic obesity patients. To clarify whether sarcopenic obesity is associated with depression in CLD patients, further study is needed.
The BDI-II score in patients with undetectable HCV-RNA at baseline was significantly lower than that in patients without undetectable HCV-RNA in our current analysis. A sense of relief for the HCV being eradicated may be attributed to our results. On the other hand, eGFR was not significant in our univariate analysis. A recent study demonstrated that sarcopenia was associated with age and physical capacity, but not with eGFR or dietary intakes in chronic kidney disease patients [49]. While sarcopenia can be linked to depression in our data. Their reports may be associated with our results.
We acknowledge several limitations to this study. First, our study was a single-center cross-sectional study with a retrospective nature. Second, BDI-II is a patient-reported subjective assessment method for depression and objective assessment was not done in this study. Third, GS can vary depending on patient daily life activities. Fourth, patients with massive ascites or overt hepatic encephalopathy who are potentially involved in liver disease-related sarcopenia were excluded due to the lack of reliability in BIA or patient-reported questionnaire, leading to bias. Lindqvist, et al. reported that dual-energy x-ray absorptiometry and computed tomography are useful for the calculation of muscle mass in CLD patients with pretransplant status irrespective of the presence of ascites [50]. Further studies using other alternative methods for muscle mass should be therefore performed. Fifth, clinical information for concomitant drug use, alcohol intake or social situation that can be associated with depression in each patient was not sufficient in the current analysis. Finally, it was unclear as to whether sarcopenia caused depression or vice versa in our study. Caution should be therefore exercised for the interpretation of our data. Nevertheless, our study results demonstrated that sarcopenia in CLDs was closely associated with depression. In conclusion, sarcopenia can be an independent predictor for depression in patients with CLDs.

Author Contributions

Conceptualization, H.N.; Data curation, H.N., K.Y., Y.I., Y.S., K.K., N.I. (Naoto Ikeda), T.T., N.A., R.T., K.H., N.I. (Noriko Ishii), Y.Y., T.N. and H.I.; Supervision, S.N.; Writing—original draft, H.N.; Writing—review & editing, H.N. and H.E.

Acknowledgments

The authors gratefully thank all medical staff in our nutritional guidance room for their help with data collection. The current work was partly granted by Hyogo Innovative Challenge, Hyogo College of Medicine, Japan.

Conflicts of Interest

None of the authors has any conflicts of interest to declare.

Abbreviation

CLD; chronic liver disease, QOL; quality of life, LC; liver cirrhosis, BDI-II; Beck Depression Inventory-2nd edition, SMM; skeletal muscle mass, JSH; Japanese Society of Hepatology, GS; grip strength, BIA; bioimpedance analysis, SMI; skeletal muscle mass index, L-GS; lower grip strength, H-GS; higher grip strength, L-SMM; lower skeletal muscle mass, H-SMM; higher skeletal muscle mass, SD; standard deviation, IQR; interquartile range, HCV; hepatitis C virus, HBV; hepatitis B virus.

References

  1. Buganza-Torio, E.; Mitchell, N.; Abraldes, J.G.; Thomas, L.; Ma, M.; Bailey, R.J.; Tandon, P. Depression in cirrhosis—A prospective evaluation of the prevalence, predictors and development of a screening nomogram. Aliment. Pharmacol. Ther. 2018, 49, 194–201. [Google Scholar] [CrossRef] [PubMed]
  2. Peng, J.K.; Hepgul, N.; Higginson, I.J.; Gao, W. Symptom prevalence and quality of life of patients with end-stage liver disease: A systematic review and meta-analysis. Palliat. Med. 2018, 33, 24–36. [Google Scholar] [CrossRef] [PubMed]
  3. Yeoh, S.W.; Holmes, A.C.N.; Saling, M.M.; Everall, I.P.; Nicoll, A.J. Depression, fatigue and neurocognitive deficits in chronic hepatitis C. Hepatol. Int. 2018, 12, 294–304. [Google Scholar] [CrossRef]
  4. Adinolfi, L.E.; Nevola, R.; Rinaldi, L.; Romano, C.; Giordano, M. Chronic Hepatitis C Virus Infection and Depression. Clin. Liver Dis. 2017, 21, 517–534. [Google Scholar] [CrossRef]
  5. Huang, X.; Liu, X.; Yu, Y. Depression and Chronic Liver Diseases: Are There Shared Underlying Mechanisms? Front. Mol. Neurosci. 2017, 10, 134. [Google Scholar] [CrossRef]
  6. Khanna, A.; Leighton, J.; Lee, W.L.; Jones, D.E. Symptoms of PBC—Pathophysiology and management. Best Pract. Res. Clin. Gastroenterol. 2018, 34–35, 41–47. [Google Scholar] [CrossRef]
  7. Dirks, M.; Haag, K.; Pflugrad, H.; Tryc, A.B.; Schuppner, R.; Wedemeyer, H.; Potthoff, A.; Tillmann, H.L.; Sandorski, K.; Worthmann, H.; et al. Neuropsychiatric symptoms in hepatitis C patients resemble those of patients with autoimmune liver disease but are different from those in hepatitis B patients. J. Viral Hepat. 2018, 26, 422–431. [Google Scholar] [CrossRef]
  8. Schramm, C.; Wahl, I.; Weiler-Normann, C.; Voigt, K.; Wiegard, C.; Glaubke, C.; Brähler, E.; Löwe, B.; Lohse, A.W.; Rose, M. Health-related quality of life, depression, and anxiety in patients with autoimmune hepatitis. J. Hepatol. 2014, 60, 618–624. [Google Scholar] [CrossRef]
  9. Adinolfi, L.E.; Nevola, R.; Lus, G.; Restivo, L.; Guerrera, B.; Romano, C.; Zampino, R.; Rinaldi, L.; Sellitto, A.; Giordano, M.; et al. Chronic hepatitis C virus infection and neurological and psychiatric disorders: An overview. World J. Gastroenterol. 2015, 21, 2269–2280. [Google Scholar] [CrossRef] [PubMed]
  10. Younossi, Z.; Henry, L. The impact of the new antiviral regimens on patient reported outcomes and health economics of patients with chronic hepatitis C. Dig. Liver Dis. 2014, 46, S186–S196. [Google Scholar] [CrossRef] [PubMed] [Green Version]
  11. Von Glischinski, M.; von Brachel, R.; Hirschfeld, G. How depressed is “depressed”? A systematic review and diagnostic meta-analysis of optimal cut points for the Beck Depression Inventory revised (BDI-II). Qual. Life Res. 2019, 28, 1111–1118. [Google Scholar] [CrossRef] [PubMed]
  12. Ohashi, K.; Ishikawa, T.; Hoshi, A.; Suzuki, M.; Mitobe, Y.; Yamada, E.; Abeywickrama, H.M.; Seki, N.; Koyama, C.; Aoki, H.; et al. Relationship Between Sarcopenia and Both Physical Activity and Lifestyle in Patients With Chronic Liver Disease. J. Clin. Med. Res. 2018, 10, 920–927. [Google Scholar] [CrossRef]
  13. Hayashi, M.; Abe, K.; Fujita, M.; Okai, K.; Takahashi, A.; Ohira, H. Association between sarcopenia and osteoporosis in chronic liver disease. Hepatol. Res. 2018, 48, 893–904. [Google Scholar] [CrossRef]
  14. Nishikawa, H.; Shiraki, M.; Hiramatsu, A.; Moriya, K.; Hino, K.; Nishiguchi, S. Japan Society of Hepatology guidelines for sarcopenia in liver disease (1st edition): Recommendation from the working group for creation of sarcopenia assessment criteria. Hepatol. Res. 2016, 46, 951–963. [Google Scholar] [CrossRef] [PubMed]
  15. Montano-Loza, A.J. Clinical relevance of sarcopenia in patients with cirrhosis. World J. Gastroenterol. 2014, 20, 8061–8071. [Google Scholar] [CrossRef]
  16. Cruz-Jentoft, A.J.; Landi, F.; Schneider, S.M.; Zúñiga, C.; Arai, H.; Boirie, Y.; Chen, L.K.; Fielding, R.A.; Martin, F.C.; Michel, J.P.; et al. Prevalence of and interventions for sarcopenia in ageing adults: A systematic review. Report of the International Sarcopenia Initiative (EWGSOP and IWGS). Age Ageing 2014, 43, 748–759. [Google Scholar] [CrossRef]
  17. Sinclair, M.; Gow, P.J.; Grossmann, M.; Angus, P.W. Review article: Sarcopenia in cirrhosis-aetiology, implications and potential therapeutic interventions. Aliment. Pharmacol. Ther. 2016, 43, 765–777. [Google Scholar] [CrossRef]
  18. Chen, L.K.; Liu, L.K.; Woo, J.; Assantachai, P.; Auyeung, T.W.; Bahyah, K.S.; Chou, M.Y.; Chen, L.Y.; Hsu, P.S.; Krairit, O.; et al. Sarcopenia in Asia: Consensus Report of the Asian Working Group for Sarcopenia. J. Am. Med. Dir. Assoc. 2014, 15, 95–101. [Google Scholar] [CrossRef] [PubMed]
  19. Nishikawa, H.; Enomoto, H.; Ishii, A.; Iwata, Y.; Miyamoto, Y.; Ishii, N.; Yuri, Y.; Hasegawa, K.; Nakano, C.; Nishimura, T.; et al. Elevated serum myostatin level is associated with worse survival in patients with liver cirrhosis. J. Cachexia Sarcopenia Muscle 2017, 8, 915–925. [Google Scholar] [CrossRef]
  20. Norman, K.; Otten, L. Financial impact of sarcopenia or low muscle mass—A short review. Clin. Nutr. 2018, in press. [Google Scholar] [CrossRef]
  21. Kamo, N.; Kaido, T.; Hamaguchi, Y.; Okumura, S.; Kobayashi, A.; Shirai, H.; Yao, S.; Yagi, S.; Uemoto, S. Impact of sarcopenic obesity on outcomes in patients undergoing living donor liver transplantation. Clin. Nutr. 2018, in press. [Google Scholar] [CrossRef] [PubMed]
  22. De Bandt, J.P.; Jegatheesan, P.; Tennoune-El-Hafaia, N. Muscle Loss in Chronic Liver Diseases: The Example of Nonalcoholic Liver Disease. Nutrients 2018, 10, 1195. [Google Scholar] [CrossRef]
  23. Chang, K.V.; Chen, J.D.; Wu, W.T.; Huang, K.C.; Hsu, C.T.; Han, D.S. Association between Loss of Skeletal Muscle Mass and Mortality and Tumor Recurrence in Hepatocellular Carcinoma: A Systematic Review and Meta-Analysis. Liver Cancer 2018, 7, 90–103. [Google Scholar] [CrossRef] [PubMed]
  24. Anderson, L.J.; Liu, H.; Garcia, J.M. Sex Differences in Muscle Wasting. Adv. Exp. Med. Biol. 2017, 1043, 153–197. [Google Scholar]
  25. Yoo, S.Z.; No, M.H.; Heo, J.W.; Park, D.H.; Kang, J.H.; Kim, S.H.; Kwak, H.B. Role of exercise in age-related sarcopenia. J. Exerc. Rehabil. 2018, 14, 551–558. [Google Scholar] [CrossRef]
  26. Budui, S.L.; Rossi, A.P.; Zamboni, M. The pathogenetic bases of sarcopenia. Clin. Cases Miner. Bone Metab. 2015, 12, 22–26. [Google Scholar]
  27. Szlejf, C.; Suemoto, C.K.; Brunoni, A.R.; Viana, M.C.; Moreno, A.B.; Matos, S.M.A.; Lotufo, P.A.; Benseñor, I.M. Depression is Associated With Sarcopenia Due to Low Muscle Strength: Results From the ELSA-Brasil Study. J. Am. Med. Dir. Assoc. 2018, in press. [Google Scholar] [CrossRef] [PubMed]
  28. Brooks, J.M.; Titus, A.J.; Bruce, M.L.; Orzechowski, N.M.; Mackenzie, T.A.; Bartels, S.J.; Batsis, J.A. Depression and Handgrip Strength Among U.S. Adults Aged 60 Years and Older from NHANES 2011–2014. J. Nutr. Health Aging 2018, 22, 938–943. [Google Scholar] [CrossRef] [PubMed]
  29. Wang, H.; Hai, S.; Liu, Y.; Cao, L.; Liu, Y.; Liu, P.; Zhou, J.; Yang, Y.; Dong, B. Association between depressive symptoms and sarcopenia in older Chinese community-dwelling individuals. Clin. Interv. Aging 2018, 13, 1605–1611. [Google Scholar] [CrossRef]
  30. Jeong, H.K.; Dong, H.K.; Yong, S.P. Body Composition, Sarcopenia, and Suicidal Ideation in Elderly Koreans: Hallym Aging Study. J. Korean Med. Sci. 2016, 31, 604–610. [Google Scholar] [Green Version]
  31. Chang, K.V.; Hsu, T.H.; Wu, W.T.; Huang, K.C.; Han, D.S. Is sarcopenia associated with depression? A systematic review and meta-analysis of observational studies. Age Ageing 2017, 46, 738–746. [Google Scholar] [CrossRef]
  32. Wu, M.K.; Hsu, L.W.; Huang, K.T.; Lin, C.C.; Wang, C.C.; Lin, T.L.; Li, W.F.; Goto, S.; Chen, C.L.; Chen, C.C. Assessment of relevant factors with respect to psychosocial properties in potential living donor candidates before liver transplantation. Neuropsychiatr. Dis. Treat. 2018, 14, 1999–2005. [Google Scholar] [CrossRef]
  33. Beck, A.T.; Ward, C.H.; Mendelson, M.; Mock, J.; Erbaugh, J. An inventory for measuring depression. Arch. Gen. Psychiatry 1961, 4, 561–571. [Google Scholar] [CrossRef]
  34. Jay, C.L.; Butt, Z.; Ladner, D.P.; Skaro, A.I.; Abecassis, M.M. A review of quality of life instruments used in liver transplantation. J. Hepatol. 2009, 51, 949–959. [Google Scholar] [CrossRef] [Green Version]
  35. Konno, S.; Oda, N.; Ochiai, T.; Alev, L. Randomized, Double-blind, Placebo-controlled Phase II(IQR)Trial of Duloxetine Monotherapy in Japanese Patients With Chronic Low Back Pain. Spine (Phila Pa 1976) 2016, 41, 1709–1717. [Google Scholar] [CrossRef] [PubMed]
  36. Matsunami, K.; Nishida, N.; Kaneko, N.; Ikeo, K.; Toyo-Oka, L.; Takeuchi, H.; Matsuura, K.; Tamori, A.; Nomura, H.; Yoshiji, H.; et al. Genome-Wide Association Study Identifies ZNF354C Variants Associated with Depression from Interferon-Based Therapy for Chronic Hepatitis C. PLoS ONE 2016, 11, e0164418. [Google Scholar] [CrossRef] [PubMed]
  37. Kawase, K.; Kondo, K.; Saito, T.; Shimasaki, A.; Takahashi, A.; Kamatani, Y.; Kawabe, N.; Hashimoto, S.; Ikeda, M.; Kubo, M.; et al. Risk factors and clinical characteristics of the depressive state induced by pegylated interferon therapy in patients with hepatitis C virus infection: A prospective study. Psychiatry Clin. Neurosci. 2016, 70, 489–497. [Google Scholar] [CrossRef] [Green Version]
  38. Chen, X.; Guo, J.; Han, P.; Fu, L.; Jia, L.; Yu, H.; Yu, X.; Hou, L.; Wang, L.; Zhang, W.; et al. Twelve-Month Incidence of Depressive Symptoms in Suburb-Dwelling Chinese Older Adults: Role of Sarcopenia. J. Am. Med. Dir. Assoc. 2018, 20, 64–69. [Google Scholar] [CrossRef]
  39. Hallgren, M.; Herring, M.P.; Owen, N.; Dunstan, D.; Ekblom, Ö.; Helgadottir, B.; Nakitanda, O.A.; Forsell, Y. Exercise, physical activity, and sedentary behavior in the treatment of depression: Broadening the scientific perspectives and clinical opportunities. Front. Psychiatry 2016, 7, 36. [Google Scholar] [CrossRef]
  40. Kim, N.H.; Kim, H.S.; Eun, C.R.; Seo, J.A.; Cho, H.J.; Kim, S.G.; Choi, K.M.; Baik, S.H.; Choi, D.S.; Park, M.H.; et al. Depression is associated with sarcopenia, not central obesity, in elderly korean men. J. Am. Geriatr. Soc. 2011, 59, 2062–2068. [Google Scholar] [CrossRef]
  41. Fukumori, N.; Yamamoto, Y.; Takegami, M.; Yamazaki, S.; Onishi, Y.; Sekiguchi, M.; Otani, K.; Konno, S.; Kikuchi, S.; Fukuhara, S. Association between hand-grip strength and depressive symptoms: Locomotive syndrome and health outcomes in Aizu Cohort Study (LOHAS). Age Ageing 2015, 44, 592–598. [Google Scholar] [CrossRef] [PubMed]
  42. Wu, H.; Yu, B.; Meng, G.; Liu, F.; Guo, Q.; Wang, J.; Du, H.; Zhang, W.; Shen, S.; Han, P.; et al. Both muscle mass and muscle strength are inversely associated with depressive symptoms in an elderly Chinese population. Int. J. Geriatr. Psychiatry 2017, 32, 769–778. [Google Scholar] [CrossRef] [PubMed]
  43. Nishikawa, H.; Enomoto, H.; Yoh, K.; Iwata, Y.; Sakai, Y.; Kishino, K.; Ikeda, N.; Takashima, T.; Aizawa, N.; Takata, R.; et al. Health-Related Quality of Life in Chronic Liver Diseases: A Strong Impact of Hand Grip Strength. J. Clin. Med. 2018, 7, 553. [Google Scholar] [CrossRef]
  44. Sartorius, N. Depression and diabetes. Dialogues Clin. Neurosci. 2018, 20, 47–52. [Google Scholar] [PubMed]
  45. Horne, R.; Foster, J.A. Metabolic and Microbiota Measures as Peripheral Biomarkers in Major Depressive Disorder. Front. Psychiatry 2018, 9, 513. [Google Scholar] [CrossRef]
  46. Penninx, B.W.J.H.; Lange, S.M.M. Metabolic syndrome in psychiatric patients: Overview, mechanisms, and implications. Dialogues Clin. Neurosci. 2018, 20, 63–73. [Google Scholar]
  47. Ishii, S.; Chang, C.; Tanaka, T.; Kuroda, A.; Tsuji, T.; Akishita, M.; Iijima, K. The Association between Sarcopenic Obesity and Depressive Symptoms in Older Japanese Adults. PLoS ONE 2016, 11, e0162898. [Google Scholar] [CrossRef]
  48. Schiavo, L.; Busetto, L.; Cesaretti, M.; Zelber-Sagi, S.; Deutsch, L.; Iannelli, A. Nutritional issues in patients with obesity and cirrhosis. World J. Gastroenterol. 2018, 24, 3330–3346. [Google Scholar] [CrossRef]
  49. D’Alessandro, C.; Piccoli, G.B.; Barsotti, M.; Tassi, S.; Giannese, D.; Morganti, R.; Cupisti, A. Prevalence and Correlates of Sarcopenia among Elderly CKD Outpatients on Tertiary Care. Nutrients 2018, 10, 1951. [Google Scholar] [CrossRef]
  50. Lindqvist, C.; Brismar, T.B.; Majeed, A.; Wahlin, S. Assessment of muscle mass depletion in chronic liver disease: Dual-energy x-ray absorptiometry compared with computed tomography. Nutrition 2019, 61, 93–98. [Google Scholar] [CrossRef]
Figure 1. BDI-II score stratified by GS and SMM for all cases (n = 414). (A) Lower GS (L-GS) vs. Higher GS (H-GS). (B) Lower SMM (L-SMM) vs. Higher SMM (H-SMM). (C) Comparison among four groups (group A, B, C, and D). Group A indicates L-GS and L-SMM. Group B indicates L-GS and H-SMM. Group C indicates H-GS and L-SMM. Group D indicates H-GS and H-SMM.
Jcm 08 00634 g001
Figure 2. BDI-II score stratified by GS and SMM for LC cases (n = 152). (A) Lower GS (L-GS) vs. Higher GS (H-GS). (B) Lower SMM (L-SMM) vs. Higher SMM (H-SMM). (C) Comparison among four types (group A, B, C and D). BDI-II score stratified by GS and SMM for non-LC cases (n = 262). (D) L-GS vs. H-GS. (E) L-SMM vs. H-SMM. (F) Comparison among four groups (group A, B, C and D). Group A indicates L-GS and L-SMM. Group B indicates L-GS and H-SMM. Group C indicates H-GS and L-SMM. Group D indicates H-GS and H-SMM.
Jcm 08 00634 g002
Figure 3. BDI-II score stratified by GS and SMM for male patients (n = 198). (A) Lower GS (L-GS) vs. Higher GS (H-GS). (B) Lower SMM (L-SMM) vs. Higher SMM (H-SMM). (C) Comparison among four types (group A, B, C and D). BDI-II score stratified by GS and SMM for female patients (n = 216). (D) L-GS vs. H-GS. (E) L-SMM vs. H-SMM. (F) Comparison among four groups (group A, B, C and D). Group A indicates L-GS and L-SMM. Group B indicates L-GS and H-SMM. Group C indicates H-GS and L-SMM. Group D indicates H-GS and H-SMM.
Jcm 08 00634 g003
Figure 4. BDI-II score stratified by GS and SMM for patients >65 years (n = 199). (A) Lower GS (L-GS) vs. Higher GS (H-GS). (B) Lower SMM (L-SMM) vs. Higher SMM (H-SMM). (C) Comparison among four types (group A, B, C and D). BDI-II score stratified by GS and SMM for patients <65 years (n = 215). (D) L-GS vs. H-GS. (E) L-SMM vs. H-SMM. (F) Comparison among four groups (group A, B, C and D). Group A indicates L-GS and L-SMM. Group B indicates L-GS and H-SMM. Group C indicates H-GS and L-SMM. Group D indicates H-GS and H-SMM.
Jcm 08 00634 g004
Table 1. Cut-off values of bioimpedance analysis and grip strength according to gender.
ModalityCut-off Value
Bioimpedance analysisMale: 7.0 kg/m²
Female: 5.7 kg/m²
Grip strengthMale: 26 kg
Female: 18 kg
Table 2. Baseline characteristics.
VariablesAll Cases
(n = 414)
Group A
(n = 60)
Group B
(n = 44)
Group C
(n = 100)
Group D
(n = 210)
Overall p Value
Age (years)61.5 ± 12.7 (52, 71)68.3 ± 12.2 (65, 75)65.9 ± 10.7 (63, 73)64.6 ± 12.2 (60, 72)57.1 ± 11.8 (48, 66)<0.0001
Gender, male/female198/21626/3412/3261/3999/1110.0019
HBV/HCV/HBV and HCV/NBNC (Etiology)61/257/8/885/41/2/127/27/0/1015/67/3/1534/122/3/510.4858
Presence of LC, yes/no152/26229/3126/1830/7067/1430.0007
Body mass index (kg/m2)23.3 ± 3.8 (20.6, 25.5)21.2 ± 2.2 (19.8, 22.7)25.8 ± 3.8 (22.9, 28.8)20.8 ± 2.5 (19.0, 22.1)24.6 ± 3.8 (21.9, 26.7)<0.0001
Total bilirubin (mg/dL)0.98 ± 0.60 (0.6, 1.1)0.9 ± 0.4 (0.6, 1.0)1.3 ± 0.9 (0.6, 1.7)0.9 ± 0.4 (0.7, 1.0)1.0 ± 0.6 (0.6, 1.1)0.1482
Serum albumin (g/dL)4.1 ± 0.5 (3.9, 4.5)3.9 ± 0.6 (3.5, 4.4)3.9 ± 0.6 (3.5, 4.2)4.3 ± 0.4 (4.1, 4.6)4.2 ± 0.5 (4.0, 4.5)<0.0001
Prothrombin time (%)86.4 ± 15.9 (79.3, 96.5)85.4 ± 16.6 (77.7, 94.4)77.3 ± 16.5 (62.6, 89.5)86.9 ± 16.2 (82.0, 96.3)88.4 ± 14.9 (80.2, 98.6)0.0004
Platelet count (×104/mm3)17.0 ± 7.1 (11.7, 21.2)16.6 ± 7.4 (10.4, 21.2)13.3 ± 6.7 (7.4, 17.9)16.7 ± 6.0 (12.1, 20.1)18.0 ± 7.4 (12.6, 22.5)0.0013
Total cholesterol (mg/dL)181.1 ± 41.7 (150, 207.5)177.4 ± 53.2 (143, 209)161.8 ± 38.2 (135, 186)184.1 ± 38.5 (157, 206)184.7 ± 39.3 (154, 212)0.0085
AST (IU/L)36.9 ± 26.5 (21, 42)41.4 ± 31.1 (21, 49)41.4 ± 27.0 (22, 48)35.0 ± 23.4 (22, 37)35.5 ± 26.3 (21, 40)0.2554
ALT (IU/L)36.1 ± 35.7 (16, 44)37.3 ± 43.9 (15, 42)37.7 ± 37.1 (16, 43)33.3 ± 28.4 (16, 40)36.7 ± 36.1 (16, 44)0.8485
ALP (IU/L)284.1 ± 274.2 (195, 300)377.4 ± 640.4 (206, 343)281.2 ± 110.9 (215, 314)253.1 ± 93.6 (195, 279)272.2 ± 141.8 (192, 298)0.2601
GGT (IU/L)47.3 ± 58.7 (17, 49)48.4 ± 69.6 (16, 47)54.6 ± 56.2 (21, 58)44.4 ± 54.5 (17, 46)46.8 ± 58.1 (17, 49)0.8193
eGFR mL/min/1.73 m2)83.6 ± 21.4 (72.0, 95.5)78.6 ± 24.1 (65.8, 90.5)82.4 ± 25.5 (71, 93)81.4 ± 19.7 (71, 90)86.3 ± 20.1 (74, 99)0.0495
HbA1c (NGSP)5.8 ± 0.8 (5.4, 6.0)5.8 ± 0.8 (5.3, 6.0)5.8 ± 0.9 (5.2, 6.4)5.8 ± 0.8 (5.5, 6.0)5.8 ± 0.8 (5.4, 6.0)0.9614
Serum sodium (mmol/L)140.1 ± 2.4 (139, 142)139.6 ± 3.2 (138, 142)139.9 ± 2.8 (139, 142)140.4 ± 2.3 (140, 142)140.1 ± 2.2 (139, 141)0.1840
BDI-II score8.4 ± 8.3 (2, 13)11.7 ± 9.6 (4, 16)11.4 ± 9.9 (5, 14)7.8 ± 7.0 (3, 12)7.2 ± 7.7 (1, 11)<0.0001
Data are expressed as average ± standard deviation (interquartile range). HBV; hepatitis B virus, HCV; hepatitis C virus, NBNC; non-B and non-C, LC; liver cirrhosis, AST; aspartate aminotransferase, ALT; alanine aminotransferase, ALP; alkaline phosphatase, GGT; gamma-glutamyltransferase, eGFR; estimated glomerular filtration rate, NSGP; National Glycohemoglobin Standardization Program, BDI-II; Beck depression inventory II.
Table 3. Univariate analyses of factors linked to BDI-II score ≥11.
VariablesBDI-II Score ≥11
(n = 130)
BDI-II Score <11
(n = 284)
p Value
Age (years)60.3 ± 13.5 (50.75, 70.25)62.0 ± 12.3 (54, 71)0.2064
Gender, male/female61/69137/1570.8326
HBV/HCV/HBV and HCV/NBNC17/86/2/2544/171/6/630.7106
Body mass index (kg/m2)23.2 ± 3.9 (20.3, 25.025)23.3 ± 3.8 (20.625, 25.6)0.6580
Presence of LC, yes/no59/7193/1910.0157
Group, A/B/C/D28/16/30/5632/28/70/1540.0259
Total bilirubin (mg/dL)0.95 ± 0.55 (0.6, 1.1)0.99 ± 0.62 (0.6, 1.0)0.5333
Serum albumin (g/dL)4.05 ± 0.54 (3.8, 4.4)4.15 ± 0.52 (3.9, 4.5)0.0445
Prothrombin time (%)85.9 ± 15.8 (77.65, 96.375)86.6 ± 16.0 (79.625, 97.1)0.6875
Platelet count (×104/mm3)16.4 ± 7.0 (10.975, 20.625)17.2 ± 7.2 (11.95, 21.8)0.2924
AST (IU/L)39.5 ± 26.6 (21, 48)35.7 ± 26.4 (21, 39.75)0.1703
ALT (IU/L)39.2 ± 40.5 (16, 47.25)34.6 ± 33.2 (16, 42)0.2200
ALP (IU/L)278.7 ± 140.0 (200, 305.5)286.5 ± 317.6 (193.25, 299.75)0.7936
GGT (IU/L)52.1 ± 69.4 (21, 50)45.0 ± 52.9 (17, 49)0.2630
Total cholesterol (mg/dL)176.6 ± 39.6 (145, 204.25)183.1 ± 42.6 (151.75, 211)0.1492
eGFR (mL/min/1.73 m2)84.8 ± 20.8 (73, 96)83.0 ± 21.6 (71, 95)0.4335
Serum sodium (mmol/L)140.0 ± 2.9 (139, 142)140.1 ± 2.2 (139, 142)0.6158
HbA1c (NGSP)5.8 ± 0.8 (5.3, 6.0)5.8 ± 0.8 (5.4, 6.075)0.8769
Data are expressed as average ± standard deviation (interquartile range). BDI-II; Beck depression inventory II, HBV; hepatitis B virus, HCV; hepatitis C virus, NBNC; non-B and non-C, LC; liver cirrhosis, AST; aspartate aminotransferase, ALT; alanine aminotransferase, ALP; alkaline phosphatase, GGT; gamma-glutamyltransferase, eGFR; estimated glomerular filtration rate, NSGP; National Glycohemoglobin Standardization Program.
Table 4. Multivariate analyses of factors linked to BDI-II score ≥11.
Multivariate Analysis
Hazard Ratio95% CIp Value
Presence of LC
Yes0.6580.394–1.0990.1101
No1.000Reference
Serum albumin (per 1.0 g/dL)1.0270.641–1.6460.910
Group
A (L-GS and L-SMM)0.4380.239–0.8010.0074
B (L-GS and H-SMM)0.7050.349–1.4230.3289
C (H-GS and L-SMM)0.8130.477–1.3850.4460
D (H-GS and H-SMM)1.000Reference
BDI-II; Beck depression inventory II, LC; liver cirrhosis, L-GS; Lower grip strength, L-SMM; Lower skeletal muscle mass, H-GS; Higher grip strength, H-SMM; Higher skeletal muscle mass, CI; confidence interval.

